Contact:
Ronald C. Schothorst
Laboratory for Food and Residue Analyses (ARO) E-mail: ronald.schothorst@rivm.nl
RIKILT report: 2005.005
*RIKILT - Institute of Food Safety
Department of Safety & Health
Cluster Databases, Risk Assessment and Supply Chain P.O. Box 230
6700 AE Wageningen The Netherlands
RIVM report 310301002/2005
Trichothecenes in baby food
RC Schothorst, HP van Egmond, A de Mul*,
PE Boon*, JD van Klaveren*, GJA Speijers
This investigation has been performed by order and for the account of the Food and
Consumer Product Safety Authority, the Inspectorate for Health Protection and Veterinary Public Health, within the framework of project V/310301, Natural Toxins.
Abstract
Trichothecenes in baby food
There is a growing interest and concern of the public health authorities for the presence of mycotoxins in human food, such as aflatoxins, trichothecenes and ochratoxin A. In the European Union (EU) efforts to assess human exposure to mycotoxins have been undertaken within SCOOP (SCOOP: Scientific Co-operation on Questions relating to Food) projects. One of the major outcomes of the SCOOP project dealing with trichothecenes was that for a more accurate assessment of the exposure of the European population, exposure data of specific population groups (like children and infants) are needed.
In the present study analytical measurements in duplicate diets of young children are done in order to investigate the real exposure to trichothecenes.
Based on the individual results, exposure calculations were made. For deoxynivalenol the tolerable daily intake (TDI) (1 μg/kg bw) was exceeded by 9 children. For the combined intake of T-2 and HT-2 toxin the temporary TDI (tTDI) (0.06 μg/kg bw) was exceeded by 9 children. One child exceeded the (t)TDI for both DON and combined HT-2 and T-2. The exposure to the other trichothecenes was very low (nivalenol) or almost absent. As the TDI concept is based on a life-time exposure, an incidental exposure above the TDI does not necessarily indicate that there is an appreciable risk for adverse health effects. However as one of the effects of deoxynivalenol is growth inhibition in experimental animals and young children are in a fast growing phase, exceeding of the TDI should be avoided.
Rapport in het kort
Trichothecenen in babyvoedingUit dit onderzoek blijkt dat voor een aantal van de onderzochte trichothecenen de dagelijkse inname bij ongeveer 10% van de kinderen boven de geaccepteerde veilige dagelijkse dosis ligt. Nu is deze geaccepteerde veilige dagelijkse dosis gebaseerd op een levenslange blootstelling en incidentele overschrijding betekent daarmee niet automatisch dat er een gezondheidsrisico is. Echter, een van de effecten die deoxynivalenol -het meest voorkomende trichotheceen- kan veroorzaken, is groeivertraging. Jonge kinderen groeien snel, zodat overschrijding van de geaccepteerde veilige dagelijkse dosis, juist voor deze groep, voorkomen moet worden.
De volksgezondheidsautoriteiten van de lidstaten van de Europese Unie (EU) hebben een groeiende belangstelling voor de aanwezigheid van door schimmels geproduceerde gifstoffen (zoals aflatoxinen, trichothecenen en ochratoxine A) in de voeding.
In EU onderzoeksprojecten wordt daarom onderzocht in welke mate de Europese bevolking blootgesteld wordt aan dit soort gifstoffen. Een van deze projecten richtte zich op de trichothecenen en had als een van de belangrijkste conclusies dat er vooral voor de jongere bevolkingsgroepen betrouwbare blootstellinggegevens ontbreken.
In de huidige studie zijn analytisch-chemische metingen verricht aan voedingen van jonge kinderen. Aan de hand van de gevonden resultaten is berekend wat de dagelijkse inname van trichothecenen via de voeding is.
Contents
Samenvatting 5 Summary 6 1. Introduction 7 1.1 General 7 1.2 Toxicity of trichothecenes 9 1.2.1 General 9 1.2.2 Deoxynivalenol 9 1.2.3 Nivalenol 9 1.2.4 T-2 and HT-2 toxin 10 1.2.5 Fusarenon X 10 1.2.6 Diacetoxyscirpenol 101.2.7 3-acetyldeoxynivalenol and 15- acetyldeoxynivalenol 11
1.2.8 Neosolaniol 11
2. Materials and methods 12
2.1 Analytical method 12
2.1.1 Chemicals and reagents 12
2.1.2 Extraction 12
2.1.3 Clean-up and derivatization 12
2.1.4 Equipment 13
2.1.5 In-house Method validation 13
2.1.5.1 Linearity 13
2.1.5.2 Limit of detection and limit of quantification 13
2.1.5.3 Recovery 13
2.1.5.4 Repeatability 14
2.1.5.5 Reproducibility 14
2.1.5.6 Uncertainty of measurement 14
2.2 Food sampling 14
2.3 Calculations and data analysis 14
2.4 Exposure estimation with MCRA 15
3. Results 16
3.1 GCMS determination of trichothecenes in baby food 16
3.2 Exposure to trichothecenes 16
3.3 Exposure calculations with MCRA 17
3.4 Risk evaluation 17
4. Discussion 18
5. Conclusions 20
References 21
Samenvatting
Trichothecenen zijn mycotoxinen die door schimmels, voornamelijk van het geslacht
Fusarium, worden gevormd. Deze schimmels kunnen granen besmetten die zowel voor
humane als dierlijke consumptie bestemd zijn. Blootstelling aan trichothecenen kan ongunstige effecten hebben op mens en dier, zoals het weigeren van voer, groeivertraging, overgeven en effecten op het immuunsysteem.
In deze studie zijn duplicaatmaaltijden van jonge kinderen analytisch chemisch onderzocht om de werkelijke blootstelling aan trichothecenen te bepalen. Ook is onderzocht of monitoringsdata van deoxynivalenol (DON) gekoppeld aan consumptiegegevens van Nederlandse kinderen bruikbaar zijn om met behulp van probabilistische innameberekeningen een schatting te maken van de blootstelling.
Een methode gebaseerd op gaschromatografie met massaspectrometrische detectie, waarmee de negen meest voorkomende trichothecenen in duplicaatmaaltijden van jonge kinderen aangetoond kunnen worden, is ontwikkeld en intern gevalideerd.
Met deze methode zijn 74 duplicaatmaaltijden van jonge kinderen (8 tot 12 maanden) onderzocht.
In deze maaltijden werden gemiddelde niveau’s voor DON, nivalenol, T-2 en HT-2 toxine gevonden van 5,8, 0,3, 0,3 en 0,1 µg /kg respectievelijk. Innameberekeningen zijn uitgevoerd, gebaseerd op de individuele resultaten. Voor DON werd de toelaatbare dagelijkse inname (TDI) (1 µg/kg lichaamsgewicht) in 9 gevallen overschreden, evenals voor de gecombineerde tijdelijke TDI (0,06 µg/kg lichaamsgewicht) van T-2 en HT-2 toxine. Eén kind had een overschrijding van beide TDIs. De blootstelling aan de andere trichothecenen was erg laag (nivalenol) of praktisch afwezig.
Het TDI concept is gebaseerd op een levenslange blootstelling en een incidentele overschrijding betekent dan ook niet dat er automatisch een gezondheidsrisico is. Echter een van de effecten van DON is groeivertraging en jonge kinderen groeien snel, zodat overschrijding van de TDI voorkomen moet worden.
De inname van DON, zoals berekend met het Monte Carlo Risk Assessment Program en monitoringdata van DON, ligt in dezelfde orde van grootte als de gemeten inname. Een belangrijke constatering is dat de berekende inname sterk afhankelijk is van de
Summary
Trichothecenes are mycotoxins produced by several fungal genera, mainly Fusarium species that can contaminate a wide range of cereals used for human and animal consumption. Trichothecenes are associated with various adverse health effects in animals and humans such as feed refusal, growth inhibition, vomiting and immunotoxic effects.
In the present study analytical measurements in duplicate diets of young children are done in order to investigate the real exposure to trichothecenes. A second aim is to link monitoring data on deoxynivalenol (DON) with consumption data of the Dutch children to perform probabilistic intake calculations. The calculated exposure is compared with the measured exposure.
A method based on capillary gas chromatography (GC) with mass spectrometric detection (MS) has been developed and in-house validated, for the determination of nine trichothecenes in duplicate diets of young children.
Seventy-four food samples from young children (8 – 12 months) collected by 74 respondents in a duplicate diet study were analyzed for trichothecenes with the method developed. The mean levels of DON, nivalenol, HT-2 toxin and T-2 toxin were 5.8, 0.3, 0.3 and 0.1 µg/kg, respectively. Based on the individual results, dietary intake calculations were made. For DON the tolerable daily intake (TDI) of 1 μg/kg bw was also exceeded by 9 children. For the combined intake of T-2 and HT-2 toxin the temporary TDI of 0.06 μg/kg bw was exceeded by 9 children. One child exceeded the (t)TDI for both DON and combined HT-2 and T-2. The exposure to the other trichothecenes was very low (nivalenol) or almost absent. As the TDI concept is based on a life-time exposure, an incidental exposure above the TDI does not necessarily indicate that there is an appreciable risk for adverse health effects. However as one of the effects of DON is growth inhibition in experimental animals and young children are in a fast growing phase, exceeding of the TDI should be avoided.
The intake of DON was also calculated with the Monte Carlo Risk Assessment program, using monitoring data on DON. The results of this calculation were in the same range as the intakes measured from the duplicate diets. An important observation is that the result of the calculated intake depends on the quantity and quality of the monitoring data used in the probabilistic intake assessment.
1. Introduction
1.1 General
Trichothecenes are naturally occurring toxic compounds produced by various mould species, infecting agricultural crops and in particular cereals. Infection and toxin production can occur at relatively low temperatures during growth and storage of crops. Therefore, trichothecenes are commonly found in cereals produced in moderate climatic zones (Van Egmond and Speijers, 1999).
The Fusarium species are by far the most important of these moulds, because they are spread globally and produce the largest range of trichothecenes. Over 150 trichothecenes are known; deoxynivalenol (DON) is most commonly found all over the world. Other trichothecenes found in cereals and cereal products are nivalenol (NIV), 3-acetyldeoxynivalenol (3-AcDON), 15-acetyldeoxynivalenol (15-AcDON), fusarenon X (FusX), T-2 toxin (T-2), HT-2 toxin (HT-2), diacetoxyscirpenol (DAS) and neosolaniol (NeoSol) (Gareis et al., 2003).
Animal feed and human foodstuffs contaminated with trichothecenes, can produce various adverse health effects (like vomiting, feed refusal and immunotoxic effects) in animals and humans when ingested (Schothorst and Jekel, 2001).
For DON, NIV, T-2 and HT-2 risk assessment has been performed recently by the Scientific Committee on Food (SCF) of the European Commission (SCF, 1999, 2000, 2001, 2002), by the Joint FAO/WHO Expert Committee on Food Additives (not for NIV) (JECFA; WHO/FAO, 2001), and by the Nordic Working Group (Eriksen and Alexander, 1998). For DON, a tolerable daily intake (TDI) of 1 μg/kg body weight (bw) (SCF, 2002) was established, while temporary TDIs (tTDIs) were established for the sum of T-2 and HT-2
(0.06 μg/kg bw) (SCF, 2001) and for NIV (0.7 μg/kg bw) (SCF, 2000). Toxicology data
available for the other trichothecenes were too limited to derive TDIs. (Pronk et al., 2002) Studies on exposure to mycotoxins via the diet have been limited, partly because of lack of analytical techniques to detect mycotoxins in food samples. In the European Union (EU), efforts to assess human exposure to mycotoxins, essential for risk assessment, have been undertaken within SCOOP projects (SCOOP: Scientific Co-operation on Questions relating to Food), funded by the European Commission (EC). SCOOP data are used by the EC’s EFSA (European Food Safety Authority) for evaluation and advisory work on the risks for public health arising from dietary exposure to certain contaminants.
In 2001 the SCOOP task 3.2.10 ‘Collection of occurrence data of Fusarium toxins in food and assessment of dietary intake by the population of EU Member States’ was established. The assessment of dietary intake of trichothecenes was part of this study (Schothorst and Van Egmond, 2004).
The result of the subtask trichothecenes shows that (Gareis et al., 2003):
-For DON the dietary intakes for the entire population and adults are below the TDI, but for vulnerable groups like infants and children the intake can be close to or in exceedance of the TDI.
-For NIV all dietary intakes are far below the tTDI.
-In the case of T-2 and HT-2 the combined dietary intakes often exceed the tTDI. However, these results are strongly influenced by the high limit of detection of the used analytical methods.
One of the major outcomes of this SCOOP study was that for a more accurate assessment of the exposure of the European population, dietary intake data of specific population groups (like children and infants) are needed.
In the international literature there is a limited number of information on trichothecenes in baby and infant foods. Lombaert (Lombaert et al., 2003) analysed a large number (n = 363) of cereal-based infant foods, collected from the Canadian retail market. In 63% of the samples DON was detected in quantities exceeding the limit of quantification. NIV and HT-2 were not detected. However, especially for HT-2, the limit of quantification was high.
Schollenberger (Schollenberger et al., 1999) did a survey of trichothecenes in baby and infant foods in an area of Southwest Germany. For DON, 60% of the samples (n = 25) were positive. Also HT-2 and 3-AcDON were found in one sample. In Italy baby and infant food samples (n = 12) were analysed for DON and 62% of the samples were contaminated (Cirillo et al., 2003). In the UK different baby foods (n = 17) have been investigated for trichothecenes. The samples were positive for DON in 82%, for NIV in 24% and for HT-2 in 18% of the cases (Food Standards Agency, 2003). A Norwegian study showed 30% of samples were positive for DON and 6% for NIV (Gareis et al., 2003) in a large number (n = 102) of porridge samples. In the Netherlands trichothecenes were investigated in infant foods and DON was found in 76% (n = 21) of the samples (Gareis et al., 2003). However, only a limited and selected number of foodstuffs were studied and no total daily intake of the trichothecenes was estimated.
Information on daily intake of trichothecenes can be collected by total diet studies. In the duplicate diet approach a duplicate portion of all foods and drinks, including drinking water, consumed in a 24-hour period are collected and analysed. The principal drawbacks of this approach are that this technique is laborious and complex and that the analytes of interest are diluted. However the advantages far outweigh the drawbacks since the number of samples that have to be analysed to obtain the intake data is relatively small, effects of variations in food preparation and storage at the home level are included, and drinking water is included (Vaessen and Schothorst, 1999).
Food samples were collected in a study on dietary exposure to pesticides in Dutch infants, carried out with the financial support of the European Commission, Quality of Life and Management of Living Resources Fifth Framework (QLRT-1999-00155) and the Dutch Ministry of Health and Sports. The main aim of the study was to validate a probabilistic model on dietary exposure to pesticides (Boon et al., 2003 and Van de Voet et al., 2003).
The main aim of the current study is to perform analytical measurements in duplicate diets in order to investigate the real exposure to trichothecenes of the respondents in the study. The second aim is to link monitoring data on DON with consumption data of the Dutch infants to perform probabilistic intake calculations. The calculated exposure is compared with the measured exposure, to validate the calculated intake against the measured intake.
1.2 Toxicity
of
trichothecenes
1.2.1 General
Trichothecene analogues produce a variety of toxic symptoms in humans and animals, including mortality, skin and gastrointestinal effects, hematological disorders, diarrhea, vomiting and feed refusal, decreased body weight gain, damage to hematopoietic system in bone marrow, spleen, thymus and lymph nodes and immunological alterations. The trichothecenes have also in common that they are cytotoxic and inhibit the protein synthesis. The minimum structural feature required for biological activity of the trichothecenes is the presence of the 12,13-epoxytrichothecenes skeleton. Reduction of the epoxide leads to inactive derivatives, while hydrogenation of 9,10-double bonds and rearrangement of the skeleton to apotrichothecenes ring system lead to a substantial loss of activity. The side chains are also of importance (Pronk et al., 2002).
1.2.2 Deoxynivalenol
Most toxicity data are available for DON. Limited toxicokinetic data indicate that DON is readily absorbed, distributed and eliminated, and is metabolised in particular by de-epoxidation and glucuronidation, generally to less toxic metabolites. The acute oral LD50 in mouse ranged from 34 to 80 mg DON/kg bw. DON reveals adverse health effects after single, short-term or long-term dietary intake (Canady et al., 2001a). After single administration, DON has two characteristic toxic effects; decreased feed consumption (anorexia) and emesis (vomiting). Both effects have been linked to increased central serotoninergic activity. Single oral doses by intubation also cause damage to rapidly dividing cells, such as those of the gastrointestinal tract. These characteristic effects have been observed also with other trichothecenes, although there are differences in the potencies. The most consistent effect after repeated dietary intake of DON in most species was reduced growth. This is the most sensitive parameter in toxicity studies with DON. At higher dose the thymus, spleen, heart and liver were affected. Antibody response was also affected. The NOEL was based on the slight reduction of body weight noted in a 2-year mouse study, which was considered not biologically relevant at 0.1 mg DON/kg bw/day. DON is considered not mutagenic or carcinogenic, and developmental effects are only observed at levels, which also cause maternal toxicity. The NOEL for maternal toxicity and fetotoxicity was 0.38 mg DON/kg bw/day. In pigs given naturally contaminated feed, the NOEL was 0.08 mg DON/kg bw/day. In humans outbreaks of acute human disease involving nausea, vomiting, gastro-intestinal upset, dizziness, diarrhea, and headache have been reported at intake levels ranging from 3 to 93 mg DON/kg bw.
1.2.3 Nivalenol
For NIV there are considerable less toxicity data, which were not sufficient to perform a separate safety assessment. The toxicity seems, however quite similar to that of DON. NIV is also readily absorbed, distributed and eliminated mainly by faeces. About 80 % of NIV was de-epoxidated. The oral LD50 in rats was 19.5 mg DON/kg bw. (Pronk et al., 2002) The toxic effects after repeated intake of NIV were similar to what is observed with DON.
1.2.4 T-2 and HT-2 toxin
T-2 and HT-2 are closely related epoxy sesquiterpenoids. T-2 is readily metabolised by mammalian gut microflora to several metabolites. HT-2 toxin is a primary metabolite in the gut and is absorbed into blood after ingestion of T-2. Metabolism continues in the liver (with billiary) excretion, resulting in a substantial combined first pass effect in the gut and liver. T-2 toxin and its metabolites are eliminated rapidly (Canady et al., 2001b). Although not studied in detail, several primary metabolites seem less toxic than the parent compound T-2
in vitro. Severe toxic effects, including hemorrhage in the intestinal tract, lymph nodes, and
heart, that lead to death were observed in cats receiving a dose of T-2 toxin as low as 0.06 mg /kg bw per day in a gelatin capsule, in contrast, relatively mild effect were observed in a 7-week-old pigs given T-2 toxin in the diet at doses of 0.13 mg/kg bw per day for 3 weeks. Little direct information is available on the toxicity of HT-2 alone, however, the comparative data available indicate that HT-2 is similar toxic potency or less. There are no oral short-term and or long-term toxicity studies of T-2 or HT-2 enabling the establishment of a NOEL. IARC (1993) concluded that T-2 toxin is not classifiable with regard to its carcinogenicity to humans. T-2 toxin is not genotoxic. No embryotoxicity or gross fetal malformations were seen at intraperitoneal doses lower than 0.5 mg/kg bw. Continuous administration in the feed at concentrations of T-2 toxin equivalent to 0.22 and 0.48 mg/kg bw/day did not result in reproductive or gross developmental effects in mice, although increased spleen weights were observed in male offspring of exposed dams.
1.2.5 Fusarenon X
There are no toxicokinetic data of FusX after oral administration. The oral DL50 in rats is 4.4 mg FusX/kg bw. Both the toxic effects in animals (mouse and rats noticed after acute intake and short- or long-term intake are quite similar to those observed with DON and NIV in qualitative sense However, quantitative data to establish a NOEL for FusX were not available. The limited toxicity data do not indicate that FusX is carcinogenic or genotoxic (Pronk et al., 2002).The marginal clastogenic effects are probably unspecific and are caused by inhibition of protein synthesis (Thust et al., 1983). After subcutaneous injection of FusX to mouse embryotoxic effects were seen at maternal toxic dose level (0.63-1.6 mg/kg bw/day), no toxicity data after oral exposure are available. In the same study no teratogenic effects were seen (Ito et al., 1980). There are no oral studies on the immunotoxic effects of FusX, but repeated daily ip administration of FusX resulted in an immunosuppressive effect in BALB/c mouse; FusX, as well as in vitro antibody formation by splenic lymphocytes raised by T-dependent and independent mitogens, was suppressed (Masuda et al., 1982; IARC, 1993).
1.2.6 Diacetoxyscirpenol
The tissue distribution and excretion of DAS were examined in Fischer rat and CD-1 mice. In both species, urinary and faecal excretion was very rapid and essentially completed after the first 24 hours (90 %) indicating also that DAS is readily absorbed. The ratio of urinary to faecal excretion was approximately 4.5:1 for both rats and mouse. Similar toxicokinetic data are observed in swine. In swine DAS is metabolised to 15-monoacetoxyscirpenol (MAS) and Scirpenol (SCT). Main metabolites in faces were SCT and epoxy-SCT, MAS and de-epoxy-MAS were also detected, but in smaller amounts (Pronk et al., 2002). Oral acute toxicity data on DAS are not available. The ip LD50 for DAS in mouse was 15.3 mg/kg bw. The only acute toxicity study was performed in swine with only one dose level of 2 mg/kg bw at which the toxic symptoms as known for the trichothecenes were transiently observed. (after 24 hrs the animals were completely recovered). In short- and long-term toxicity studies the same toxic effects are seen as for other trichothecenes particularly
hematological changes and pathological changes in bone marrow, thymus and lymph nodes and gastro-intestinal tract as well as in the dietary studies reduced feed consumption and body weight gain. There are no data on carcinogenicity after oral intake, but a study to investigate skin tumour induction with DAS revealed no tumours (Lindenfelser et al., 1974). DAS was not mutagenic in in vitro studies. When tested in male Swiss mice after ip injection at 0.5 – 1 mg/kg bw, DAS caused a reduction in mitotic activity in bone marrow and an increase in structural chromosomal abnormalities in somatic cells and in germ cells (Hassanane et al., 2000). Reproductive and developmental studies revealed both reproductive and fetal malformations including external and skeletal malformations. These malformations are observed at all tested dose levels of DAS (from 1 mg/kg bw/day onwards), thus also at non maternal toxic dose levels (Mayura et al., 1987; Conner et al., 1990; Gentles et al., 1993; Brake et al., 1999). A suitable dose-response study with DAS to establish a NOEL is lacking. After ip administration DAS showed some immunosuppressive effects (Pronk et al., 2002).
1.2.7 3-acetyldeoxynivalenol and 15- acetyldeoxynivalenol
On 3-AcDON and 15-AcDON there are no toxicokinetic data. The oral LD50 of 3-Ac-DON for mice is 34 mg/kg bw, again the toxic effects after acute and long-term intake are similar to DON. There are no data of 3-AcDON on possible carcinogenicity and reproductive and developmental effects. 3-AcDON is not mutagenic bacteria tests, but induced chromosomal aberrations in Chinese hamster V79 cell in vitro. 3-AcDON has shown some immunotoxic effects (Pronk et al., 2002). For 15-AcDON the oral LD50 is 34 mg/kg bw. Although there are little toxicity data it seems likely that 15-AcDON acts similar as 3-AcDON and other trichothecenes. However, neither for 3-AcDON nor 15-AcDON suitable toxicity data to derive NOEL are available.
1.2.8 Neosolaniol
NeoSol or better 8-OH-DAS is not deacetylated by rat and rabbit liver carboxy esterases, this in contrast to DAS. The data are more scars than for the trichothecenes. The ip LD50 of NeoSol for mice is 14.8 mg/kg bw. The little toxicity data which allows an approximate comparison with the other trichothecenes indicate that most likely the toxicity is similar, although the potency relative to DON is not known.
2. Materials and methods
2.1 Analytical
method
A method based on capillary gas chromatography (GC) with mass spectrometric detection (MS) has been developed and in house validated, for the determination of nine trichothecenes in duplicate diets for young children (Schothorst et al., 2005)
2.1.1 Chemicals and reagents
All reagents were of analytical grade, unless otherwise specified.
Trichothecenes standards were purchased from Sigma, and the internal standard α-chloralose was purchased from Dr. Ehrenstorfer Reference Materials.
4 mixed calibrant solutions, each containing 1.5 μg/ml of the internal standard and increasing concentrations of the trichothecenes (0.375, 0.75, 1.5 and 3.0 μg/ml) in acetonitrile were prepared from the standards. These solutions were kept refrigerated and were stable for at least 2 years (Widestrand and Petterson, 2001). An internal standard solution of 0.1 μg/ml in water-ethanol (90+10, v/v) was prepared from the standard (α-chloralose). This solution was kept at room temperature in the dark and was stable for at least 2 years.
2.1.2 Extraction
A 10 g portion of a food sample to which 0.5 ml internal standard was added, was extracted for 15 minutes at room temperature with 14.5 ml of water-ethanol (90+10, v/v) in a 50 ml PP-test tube (Greiner Bio-One) using a shaking machine (Bühler, SM B1). The tubes were
centrifuged for 10 minutes at 3500 rpm. The extract was put on a ChemElut® (Varian)
column. After 5 minutes equilibration, the trichothecenes were eluted with 125 ml ethylacetate-methanol (95+5, v/v).
The eluate was rotary evaporated (60 °C) under reduced pressure. The dry residue was re-dissolved in 4 ml acetonitrile-water (84+16, v/v).
2.1.3 Clean-up and derivatization
The samples were cleaned up with Mycosep® 227 columns, which consist of various
adsorbents, including charcoal, Celite® and ion exchange resins, and Mycosep® 216 colums,
which consists of charcoal (Romer Labs.). The stationary phase of a Mycosep® 227 column
was repacked above the packing material of a Mycosep® 216 column (Figure 1). Before use,
the combined column was washed three times with 5 ml acetonitrile-water (84+16, v/v). The
concentrated extract (4 ml) was put onto the combined Mycosep® column. The trichothecenes
were eluted with 30 ml of acetonitrile-water (90+10, v/v), and the cleaned extract was rotary evaporated (65 °C) under reduced pressure. The dry residue was re-dissolved in 1.75 ml acetonitrile and transferred to an autosampler vial. The extract was evaporated to dryness under nitrogen at 80 °C with a heating block. Seventy-five microliters of tri-sil TBT (trimethylsilylimidazole-bis(trimethylsilyl)acetamide-trimethylchlorosilane (3:3:2), Pierce) was added to the dry residue. After the autosampler vial was flushed with N2, it was closed,
and the residue was derivatised to trimethylsilyl (TMS) ethers in 15 minutes at room temperature. The autosampler vial was opened, and the reagent was evaporated for 15 minutes at 60 °C under nitrogen. The residue was re-dissolved in 0.4 ml iso-octane and
washed for 30 seconds with 0.8 ml water. The mixture was centrifuged, and the iso-octane layer was transferred to a new autosampler vial.
The derivatization procedure is the same for the mixed calibrant solutions.
The sample preparation procedure for determining the amounts of trichothecenes in food samples is shown schematically in Figure 1.
The final extract was analysed for trichothecenes by GC-MS under the experimental conditions as specified in Table 1.
During the analytical runs it turned out that the shape of the peak of the trichothecenes in the calibrant solutions was improved by adding 100 μl matrix solution to the calibrants before derivatization. (Pettersson, 1998). This matrix solution is prepared by extracting 10 grams of a sample with 15 ml water/ethanol (9/1; v/v). After transferring this extract onto a
ChemElut® extraction column, this matrix is extracted with 125 ml ethylacetate/methanol
(95/5; v/v). The extract is rotary evaporated under reduced pressure until dry. The residue is dissolved in 15 ml iso-octane.
2.1.4 Equipment
Table 1 summarizes the GC equipment and the experimental conditions. Table 2 summarizes the quantifying and qualifying ions for the trichothecenes.
2.1.5 In-house Method validation
As (certified) reference materials or analytical quality control samples for trichothecenes in food samples for young children are lacking, in house validation experiments established the performance characteristics of the method. The following parameters were investigated: the limit of detection, the limit of quantification, the recovery, the repeatability, the within laboratory reproducibility and the linearity. Also an estimate of the uncertainty of measurement was made. All in-house validation experiments were carried out with a home made control sample (an in house prepared 24 hour young children’s diet). The results of the in-house validation experiments are summarized in table 3.
A chromatogram of a silylated standard solution of trichothecenes is presented in Figure 2, together with a chromatogram of a silylated duplicate diet sample with addition of standard solution (about 1 μg/kg of each trichothecene).
2.1.5.1 Linearity
Linear calibration curves are obtained for the mixed calibrant solutions. This corresponds to concentrations of 1 to 10 μg/kg in the food samples.
2.1.5.2 Limit of detection and limit of quantification
The limit of detection is defined as the mean value of a blank sample plus three times the standard deviation. The limit of quantification is defined as the mean value of a blank sample plus six times the standard deviation. As DON is present in the control sample the limit of detection for DON is defined as 3 times and the limit of quantification as 9 times the noise in the time window for DON.
2.1.5.3 Recovery
Recovery experiments were done by adding standards of the trichothecenes to a blank food sample. The levels at which standards were added to the test portion were 1 and 5 μg/kg. Experiments were carried out on two different days each in sixfolds.
2.1.5.4 Repeatability
The repeatability was determined by analysing spiked blank samples (n = 6) on one day at two levels (1 and 5 μg/kg).
2.1.5.5 Reproducibility
The reproducibility was determined by analysing spiked blank samples (n = 6) on two different days at two levels (1 and 5 μg/kg).
2.1.5.6 Uncertainty of measurement
The estimate of the uncertainty of measurement is based on the reproducibility. A coverage factor of 2 is used.
2.2 Food
sampling
From a Dutch duplicate diet study on food consumption of infants (collection period: September 2000 to September 2001), 74 food samples were selected for the analysis of trichothecenes content. Shortly, the study population consisted of 373 Dutch infants aged 8-12 months. The caretakers of the children were asked to record the food consumption of the children during one day in a food diary and to collect a duplicate portion of all meals and drinks consumed on the same day. For this, the caretakers were provided with a food diary and a weighing scale (g). At the RIKILT the content of the containers was homogenized and stored at –20 °C. For more details of the study see (Boon et al., 2003). For the selection of the samples to be analysed for trichothecenes those duplicate diets were chosen that contained the highest amounts of cereal containing foods according to the food diaries (e.g. bread, breakfast cereals). Duplicate diet samples were only included in the study when the amount of food collected and the amount reported in the food diary differed less than 10%. The demographic data of the study population are summarized in Table 4
2.3 Calculations and data analysis
The intake of trichothecenes was calculated by multiplying the trichothecenes levels with the total amount of food consumed during the study day. This resulted in the ‘real’ intake of trichothecenes per child. The trichothecenes intake was expressed as proportion of their (t)TDIs.
To express the trichothecenes intake in relation to the amount of cereals consumed the cereal consumption per child was calculated using the conversion model Primary Agricultural Products (CPAP), developed at the RIKILT (Van Dooren et al., 1995). With this model the consumption of foods, as recorded in the food diary, was translated into the consumption of raw agricultural commodities. For example, the consumption of brown bread was converted into the consumption of wheat, yeast and vegetable oils and fat. Cereal consumption was the sum of the consumption of wheat, rye, millet, rice, oats, barley, buckwheat and maize, summed per child. The difference in cereal levels between the diets selected and the diets not selected for analysis of trichothecenes were analysed by Student’s t-test (GenStat, 2003). The Spearman’s Rank Correlation test was used to analyze whether there was a relationship between cereal consumption and the level of trichothecenes in the diet (GenStat, 2003). A two-tailed significance level of p < 0.05 was used in both tests. To analyse the contribution of different cereal products (e.g. bread, breakfast cereals) to the DON intake, the children were
grouped into quartiles according to their DON intake. Differences in cereal product intake between infants in the upper and lower quartiles of DON intake were analysed by Student’s t-test (GenStat, 2003).
2.4 Exposure estimation with MCRA
The ‘real’ intake of DON of the 74 infants was compared with a calculated one-day intake of DON of these infants using a probabilistic method. The probabilistic calculation was performed with the ‘Monte Carlo Risk Assessment’ (MCRA) program (Van de Voet et al., 2004). The consumption data as recorded in the food diaries in the duplicate diet study were used and data on levels of DON were available in the Quality Agricultural Products Database (KAP) (Van Klaveren, 1999). Residue data on DON was originally obtained from The Inspectorate for Health Protection, Region Northwest, Amsterdam, The Netherlands (Spanjer et al., 2002). DON was measured in both raw agricultural commodities and consumer products. Values measured in raw agricultural commodities (e.g. wheat) were converted to values in consumer products (e.g. bread) with the conversion model CPAP (Van Dooren et al., 1995). The MCRA-program selects randomly the daily consumption of one child and multiplies the relevant products with randomly selected DON levels for these products. The intake of the products is summed per child. By repeating this 500,000 times an empirical estimate of the DON intake distribution, representing the whole range of exposure levels that may occur in this population on one single day (acute intake). All estimated intakes were adjusted for the individual’s body weight and expressed in ‘μg/kg bw/day’. Two scenarios were calculated. In the first scenario DON levels analysed in 2000 and 2001 were used and in the second scenario DON levels analysed in 1999, 2000 and 2001 were used. Furthermore a sensitivity analysis was performed to study the influence of assigning zero or 0.5 × LOD to those samples with DON levels below the LOD (the ‘non-detects’).
The calculations described above relate to exposure levels that occur during one single day. To be able to compare the exposure calculations with the TDI, long-term intake calculations should be performed. For long-term intake calculations however, one needs at least two days of food recording, while in the infant study only one day of food intake was recorded. We therefore performed an extra calculation using data from the Dutch National Food Consumption Survey (DNFCS) conducted in 1997 - 1998 of children 1 and 2 years of age (Anonymous; 1998; Kistemaker et al., 1998). The intake calculations of DON of these children were conducted with the same DON residue data as used for one-day intake of the infants from the duplicate diet study. To calculate the long-term exposure the acute exposure distribution, generated by MCRA, was analyzed with statistical methods for usual intake developed at Iowa State University (Nusser et al., 1996). For a short description of the method see (Boon et al., 2003).
3. Results
3.1 GCMS determination of trichothecenes in baby food
The GC-MS method described was used to determine the trichothecene content in 74 food samples from a duplicate diet study.
During the analytical sessions, duplicate determinations and recovery experiments were performed. Blanks (determination without test portion) were performed at regular intervals and a control sample was included in every analytical run.
The results of these quality assurance experiments complied with the performance characteristics established for the GC-MS method.
The trichothecene content levels in the food samples are summarized in Table 5. Values below LOD were set at zero.
3.2 Exposure
to trichothecenes
The mean measured exposure to DON was 0.66 ± 0.34 μg/kg bw/day and combined exposure to HT-2 and T-2 was 0.04 ± 0.03 μg/kg bw/day. The intake of DON ranged from 0.03 μg/kg bw/day to 1.98 μg/kg bw/day. The combined intake of HT-2 and T-2 ranged from 0.01 μg/kg bw/day to 0.16 μg/kg bw/day. DON was detected in all samples analysed, while combined HT-2 and T-2 was detected in 69% of the samples (n = 51). For the exposure calculation of combined HT-2 and T-2 levels below the limit of detection were assigned a zero.
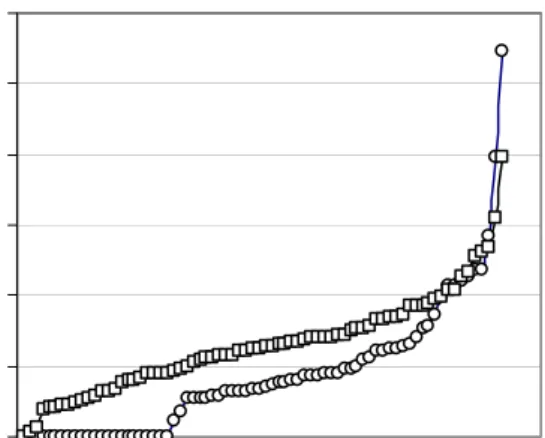
In figure 4 the daily intake of DON and the combined daily intake data of HT-2 and T-2 per child are graphically presented as percentage of the (t)TDI. Of the 74 respondents nine children (12%) had a daily DON intake that exceeded the TDI (= 1 μg/kg bw/day). One child had a daily DON intake that exceeded the TDI by almost 100% (intake of 1.98 μg/kg bw/day). Nine children (12%) also had a combined daily HT-2 and T-2 intake that exceeded the tTDI for these compounds (= 0.06 μg/kg bw/day). Of these children one also exceeded the TDI for DON. For all the other children exposure to high levels of DON and combined T-2 and HT-2 did not occur simultaneously.
The daily intakes for NIV were very low: 31 children had a positive intake ranging from
0.02 μg/kg bw/day to 0.06 μg/kg bw/day. All intake levels were below the tTDI
(= 0.7 μg/kg bw/day). Both DAS and 15-AcDON were detected in only one sample, resulting in an intake of 0.1 μg/kg bw/day. FusX, 3-AcDon and NeoSol were not detected in any of the samples.
The relation between DON intake and the cereal consumption level is graphically presented in Figure 3a. There was a significant (p < 0.05; correlation = 0.23) positive relationship between the amount of cereals consumed and the DON intake. This was not true for the combined intake of HT-2 en T-2 (p = 0.79; Figure 3b).
To allocate the observed positive relation of cereal consumption and DON intake to specific cereal products (e.g. bread) the children were divided in quartiles according to their DON intake. Table 6 shows the amounts of cereal products eaten by the infants, grouped by DON
intake. There was only a significant difference in bread intake between infants in the 4th and 1st quartile (p < 0.001, t-test = 3.94). The intake of other cereal products or total energy intake did not significantly differ between the quartiles.
3.3 Exposure calculations with MCRA
The exposure to DON on one day was calculated with MCRA, using monitoring data of DON of 2000 and 2001 (scenario 1) and of 1999, 2000 and 2001 (scenario 2). The ‘real’ DON intake should preferably be compared with the exposure calculated with scenario 1, because of similar sampling years. Due to possible incompleteness of the data in scenario 1, the exposure was also calculated with additional data from 1999. In 1999 more processed foods were measured, such as breakfast cereals. The average DON intake of the 74 children was
0.41 μg/kg bw/day (scenario 1) and 0.93 μg/kg bw/day (scenario 2). Results of the
calculations are shown in table 7. In the first scenario 7% of the infants exceeded the TDI of DON (1 μg/kg bw), while in the second scenario 32% of the infants exceeded the TDI. The products that contributed most to the DON intake in scenario 1 were brown bread (44%), wheat (27%) and macaroni (12%). In scenario 2 brown bread (33%), breakfast cereals (23%) and wheat (19 %) contributed most to DON intake. The sensitivity analysis, in which non-detects were either replaced by zero or 0.5*LOD hardly influenced the level of DON intake (data not shown). The percentage of children exposed to DON however, was lower when non-detects were replaced by zero (94%) than when non-detects were replaced by 0.5*LOD (100%). Assigning levels to non-detects had probably little effect because the LOD is low (0.1 μg/kg food) relative to the DON levels analyzed (range 14 - 3300 μg/kg food). Children in the upper 5% of the intake distribution (scenario 1) were more exposed to DON originating from wheat (34%) and macaroni (33%) and less from bread (30%) compared to the total intake distribution.
Because only a single consumption day was available from the duplicate diet study, long-term exposure could not be calculated. However to show the difference between a one day and a long-term assessment we calculated both DON intake levels using data from the DNFCS-of children aged one to two years for both scenario 1 and 2.
In these older children the P95 of the one-day exposure was twice as high as the P95 of the
long-term exposure, 3.4 μg/kg bw/day (one-day) and 1.8 μg/kg bw/day (long-term) for scenario 1 and 1.8 μg/kg bw/day (one-day) and 0.9 μg/kg bw/day (long-term) for scenario 2. Results of the other percentiles are shown in table 8. In the first scenario, 14% (one-day) and 3% (long-term) of the children exceeded the TDI, in the second scenario the percentages were for both one-day and long-term exposure about 30 - 35%.
3.4 Risk
evaluation
Recently both by the former SCF (SCF, 1999, 2000, 2002) and JECFA (WHO/FAO, 2001) provisional TDIs were allocated for DON, NIV and combined for T-2 and HT-2. For other trichothecenes there were inadequate data to establish a TDI. In the exposure assessment based on the present duplicate diet study, it is noted that 12% (9 out 72) had a daily DON intake that exceeded the TDI, of 1 μg/kg bw (WHO/FAO, 2001). A few infants exceeded the TDI with a factor 1.5 to almost 2, but most infants only exceeded the TDI to a lesser extent.
The exposure assessment by means of a Monte Carlo Simulation (MCRA) revealed somewhat higher fraction that exceeded the TDI (32%). As the TDI derivation is based on a life-time exposure, JECFA have generally concluded that slight incidental excursions above the TDI do not indicate that there is appreciable risk for adverse health effects. However, the few children which have an intake of 1.5 – almost 2 times the TDI, could not excluded from being at risk for adverse health effects when exposed frequently to such an intake level of DON. Unfortunately the present study design does not allow to conclude for long-term exposure. It should be endorsed that the exposure of children will in the future not be above the TDI level for DON. In addition these children are in a fast growing phase and the effect considered for the establishing the NOAEL was growth inhibition in experimental animals. NIV exposure does not exceed the tTDI, so there is no appreciable risk for the intake of NIV by food.
The combined exposure to T-2 and HT-2 exceeded in 12% of the children (9 out 72) the tTDI level for these chemicals (0.06 μg/kg bw; WHO/FAO, 2001; SCF, 2001). A few children exceeded the tTDI for T-2 and HT-2 by a factor of 2 or more. Similarly to DON it has to be concluded that slight incidental excursions above the TDI not necessarily increase the risk for adverse health effects, but for the few case in which the intake was high (2 - 2.5 times) this should be avoided. Moreover one child had next to a high intake of T-2 and HT-2 also a high exceeding of TDI for DON. The tTDI for T-2 and HT-2 combined was derived from the LOEL based on effects on red and white blood cells and applying a safety factor of 500. The exposure to the other trichothecenes was less frequently and relatively low, therefore even that a TDI has not been allocated it can be concluded that there is most likely no appreciable risk for the other trichothecenes.
4. Discussion
In this report we measured the intake of trichothecenes in infants using the duplicate diet method. Results showed that for both DON and combined HT-2 and T-2 12% of the children exceeded the respective (t)TDIs. Except for one diet, DON and combined HT-2 and T-2 were not present at high levels in the same 24-h diet. DON intake was positively correlated with cereal consumption, while HT-2 and T-2 intake levels were not related to the amount of cereals consumed. This may be due to more varying levels of HT-2 and T-2 in cereals.
The exposure to the other trichothecenes was very low (NIV) or (almost) absent (DAS, 15-AcDON, FusX, 3-AcDon and NeoSol). These results are in agreement with the outcome of the SCOOP subtask trichothecenes report (Gareis et al., 2003).
The cereal product probably contributing most to DON intake is bread, as bread was the main cereal product consumed. Furthermore bread is the only cereal product with a significant difference in amount consumed between the infants with high and low DON intake. The bread consumption of children with high DON intake is 52 ± 27 g/day and with low DON intake is 24 ± 17 g/day. Expecting bread to be the main contributor to DON intake is in accordance to the products with highest DON values as reported in the SCOOP subtask trichothecenes report (Gareis et al., 2003). The infants with a low DON intake had a significantly (p = 0.04; t-test = 2.13) higher intake of infant formula than the infants with high DON intake. The consumption of infant formula for the low and high DON intake was 60 ± 29 g/day and 38 ± 33 g/day, respectively.
The probabilistic intake calculation of DON with MCRA showed that the DON intake varied widely between the years. The mean intake of DON according to the MCRA calculation using DON residue data levels analysed in 2000 - 2001 (scenario 1) was 0.41 μg/kg bw/day and in 1999 - 2000 - 2001 (scenario 2) was 0.93 μg/kg bw/day. The ‘real’ DON intake calculated for the 74 infants based on residue levels analysed in the duplicate diets was higher in the lower percentiles (≤ P90) than the intake calculated with scenario 1 (Table 7). The analysed diets were collected in 2000 and 2001 and should therefore preferably be compared with the results of scenario 1. A possible reason for the lower calculated exposure could be that the residue data from 2000 and 2001 are incomplete (in 1999 different consumer products were analysed, which were not analysed in 2000 and 2001). However on the other hand, DON levels in cereals are highly influenced by weather conditions and can thus vary significantly between years. Including residue data from 1999 may therefore introduce bias. All analysed diets had DON residue levels above the LOD, while 42% of the monitoring residue levels were below the LOD. The real DON level of such a sample is unknown: it may, be somewhere between zero (no residue present) and, 0.5*LOD or very close to the level of the LOD. We demonstrated that assigning zero, 0.5*LOD or LOD to the samples with levels below the LOD did not affect the exposure level in the upper percentiles of the intake distribution. However, the number of persons exposed to DON was influenced.
Two of the infants of the duplicate diet study had no DON intake according to the exposure calculations in either of the two scenarios; these children only consumed cereal products containing buckwheat and rice flour. In the residue files no DON levels in buckwheat and rice were available. The analysed diets of these children contained low levels of DON; 0.3 and 0.5 μg/kg food.
This study demonstrates that the distribution of the ‘real’ intake was in the same order of magnitude as the distribution of the calculated intake using the probabilistic approach. However the result of the calculated intake depends highly on the quantity and quality of the residue data used in the probabilistic assessment. Especially the years in which the residue data were collected influenced the calculated intake This finding emphasises the necessity of a complete residue database and the need to perform several scenario-analyses using different datasets and different assumptions.
A significant percentage of the population exceeded the TDI for DON, based on both the ‘real’ and calculated intake. We should however be careful when extrapolating these results to the real situation. First of all the selection of duplicate diets to be analysed for trichothecenes was based on a cereal rich diet. These diets had on average a significantly (p < 0.001; t-test = 8.03) higher cereal content than the diets not analysed for trichothecenes, cereal content of analysed diets was 56.8 ± 22.7 g and of non-analysed diets was 34.6 ± 14.2 g. Thus the analysed diets probably belonged to the upper part of the intake distribution. Furthermore it should be noted that in the infants a one-day intake was compared with the TDI, a toxicity parameter derived from long-term exposure (chronic study). Calculations of both the one-day and long-term intake of children aged one to two years showed that in the upper percentiles the long-term intake of DON was lower than the one-day intake. It is therefore likely that the long-term intake of infants in the duplicate diet will also be lower than the ‘real’ one-day intake. However still a significant percentage of children one to two years of age had a long-term intake that exceeded the TDI of DON. The exposure in this age group will be higher compared to DON-exposure on a lifetime basis, because younger children will eat more cereals on a body weight basis.
5. Conclusions
- The developed and in-house validated GC-MS method, which has been used for the determination of the trichothecene content of 74 duplicate diet samples for young children, worked very well, with good performance characteristics.
- 12% of the 74 children in the study had a DON and combined HT-2 and T-2 intake that exceeded the respective (t)TDI.
- One child exceeded the (t)TDI for both DON and combined HT-2 and T-2.
- The exposures to the other trichothecenes were very low (NIV) or (almost) absent (DAS, 15-AcDON, FusX, 3-AcDon and NeoSol).
- DON intake was positively correlated with cereal consumption. - Bread contributed most to the intake of DON.
- The intake calculation with MCRA for one-day with monitoring data on DON from the years 2000 and 2001 resulted in an underestimation of the intake in the P50 and P90 and an
overestimation of the measured intake in the higher percentiles.
- Based on the intake calculation of the long-term intake of the children aged 1-2 years it may be expected that the long-term intake of the infants in the duplicate diet study will de lower than the one-day intake calculated in this study.
References
Anonymous. (1998).
National Food Consumption Survey. Zo eet Nederland 1998.
Results of the Dutch National Food Consumption Survey 1997-1998. Dutch Food Centre, The Hague
Boon P.E., Voet H. van de, Klaveren J.D. van (2003).
Validation of a probabilistic model of dietary exposure to selected pesticides in Dutch infants.
Food Additives and Contaminants 20 (Suppl) 1, 36 - 49 Brake, J., Hamilton, P.B., Kittrell, R.S. (1999).
Effects of the trichothecene mycotoxin diacetoxyscirpenol on fertility and hatchability of broiler breeders.
Poultry Sci, 78, 1690 - 1694.
Canady, R.A., Coker, R.D., Egan, S.K., Krska, R., Kuiper-Goodman, T., Olsen, M., Pestka, J.,
Resnik, S., Schlatter, J. (2001a).
Safety evaluation of certain mycotoxins in food. Deoxynivalenol. WHO Food Additives Series 47, 419 - 556.
World Health Organization, Geneve, Switzerland.
Canady, R.A., Coker, R.D., Egan, S.K., Krska., R, Olsen, M., Pestka, J., Resnik, S., Schlatter, J. (2001b).
Safety evaluation of certain mycotoxins in food. DT-2 and HT-2 toxins. WHO Food Additives Series 47, 557 - 680.
World Health Organization, Geneve, Switzerland. Cirillo, T., Ritieni, A., Galvano, F., Cocchieri, R.A. (2003).
Natural co-occurrence of deoxynivalenol and fumonisins B1 and B2 in Italian marketed
foodstuffs.
Food Additives and Contaminants, 20 (6), 566 - 571.
Conner, M.W., Conner, B.H., Rogers, A.E., Newberne, P.M. (1990). Anguidine-induced testicular injury in Lewis rats.
Reprod Toxicol. 4, 215 - 222.
Dooren M.M.H. van, Boeijen, I., Klaveren, J.D. van, Donkersgoed, G. van (1995).
Conversie van consumeerbare voedingsmiddelen naar primaire agrarische produkten. Wageningen: RIKILT-DLO, Report no.: 95.17 (in Dutch).
Egmond, H.P. van, Speijers, G.J.A. (1999). Natural Toxins I. Mycotoxins.
In: International Food Safety Handbook, edited by K. van der Heijden, M. Younes, L. Fishbein, and S. Miller (pp 341 - 355).
Eriksen, G.S., Alexander, J. (eds.) (1998).
Fusarium toxins in cereals – a risk assessment.
Copenhagen: Nordic Council of Ministers; TemaNord 1998:502. Food Standards Agency (2003).
Survey of retail cereal products for trichothecenes and zearalenone. Food Survey Information Sheet No. 35/03
Gareis, M., Schothorst, R.C., Vidnes, A., Bergsten, C., Paulsen, B., Brera, C., Miraglia, M. (2003).
SCOOP task 3.2.10. Collection of Occurrence Data of Fusarium Toxins in Food and Assessment of Dietary Intake by the Population of EU Member States.
Available at: http://europa.eu.int/comm/food/fs/scoop/task3210.pdf. (20060102) GenStat (2003).
GenStat for Windows. Release 7.1, Seventh edition, VSN International Ltd., Oxford. Gentles, A.B., Small, M.H., Smith, E.E., Phillips, T.D., Duffus, E., Braithwaite, C.E. (1993).
Teratogenic effects of orally administered diacetoxyscirpenol in mice. Toxicologist, 13, 208 - 209.
Hassanane, M.S., Abdalla, E.S.A,, El-Fiky, S, Amer, M.A., Hamdy, A. (2000).
Mutagenic of the mycotoxin diacetoxyscirpenol on somatic and germ cells of mice. Mycotoxin Research, 16, 53 - 63.
IARC. Monographs on the evaluation of carcinogenic risk to humans (1993).
Some naturally occurring substances: food items and constituents, heterocyclic aromatic amines and mycotoxins.
Lyon:International Agency for Research on Cancer, World Health Organization, 397 - 444.
Ito, Y., Ohtsubo, K., Saito, M. (1980).
Effects of Fusarenon-X, a trichothecene produced by Fusarium nivale on pregnant mice and their fetuses.
Jpn. J. Exp. Med., 50, 167 - 172.
Kistemaker, C., Bouman, M., Hulshof, K.F.A.M. (1998).
Consumption of food products by Dutch population groups - Dutch National Food Consumption Survey 1997 - 1998.
TNO-Voeding, Zeist. Klaveren, J.D. van (1999).
Quality programme for agricultural products. Results residue monitoring in the Netherlands.
RIKILT, Wageningen.
Lindenfelder, L.A., Lillehoj, E.B., Burmeister, H.R. (1974).
Aflatoxin and trichothecene toxins: skin tumor induction and synergistic acute toxicity in white mice.
J. Natl. Cancer Inst., 52, 113 - 116.
Lombaert, G.A., Pellars, P., Roscoe, V., Mankotia, M., Neil, R., Scott, P.M. (2003). Mycotoxins in infant cereal foods from the Canadian retail market.
Food Additives and Contaminants, 20 (5), 494 - 504. Masuda, E., Takemoto, T., Tatsuno, T., Obara, T. (1982).
Immunosuppressive effect of a trichothecene mycotoxin, fusarenon X in mice. Immunology, 45, 743 - 749.
Mayura, K., Smith, E.E., Clement, B.A., Harvey, R.B., Kubena, L.F., Philips,T.D. (1987). Developmental toxicity of diacetoxyscirpenol in the mouse.
Toxicology, 45, 245 - 255.
Nusser, S.M., Carriquiry, A.L., Dodd, K.W., Fuller, W. A. (1996). Journal of the American Statistical Association 91, 1440 - 1449. Pettersson, H. (1998).
Intercomparison of trichothecene analysis and feasibility to produce calibrants and reference material.
European Commission, Directorate-General Science Research and Development Brussels, EUR 18214 EN, ISBN 92-828-3224-4
Pronk, M.E.J., Schothorst, R.C., Egmond, H.P. van (2002).
Toxicology and occurrence of nivalenol, fusarenon X, diacetoxycirpenol, neosolaniol and 3- and 15-acetyldeoyxynivalenol: A review of six trichothecenes.
Bilthoven: National Institute for Public Health and the Environment, Report no.: 388802024.
SCF (1999).
Opinion on Fusarium toxins. Part 1: Deoxynivalenol (DON), expressed on 2 December 1999. Scientific Committee on Food: SCF/CS/CNTM/MYC/19 Final. Available at: http://europa.eu.int/comm/food/fs/sc/scf/out44_en.pdf (20060102). SCF (2000).
Opinion of the Scientific Committee on Food on Fusarium toxins. Part 4: Nivalenol, expressed on 19 October 2000. Scientific Committee on Food,:
SCF/CS/CNTM/MYC/26 Final.
Available at: http://europa.eu.int/comm/food/fs/sc/scf/out74_en.pdf (20060102). SCF (2001).
Opinion of the Scientific Committee on Food on Fusarium toxins. Part 5: T-2 toxin and HT-2 toxin, adopted on 30 May 2001. Scientific Committee on Food:
SCF/CS/CNTM/MYC/25 Rev 6 Final.
Available at: http://europa.eu.int/comm/food/fs/sc/scf/out88_en.pdf (20060102). SCF (2002).
Opinion of the Scientific Committee on Food on Fusarium toxins. Part 6: Group evaluation of T-2 toxin, HT-2 toxin, nivalenol and deoxynivalenol, adopted on 26 February 2002. Scientific Committee on Food: SCF/CS/CNTM/MYC/27 Final. Available at: http://europa.eu.int/comm/food/fs/sc/scf/out123_en.pdf (20060102).
Schollenberger, M., Suchy, S., Jara, H.T., Drochner, W., Müller, H.M. (1999).
A survey of Fusarium toxins in cereal-based foods marketed in an area of southwest Germany.
Mycopathologia, 147, 49 - 57. Schothorst, R.C., Jekel, A.A. (2001).
Determination of trichothecenes in wheat by capillary gas chromatography with flame ionisation detection.
Food Chemistry, 73 (1), 111 - 117 Schothorst, R.C., Egmond, H.P. van (2004).
Report from SCOOP task 3.2.10 “Collection of occurrence data of Fusarium toxins in food and assessment of dietary intake by the population of EU member states”. Subtask: Trichothecenes.
Toxicology Letters, 153, 133 - 143
Schothorst,R.C.,Jekel, A.A., Egmond, H.P. van, Mul, A. de, Boon, P.E., Klaveren, J. D. van (2005).
Determination of trichothecenes in duplicate diets of young children by capillary gas chromatography with Mass Spectrometric Detection
Food Additives and Contaminants, 22 (1), 48 - 55. Spanjer, M.C., Scholten, J.M., Rensen, P.M. (2002).
Evaluation of the effect of measures taken after a DON outbreak. Keuringsdienst van Waren Noordwest, Amsterdam, 17.
Thust, R., Kneist, S., Hühne, V. (1983).
Genotoxicity of Fusarium mycotoxins (nivalenol, fusarenon-X, T-2 toxin, and zearalenone) in Chinese hamster V79-E cells in vitro.
Arch Geschwulstforsch. 53, 9 - 15. Vaessen, H.A.M.G., Schothorst, R.C. (1999).
The oral nitrate and nitrite intake in the Netherlands. Evaluation of the results obtained by hpic-analysis of duplicate 24-hour diet samples collected in 1994.
Food Additives and Contaminants, 16 (5), 181 - 188. Voet H. van de, Boon P.E., Klaveren J.D. van (2003).
Validation of Monte Carlo models for estimating pesticide intake in Dutch infants. Wageningen: RIKILT - Institute of Food Safety, Wageningen UR, Report no.: 2003.002
Voet H. van de, Boer W.J de, Boon P.E., Donkersgoed G. van, Klaveren J.D. van (2004). MCRA, a web-based program for Monte Carlo Risk Assessment, Release 3, Reference Guide, Biometris and RIKILT.
Wageningen University and Research Centre, Wageningen, The Netherlands. Widestrand, J., Pettersson, H. (2001).
Effect of time, temperature and solvent on the stability of T-2 toxin, HT-2 toxin, deoxynivalenol and nivalenol calibrants.
WHO/FAO (2001).
Safety evaluation of certain mycotoxins in food. Prepared by the Fifty-sixth meeting of the Joint FAO/WHO Expert Committee on Food Additives (JECFA).
WHO Food Additives Series 47/FAO Food and Nutrition Paper 74.
Geneva: International Programme on Chemical Safety, World Health Organization, 419 - 680.
Appendix: Tables and Figures
Table 1: Test conditions for determining trichothecenes in duplicate diets for young children.
GCsystem: Thermo Finnigan Trace 2000 with AS 2000 autosampler and Quadrupole MS detector
- Column type : Rtx-200, 60 m, 0.25 mm ID, 0.1μm film thickness (15011, Restek) with 2 m,
0.53 mm ID retention gap (723 560.25, Machery-Nagel).
- Carrier gas : Helium; 1.3 ml/min
- Internal standard : α-Chloralose
- Injector : Cold on-column, with secondary air-cooling
- Injection volume : 2 μl
- Detection : MS, Ionisation mode: EI+,
Detector voltage “Trace” 500 V,
GC-interface, 300 °C,
Source 225 °C
Emission current, 100 μA
- Calculation : Calibration curve with internal standard
- Column temperature program : 5 minutes at 115 °C
50 °C/ minutes to 125 °C 5 °C/ minutes to 300 °C 10 minutes at 300 °C
Table 2: Time window, quantifying and qualifying ions for the different trichothecenes.
Time window Analyt Quantifier ion Qualifier ion 1 Qualifier ion 2
20.00-23.50 α-Chloralose 423.0 421.0 23.50-25.50 DON 512.2 422.2 25.50-26.50 FusX 480.1 555.1 26.50-27.50 Niv 482.1 510.2 27.50-28.35 15-AcDON 392.1 407.1 482.1 28.35-28.85 3-AcDON 392.1 482.1 467.1 28.85-30.00 DAS 175.1 159.1 255.1 30.00-32.50 NeoSol 252.1 290.1 193.0 32.50-34.00 HT-2 347.1 185.1 466.2 34.00-35.60 T-2 122.1 290.2 350.1
Table 3: Performance characteristics of the GC-MS determination of trichothecenes in food samples of young children.
Performance characteristic Trichothecene
DON NIV 3-AcDON 15-AcDON FusX T-2 HT-2 DAS NeoSol
Limit of detection (µg/kg) 0.1 0.25 0.22 0.18 0.16 0.16 0.22 0.30 0.33 Limit of quantification (µg/kg) 0.3 0.28 0.26 0.19 0.16 0.18 0.26 0.36 0.37 Repeatability (%) 12.2 7.7 5.3 7.4 7.6 7.5 6.8 8.8 6.8 Reproducibility (%) 11.8 9.8 6.0 8.0 8.1 8.0 7.0 9.4 7.7 Recovery (%) 1 μg/kg 91.4 43.5 103.8 96.7 95.5 110.9 106.0 104.2 109.2 5 μg/kg 70.2 33.5 88.7 83.8 80.4 98.6 95.1 87.6 82.2 Uncertainty of measurement (%) 23.6 19.6 12.0 16.0 16.2 16.0 14.0 18.8 15.4
Table 4: Demographic data (n = 74). Mean (sd) Age (days) 311 (27.8) Body weight (kg) 9.2 (0.89) Height (cm) 73 (2.4) Daily consumption (kg)* 1.11 (0.23)
*Amount of food, including liquids such as water, consumed during 24 hours.
Table 5: Summarized exposure data (n = 74).
Mean trichothecene content (sd)*
(µg/kg food/day) number of positive samples
DON 5.75 (3.23) 74 (100%) FusX 0 (0%) NIV 0.33 (0.085) 31 (42%) 15-AcDON 0.8 1 (1.4%) 3-AcDON 0 (0%) DAS 0.9 1 (1.4%) NeoSol 0 (0%) HT-2 0.27 (0.16) 50 (68%) T-2 0.054 (0.11) 14 (19%)
*Values below LOD were set at zero
Table 6: DON intake and the consumption of cereal products per quartile, values are means of consumption of 19 (quartile 1, 4) or 18 (quartile 2, 3) infants.
1st quartile 2nd quartile 3rd quartile 4th quartile DON intake (μg/kg bw)
0.27 ± 0.1 0.54 ± 0.07 0.71 ± 0.05 1.10 ± 0.29
Mean cereal product consumption (g)
Bread 24 ± 17 43 ± 14 44 ± 11 52 ± 27
Rice products 30 ± 42 2 ± 6 8 ± 20 9 ± 18
Macaroni 0 ± - 4 ± - 8 ± 31 9 ± 19
Breakfast cereals 13 ± 25 14 ± 21 8 ± 7 15 ± 13 Biscuits 7 ± 13 4 ± 5 6 ± 9 10 ± 12
Table 7: One-day exposure to DON as measured in the duplicate diets and calculated with MCRA with DON data from KAP.
Percentiles DON intake μg/kg bw/ day
Duplicate diet MCRA calculation 1 MCRA calculation 2
mean 0.66 0.41 0.93 50 0.64 0.26 0.66 90 1.04 0.88 2.13 95 1.29 1.35 2.92 97.5 1.38 1.93 3.70 1
Intake calculated with DON data sampled in years 2000 and 2001, ND=0.5*LOD.
2Intake calculated with DON data sampled in years 1999, 2000 and 2001, ND=0.5*LOD.
Table 8: One-day and long-term exposure to DON of children aged one to two years
calculated with MCRA. ND are set at 0.5*LOD, DON data sampled in years 1999, 2000 and 2001 (scenario 1) and in the years 2000 and 2001 (scenario 2).
DON intake μg/kg bw/ day
Perc*
Scenario 1 Scenario 2
Acute exposure Chronic exposure Acute exposure Chronic exposure
50 0.42 0.52 0.66 0.86
90 1.26 0.82 2.22 1.53
95 1.79 0.93 3.37 1.81
97.5 2.43 1.02 4.53 2.07
Figure 1: Sample preparation procedure for determination of trichothecenes in duplicate diets for young children.
Figure 2: Chromatograms of a silylated calibrant solution of trichothecenes (A) and of a silylated duplicate diet sample with addition of standard solution (about 1 μg/kg) (B).
Figure 3: Exposure to (A) DON and (B) combined HT-2 and T-2 and the daily cereal consumption levels. Cereal consumption per infant was the sum of the
consumption of wheat, rye, millet, rice, oats, barley, buckwheat and maize. For combined intake of HT-2 and T-2 levels below LOD were assigned zero. (All DON intakes were positive).
Figure 4: DON ( ) and the combined HT-2 and T-2 intake (O) expressed as percentage of the (t)TDI (TDI for DON is 1 μg/kg bw and combined tTDI for HT-2 and T-2 is 0.06 μg/kg bw) 0.00 0.50 1.00 1.50 2.00 2.50 0 50 100 150 200 cereals consumed (g) D O N i n take ( u g /kg b w /d ) -0.02 0.04 0.06 0.08 0.10 0.12 0.14 0.16 0.18 0 50 100 150 200 cereals consumed (g) H T -2 + T-2 i n take (ug /kg bw /d ) A B 0% 50% 100% 150% 200% 250% 300% infants % of ( t) TD I