DECARBONISATION OPTIONS
FOR THE DUTCH REFINERY
SECTOR
C. Oliveira, K.M. Schure
24 December 2020Decarbonisation options for the Dutch refinery sector © PBL Netherlands Environmental Assessment Agency; © TNO The Hague, 2020
PBL publication number: 3659
TNO project no. 060.33956 / TNO 2020 P11490
Authors
C. Oliveira and K.M. Schure
Acknowledgements
We would like to thank Roland Bernhard (VNPI), Gerrie Smeenk (BP), Leon Pijl (Gunvor), Robin Bouwman (Gunvor), Marc Zwart (Shell), Marc Dannebos (Shell), Sander Albertsma (VPR Energy), Johan Vergouwe (Zeeland Refinery), Tijs Lammens (BTG-BTL), Bart Strengers (PBL), Marc Marsidi (PBL), Arjan Plomp (TNO), Herbert Zondag (TNO), Rajat Bhardwaj (TNO) and Octavian Partenie (TNO) for their help and valuable inputs.
MIDDEN project coordination and responsibility
The MIDDEN project (Manufacturing Industry Decarbonisation Data Exchange Network) was initiated and is also coordinated and funded by PBL and TNO. The project aims to support industry, policymakers, analysts, and the energy sector in their common efforts to achieve deep decarbonisation. Correspondence regarding the project may be addressed to:
Dick van Dam (PBL), Dick.vanDam@pbl.nl, or Silvana Gamboa Palacios (TNO) Silvana.Gamboa@tno.nl.
This publication is a joint publication by PBL and TNO and can be downloaded from:
www.pbl.nl/en. Parts of this publication may be reproduced, providing the source is stated, in the form: C. Oliveira and K.M. Schure (2020), Decarbonisation options for the Dutch refinery sector. PBL Netherlands Environmental Assessment Agency and TNO Energy Transition, The Hague.
PBL Netherlands Environmental Assessment Agency is the national institute for strategic policy analysis in the fields of the environment, nature and spatial planning. PBL contributes to improving the quality of political and administrative decision-making by conducting outlook studies, analyses and evaluations in which an integrated approach is considered paramount. Policy relevance is the prime concern in all of PBL’s studies. PBL conducts solicited and unsolicited research that is both independent and scientifically sound.
TNO Energy Transition has a twofold mission: to accelerate the energy transition and to strengthen the competitive position of the Netherlands. TNO conducts independent and internationally leading research and we stand for an agenda-setting, initiating and supporting role for government, industry and NGOs.
This report has received contributions from BP, Esso, Gunvor, Shell, VPR and Zeeland refineries and from VNPI (Dutch association for petroleum industry). PBL and TNO remain responsible for the content. The decarbonisation options and parameters are explicitly not verified by the companies.
Contents
Summary 4
INTRODUCTION
5
1
THE REFINERY SECTOR IN THE NETHERLANDS
6
1.1 The Dutch refinery sector 6
1.2 Refinery characteristics 7
2
REFINERY PROCESSES
11
2.1 Process descriptions 11
2.2 Process diagrams of the Dutch refineries 15
2.3 Energy and material flows 21
3
REFINERY PRODUCTS AND APPLICATION
28
3.1 Products volumes and its applications 28
3.2 Products markets 30
4
OPTIONS FOR DECARBONISATION
34
4.1 Carbon capture and storage 35
4.2 Electrification 38
4.3 Hydrogen as fuel 41
4.4 Decarbonisation of hydrogen production 42
4.5 Biomass options 44
4.6 Residual heat usage 49
5
DISCUSSION
52
FINDINGS
Summary
This report describes the current situation of the Dutch refinery sector, which is composed of 6 industrial sites owned by 6 different companies: BP, Esso, Gunvor, Shell, Vitol (VPR
Energy) and Zeeland Refinery (owned by Total and Lukoil). The total nameplate capacity for the entire sector is over 67 million tonnes (Mt) of crude oil processing. In 2019, the total production of LPG, naphtha, gasoline, kerosene, gasoil/diesel and fuel oil was more than 55 million tonnes.
In the past three years, the average energy consumption of the refinery sector was around 130 PJ/yr and the CO2 emissions were 10 Mt/yr. The main energy carrier for the refineries
sites is fuel gas, which is a by-product from several process units and responsible for around 55% of the sector’s total energy consumption. The main sources for emissions are the gas fired furnaces, hydrogen production (steam methane reforming and gasification) and fluidised catalytic cracking (FCC) units. The emissions from the latter two present high concentration of CO2 (above 15%vol).
The report also explores the options and preconditions for decarbonisation of the refinery sites considering a 2050 horizon. The options studied include post combustion carbon capture and storage, furnace electrification, hydrogen as fuel substitute, hydrogen
production decarbonisation, co-processing of bio-oil in an FCC unit, biofuels production via biomass gasification followed by Fischer Tropsch (FT) and waste heat usage. All the covered options present benefits and challenges related to its implementation, which are further discussed in this report.
Carbon capture (and storage) is an interesting option, mainly for the hydrogen production and fluidised catalytic cracking units, because of the higher CO2 concentration. However,
significant infrastructural changes are needed to capture all CO2. Nevertheless, hydrogen
production and FCC systems are responsible for 30% of direct CO2 emissions. Furnace
electrification requires reliable renewable electricity supply and significant infrastructural changes on site. Additionally, the extra fuel gas as a by-product from the process units may represent a burden and increase the costs. However, if implemented, this option has the potential to reduce around 51% of direct CO2 emissions. Regarding the alternative
feedstocks, bio-oil co-processing in refinery units presents potential, but this is still going through technical development and there is public debate on the use of biomass and its sustainability. Residual heat utilisation is a prominent option given the fact that it allows an estimate of over 22% of the total energy consumption of a refinery to be reutilised. Medium and high temperature waste heat can be applied for district heating, if the required
infrastructure is in place. For the low temperature streams, technologies that can upgrade its heat quality may be needed, such as heat pump systems.
FULL RESULTS
Introduction
This report describes the current situation of the Dutch refinery sector and the options and conditions for its decarbonisation. It is part of the MIDDEN project: the Manufacturing Industry Decarbonisation Data Exchange Network. MIDDEN aims to support industry, policy makers, analysts and the energy sector in their common efforts to achieve deep
decarbonisation. The MIDDEN project will update and elaborate further on options in the future, in close connection with the industry.
Scope
The aim of the MIDDEN project is to compile a database of material and energy uses of industrial processes at a plant level for the Dutch manufacturing industry. The scope of this research will focus on the 6 refinery sites present in The Netherlands.
Production locations include:
• BP Refinery Rotterdam BV: Darcyweg 76, 3198 NA Europoort Rotterdam
• Esso Nederland B.V.: Botlekweg 121, 3197 KA Botlek Rotterdam (port number 4060) • Gunvor Petroleum Rotterdam BV: Moezelweg 255, 3198 LS Europoort Rotterdam • Shell Nederland Raffinaderij: Vondelingenweg 601, 3196 KK Vondelingenplaat • Vitol B.V. Netherlands: Neckarweg 5, 3198 LJ, Europoort Rotterdam
• Zeeland Refinery N.V.: Luxemburgweg 1, 4455 TM Nieuwdorp.
Processes include: Atmospheric distillation, vacuum distillation, alkylation, reforming, isomerisation, catalytic cracking, thermal cracking, visbreaking, hydrocracking, flexcoking, solvent deasphalting, hydrotreating processes and gasification.
Main products include: Liquified Petroleum Gas (LPG), propane, butane, gasoline, naphtha, kerosene, benzene, xylenes, fuel oil, gasoil, lube oils, bitumen and hydrogen.
The main decarbonisation options are: carbon capture and storage (CCS), electrification, hydrogen as fuel for furnaces, co-processing of bio-based feedstocks and waste heat utilization.
Reading guide
Chapter 1 introduces the Refinery sector in the Netherlands. Chapter 2 describes the current situation for refinery production processes in the Netherlands, and Chapter 3 describes the relevant products of these processes, while options for decarbonisation are systematically quantified and evaluated in Chapter 4. The feasibility of and requirements for those decarbonisation options are discussed in Chapter 5.
1 The refinery sector in
the Netherlands
1.1 The Dutch refinery sector
In recent years, the Dutch refinery sector energy consumption was over 131-152 PJ of energy commodities and around 2,444-2,496 PJ of crude oil (CBS, 2020a). The sector was responsible for over 10 million tonnes (Mt) of CO2 direct emissions for the past 3 years (NEa,
2020).Table 1summarizes thecrude oil capacities and CO2 direct emissions in 2016-2019
for each refinery site in The Netherlands. The ratio between CO2 emissions and crude oil
intake (source: CBS (2020c)) is also present in Table 1.
Table 1 Dutch refineries nameplate capacities and CO2 emissions
Refinery site Crude oil nameplat e capacity [kt/yr]1) Crude oil nameplate capacity [PJ/yr]2) Direct CO2 emissions 2016 [kt/yr]3) Direct CO2 emissions 2017 [kt/yr]3) Direct CO2 emissions 2018 [kt/yr]3) Direct CO2 emissions 2019 [kt/yr]3) BP Refinery Rotterdam B.V. 20,000 854 2,292 2,074 2,254 2,151 ESSO Refinery Rotterdam 9,100 389 2,106 2,068 1,583 2,376 Gunvor Petroleum Rotterdam B.V. 4,500 192 420 448 397 421 Shell Nederland Raffinaderij B.V. 21,000 897 4,254 3,831 4,211 4,357 Vitol B.V. 3,5004) 149 74 115 102 109 Zeeland Refinery N.V. 8,9074) 380 1,552 1,601 1,633 1,588 Total 67,007 2,861 10,699 10,137 10,180 11,002 Direct CO2 emissions/ crude oil intake
0.197 0.189 0.185 0.194
1) Data source: Facts & Figures on the Rotterdam Energy port and Petrochemical cluster (Port of Rotterdam, 2017)
2) Calculated based on average crude oil daily capacity and heating value of 42.7 MJ/kg for crude oil (RVO, 2018)
3) Nederlandse Emissieautoriteit (NEa, 2020) 4) Private communication with company, 2019
1.2 Refinery characteristics
1.2.1 Location and infrastructure
Regarding location,Figure 1 shows that all sites, except for Zeeland refinery, can be found in the Rotterdam port industrial complex, which occupies around 12,000 hectares. The complex contains around 1,500 km of pipelines (Port of Rotterdam, 2017), which are connected to other industrial clusters including Zeeland’s site, as illustrated in Figure 2 and Figure 3.
Figure 1 Locations of refineries sites in the Netherlands (extracted from Google Maps, 2019)
BP Refinery Gunvor Petroleum
Refinery Refinery Shell
Zeeland Refinery
Vitol BV
Esso Refinery
Figure 2 Crude oil and oil products pipelines (Port of Rotterdam, 2017)
Figure 3 Industrial gas pipelines (Port of Rotterdam 2017)
1.2.2 Main activities
The Dutch refinery plays an important role in the national industrial sector, delivering around 36 billion euros as net turnover in 2018 and employing more than 6,000 people in the country (Table 2). The Netherlands is also the house of the biggest refinery in Europe (i.e. Shell Nederland Refinery) and the sites locations allow broad access to different crude oil types. The port of Rotterdam, for example, receives crude oil from distinct areas, including the North Sea region, Russia and the Middle East. Also, the flexibility in terms of products is
significant, 85% of the total products are fuels, such as diesel, gasoline, gas oil and LPG; the remaining 15% consists of naphtha, base oils and bitumen (VNPI, 2020).
Table 2 Labour and economics figures for the Dutch refinery sector for the past years (CBS, 2020b)
Topic Unit 2016 2017 2018
Labour volume persons employed
x 1,000 employed
persons 5.2 5.6 6.4
Total operating returns x mln euro 26,166 29,867 36,772 Total operating costs x mln euro 25,559 29,278 36,777
Operating result x mln euro 607 589 -4
A refinery is generally composed of physical separation processes (distillation, extraction, etc), catalytic conversion processes (reforming, hydrotreating, hydrocracking, etc) and thermal conversion processes (thermal cracking, visbreaking, delayed coking, etc). Each site differs in configuration and levels of integration, this will be further explored on Chapter 2. The summary of the main units present in each site is shown in Table 3.
Regarding the products portfolio, the shares and total production from 2018 for Dutch refineries are present in Table 4. The products with highest shares are gasoil/diesel and naphtha, the latest is an important feedstock for the petrochemical sector, which is highly integrated with refineries in the country. The production of gasoil/diesel is high due to demand by the transportation sector.
Table 3 Overview of refining processes allocated to each refinery site (based on Facts and figures Port of Rotterdam, 2017)
Process unit BP ESSO Gunvor Shell Vitol Zeeland
Atmospheric distillation x x x x x x
Vacuum distillation x x x x x
Catalytic reforming x x x x x
Alkylation x x
Fluidised bed catalytic cracking x x
Hydrocracker x x x Hydrotreating x x x x x Thermal cracker x x Visbreaker x x x Flexicoker x Solvent Deasphalting x Gasification x
Table 4 Output of Dutch refining industry per product for 2018 (CBS, 2020c) Product Production 2018 [PJ] Share [%] LPG 66.9 3 Naphtha 416.5 17 Gasoline 171.5 7
Product Production 2018 [PJ] Share [%] Kerosene 393.8 16 Gasoil/diesel 796.0 33 Fuel oil 338.6 14
Other oil products 207.2 9
2 Refinery processes
A refinery site is a complex system composed of different processes, which are briefly described in this chapter. A breakdown of the main inputs and outputs and energy consumption of the processes, together with a summary of the CO2 emissions, are alsopresented in this Chapter.
2.1 Process descriptions
On a refinery site, crude oil is processed into smaller carbon-chain components, of which some fractions are converted into valuable substances. These products can be used as fuels, both for heat generation and for mobility purposes. Additionally, some oil outputs serve as feedstocks for the petrochemical and chemical industries (i.e. naphtha, lubricating oils, bitumen and paraffins/waxes). A refinery can also produce, as by-product, steam and power (JRC, 2015).
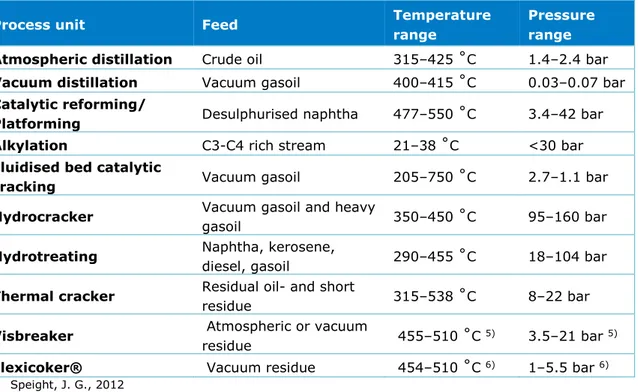
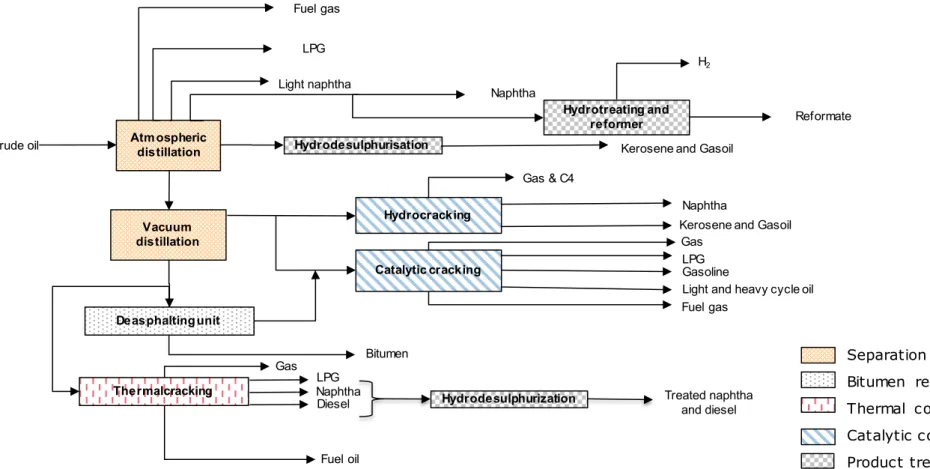
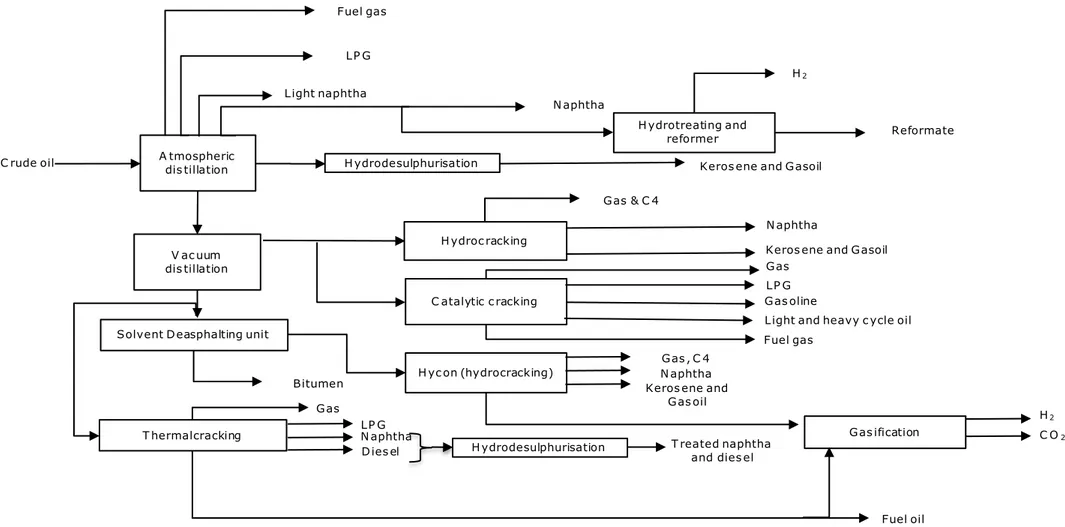
Figure 4 shows a simplified schematic of a possible configuration that contains the full range of processes that may exist on a refinery. As illustrated in this Figure, a refinery may constitute separation, thermal and catalytic conversions, deasphalting processes, and, finally, treatment and upgrading processes. The following paragraphs give a brief explanation of these units and point out their most relevant aspects. Feeds from each process and their respective operating conditions are summarized in Table 5.
Table 5 Summary of general process conditions for several refinery technologies (Meyers, 2004)
Process unit Feed Temperature range Pressure range Atmospheric distillation Crude oil 315–425 ˚C 1.4–2.4 bar Vacuum distillation Vacuum gasoil 400–415 ˚C 0.03–0.07 bar Catalytic reforming/
Platforming Desulphurised naphtha 477–550 ˚C 3.4–42 bar Alkylation C3-C4 rich stream 21–38 ˚C <30 bar Fluidised bed catalytic
cracking Vacuum gasoil 205–750 ˚C 2.7–1.1 bar
Hydrocracker Vacuum gasoil and heavy gasoil 350–450 ˚C 95–160 bar
Hydrotreating Naphtha, kerosene,
diesel, gasoil 290–455 ˚C 18–104 bar Thermal cracker Residual oil- and short
residue 315–538 ˚C 8–22 bar
Visbreaker Atmospheric or vacuum
residue 455–510 ˚C 5) 3.5–21 bar 5) Flexicoker® Vacuum residue 454–510 ˚C 6) 1–5.5 bar 6)
5) Speight, J. G., 2012 6) ExxonMobil, 2015
Figure 4 General refinery process flow diagram Atmospheric distillation Crude oil Fuel gas LPG Light naphtha Hydrodesulphurisation Naphtha
Kerosene and Gasoil
Vacuum distillation
Catalytic cracking LPGGasoline
Light and heavy cycle oil
Hydrotreating and reformer
H2
Reformate
Naphtha
Hydrocracking Kerosene and Gasoil
Gas & C4 Gas Deasphaltingunit Bitumen Thermalcracking Gas Fuel oil LPG Fuel gas Naphtha
Diesel Hydrodesulphurization Treated naphtha and diesel
Separation process Bitumen recovery Thermal conversion Catalytic conversion
Separation processes
Crude distillation: This involves the first separation step of desalted crude oil into fractions
composed of shorter carbon chains. The separation takes place at atmospheric pressure through a distillation process. In such systems, the main equipment is the distillation column, in which both operating temperature and pressure, together with differences in boiling point of the various fractions, determine which substances are recovered in specific sections of the column. The fractions in a crude distiller usually are: fuel gas, LPG, naphtha, kerosene, light gasoil, heavy gasoil and long residue. This last one is further separated in the vacuum distillation. In order to reach the right temperature for separation, the crude oil is pre-heated by gas-fired heaters.
Vacuum distillation: This unit processes the long residue that comes out of the crude distiller.
Since increasing the temperature of this vacuum feed (long residue) would lead to its thermal decomposition, this separation step is done under vacuum pressure to allow fractionation within mild conditions. Similar to the atmospheric separation, the vacuum distillation system is composed of a distillation column and gas-fired heaters. Additionally, an ejector is needed to reach vacuum pressures. The main fractions of this unit are called: vacuum gasoil (which feeds into catalytic conversion processes) and vacuum residue (which serves as feed for thermal conversion and the deasphalting units).
Thermal conversions
Thermal cracking or Visbreaking: Visbreaking stands for viscosity breaking and is a mild form
of thermal cracking. The thermal reactions are not allowed to complete and are interrupted by quenching (direct contact cooling). The main process goal is to reduce the length of the carbon chains and thereby the viscosity of residue, to produce fuel oil that meets the
required specifications. Other product streams are: fuel gas, naphtha, light gasoil and heavy gasoil.
Flexicoking®: This process was developed by ExxonMobil. It is characterised as low-pressure
thermal conversion that takes place in a continuous fluidised bed environment. It is capable of converting heavy feeds into a full range of gas- and liquid products and coke.
Solvent deasphalting process (SDA): The SDA process separates the vacuum residual oil with
a high metal content into a deasphalted oil (DAO) of relatively low metal content and a highly viscous substance. The SDA process uses a light paraffin solvent to extract the residue’s heavier components, this fraction is called bitumen and usually is used in the manufacturing of asphalts and cement and as a blending component in refinery fuel oil pools. If the metal content of the DAO is sufficiently low, it can be fed directly into catalytic
conversion units.
Catalytic conversions
Fluidised catalytic cracking (FCC): The process is used to convert higher-molecular-weight
hydrocarbons into lighter, more valuable products through contact with a powdered catalyst at appropriate conditions. The system is in constant fluidisation, which occurs when a gas or liquid flow passes through a granular solid material and converts it from a static solid-like state into a dynamic fluid-like state. For the FCC, the granular material is the catalyst and the feedstock is the liquid flow. The primary purpose of the FCC process is usually to process straight-run atmospheric gasoil, vacuum gasoil, certain atmospheric long residues, and heavy substances from other refinery operations. The products usually are: high-octane gasoline, light fuel oils, and olefin-rich light gases. The catalyst is regenerated after use by
burning the coke layer formed due to the cracking reactions. The coke burning provides the energy necessary for the cracking step. For this reason, the FCC flue gases present high concentration of CO2.
Hydrocracking: This is a catalytic conversion process in the presence of hydrogen.
Hydrocracking aims to produce a wide range of products that contain molecular weights lower than the feed. It normally presents fixed-bed reactors and its feedstock options are similar to the FCC’s. Contrary to the thermal cracking processes that present random bond rupture, the hydrocracking breaks the chains in an ordered and selective way.
Simultaneously to the molecular cracking, impurities removal, such as sulphur, nitrogen, and oxygen, takes place. The production yields depend on the operating conditions and can vary significantly, but in general, the main products from a hydrocracker are: naphtha, kerosene and diesel.
Treatment and upgrading processes
Hydrotreating: This process uses hydrogen in order to reduce the sulphur (among other
impurities such as nitrogen and oxygen) content of the feed in a catalytic hydrogenation process. Some refineries produce all hydrogen on site (see more details below), some obtain (part of) it from a supplier.
Catalytic reforming: This process aims to improve the octane number in naphtha by
increasing the aromatics content. Generally, the feedstock is brought into contact with a catalyst at elevated temperatures and hydrogen pressures. The resulting product is a high-octane liquid that is rich in aromatic compounds, which is usually added to the gasoline pool for upgrading purposes. Besides this application, this product can be further processed to recover aromatics such as xylenes and benzene. Other reforming products are: hydrogen, light gas, and LPG (Meyers, 2004).
Alkylation: The hydrofluoric (HF) alkylation process catalytically combines light olefins, which
are usually mixtures of propylene and butylene, with isobutane to produce branched-chain components. The alkylation reaction takes place in the presence of hydrofluoric acid. The alkylate product possesses valuable properties for fuel upgrading. Therefore, the alkylate is usually a gasoline blending component.
Isomerisation: This is a process that converts C5 and C6 paraffinic compounds to their
branched isomers. The isomerisation product normally is used to increase motor fuels’ octane number. It is a catalytic process and, depending on the technology, it may include hydrogen consumption.
Aromatics recovery: An aromatics complex is a combination of process units that can be
used to produce the basic petrochemical intermediates: benzene, toluene, and xylenes (BTX) from reformed naphtha. Usually, the recovery occurs via an extraction process, either with solvent utilisation or through adsorption.
Hydrogen
Hydrogen production: In a refinery, hydrogen is an important feedstock that is used in
several processes (e.g. hydrocracking, hydrodesulfurization). Depending on its demand, hydrogen is produced on site. It can be obtained via steam methane reforming (SMR), by gasification of residue oil, via recovery from gaseous streams in a PSA (pressure swing adsorption) or even as a by-product of the catalytic reforming process. More details about hydrogen production are given in the MIDDEN report ‘Decarbonisation options for the Production of Industrial Gases in The Netherlands’ (Cioli et al., in prep.).
2.2 Process diagrams of the Dutch refineries
This section includes the simplified process schemes of each refinery site located in the Netherlands. Quantities are included in the next section.
Figure 5 BP refinery process diagram Atmospheric distillation Hydrotreating and distillation Crude oil Fuel gas LPG Gasoline
Light and Heavy gasoil
Gasoil
desulphurization Gasoil blender Kerosene
Diesel
Vacuum
distillation Catalytic cracking
LPG Gasoline Gasoil
Visbreaking Fuel oil
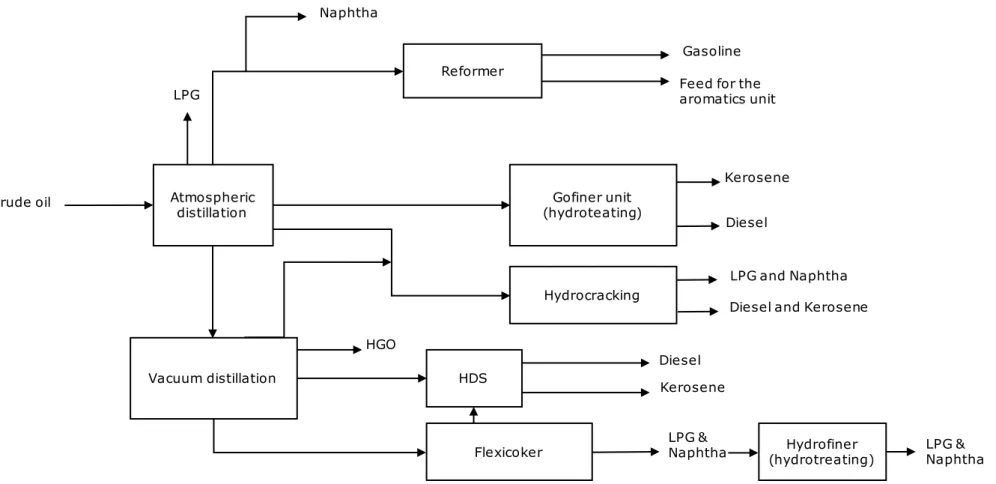
Figure 6 ESSO Refinery process diagram Atmospheric
distillation
Reformer
Crude oil
Feed for the aromatics unit
LPG and Naphtha Gofiner unit
(hydroteating)
Kerosene
Vacuum distillation HDS DieselKerosene
Flexicoker LPG Naphtha Gasoline Diesel Hydrocracking
Diesel and Kerosene HGO
LPG &
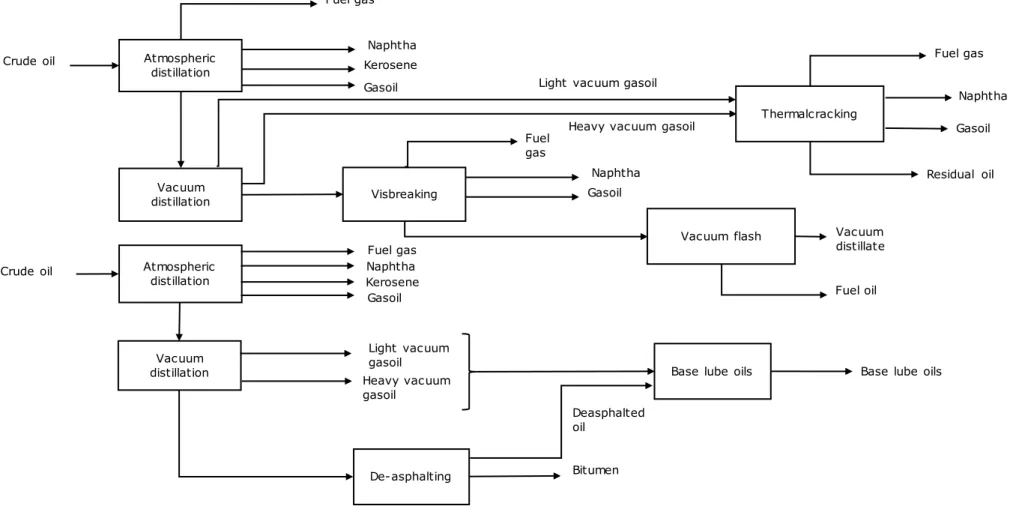
Figure 7 Gunvor Refinery process diagram Vacuum distillation Atmospheric distillation Fuel gas Naphtha Kerosene Vacuum flash Gasoil Vacuum distillate Vacuum distillation Light vacuum gasoil Heavy vacuum gasoil
Base lube oils
De-asphalting Bitumen Crude oil Atmospheric distillation Crude oil Visbreaking Fuel gas Naphtha Gasoil Fuel oil
Base lube oils Naphtha Kerosene Gasoil Fuel gas Thermalcracking Deasphalted oil
Light vacuum gasoil Heavy vacuum gasoil
Fuel gas Naphtha Gasoil Residual oil
Figure 8 Shell Refinery process diagram A tmospheric dis tillation C rude oil Fuel gas LP G Light naphtha H ydrodesulphurisation N aphtha
Keros ene and Gasoil
V ac uum dis tillation
C atalytic c racking
LP G Gas oline
Light and heavy c ycle oil
H yc on (hydrocracking) Gas , C 4 H ydrotreating and reformer H2 Reformate N aphtha H ydroc racking
Keros ene and Gasoil Gas & C 4
Gas
Solvent Deasphalting unit
Bitumen Keros ene and
Gas oil N aphtha T hermalcracking Gas Gas ification Fuel oil LP G H2 C O2 Fuel gas N aphtha
Figure 9 Vitol Refinery process diagram
Atmospheric
distillation
Crude oil
Kerosene
LPG
Naphtha
Gasoline
Gasoil
Residual oil
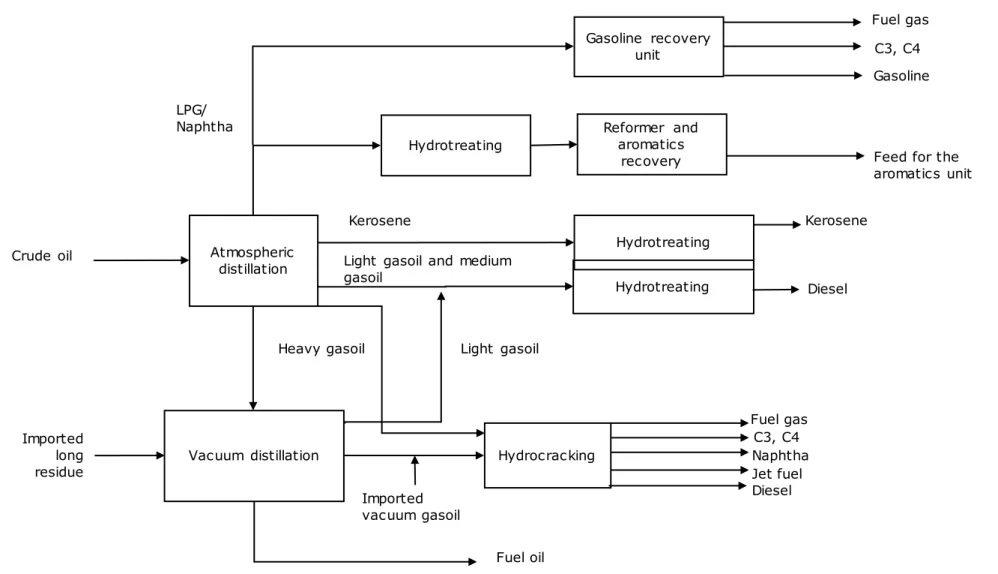
Figure 10 Zeeland Refinery process diagram Atmospheric distillation Reformer and aromatics recovery Crude oil
Feed for the aromatics unit
Hydrotreating
Kerosene
Vacuum distillation Hydrocracking Naphtha C3, C4
LPG/ Naphtha Fuel gas Diesel Light gasoil Fuel oil Gasoline recovery unit Kerosene Imported long residue
Light gasoil and medium gasoil Hydrotreating Imported vacuum gasoil Jet fuel Diesel Heavy gasoil Gasoline C3, C4 Hydrotreating Fuel gas
2.3 Energy and material flows
Since refinery sites are usually complex, some processes were grouped in order to keep the process analysis simpler. The main criteria used to group the units was their relevance for evaluating decarbonisation options.
Following this approach, the grouped units are:
• Thermal cracking/visbreaking: these two processes are considered in one group due to similar characteristics.
• Hydrotreating includes all hydrodesulphurisation and similar processes, even with different feedstocks, e.g. kerosene and diesel treating are considered in the same group.
Table 6 Nameplate Capacity per process unit Companies
Process units unit BP 7) Esso 8) Gunvor 7) Shell 7) Vitol 7) Zeeland 9)
Atmospheric distillation kt feed/yr 20,000 10,512 4,500 21,000 3,500 9,267
Vacuum distillation kt feed/yr 4,900 5,256 2,400 8,000 - 3,985
Hydrocracking kt feed/yr - 3,635 - 3,900 - 4,210
Thermal cracking kt feed/yr - - 530 2,700 - -
Visbreaking kt feed/yr 2,100 - 480 - - -
Catalytic cracking kt feed/yr 3,500 - - 2,600 - -
Hydrotreating kt feed/yr 16,50010) 5,430 3,86010) 15,40010) - 3,707
Lube oils kt feed/yr - - 260 - - -
Catalytic reforming unit/ Platforming
kt feed/yr
1,200 1,577 1,000 1,800 - 1,320
Alkylation unit kt feed/yr 330 - - 300 - -
Solvent deasphalting unit
kt feed/yr
- - - 84011) - -
Flexicoker ® kt feed/yr - 2,628 - - - -
Hydrogen via SMR kt H2/yr - 26 - 4911) - 92
Hydrogen as byproduct from catalytic
reforming/Platforming12)
kt H2/yr
52 68 43 77 - 38
Hydrogen production via gasification
kt H2/yr
- - - 10413) - -
7) Facts & Figures on the Rotterdam Energy port and Petrochemical cluster (Port of Rotterdam, 2017) 8) Milieueffectrapport hydrocrackerinstallatie Uitbreiding van de ExxonMobil Rotterdam hydrocrackerinstallatie
(Royal Haskoning DHV, 2015)
9) Internal communication with company, 2019
10) Based on capacity values for several hydrotreating processes found at Worldwide refining survey 2017 (Oil & Gas Journal Research, 2017)
11) Based on hydrogen production capacity found at environmental application permit Aanvraag Wm/Wvo-(revisie) vergunning Shell Nederland Raffinaderij B.V. – Pernis (DCMR, 2008)
12) Assumed that hydrogen production is 4.3 wt% of catalytic reforming unit capacity 13) Initial Operation of the Shell Pernis Residue Gasification Project (Zuideveld et al., 1998)
2.3.1 Energy consumption
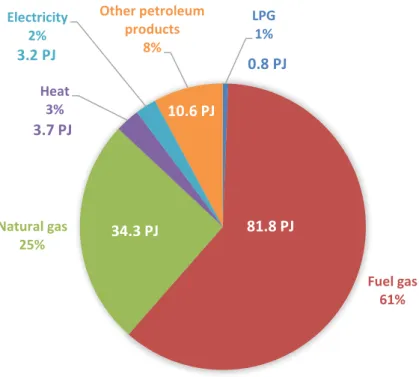
The refinery sector presented around 134 PJ of energy commodities intakes in 2018
commodities. Fuel gas and natural gas hold the highest shares, which is due to the fact that most of the refinery units have gas-fired equipment that runs on either one or the other fuel.
Figure 11 Energy use shares for the Dutch Refining sector for 2018. Based on CBS (2020a)
The fuel gas consists of a methane-rich gas which is a by-product of most of the refinery processes. It is usually consumed on site as fuel for furnaces and boilers. In 2018, the total fuel gas production from the sector was around 87.8 PJ (CBS, 2020a) and the total input for energy use was around 81.8 PJ, leaving 6 PJ for exporting to third parties (CBS, 2020a). The composition of this gas can vary depending on the site, however, for simplicity, the emission factor from natural gas of 56.6 CO2 kg/GJ (RVO, 2018) was considered also for fuel gas in
this report. Regarding natural gas, the total amount imported by the refineries in 2018 was 50.4 PJ (CBS, 2020a).
Some refinery sites have CHP (combined heat and power) units and boilers that use natural gas and/or fuel gas as energy commodities. The input of natural gas and fuel gas for the steam and electricity generation via CHP on site was around 13.7 PJ (CBS, 2020a) and 6.8 PJ (CBS, 2020a) in 2018, respectively. For boilers, the values were 1.1 PJ (EEA, 2019) and 8.7 PJ (EEA,2019). Natural gas is also used as feedstock for hydrogen production (i.e. steam methane reforming), the amount used for this purpose in 2018 was 16.1 PJ (CBC, 2020a). Thus, the energy use by other combustion processes could be derived by subtracting the inputs for boilers, CHPs and the use of natural gas as feedstock from the total production of fuel gas and the amount of natural gas imported. Table 7 and Table 8 include detailed information on the use of natural gas and fuel gas by the refinery sector.
Table 7 Summary of fuel gas use by the Dutch refinery sector in 2018 (CBS, 2020a & EEA, 2019) LPG 1% Fuel gas 61% Natural gas 25% Heat 3% Electricity 2% Other petroleum products 8%
81.8 PJ
34.3 PJ
3.7 PJ
9.3 PJ
10.6 PJ
0.8 PJ
3.2 PJ
Topic Fuel gas (Residual gas at CBS) [PJ]
Total fuel gas produced by the
sector (CBS, 2020a) 87.8
Energy input for CHPs
(CBS, 2020a) 6.8
Energy input for boilers
(EEA,2019) 8.7
Fuel gas export to third parties
(CBS, 2020a) 6
Total fuel gas used for
combustion except boilers and CHPs (calculated)
66.3
Total fuel gas used by the sector
for energy (calculated) 81.8
Table 8 Summary of natural gas use by the Dutch refinery sector in 2018 (CBS, 2020a & EEA, 2019)
Topic Natural gas [PJ]
Total natural gas imported by the
sector (CBS, 2020a) 50.4
Energy input for CHPs (CBS, 2020a) 13.7 Energy input for boilers (EEA,2019) 1.1 Natural gas use as feedstock
(CBS, 2020a)
16.1
Total natural gas used for combustion
except boilers and CHPs (calculated) 19.5
Total natural gas used by the sector for
energy (calculated) 34.3
Besides natural gas and fuel gas, the CBS (2020a) energy balance for the refinery sector also indicates the use of LPG and of so-called other petroleum products, together their
consumption summed 11.4 PJ in 2018 (Figure 11). It was assumed that these two fuels are used as fuel for furnaces. Regarding electricity, the total consumption by the refinery sites was and 9.3 PJ (CBS,2020a) in 2018, however, around 6.1 PJ (CB2, 2020a) of electricity was delivered by the CHPs, leaving 3.2 PJ to be provided by the grid.
Table 9 summarises the energy intake considered as baseline per energy carrier for each process unit mentioned in this chapter. Negative values represent generation of steam via heat recovery from a certain process unit. It is important to highlight that the specific energy input (per tonne of feedstock) is very dependent on which crude oil is processed in the refinery. This is due to the density difference between distinct crude oils. The calculations are based in three types of crude oils: Brent blend (833 kg/m3), Arabian heavy (886 kg/m3) and
Table 9 Energy demand per process unit for the refinery sector Process unit Fuel gas/ natural gas
[MJ/t feed] 14)
Steam
[MJ/t feed] 14) Electricity [kWhe/t feed] 14)
Atmospheric distillation 506 - 538 316 - 336 4.8 - 5.1 Vacuum distillation 322 - 350 350 - 380 2.2-2.4 Hydrocracking 970 - 993 523 - 535 76 – 78 Thermal cracking/ Visbreaking 737 - 830 (-92) – (-103) 37 – 42 Catalytic cracking (FCC) 0 15) 2 26 Hydrotreating 555 - 577 217 - 225 32 – 33 Lube oils 9,268 – 9,485 265 - 271 125 – 128 Catalytic reforming/ Platforming 1,500 – 1,590 737 - 781 23 - 25 Alkylation 400 3,720 77 Solvent deasphalting 910 – 1,024 17 - 19 11 – 13 Flexicoker® 16) 0 17) 19 23 18) Hydrogen via SMR 19) (per t H2) 30,000-80,000 20) (-10,000) – (-20,000) 200-400
Hydrogen via gasification 21)
(per t H2) 0 -18,000 not known
14) Best Available Techniques (BAT) Reference Document for the Refining of Mineral Oil and Gas (JRC, 2015) and Energy Efficiency Improvement and Cost Saving Opportunities for Petroleum Refineries (Energy star, 2016)
15) Catalytic cracking energetic input is provided by coke burning during catalyst regeneration, this coke layer is formed due to the cracking reactions. The energy demand was estimated to be around 410-420 MJ coke/t feed (Meyers, 2004)
16) Values for this process calculated based on ExxonMobil (2015)
17) Similar to the catalytic cracking process, the Flexicoker® partly burns the coke produced to provide the necessary heat for the reaction step. The coke demand was estimated to be around 5,100 MJ/t feed based on Methodology for the free allocation of emission allowances in the EU ETS post 2012 (Ecofys et al, 2009) 18) Based on electricity demand for conventional delayed coking process extracted from Meyers (2004) 19) Best Available Techniques for the co-production of hydrogen, carbon monoxide and their mixtures by
steam reforming (EIGA, 2013)
20) This value corresponds to the natural gas intake as feedstock to be converted into hydrogen and CO2 21) Based on Initial Operation of the Shell Pernis Residue Gasification Project (Zuideveld et al., 1998)
In Table 10 we combine the average energy consumption numbers with the throughputs of the units of the refineries to arrive at an approximate value for their total energy input per energy carrier. A utilisation factor of 90% was assumed for the calculation of the yearly energy intake.
Table 10 Estimated energy consumption based on unit throughputs (Table 6) and generic energy consumption numbers (Table 9) [PJ/yr]
Commodity BP Esso Gunvor Shell Vitol Zeeland Total fuel gas/natural
gas as energy use in
processes [PJ/yr] 23 – 25 14 – 15 9 – 10 29 – 31 2 14 – 15 Total fuel gas/natural
gas demand for
hydrogen production via SMR [PJ/yr]22)
- 1 – 2 - 2 – 4 - 3 – 7
Steam use in processes
[PJ/yr] 12 – 13 8 3 - 4 15 1 7
Total electricity use in
processes [PJ/yr] 2.8 1.8 0.8 3 0.1 1.4
22) The fuel gas/natural gas intake encompasses both energy use (combustion in reforming furnaces) and feedstock use (conversion to hydrogen via reforming reaction)
The atmospheric and vacuum distillation systems are responsible for the highest energy consumption share because they have the highest throughput. The lube oils and catalytic reforming/platforming have the highest energy demand per unit of feed, however, these systems usually have smaller capacities. As expected, fuel gas and natural gas are the energy commodities with highest demand for all systems, except for alkylation. It is important to note that the numbers above do not consider differences in terms of energy efficiency and downtime per refinery site.
Steam used on site can be provided via waste heat from furnaces, as indicated via the negative figures on Table 9. Thermal cracking, visbreaking, catalytic reforming and hydrogen production units are, therefore, relevant for the overall energy integration in the refineries. It is important to highlight that Table 8 does not offer a complete overview of the steam
balance of each site because it doesn’t contain information about all existent heat flows exchanged between process units.
2.3.2 CHPs and auxiliary boilers
Some of the companies discussed in this report have CHP units on site, which is the case for BP, Esso and Shell. Those units provide both steam and electricity for the respective sites. In all cases, the refinery still needs internal or external steam provision, and backup facilities. Shell Pernis, for instance, imports about 4.9 PJ/yr of steam from Pergen facility, which is located on the refinery site itself, but owned by Air Liquide (Cioli et al., in prep). It is also possible that the site is able to sell a surplus of both steam and electricity. Table 11 includes the (derived) main characterises of the cogeneration and boiler systems present at the refineries.
Table 11 Main power and steam plants capacities (EEA, 2019) and derived energy characteristics in 2018
Site/ process unit Thermal capacity [MWth] Fuel gas demand [PJ/yr] Natural gas demand [PJ/yr] Steam generated23) (calculated) [PJ/yr] Electricity generated24) (calculated) [PJ/yr] BP - CHP 292 1.3 2.8 1.7 1.2 BP - boilers 166 1.5 - 1.3 - Esso - CHP 192 4.2 0.8 2.1 1.5 Esso - boilers 349 4.6 - 4.1 - Gunvor - boilers 403 1.4 0.6 1.8 - Shell – CHP 502 1.3 10.1 4.7 3,4
Shell – gas turbine connected to crude
distillation 59 - 0.9 - -
Zeeland – boilers 152 1.2 0.5 1.5 -
Total (CHPs) 986 6.8 13.7 8.5 6.1
Total (boilers) 1,070 8.7 1.1 8.9 -
23) Steam production calculated based on thermal efficiency of 41% for CHPs, the efficiency value was derived from the Energy balance sheet for the refinery sector from CBS (2020a). For boilers, the thermal efficiency assumed to be 90%
24) Electrical efficiency for CHPs used was 30%. The efficiency value was calculated based on the Energy balance sheet for the refinery sector from CBS (2020a)
Shell presents a gas turbine that provides heat directly to the crude distillation system; for this reason, the table shows no steam or electricity production related to this specific gas turbine. However, its energy intake is quite significant and, for this reason, it was also included in Table 11.
2.3.3 Hydrogen production
As mentioned in section 2.1, hydrogen in the refinery sector can be produced via steam methane reforming and from gasification of heavy oil. Besides these sources, hydrogen is also available as by-product from the catalytic reforming/platforming process. The estimates of the hydrogen production from these three processes are present at Table 12. Regarding the Esso refinery site, part of the Flexicoker® gas is exported to the connected Air Products unit as feedstock for hydrogen manufacturing. This Air Products unit sells hydrogen and steam back to Esso (ExxonMobil, 2019).
Table 12 Hydrogen production nameplate capacity in the Dutch refinery sector Company SMR production [kt/yr] Gasification
[kt/yr] Hydrogen by-product from naphtha reforming [kt/yr]29) BP - - 38 Esso 2625) - 50 Gunvor - - 32 Shell 4926) 10428) 58 Zeeland 9227) - 38 Total 167 104 216
25) Value extracted from Uitbreiding van de hydrocrackerinstallatie ExxonMobil Raffinaderij Rotterdam – 3 t H2/h (Commissie MER, 2015)
26) Aanvraag Wm/Wvo-(revisie)vergunning Shell Nederland Raffinaderij B.V. Pernis (DCMR, 2008) 27) Internal communication with company, 2019
28) Initial Operation of the Shell Pernis Residue Gasification Project (Zuideveld et al., 1998) 29) Based on the ratio 51.27 Nm3/bbl naphtha feed (Meyers, R. A., 2004).
2.3.4 CO
2emissions
The CO2 emissions were grouped into the main sources of the refinery sector. Information on
unit capacities, energy consumption per energy carrier and their respective emission factors were used to estimate the values presented at Table 13. Additionally, a utilization factor of 90% was assumed for the operating facilities. As expected, emissions originated from combustion from furnaces present the biggest share.
Shell Pernis delivers around 400 kt/y of CO2 to the OCAP (Organic CO2 for Assimilation by
Plants) pipeline to supply greenhouse horticulture, but these emissions are still accounted to Shell under the ETS, and included in Table 13.
Table 13 Scope 1 CO2 emissions estimates for the Dutch refinery sector
Sources CO2 emissions [Mt/yr] Share [%]
Furnaces30) 5.5 51 CHPs and boilers 30) 1.9 10 FCC units 31) 1.0 9 Hydrogen production (SMR + gasification) 32) 2.3 21 TOTAL 10.7
30) Based on energy values from CBS (2020a). The emission factor for both fuel gas and natural gas were considered to be 56.5 kg CO2/GJ.
31) Based on emission factor for FCC units of 0.17 t CO2/ t feedstock. These emissions are related to coke
burning.
32) SMR emission factor: 9 t CO2/t H2 (EIGA, 2013). Gasification unit emissions:1 Mt CO2/yr (internal
communication with company, 2019).
3 Refinery products
and application
This chapter describes briefly the refinery products, production volume, applications, product markets, trade and prices relevant for the Dutch situation.
3.1 Products volumes and its applications
A typical refinery presents a wide range of fossil-based products, which may serve to meet both petrochemical and fuel demands. The main products of a refinery normally are LPG, naphtha, gasoline, kerosene, gasoil/diesel and fuel oil. Table 14 presents the production volumes of the mentioned products by the Dutch refinery sector for the last four years and Figure 12 shows the progressions of these products since 2000.
Table 14 Annual production volumes for the Dutch refinery sector (CBS, 2020c) Product 2016 [kt/yr] 2017 [kt/yr] 2018 [kt/yr] 2019 [kt/yr]
LPG 1,650 1,560 1,480 1,570
Naphtha 7,728 8,131 9,583 8,454
Gasoline 3,981 3,026 3,988 4,061
Kerosene (Aviation fuel) 8,220 7,988 9,099 9,064
Diesel/gasoil 19,162 19,272 18,599 20,753
Fuel oil 11,963 11,684 11,077 8,909
Figure 12 Production volumes for the Dutch refinery sector. Based on CBS (2020c)
0 5000 10000 15000 20000 25000 2000 2005 2010 2015 2020 kt / y ear Lpg Naphtha Aromatics
Gasoline Kerosene Diesel/ Gasoil
In the past three years, gasoline production has dropped while naphtha, kerosene and fuel oil increased. LPG production has kept relatively constant along the years and diesel has decreased slightly. In order to understand such behaviour, the paragraphs below give an overview of the main properties and applications of the refinery products. The next section will explore the market performance.
LPG and other Gaseous products
Gaseous refinery products include hydrogen, fuel gas, ethane, propane, and butane. Most of the hydrogen is consumed in refinery desulphurisation facilities, as mentioned in Chapter 2. Refinery fuel gas varies in composition, but presents a significant amount of methane, therefore, it has a heating value similar to natural gas. As described previously, the fuel gas is consumed in plant operations. Ethane may be recovered from the refinery fuel system for use as a petrochemical feedstock. Propane and butane make up the LPG, which is used as transport fuel and also used as feedstock for the petrochemical sector.
Naphtha
Naphtha is a liquid product mainly composed by hydrocarbons with 5-12 carbons atoms (5-6 carbons is light naphtha and 7-12 carbons is heavy naphtha). The mixture mainly consists of straight-chained and cyclic molecules. Naphtha can be sold to the petrochemical sector, to be used as feedstock for steam crackers. It can also be processed internally in the refinery (via catalytic reforming), to increase its octane number and, therefore, be blended into the gasoline pool.
Gasoline
It is a liquid product composed by a mixture of paraffins (straight chains), olefins (doubled bonds) and cycloalkanes (cyclic with single bonds), containing molecules with 4-12 carbon atoms. Gasoline is mainly used in the transport sector as a fuel. There are several categories of gasoline depending on its blending characteristics. As mentioned before, gasoline can be blended with reformatted naphtha, but also with alkylate product and with butane; with the purpose to increase its octane number and reach certain quality requirements.
Kerosene
Kerosene is a liquid product, constituted by molecules with 10-16 carbon atoms. The main components are paraffins, cycloalkanes and aromatics. It is the primary fuel for modern jet engines. Jet fuels may have strict requirements, such as being free from wax particles or suspended water to ensure safety for its application under sub-zero temperatures.
Gasoil/Diesel
Petroleum derived diesel is a liquid product also composed by paraffinic, cyclic and aromatics hydrocarbons. The molecules can have from 10 to 15 carbon atoms. Similarly to gasoline, the principal end use for diesel is as a fuel powering automobile, truck, bus, and
railway engines. It is also increasingly used as marine transport fuel because of stricter environmental regulations (Dieselnet, 2020). Until the early 1990s, standards for diesel fuel quality were not particularly stringent for passenger transport. Currently, the European Union restricted the sulphur content between 10 to 15 ppm and there are also regulations limiting aromatic content, which reduces its applicability in automobiles.
Fuel oil
Fuel oil is also a liquid product and consists largely of residues from several process units from a refinery. Its composition can vary depending on the application, but normally it contains paraffins, cycloalkanes and aromatics, in long hydrocarbon chains. This product can be blended with other suitable gasoil fractions to achieve the viscosity and density required.
The sulphur levels in the fuel oil can vary significantly because it is highly dependent on the crude oil processed in the refinery (Oiltanking, 2020). To reduce air pollution, regulations regarding the sulphur content are in place in Europe. From 2015, the maximum allowed sulphur content in fuel used on board ships decreased from 1.0 to 0.10 % within the Emission Control Area (ECA) in the North of Europe. The maximum sulphur content of fuel outside the ECA was 3.50% until the January 2020. Currently, the maximum sulphur content in fuel used outside the ECA is 0.50% (ILT,2020).
Table 15 summarises the national consumption distribution in 2019 of the main petroleum products. This table does not include the use of the products for conversion into other petroleum products.
Table 15 Shares of final consumption of petroleum products in The Netherlands for 2019 (CBS, 2020c)
Consumption Refinery own use as fuel Petrochemical use as fuel Petrochemical use as feedstock Transportation, fishing industry and other Total consumed volume (kt/year) LPG 2% 0% 82% 16% 1,867 Naphtha 0% 0% 100% 0% 3,100 Gasoline 0% 0% 0% 100% 4,329 Kerosene (jet fuel and
other) 0% 0% 48% 52% 92
Diesel/gasoil 0% 0% 0% 100% 6,910
Fuel oil 0% 0% 0% 100% 19
3.2 Products markets
The European market faces a growing demand for petrochemicals, kerosene and diesel, and a declining demand for gasoline, light heating oil and heavy fuel oil (JRC, 2015). The increasing production capacity of the Middle East and Asia markets and their ability to trade diverse petroleum products globally are relevant competition factors for refineries in the EU. The European Union has 85 refineries spread across 22 member states, Norway and
Switzerland, resulting in a throughput capacity of around 14.5 Mb/d (millions of barrels per day); which accounted for over 14% of global refining capacity in 2015 (CIEP, 2017). Some of the largest refineries in the world (>250 kb/d) are located in The Netherlands (around 8% of global refining capacity) and the Rotterdam port is one of the largest trading harbours (JRC, 2015).
On a European level, the total production of refinery products is relatively balanced with the demand volumes. However, specific policies and regulations (e.g. increase of gasoil/diesel in vehicles and sulphur levels in marine fuel) have motivated the demand for middle distillates (kerosene, gasoil/diesel). Also, the growing market of petrochemicals worldwide increases directly the demand for naphtha in the continent. The European market lacks on middle distillates products and present a significant surplus in gasoline and heavier products.
Therefore, considerable import flows of diesel, kerosene and naphtha are needed to fulfill the demand. In contrast, ample export of gasoline and fuel oils results from the surplus
production of these products (CIEP, 2017).
Regarding market prices, Figure 14 gives the average price for crude oil imports in Europe for the recent months and Figure 14 presents the average end-use price for some
fossil-based products in the same period. The figures indicate, as expected, that the prices for the selected fuels have similar fluctuation as crude oil imports prices, showing that they are similarly dependent on the refinery feedstock costs.
Figure 13 – Average import prices for crude oil in Europe (IEA,2020)
Figure 14 - Average end-use prices for gasoline, diesel and LPG in The Netherlands (CBS, 2020) and average end-use prices for fuel oil in Europe (IEA, 2020)
Oil products are among the largest volumes of commodities which are imported and exported in the Dutch economy (JRC, 2015). Figure 15 to Figure 20 show the imported and exported volumes for the past 20 years for the main refinery products (LPG, naphtha, gasoline, kerosene, diesel/gasoil and fuel oil). It is possible to notice that the difference between imported and exported volumes grew significantly for both LPG and naphtha for the past 5-8 years. This is a reflection from the petrochemical sector, which use LPG and naphtha as feedstock (see Table 15). Regarding gasoline, kerosene, diesel/gasoil the exports are historically higher than the imports. For the fuel oil, the flows are balanced.
0 10 20 30 40 50 60 70 80 Ju n-1 7 Au g-17 Oc t-1 7 De c-17 Fe b-18 Ap r-1 8 Ju n-1 8 Au g-18 Oc t-1 8 De c-18 Fe b-19 Ap r-1 9 Ju n-1 9 Au g-19 Oc t-1 9 De c-19 Fe b-20 Ap r-2 0 USD/b bl
Crude oil (Europe)
0.0 0.2 0.4 0.6 0.8 1.0 1.2 1.4 1.6 1.8 2.0 Ju n-1 7 Au g-17 Oc t-1 7 De c-17 Fe b-18 Ap r-1 8 Ju n-1 8 Au g-18 Oc t-1 8 De c-18 Fe b-19 Ap r-1 9 Ju n-1 9 Au g-19 Oc t-1 9 De c-19 Fe b-20 Ap r-2 0 €/ lit er
Figure 15 LPG imports and exports. Based on CBS (2020)
Figure 16 Naphtha imports and exports. Based on CBS, (2020)
Figure 17 Kerosene imports and exports. Based on CBS (2020)
Figure 18 Gasoline imports and exports. Based on CBS (2020)
0 500 1000 1500 2000 2500 3000 3500 4000 4500 5000 2000 2005 2010 2015 kt /y ea r Lpg - imports Lpg - exports 0 2000 4000 6000 8000 10000 12000 14000 16000 18000 2000 2005 2010 2015 kt /y ea r
Naphtha - imports Naphtha - exports
0 1000 2000 3000 4000 5000 6000 7000 8000 9000 10000 2000 2005 2010 2015 kt /y ea r
Kerosene - imports Kerosene - exports
0 5000 10000 15000 20000 25000 30000 2000 2005 2010 2015 kt /y ea r
Figure 19 Diesel/Gasoil imports and exports. Based on CBS
(2020) Figure 20 Fuel oil imports and exports. Based on CBS (2020)
0 5000 10000 15000 20000 25000 30000 35000 2000 2005 2010 2015 kt /y ea r
Diesel/ Gasoil - imports Diesel/ Gasoil - exports
0 5000 10000 15000 20000 25000 30000 35000 40000 45000 2000 2005 2010 2015 kt /y ea r
4 Options for
decarbonisation
This chapter presents potential options for reduction of energy use and/or CO2 emissions for
the Dutch refinery sector. Figure 21 illustrates the framework considered when looking at options. This analysis goes beyond direct emissions and may include upstream and downstream measures to reduce indirect emissions. Each element that is relevant for the industrial sites is taken into consideration in order to have a good idea of the possibilities for decarbonisation. Table 16 summarises the decarbonisation options investigated for the sites discussed in this report. The selection of technologies was based on the process
units/equipment contribution to the energy consumption and CO2 emissions at the refinery
sites. Options that are considered to have low impact or very low development level are not explored in this report, yet may be relevant. Therefore, this is not an exhaustive list, and many options are (still) under development.
Table 16 Summary of decarbonisation options for the refinery sector Category Technology Relevant to process
Carbon capture Carbon capture and storage
Applicable mainly for hydrogen production, FCC and for gasification units
Possibly applicable to all current stacks, but limited by space requirements
Fuel
substitution
Electric furnaces
Possibly applicable to all processes that present gas-fired equipment (e.g. atmospheric distillation, cracking processes, reforming)
Electric boilers Steam boilers
Electric shaft equipment Steam turbines replacement
Blue/green hydrogen as fuel
Possibly applicable to all processes that present gas-fired equipment (e.g. atmospheric distillation, cracking processes, reforming)
Feedstock substitution
Co-processing (5-10%) pyrolysis bio-oil from biomass in FCC unit
Co-feed for FCC
Blue/green hydrogen as feedstock for processes
All hydrotreating and hydrocracking processes
Process design
Stand-alone plant for biofuels production via pyrolysis bio-oil upgrading
Process alternative for production of LPG, gasoline, kerosene and
gasoil/diesel Biomass gasification and
Fischer Tropsch for fuels production
Process alternative for production of LPG, gasoline, kerosene and
gasoil/diesel Residual heat
usage
Use of process heat,
internally or externally All processes with excess heat
4.1 Carbon capture and storage
In a complex configuration such as a refinery, many different processes exist, such as cracking, distillation, reactions and flaring of off-gases, that result in CO2 emissions. The
emission sources are distributed and contain different CO2 concentrations. The majority of
CO2 emissions in a refinery are related to gas-fired process heaters, the on-site utilities for
power and steam generation, gas-fired furnaces and hydrogen production.
Table 17 presents the CO2 concentration for the different processes that may exist on a
refinery. These numbers were estimated by the IEA Greenhouse Gas R&D Program (SINTEF, 2017). Hydrogen production via SMR, the fluidised catalytic cracking (FCC) unit and both atmospheric and vacuum distillations are responsible for the highest post-combustion CO2
concentrations. However, in practice, some of the refinery processes may share the same stack and the CO2 concentrations may differ from values present in Table 17.
Table 17 CO2 concentration in flue gases per refinery process unit
(SINTEF, 2017)
Process unit CO2 concentration in flue gases (vol%)
Atmospheric distillation 11.3
Vacuum distillation 11.3
Visbreaking / Thermal cracking 8.1
Reforming 8.1
Hydrotreating 8.1
FCC 16.6
Hydrogen production via SMR 24.2
Delayed coking 8.1
Hydrocracking 8.1
Solvent deasphalting (SDA) 8.1
Gas turbines 3.2
Steam boilers 8.1
There are currently two options for carbon capture that are relevant for refinery sites: pre-combustion capture and post-pre-combustion capture. More details are given in the next paragraphs.
Pre-combustion capture
In this process, a hydrocarbon-rich stream is fed to a reformer or gasifier in order to produce CO2 and H2 (syngas). In a subsequent shift-reactor, the concentration of syngas is increased,
after which it is cooled and CO2 is captured via solvent absorption. An almost pure H2 stream
results from the absorption and the CO2 is released through solvent regeneration. This CO2
can then be compressed and exported. The outputs of this option include mainly the production of H2 and the possibility of steam generation after syngas cooling. Figure 22
illustrates a pre-combustion system.
Figure 22 Pre-combustion capture system33,34) (Ferguson. S. and Stockle, M., 2012)
33) ASU refers to air separation unit 34) AGR refers to acid gas removal
In a refinery site, the pre-combustion system could be connected to any process that can burn hydrogen or that allows burner modification. A promising application could be for gas turbines and boilers with hydrogen combustion. Some of the advantages of this technology are: the capture equipment does not need to be located close to the firing systems and if the fuel gas network is integrated, the pre-combustion capture could be centralized and the
network could be used to transport hydrogeninstead. Hydrogenburning leads to higher NOx emissions, therefore, equipment for reducing those emissions are required for this option.
Post-combustion capture
In this system, the flue gas resulting from a combustion process is cooled and compressed, followed by solvent absorption. Around 90% of the total CO2 can be absorbed by the solvent
(Ferguson. S. and Stockle, M., 2012). The cleaned gas is released to the atmosphere and the mixture solvent/CO2 is heated and the solvent recovered in order to be reused in the
absorption process. If the sulphur concentration in the flue gas is high, pre desulphurisation is necessary. Figure 23 illustrates the post combustion capture system. The most common option for a chemical absorption solvent is Monoethanolamine (MEA).
Figure 23 Post-combustion capture system (Ferguson. S. and Stockle, M., 2012) This capture unit is flexible and can be combined to most of the existent combustion systems (Ferguson. S. and Stockle, M., 2012). In principle, this technology could be applied to any combustion-based system in a refinery site, however, it is economically less attractive for flue gases with low CO2 concentration (below 10% vol.). Also, each stack would need a
dedicated capture equipment due to high flow volumes.
The SINTEF study (2017) reports CO2 post-combustioncapture costs for oil refinery systems.
The values may differ depending on the CO2 concentration, resulting in the range of 31–47
EUR2019/t CO2 captured. Both CAPEX and OPEX values in Table 18 include only the capture
and the interconnecting costs, however, the latter is very site dependent. No utilities costs are represented in the values below and they do not include CCS on hydrogen manufacturing because this topic is further explored on section 4.4.
Table 18 Post-combustion capture systems costs for different CO2 concentrations (SINTEF, 2017) Low CO2 concentration (5 %vol) Medium CO2 concentration (8-10 %vol) High CO2 concentration (10-18%vol) CAPEX [EUR 2017/t CO2 captured] 45 35) 3136)-3937) 2838)-3139) Fixed OPEX40) [EUR 2017/ t CO2 captured/yr] 19 35) 1536)-1837) 1438)-1539) Steam consumption [GJ/ t CO2 captured] 2.5 2.5 2.5 Electricity consumed [kWh/ t CO2 captured] 183 149-185 162-166 CO2 avoided/CO2 captured41) 0.65 0.67 0.67 35) Capture nominal capacity: 750 kt CO2/y
36) Capture nominal capacity: 697 kt CO2/y
37) Capture nominal capacity: 765 kt CO2/y
38) Capture nominal capacity: 2,777 kt CO2/y
39) Capture nominal capacity: 1,681 kt CO2/y
40) No electricity or fuels costs are included
41) Considering emission factors of 0.183 kg CO2/kWh for electricity and of 56.6 kg CO2/GJLHV for natural gas
4.2 Electrification
Electrification of the heat supply seems to be an interesting solution in the refinery sector, since a large part of its emissions is due to thermal processes (around 70%). Gas-fired furnaces and steam generation systems are the main targets for this option. Considering energy flows presented in section 2.3, it was estimated that the amount of energy used by furnaces in the entire refinery sector is around 97.1 PJ (Table 7 and Table 8) and around 17.4 PJ (Table 11) of steam is provided by CHPs and boilers.
In order to substitute both the thermal demand of the furnaces and the steam supply, nearly 32 TWh of renewable electricity would be required to allow CO2-free electrification of the
sector. To meet this demand, around 1,900 wind turbines (with capacity of 4 MW and 4,000 full load hours) would be necessary. Another relevant factor is the surplus of fuel gas that the electrification would bring, since this is a by-product from several process units. An alternative use that presents zero or low CO2 emissions would be necessary. The total
electricity demand was calculated assuming 90% efficiency for both conventional and electrical furnaces and 99% efficiency for electrical boilers, further details are given in the next sections.
Furnace electrification
Electric furnaces present significant potential to reduce energy related emissions (Ecofys and Berenschot, 2018). Electricity-based processes can use electric currents (resistance heating) or electromagnetic fields (induction and dielectric) to heat materials. Most of the electrical heating methods can be subdivided into direct (inductive/dielectric) and indirect
(resistance/arc/infrared) heating technologies. Direct technologies generate heat within the target without the need for a heat transfer medium, whereas indirect heating takes place outside the heating target and with the aid of a heat transfer medium (Schuwer, D. and Schneider, C. 2018).
Electric heating is already widely used in industry, however none of the known technologies has been applied yet on refinery processes. The technologies for electrical industrial heating
that were identified with significant potential application in refinery processes are direct and indirect resistance heating and arc heating (communication with specialists from TNO, 2019).
Direct resistance heating is composed by an electric current driven through a material, which heats up due to its electrical resistivity. Indirect resistance heating, instead, is defined by an electric current driven through a resistor, which heats up, and, through convection and radiation it heats up a surrounding fluid or gas. Electric arc systems heat up materials with the generation of a high-density electric current between two electrodes (electric arc). The heated materials can be solids, gases and liquids. This technology is more commonly used in the steelmaking industry; however, it could be applied to the refinery sector in hydrocarbon cracking systems via the Plasma Arc Heating technology (communication with specialists from TNO, 2019).
Considering the technology characteristics of each option and expert consultation, the most relevant one to gas-fired furnaces would be indirect resistance heating. This technology is not available yet on an industrial scale for refinery furnaces, but currently under
development (TRL 3). One of the possibilities to overcome the technology limitation could be a hybrid system with both gas-fired and electric furnaces. Post-combustion capture could be included in this option as well in order to avoid emissions from the furnaces fed with fuel gas.
Regarding the process units explained in section 2.1, those that use gas-fired furnaces are: • Atmospheric distillation
• Vacuum distillation
• Naphtha reforming (Platforming)
• Hydrogen production via steam methane reforming • Hydrocracking
• Thermal cracking/Visbreaking.
Steam generation electrification
Some refineries in the Netherlands produce steam on site via CHP systems and/or auxiliary gas-fired boilers. Similar to gas-fired furnaces, natural gas and fuel gas are employed for the steam production.
Boilers powered by electric resistance are an alternative option to produce steam. Current technologies are able to provide steam up to 350˚C (Berenschot et al., 2017). Electric boilers allow flexible operation and they are available in the market for several design capacities (up to 100 MW) (BZE, 2018). The technology is well established (TRL 9), however, similar to electric furnaces, its economic feasibility and decarbonisation potential tie together with the electricity price and the availability of renewable sources for electricity (Berenschot et al., 2017).
The refineries that produce steam on site are: BP (boilers and CHP), Esso (boilers and CHP), Gunvor (boilers), Shell (CHP) and Zeeland (boilers) (see Table 11). Considering the process units mentioned above, the thermal demand for furnaces and steam generation systems were estimated as presented in Table 7. The potential for thermal demand replacement is around 127.5 PJ for the entire sector. However, more than 64% (81.8 PJ) of this demand is met by fuel gas, for which another application should be considered without bringing additional CO2 emissions.