Bruna Grizzetti , Paul Passy , Gilles Billen , Fayçal Bouraoui, Josette Garnier and Luis Lassaletta
1 European Commission Joint Research Centre (JRC), I-21027 Ispra (VA), Italy 2 CNRS, Metis UMR 7619, Box 123, 4 place Jussieu, F-75005 Paris, France
3 University Pierre et Marie Curie, Metis UMR 7619, Box 123, 4 place Jussieu, F-75005 Paris, France 4 PBL Netherlands Environment Assessment Agency, 3720 A H Bilthoven, The Netherlands
E-mail:bruna.grizzetti@jrc.ec.europa.eu
Keywords: nitrogen retention, integrated nutrient management, GREEN model, RiverStrahler model, SWAT model, water management, Seine river basin
Supplementary material for this article is availableonline
Abstract
Assessing the removal of nitrogen (temporary and permanent) in large river basins is complex due to
the dependency on climate, hydrological and physical characteristics, and ecosystems functioning.
Measurements are generally limited in number and do not account for the full integration of all
processes contributing to nitrogen retention in the river basin. However, the estimation of nitrogen
retention by the ecosystems is crucial to understanding the nitrate water pollution and the N
2O
emissions to the atmosphere, as well as the lag time between the implementation of
agri-environmental measures to reduce nitrogen pollution and the improvement of water quality. Models
have often been used to understand the dynamics of the river basin system. The objective of this study
was to assess nitrogen retention in a large river basin, the Seine basin (∼65 000 km
2, in France),
through the application of three models with different levels of complexity developed for different
specific purposes: the GREEN, SWAT and RiverStrahler models. The study analyses the different
modelling approaches and compares their estimates of water nitrogen retention over an 11-year
period. Then reflexions on the role played by nitrogen retention by aquatic ecosystems in integrated
nutrient management are presented. The results of this study are relevant for the understanding of
nitrogen retention processes at the large river basin scale and for the analysis of mitigation measure
scenarios designed to reduce nitrogen impacts on aquatic ecosystems and climate.
1. Introduction
In the last 150 years humans have altered the natural cycle of nitrogen, introducing a large amount of new reactive nitrogen through the use of synthetic fertili-zers, the expansion of N-fixing crops and the combus-tion of fossil fuel (Galloway et al2002), with a great acceleration in the last 50 years (Lassaletta et al2014). The fate of this new anthropogenic nitrogen in the environment produces a cascade of nitrogen forms and effects (Galloway et al2003, Sutton et al 2011). Once in soils nitrogen from fertilizers is in part used by crops to grow, in part goes back to the atmosphere by ammonia volatilization or through the process of
microbial denitrification, and the remaining part reaches the aquatic system through leaching to groundwater and runoff to surface waters. Waste-waters from human settlements are an additional source of nitrogen pollution for waters (diffuse sources for septic tanks from scattered dwellings and point sources when wastewaters are collected through the sewage system). Water bodies are at the end of this cascade and act as thefinal receptors of large quantities of anthropogenic nitrogen loadings (Billen et al2011). Once in the aquatic ecosystem, this increased amount of nitrogen can produce detrimental effects on the ecosystem and on human health. A high concentration of nitrogen impairs the water resource for drinking
ACCEPTED FOR PUBLICATION 14 May 2015 PUBLISHED 10 June 2015
Content from this work may be used under the terms of theCreative Commons Attribution 3.0
licence.
Any further distribution of this work must maintain attribution to the author(s) and the title of the work, journal citation and DOI.
purposes and contributes to eutrophication, including toxic algal blooms, water hypoxia, fish kills and consequent harm for biodiversity and habitat (Griz-zetti et al2011).
Ecosystems have the capacity to remove nitrogen. The temporary or permanent removal of nitrogen is referred to as nitrogen retention5(Howarth et al1996, Billen et al2011, Howarth et al2012). Before reaching the sea, the anthropogenic nitrogen input to the river basin transits through the continuum formed by soils, ground waters, riparian zones, floodplains, rivers, lakes and estuaries. These systems act as successive fil-ters, where processes of elimination (denitrification or permanent burial in sediments), immobilization, transformation or simply transport take place (Billen et al1991, Bouwman et al 2013). Besides plant and crop uptake, nitrogen retentionfirst takes place in soils (by denitrification in conditions of water saturation and temporary accumulation in organic matter). Then anoxic aquifers can also contribute to retention, through denitrification or accumulation of nitrogen, which is then released to surface waters, at times and through pathways depending on the hydrogeological characteristics. When in the river system, nitrogen moves through the trophic chain of the aquatic ecosys-tem, as described by the spiralling concept (Newbold et al1981, Howard William1985). In the river system, nitrogen can be further retained in the water column by plant uptake, denitrification and sedimentation, but most of the retention processes seem to take place at the interface between water and land in the riparian areas and in the hyporheic zone, which are the areas of contact between water and the river bed (Triska et al1989, Peterson et al2001, Pinay et al2002, Runkel et al2003, Sabater et al2003, Krause et al2011, Pärn et al 2012). All these retention processes along the aquatic continuum permanently remove nitrogen or delay its delivery from the land to the sea.
Nitrogen processes in the aquatic system are quite well understood, but our ability to quantify nitrogen fluxes and removal through the different pathways in the river basin remains partial. Besides estimating total nitrogen retention (see Howarth et al1996and Billen et al2011for regression models linking net anthro-pogenic nitrogen inputs to the delivery at the basin outlet), quantifying the role of different nitrogen pro-cesses and pathways in the river basin is necessary for developing measures to reduce water nitrogen pollu-tion and to understand where and how to act. A crucial aspect is the assessment of diffuse nitrogen emissions to waters and nitrogen retention in the aquatic system. Considering the need to represent many different pro-cesses and the limited possibility of direct measure-ments at the large river basin scale, models can be used
as supporting tools to understand and quantify nutri-entfluxes and pathways in the river basin. However, their application and validation is not trivial, due to the complexity of the processes involved and the scar-city of data.
This paper explores the challenge of assessing water nitrogen retention at the river basin scale com-paring the estimates using three models of increasing complexity: the GREEN model (Grizzetti et al2012), the RiverStrahler model (Thieu et al 2009, Passy et al2013) and the SWAT model (Arnold et al1998), applied to the Seine river basin (France), and discusses the role of nitrogen retention in aquatic ecosystems in the perspective of integrated nutrient management (i.e. a concerted management of all sources and the fate of nutrients in the environment).
2. Methodology
2.1. Comparison of river nitrogen retention
In this study we compared the river nitrogen retention estimated by the three models: GREEN, RiverStrahler and SWAT in the Seine river basin (France). In addition, we considered how the models represent the diffuse nitrogen sources (diffuse inputs to the soils, such as fertilizer application, atmospheric deposition and biological nitrogenfixation); the nitrogen reten-tion in soils, aquifers and wetlands (called land or basin retention); and the diffuse nitrogen emissions to surface waters (here defined as the diffuse nitrogen emissions to the surface water system, after land retention). We analysed the different modelling approaches and compared their estimates of river nitrogen retention over the 1995–2005 period. In this study, river nitrogen retention is defined as the sum of permanent and temporary removal of nitrogen and it is computed as the difference between the long-term annual nitrogen input and output in the surface water system.
Since discrepancies in nitrogen retention assess-ments can derive from the input data used and how the models represent and parameterize the processes involved, to support the analysis we developed three comparative tables describing:
• the characteristic of the model application (table S1);
• the main processes represented by the models (table S2);
• the sources of nitrogen considered, the way they are represented in the model and the source of data used in the three assessments (table S3).
While for the GREEN and RiverStrahler models we could rely on calibrations made in previous studies (Grizzetti et al2012, and Passy et al2013, respectively), extracting and analysing the results for this study, for
5
In the paper the term retention is used to indicate both the temporary retention (such as nitrogen abstracted by burial or other storage) and the permanent removal (such as nitrogen loss by denitrification).
the SWAT model we developed the ad hoc application for this study.
2.2. The area of study
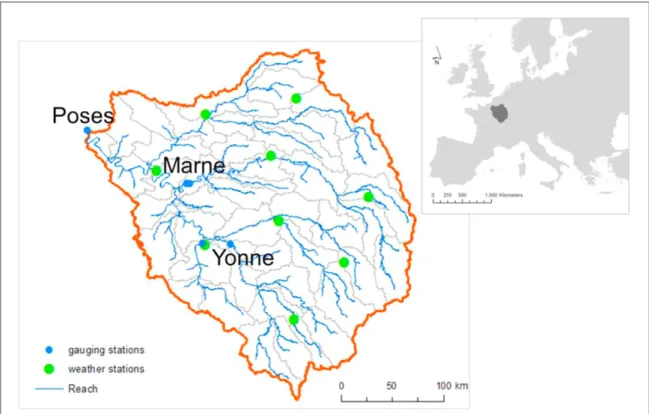
The study area for comparing the estimation of nitrogen retention by the different models is the Seine river basin (figure 1). The Seine basin is located in northern France. It covers an area of 65 000 km2at the entrance of its estuary (at Poses) and the elevation varies between 0 and 900 m. The geology of the basin is dominated by sedimentary formations. Limestone, clay and chalk formations are arranged in concentric rings around the city of Paris. The basin has fertile agricultural soils and it is dominated by arable land (∼53% of the total area). Grasslands (∼10%) and forest (∼25%) are located at the edges of the basin. Urban areas occupy only 7% of the basin. The population density is high (215 inh km−2), with most of the population living in the Paris agglomeration and along the major river corridors. The distribution of precipitation is regular throughout the year, due to the oceanic influence. High discharges are observed in winter and low discharges at the end of summer. The annual mean temperature for the whole basin is about 12 °C. Three main reservoirs were built from 1966 to 1991 in order to reduce winterfloods and to increase summer low-water discharges. The total capacity of the reservoirs is 750 × 106m3. For this study we considered the Seine river basin up to the Poses gauging station, to avoid the influence of the tidal regime (figure1).
2.3. GREEN model
The GREEN model (Grizzetti et al 2008, Grizzetti et al2012) is a conceptual statistical regression model that links nitrogen and phosphorus inputs to water quality measurements. GREEN considers two differ-ent pathways for nutridiffer-ent transfer from sources to the catchment outlet. Diffuse sources of nitrogen, which include applied fertilizer, atmospheric deposition and scattered dwellings, arefirst abated in a lumped way in the inland phase due to crop growth, denitrification, storage, etc, and then retained partially in streams and lakes due to algae growth and atmospheric losses. Point sources of nitrogen, which include discharges from sewers and wastewater treatment plants and industry, are only retained in streams and lakes. A routing structure is used to establish the emitting-receiving sub-basin relationship, where the upstream nitrogen load is added as an additional point source to the receiving downstream sub-basin (table S2, table S3).
The model runs on an annual basis, using sub-basins averaging 180 km2, and was developed to esti-mate nitrogen and phosphorus load to surface water at the European scale. It was calibrated against mon-itored data for 1985–2005 for total nitrogen and total phosphorus for all of Europe (Bouraoui et al2011, Grizzetti et al2012). The calibration provided satisfac-tory results (see paragraph 3.1). For this study we extracted the values relative to the Seine river basin at Poses (figure1). In the GREEN model, the Seine river basin at Poses is discretized into 351 sub-basins. Total nitrogen retention values (annual loads) were con-sidered to compare the models (table S1).
2.4. RiverStrahler model
The RiverStrahler model was developed to understand the dynamics of nutrients (N, P, Si), the trophic chain in the river system and the blooming of the main algal types in the river estuary (Billen et al1994, Garnier et al 1995, Billen and Garnier 1999, Ruelland et al2007). The model describes the physical processes taking place in the water column and in the benthic zone. It includes the phytoplankton as diatoms and non-siliceous algae, bacteria and zooplankton. The river basin is discretized considering the main river axes and draining sub-basins. The stream segments in the sub-basins are lumped in the modelling according to the Strahler order. In the main axes, water quality is modelled at the spatial resolution of 1 km and temporal resolution of 1 h. The results are then produced at the 10-day time step (table S2).
As inputs of nitrogen the model considers point sources and diffuse emissions to the stream from soils. Diffuse emissions are reconstructed based on the water flow measured and the nitrogen concentrations observed in the soil leaching and the aquifer. Waterflow is divided into baseflow and surface runoff (on the basis of the recursivefilter proposed by Eckhardt2008). The spatial concentration of nitrogen in leaching is derived from the soil’s nitrogen balance based on agricultural statistics or measurements (Passy et al2013). The retention of nitro-gen in the aquifer is estimated as the difference between the nitrogen concentration in leaching and the nitrogen concentration measured in aquifers. Diffuse nitrogen emissions are reduced by riparian retention, which depends on a calibrated retention coefficient (Billen and Garnier1999). In-stream processes are not calibrated, as the kinetic parameters are based on experimental obser-vations on the Seine River, and the kinetics of the biogeo-chemical processes are considered universal and only influenced by external forcing, such as temperature, waterflow and nutrient input (table S2, table S3).
The RiverStrahler model was applied for the 1985–2006 period to the Seine river basin (Passy et al2013). The spatial discretization used in the study wasfive main axes and 21 sub-basins, which contains around 3000 separate stream segments (table S1).
2.5. SWAT model
The SWAT model is a physically based model of water and nutrient processes at the river basin scale (Arnold et al 1998). The model is based on the Hydrologic Response Unit (HRU) concept, where a HRU repre-sents the sum of areas with an identical unique slope, soil and land use combination in a sub-basin. The responses of each HRU in terms of water, sediment, and nutrient losses are calculated by the model, then aggregated at the sub-basin level and routed to the catchment outlet through the channel network. SWAT simulates nitrogen cycling and losses in various forms. Nitrogen pathways include surface runoff, sediment, drainage and ground water (table S2).
The spatial discretization used in the SWAT model was 45 sub-basins and 373 HRUs (figure1) (table S1). We developed a map for the land use based on the spa-tial information of the Corine Land Cover data base and the information on agricultural practices by PRA small agricultural regions (PRA, petites régions agricoles) available from INRA (Institut National de la Recherche Agronomique) (Mignolet et al2007, Billen et al2013). We established the major crop rotations per PRA region and we randomly distributed them (respecting the share per region) within the agricultural land reported by Cor-ine Land Cover. The soil map was available from the European Soil Database (ESDB 2004, Panagos 2006, Panagos et al 2012). Climate data were taken from SAFRAN (Système d’Analyse Fournissant des Renseignements Adaptés à la Nivologie, Météo-France), establishing nine weather stations for the simulation (their location is shown infigure1). For point sources from wastewater treatment discharges, we used the data developed by Passy et al (2013) (table S3).
The SWAT model was calibrated over five years (from 2001 to 2005) and validated on the previous period of six years (1995–2000) at the Poses gauging station (figure1). The model performance was also evaluated at two upstream stations, corresponding to two major tri-butaries of the Seine, the Marne (at Gournay-sur-Marne) and the Yonne (at Courlon-sur-Yonne) (figure1). Water flow (Q), nitrate (NO3) and phosphate (PO4)
concentra-tions were simulated using daily values. Annual and monthly loads of NO3and PO4were calculated using the
flow-weighted concentrations according to Maotar and Meybeck (2005, Method 5). For the computation of water nitrogen retention, annual loads of total nitrogen simulated by SWAT were used (but for the model calibra-tion only data on NO3and PO4were available).
2.6. Model performance
The goodness of fitness of the simulations was computed by the coefficient of efficiency E (Nash and Sutcliffe1970), which takes values between one and minus infinite (with one indicating perfect agreement between observations and model simulation, values near zero meaning that the model is equivalent to using the mean of the data, and negative values indicating poor agreement between observations and model simulation), and the coefficient of determina-tion R2 (Bennett et al 2013). For the RiverStrahler model, the performance of the calibration reported by Passy et al (2013) is quantified by the Bravais–Pearson
coefficient of correlation. To quantify and compare the error of the models, we computed the mean absolute relative error (MARE) (Bennett et al2013), using as observations the data used in the respective calibrations (because the models were calibrated using different data sets).
3. Results and discussion
3.1. Modelling performance
The performance of the calibration/validation of the three models is summarized in table S4. It is important to note that the models were calibrated in different contexts and using different data sets. The GREEN model was calibrated at the European scale using annual values of total nitrogen loads: the model performed satisfactorily (E = 0.87 for the basins in the North Sea and Atlantic Sea region), considering the temporal and spatial scale of the application and the data availability. However, the model was not cali-brated specifically for the Seine river basin (table S4). On the other hand, the RiverStrahler model was developed and applied specifically to the Seine river basin, and the processes of nutrient cycling mediated by the biota are described based on laboratory experi-ments andfield observations in the region. For this reason the model is not calibrated but instead validated against the observed data. The model validation for nitrate concentration at the ten-day time step between 1995 and 2005 yielded a Bravais–Pearson coefficient R = 0.11 (significance, 0.05) (Passy et al 2013) (table S4).
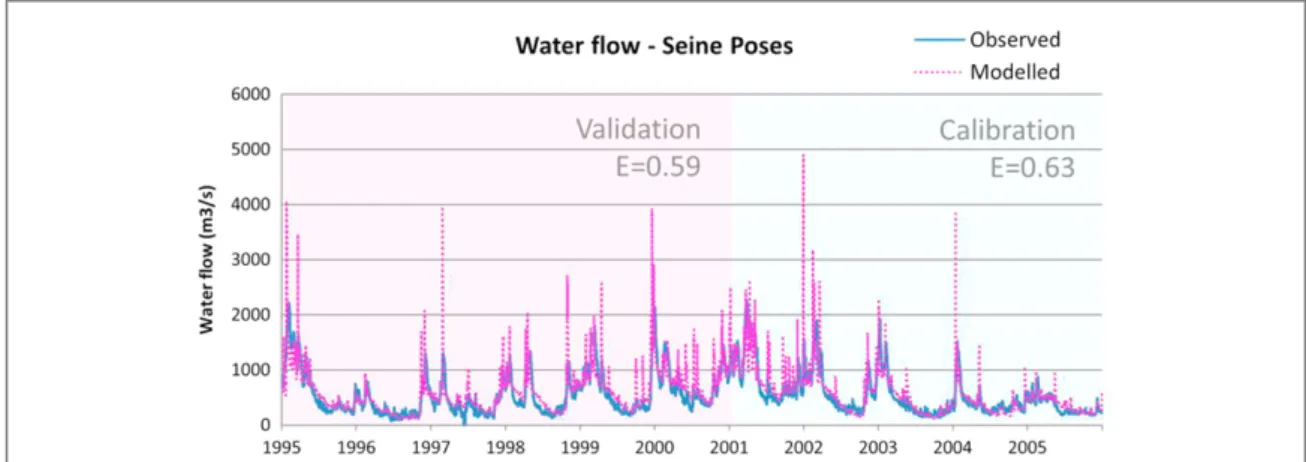
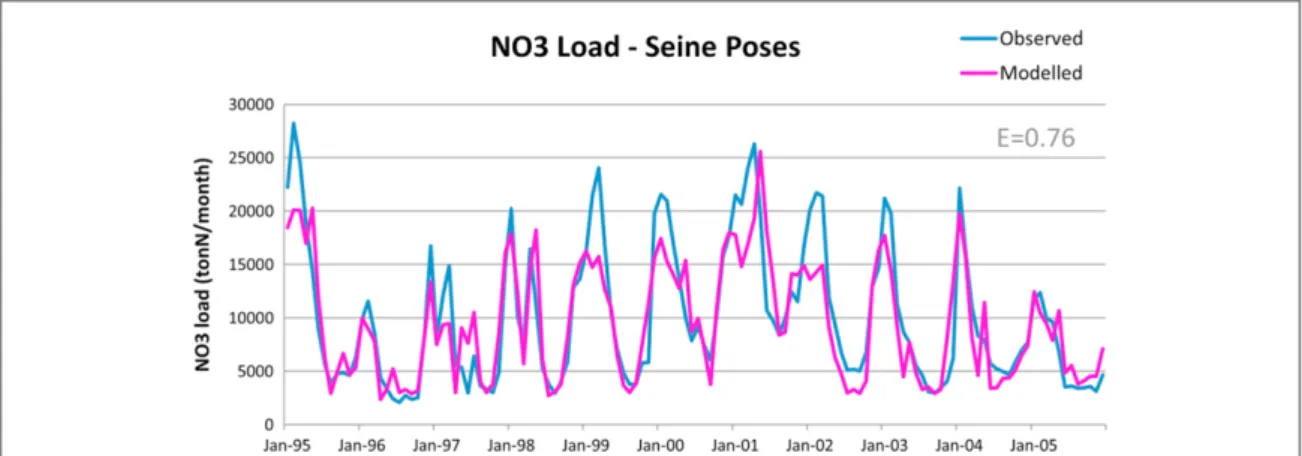
The SWAT model was calibrated specifically for the Seine river basin. For daily waterflow we obtained good agreement between the observed and simulated values at the Poses station, with Nash–Sutcliffe effi-ciency of 0.63 for the calibration and 0.59 for the vali-dation (figure 2). Similarly, we obtained good efficiency for the simulation of the daily water flow in the upstream tributaries of the Marne River (E = 0.49 calibration, E = 0.51 validation) and the Yonne River (E = 0.62 calibration; E = 0.68 validation). Consider-ing water quality, the efficiency of the simulation is good when looking at monthly nitrogen load (E = 0.76,figure3) but lower when looking at the daily concentrations (E < 0 for NO3and E = 0.44 for PO4,
figure S1 in Supplementary Material). The daily simulation of nitrate concentration is poor, but the prediction is within the range of the measured
concentrations. Poor simulations of the daily nutrient concentrations are associated with water peaks or drought (for example, during the 2003 heat wave). This can probably be explained by the influence of the three upstream reservoirs, which were not included in the model simulation and which have an influence in smoothing water peaks and sustaining lowflows. As a whole, the results show that SWAT was able to accu-rately represent the nitrate export and the seasonal variability at a monthly resolution (table S4).
The simulation of the annual nitrogen export from the Seine river basin by the three models is shown in figure4. The simulation performance is quite good for SWAT (E = 0.86) and RiverStrahler (the model does not simulate the waterflow), which were specifically devel-oped on the Seine river basin, while it is much lower for GREEN, which was calibrated at the continental scale using a different data set (different climatology, input sources and calibration data set) (table S4).
3.2. Assessment of nitrogen retention in the Seine river basin
We focus now on comparing how the three models estimate nitrogen retention. To understand nitrogen retention, it is necessary to consider the river basin as a whole and compute the budget of the different input– output fluxes considered in the system. Table S2 describes how the three models represent nitrogen retention andfigure5provides a graphical scheme of the principal components. Table S3 describes the sources of nitrogen considered by the models. In GREEN there is basin retention and river retention (both based on coefficients estimated by the statistical regression). In the RiverStrahler model, retention is estimated separately for riparian areas and for in-stream processes. In SWAT, apart from plant uptake, retention is accounted for in soils, aquifers and rivers, and additional retention can take place in wetlands. We focused our analysis on the retention taking place in the surface waters (in-stream retention), which is explicitly considered by all three models. We com-pared the nitrogenfluxes and retention in the Seine Figure 2. Results of daily waterflow validation (1995–2000) and calibration (2001–2005) for the SWAT model at the Poses gauging station (blue, observed values; pink, the model simulation).
river basin according to the three models, using the average values for the 1995–2005 period (figure 6). The diffuse emissions from land to surface waters were estimated at 13, 16 and 18 kgN ha−1yr−1, by GREEN, RiverStrahler and SWAT, respectively, whereas the point sources amounted to 6, 8 and 8 kgN ha−1yr−1, respectively. The annual in-stream retention was estimated 5, 3 and 2 kgN ha−1yr−1 by the GREEN,
RiverStrahler and SWAT models, respectively. The nitrogen river retention represents between 8% and 26% of the total load entering the river, which is in the range estimated by other studies (5–20% Howarth et al 1996; 30% Bouwman et al 2005). To judge whether the differences in the estimations of the component of the budget between the three models are significant, the uncertainty of the model predictions Figure 3. Results of monthly nitrate (NO3) loads observed (blue) and simulated by the SWAT model (pink) at the Poses gauging
station.
Figure 4. Simulation of annual nitrate (NO3) and total nitrogen (totN) loads observed (grey) and simulated by the GREEN (green),
RiverStrahler (pink) and SWAT (orange) models, at the Poses gauging station.
Figure 5. Scheme of the nitrogen retention in the three models considered in this study: GREEN (left), RiverStrahler (centre) and SWAT (right).
and the sensitivity to the model parameters should be considered for each model. In this study we did not perform an uncertainty and sensitivity analysis. We computed the MARE to have an indication of the error of the models in the annual predictions of nitrogen load (table S4). The RiverStrahler and SWAT error is about 10%, while for GREEN it is around 40%. In RiverStrah-ler the error is relative only to nitrogen concentration because waterflow is not simulated, while in SWAT it also includes the simulation of waterflow.
However, considering that N2O emission from the
Seine river network was estimated at 100–200 103kgN yr−1(Garnier et al2013) and that N2O emission
may account for up to 1–20% of the nitrogen lost by denitrification (Garnier et al2009, Garnier et al2013, Garnier et al 2014), an estimate of the nitrogen total removal by denitrification in the Seine river network could be 0.1–3.1 kgN ha−1.6This is coherent with the
model estimates for river retention found in this study, which also include other nitrogen removal processes.
Then we looked at the temporal variation of the nitrogen retention estimated by the three models from 1985 to 2005 for GREEN and RiverStrahler and from 1995 to 2005 for SWAT (figure7). Interestingly, the three models highlighted two components of the retention in waters: one component, which is quite stable, related to the in-stream processes, and a second component, which varies with the water flow, that seems to be more related to processes occurring at the interface between land and water (riparian areas). In the GREEN model these two components are accoun-ted for together in river retention (table S2) and in fact when the annual water discharge is low, the results of the GREEN model are close to those of the River-Strahler and SWAT models. In RiverRiver-Strahler the two components are separate. The retention related to in-stream processes is quite stable or even decrease dur-ing high-water discharge, while the retention takdur-ing place in riparian areas is correlated to water discharge (in SWAT the option of wetland retention was not used for this study). In SWAT in-stream retention appears to be related to water flow, although it is Figure 6. Nitrogenfluxes and retention in the Seine river basin according to the three models considered in this study: GREEN (left), RiverStrahler (centre) and SWAT (right). Values are expressed in kgN ha−1and are annual average values for 1995–2005.
Figure 7. Temporal variation of river nitrogen retention (tonN yr−1) estimated by the three models considered in this study: GREEN (green), RiverStrahler (pink) 1985–2005 and SWAT (orange), for 1995–2005 at the Poses gauging station. The secondary axis shows the annual averageflow (m3s−1).
6
Emissions take place only in the river network but are normalised by the surface of the study area (65000 km2) to make the value
comparable to the nitrogen fluxes described in the budget in figure 6.
generally lower than in GREEN and RiverStrahler. A possible explanation for this is that SWAT does not consider the denitrification in the water column. 3.3. Challenges in assessing nitrogen retention in river basins
Understanding the underpinning processes and quan-tifying nitrogen retention are key challenges in nitro-gen and water management at the river basin scale. First, the amount of nitrogen retained is significant (in the Seine it is estimated to range from 8 to 26% of the nitrogen entering the river system). Second, retention plays an ambiguous role, because it is in part permanent (by denitrification and sediment burial) and in part temporary, which means only a time lag between sources and impacts. Third, even the permanent removal of nitrogen by denitrification is difficult to assess (uncertainty in measurements) and in addition it presents a number of negative environmental effects, since together with N2, N2O,
which is a powerful greenhouse gas, is released into the atmosphere.
The nitrogen budget of agricultural soil can be cal-culated to estimate pressures on soils (de Vries et al2011, Lassaletta et al2012), but direct measure-ments of nitrogen emissions to surface water are not possible at the river basin scale. They are estimated through modelling but there is the uncertainty of the model’s representation of nitrogen retention and in the estimation of point and diffuse sources of nitrogen (input data). Therefore, modelling includes an inher-ent risk of compensation between the model estima-tion of nitrogen retenestima-tion before entering the river system and once in the surface waters. Comparing dif-ferent models has the advantage of providing insight into the estimates of these two components of nitro-gen retention in the river basin and in nitro-general con-tributes to the validation of the models’ estimates (ensemble modelling, Grizzetti et al 2005, Hejzlar et al2009, Kronvang et al2009).
Similarly, the role of groundwater in storing and releasing nitrogen to the water system is important and at the same time extremely difficult to assess, both because of lack of data and knowledge about aquifer parameterization (e.g. residence time) at the river basin scale (this has not been developed in this study). Further modelling of the unsaturated zone is also required (Ledoux et al2007, Flipo et al2012). The risk of a time lag in the delivery of nitrogen pollution in the aquatic ecosystems has already been shown in several studies in Europe (Jackson et al2008, Howden and Burt2008, Bouraoui and Grizzetti2011).
The ability to distinguish between permanent and temporary removal of nitrogen is a major difficulty in modelling nitrogen retention at the river basin scale. This depends on the detail and resolution in the repre-sentation of physical and biological processes. In addi-tion, key processes, such as retention in riparian areas
or in aquifers, are estimated mainly by retention coef-ficients, which limits our capacity to represent possible delays in nitrogen diffuse emissions to the aquatic sys-tem. However, to make the models applicable at large scales, a certain trade-off between detail representa-tion and simplificarepresenta-tion of all processes is necessary. Comparing different models can inform on the robustness of some estimations based on a simplified representation of the processes. This is the case of the GREEN model compared to the RiverStrahler and SWAT models.
The availability of experiments andfield measure-ments remains fundamental to understand the pro-cesses and calibrate the models, especially those related to ecological processes. This applies for mea-surements of denitrification as well as nitrogen con-centrations and loads in aquifers and rivers. For these reasons environmental monitoring should remain a priority together with water transfer modelling at the interfaces (Flipo et al2012).
3.4. Retention and integrated nutrient management The nitrogen cascade of forms and effects results from the interactions between human actions and ecosys-tem processes. Understanding the nitrogen pressures on waters, where the sinks of nitrogen are located, whether their removal is temporary or permanent, and the actual retention capacity of the aquatic system is important for analysing the impacts of nitrogen on waters and targeting remediation measures to protect and improve the quality of the water resource (Vagstad et al 2009, Bouraoui and Grizzetti 2014). Since nitrogen retention can take place from soils to ground-water to rivers, from upstream to downstream, and it is influenced by the biogeochemical and hydrological conditions, its estimation requires a comprehensive approach including the whole river basin continuum. The complexity of the processes and the spatial and temporal scales involved call for an integrated approach in the analysis and management of nitrogen, and more generally of nutrients. With the term ‘integrated nutrient management’ we imply that human policies influencing nutrient use and the effects on humans and ecosystems are considered concur-rently, and that management is based on a coherent assessment of sources and impacts. As nitrogen and other nutrients exert their final effects on the aquatic ecosystems, affecting the water resource, an integrated nutrient management policy is necessary, complementing the concepts of integrated water management.
The three models compared in this study are widely used in Europe and in the world to analyse nitrogenfluxes in large river basins, linking sources, pathways and impacts (Bouraoui et al2014, Gassman et al2014, Lee et al2015). The RiverStrahler model is at the core of the operational tool SENEQUE-River-Strahler used by the Seine river basin’s water agency
the European Union, this is relevant to the implementa-tion of the Water Framework Directive, which foresees the submission of the second River Basin Management Plans by Member States by 2015.
Adopting an integrated nutrient management per-spective would reduce the negative effects of the excess of nitrogen on the aquatic ecosystem and the water resource, taking into account the realistic capacity of the ecosystem to remove nitrogen, with a parallel esti-mation of greenhouse gas emissions (thereby avoiding pollution swapping between water and the atmo-sphere, and between soils and water). This perspective could offer a more complete context for cost–benefit valuation of policy options. For example, profits from agriculture could be weighted by the losses in human and ecosystem health related to water and air pollution (van Grinsven et al 2013). A reduction of nitrogen input could benefit the environment and water resources in a way that compensates much more the losses from agricultural activities and this could be more visible in an integrated approach which analyses all of the system’s components.
At the scale of large river basins, the integrated esti-mation of nitrogen fluxes and pathways that con-tribute to emissions to waters and the atmosphere is made possible by modelling tools, such as those dis-cussed herein, but the model’s reliability in describing thefluxes and pathways cannot be directly checked against observed data, because measurements are not available at the river basin scale and the nitrogen cas-cade is only rarely documented simultaneously. For this reason the benchmarking of model assessments, such as the comparison of nitrogen river retention presented in this study, can help understand the esti-mations of the different models and offer the opportu-nity to compare the results, the areas of agreement, disagreement and uncertainty, and to identify where further investigation is needed.
4. Conclusion
To support integrated nutrient and water manage-ment, quantifying the nitrogenflow and retention at the river basin scale is in our opinion fundamental for developing coherent policies to target measures to
remove nitrogen. The comparison of the different assessments can help understand the contribution of the different compartments of the system. Never-theless, the models’ estimations include uncertainty and in all models key processes, such as the retention in riparian areas or the retention in aquifers, are esti-mated mainly by retention coefficients. This still limits our capacity to represent possible delays in nitrogen diffuse emissions to the aquatic system. In addition, these retention coefficients are usually calibrated and might then be used as compensation factors for under-or over-estimation of nitrogen transfunder-ormation and transport by other processes. The comparison of mod-els (ensemble modelling) used in this study is a coher-ent way of quantifying nitrogen retcoher-ention in water systems, indicating a potential range of variation by three independent models.
The integration of all processes in the river basin, the possible lag time between nitrogen sources and impacts, and the difficulty in separating temporary and permanent nitrogen removal, and the associated N2O emissions to the atmosphere, remain critical
aspects and a source of uncertainty in integrated nitro-gen assessments, and future research should focus in these specific areas.
Acknowledgments
The authors would like to thank Vincent Thieu for providing point source data for the Seine river basin and the four anonymous reviewers for their helpful comments.
References
Arnold J G, Srinivasan R, Muttiah R S and Williams J R 1998 Large area hydrologic modeling and assessment: I. Model development J. Am. Water Resour. Assoc.34 73–89
Bennett N D et al 2013 Characterising performance of environmental models Environ. Modelling Softw.40 1–20
Billen G, Callens J, Beaudoin N, Viennot P, Schott C, Anglade J, Benoit M, Curie F and Garnier J 2013 Caractérisation des pressions agricoles et modélisation de leurs effets en matière de contamination azotée de l’hydrosystème à l’échelle du territoire Seine Normandie Programme PIREN-Seine Rapport d’Activité 2012: Agriculture, Février 2013 p 30 (www.sisyphe.upmc.fr/piren/?q=webfm_send/1169) (in French)
Billen G et al 2011 Nitrogenflows from European regional watersheds to coastal marine waters The European Nitrogen Assessment ed M A Sutton et al (New York: Cambridge University Press) pp 271–97
Billen G and Garnier J 1999 Nitrogen transfers through the Seine drainage network: a budget based on the application of the ‘Riverstrahler’ model Hydrobiologia410 139–50
Billen G, Garnier J and Hanset P 1994 Modelling phytoplankton development in whole drainage networks: the
RIVERSTRAHLER model applied to the Seine river system Hydrobiologia289 119–37
Billen G, Lancelot C and Meybeck M 1991 N, P, and Si retention along the aquatic continuum from land to ocean. Ocean margin processes in global change Dahlam workshop (Berlin, 1990) pp 19–44
Bouraoui F and Grizzetti B 2011 Long term change of nutrient concentrations of rivers discharging in European seas Sci. Total Environ.409 4899–916
Bouraoui F and Grizzetti B 2014 Modelling mitigation options to reduce diffuse nitrogen water pollution from agriculture Sci. Total Environ.468–469 1267–77
Bouraoui F, Grizzetti B and Aloe A 2011 Long term nutrient loads entering European Seas. EC-JRC Report EUR 24726 EN (Luxembourg) p 82
Bouraoui F, Thieu V, Grizzetti B, Britz W and Bidoglio G 2014 Scenario analysis for nutrient emission reduction in the European inland waters Environ. Res. Lett.9 125007
Bouwman A F, Bierkens M F P, Griffioen J, Hefting M M, Middelburg J J, Middelkoop H and Slomp C P 2013 Nutrient dynamics, transfer and retention along the aquatic continuum from land to ocean: towards integration of ecological and biogeochemical models Biogeosciences10 1–23
Bouwman A F, Van Drecht G, Knoop J M, Beusen A H W and Meinardi C R 2005 Exploring changes in river nitrogen export to the world’s oceans Glob. Biogeochem. Cycles19 1–14
de Vries W, Leip A, Reinds G J, Kros J, Lesschen J P and
Bouwman A F 2011 Comparison of land nitrogen budgets for European agriculture by various modeling approaches Environ. Pollut.159 3254–68
Doyle W M, Stanley E H and Harbor J M 2003 Hydrogeomorphic controls on phosphorus retention in streams Water Resour. Res.36 HWC11–CW117
Eckhardt K 2008 A comparison of baseflow indices, which were calculated with seven different baseflow separation methods J. Hydrol.352 168–73
ESDB 2004 The European Soil Database distribution version 2.0, European Commission and the European Soil Bureau Network, CD-ROM, EUR 19945 EN
Flipo N, Monteil C, Poulin M, de Fouquet C and Krimissa M 2012 Hybridfitting of a hydrosystem model: long-term insight into the Beauce aquifer functioning (France) Water Resour. Res.48 W05509
Galloway J, Cowling E, Oenema O, Roy R and Smil V 2002 Response to the comment by Artur Grandstedt Ambio 31 497–8 Galloway J N, Aber J D, Erisman J W, Seitzinger S P, Howarth R W,
Cowling E B and Cosby B J 2003 The nitrogen cascade BioScience53 341–56
Garnier J, Billen G and Coste M 1995 Seasonal succession of diatoms and chlorophyceae in the drainage network of the seine river: observations and modeling Limnol. Oceanogr.40 750–65
Garnier J, Billen G, Martinez A, Mounier E, Silvestre M,
Vilain G and Toche F 2009 Nitrous oxide (N2O) in the Seine
river and basin: observations and budgets Agric. Ecosyst. Environ.133 223–33
Garnier J, Vilain G, Jehanno S, Silvestre M, Billen G, Poirier D, Martinez A, Decuq C, Cellier P and Abril G 2013 Budget of methane emissions from soils, livestock and the river network of the Seine basin (France) Biogeochemistry116 199–214
Garnier J et al 2014 Curative versus preventive management of nitrogen transfers in rural areas: lessons from the case of the orgeval watershed (Seine river basin, France) J. Environ. Manage.144 125–34
Gassman P W, Sadeghi A M and Srinivasan R 2014 Applications of the SWAT model special section: overview and insights J. Environ. Qual.43 1–8
Grizzetti B, Bouraoui F and Aloe A 2012 Changes of nitrogen and phosphorus loads to European seas Glob. Change Biol.18 769–82
Grizzetti B, Bouraoui F, Billen G, van Grinsven H, Cardoso A C, Thieu V, Garnier J, Curtis C, Howarth R and Jones P 2011 Nitrogen as a threat to European water quality The European Nitrogen Assessment ed M Sutton et al (Cambridge: Cambridge University Press)
Grizzetti B, Bouraoui F and De Marsily G 2005 Modelling nitrogen pressure in river basins: a comparison between a statistical approach and the physically-based SWAT model Phys. Chem. Earth30 508–17
Grizzetti B, Bouraoui F and De Marsily G 2008 Assessing nitrogen pressures on European surface water Glob. Biogeochem. Cycles
22 GB4023
Hejzlar J et al 2009 Nitrogen and phosphorus retention in surface waters: an inter-comparison of predictions by catchment models of different complexity J. Environ. Monit.11 584–93
Howard-William C 1985 Cycling and retention of nitrogen and phosphorus in wetlands: a theoretical and applied perspective Freshwater Biol.15 391–431
Howarth R, Swaney D, Billen G, Garnier J, Hong B, Humborg C, Johnes P, Mörth C-M and Marino R 2012 Nitrogenfluxes from the landscape are controlled by net anthropogenic nitrogen inputs and by climate Frontiers Ecol. Environ.10 37–43
Howarth R W et al 1996 Regional nitrogen budgets and riverine N and Pfluxes for the drainages to the North Atlantic ocean: natural and human influences Biogeochemistry35 75–139
Howden N J K and Burt T P 2008 Temporal and spatial analysis of nitrate concentrations from the Frome and Piddle catchments in Dorset (UK) for water years 1978–2007: evidence for nitrate breakthrough? Sci. Total Environ.407 507–26
Jackson B M, Browne C A, Butler A P, Peach D, Wade A J and Wheater H S 2008 Nitrate transport in chalk catchments: monitoring, modelling and policy implications Environ. Sci. Policy11 125–35
Krause S, Hannah D M, Fleckenstein J H, Heppell C M, Kaeser D, Pickup R, Pinay G, Robertson A L and Wood P J 2011 Inter-disciplinary perspectives on processes in the hyporheic zone Ecohydrology4 481–99
Kronvang B et al 2009 Ensemble modelling of nutrient loads and nutrient load partitioning in 17 European catchments J. Environ. Monit.11 572–83
Lassaletta L, Billen G, Grizzetti B, Garnier J, Leach A M and Galloway J N 2014 Food and feed trade as a driver in the global nitrogen cycle: 50-year trends Biogeochemistry118 225–41
Lassaletta L, Romero E, Billen G, Garnier J, García-Gómez H and Rovira J V 2012 Spatialized N budgets in a large agricultural Mediterranean watershed: high loading and low transfer Biogeosciences9 57–70
Ledoux E, Gomez E, Monget J M, Viavattene C, Viennot P, Ducharne A, Benoit M, Mignolet C, Schott C and Mary B 2007 Agriculture and groundwater nitrate contamination in the Seine basin. The STICS-MODCOU modelling chain Sci. Total Environ.375 33–47
Lee T P Q, Billen G and Garnier J 2015 Long-term biogeochemical functioning of the Red River (Vietnam): past and present situations Reg. Environ. Change15 329–39
Mignolet C, Schott C and Benoit M 2007 Spatial dynamics of farming practices in the Seine basin: methods for agronomic approaches on a regional scale Sci. Total Environ.375 13–32
Moatar F and Meybeck M 2005 Compared performances of different algorithms for estimating annual nutrient loads discharged by the eutrophic River Loire Hydrol. Process.19 429–44
Nash J E and Sutcliffe J V 1970 Riverflow forecasting through conceptual models J. Hydrol.10 282–90
Peterson B J et al 2001 Control nitrogen export, from watersheds by headwater streams Science292 86–90
Pinay G, Clément J C and Naiman R J 2002 Basic principles and ecological consequences of changing water regimes on nitrogen cycling influvial systems Environ. Manage.30 481–91
Ruelland D, Billen G, Brunstein D and Garnier J 2007 SENEQUE: a multi-scaling GIS interface to the Riverstrahler model of the biogeochemical functioning of river systems Sci. Total. Environ.375 257–73
third order stream in northwestern California: hyporeic processes Ecology70 1893–1905
Vagstad N et al 2009 Comparative study of model prediction of diffuse nutrient losses in response to changes in agricultural practices J. Environ. Monit.11 594–601
van Grinsven H J M, Holland M, Jacobsen B H, Klimont Z, Sutton M A and Willems W J 2013 Costs and benefits of Nitrogen for Europe and implications for Mitigation Environ. Sci. Technol.47 3571–9