Contact: J.A. Annema
MNP Ruimte, Infrastructuur en Mobiliteit Jan-Anne.Annema@mnp.nl
This research is carried out by order of the Dutch Ministry of Transport, Public Works and Water Management, MNP project nr. 773002/01
Report 773002028/2005
Effectiveness of the EU White paper:
‘European transport policy for 2010’
J.A. Annema
Rapport in het kort
Effectiviteit van de EU ‘White Paper: European transport policy for 2010’
In dit rapport worden de potentiële milieu-effecten van de White Paper geëvalueerd door in te zoomen op drie onderwerpen: ‘modal shift’- voorstellen, prijsbeleid en beleid om alternatieve brandstoffen te gaan toepassen in transport. De ‘modal shift’- voorstellen leiden op Europese schaal nauwelijks tot milieuverbeteringen; modal shift lijkt een effectiever middel om in stede-lijk gebied milieuwinst te behalen. De voortgang in prijsbeleid is langzaam, maar prijsbeleid kan in principe wel tot positieve milieu-effecten leiden. Het beleid om te komen tot alternatieve brandstoffen heeft op lange termijn milieu-potentie. Alternatieve brandstoffen zijn vooralsnog duur.
Trefwoorden: EU-transportbeleid, milieu-effecten, modal shift, prijsbeleid, alternatieve brandstoffen
Abstract
Effectiveness of the EU White paper: ‘European transport policy for 2010’
The possible environmental effects of policy proposals in the White Paper are evaluated by focusing on three main subjects in the Paper: a) modal shift and cleaner urban transport policy proposals, b) pricing and c) alternative fuels. A recent European research program has shown that policy scenarios, including White Paper modal shift measures (targeted investments in rail and inland waterways), fail to result in modal shift effects in passenger transport on a European level, while the modal shift impacts in freight transport on a European level are very modest. Modal shift as a way of achieving environmental benefits seems to be more promising on an urban level. Currently, the progress in restructuring charges towards better internalization of external costs in the EU is slow. Model studies show that marginal cost-pricing schemes in Europe, like proposed in the White Paper, could result in overall welfare gains and environmental improvements. Recent studies show that biofuels and hydrogen offer potential for a transport system with lower CO2 emissions and, in the case of hydrogen and natural gas, lower urban air polluting emissions. However, alternative fuels are, at present, expensive.
Key words: EU transport policy, environmental impacts, modal shift, pricing policy, alternative transport fuels
Preface
In preparing this report at the request of the Dutch Ministry of Transport and Public Works and Water Management, we used much data and information from the European Environment Agency’s (EEA) high quality TERM fact sheets (Transport and Environment Reporting Mechanism). The EEA also provided valuable comments on the first draft. Staff members of the Ministry of Transport and the Ministry of Environment and colleagues of the Netherlands Environment Assessment Agency (MNP RIVM) contributed important comments as well. I would like to thank them.
The Netherlands Environment Assessment Agency (MNP RIVM) assumes the sole responsibili-ty for the contents of this report
Contents
Summary 7 Samenvatting 11 1. Introduction 13 2. Modal shift 15 2.1 Introduction 15 2.2 Trends 1990 - 2004 152.3 Modal shift and modal shift case studies 19 2.4 Specific studies on environmental impact of modal shift 21
2.5 Conclusions and discussion 22
3. Pricing policy proposals 25
3.1 Introduction 25
3.2 Trends 1990 – 2004 25
3.3 Pricing policy scenario studies and specific case studies 26
3.4 Conclusions and discussion 30
4. Alternative fuel policy and clean urban transport proposals 33
4.1 Introduction 33
4.2 Trends 1990 – 2004 33
4.3 Studies on potentials and costs of alternative fuels 37 4.4 Civitas 41
4.5 Conclusions and discussion 42
References 45
Appendix 1 47
Appendix 2 49
Appendix 3 51
Summary
The aim of the study recorded here was to support the Joint Expert Group on Transport and Environment (JEGTE)1 in their review process of the environmental impact of the White Paper
-European transport policy for 2010: time to decide.
The Dutch Ministry of Transport, a member of the JEGTE, asked the MNP RIVM to evaluate the possible environmental effects of the policy proposals in the White Paper by focusing on three main subjects in the White Paper: a) modal shift and cleaner urban transport policies, b) pricing and c) alternative fuels. To be clear, this evaluation is not about stock-taking specific policy proposals and evaluating the exact state of affairs with these proposals. This report takes a look at general European transport and environmental trends and the (likely) effect of the White Paper in realizing a favourable change in these trends.
a) Modal shift and cleaner urban transport policies
White Paper infrastructure proposals induce hardly any modal shift on a European level At the heart of the White Paper is a desired modal shift from road and air to rail and inland waters. Modal shift is seen in the White Paper as an important way to meeting economic, social and environmental goals. A recent European research program (TEN-STAC) has shown that policy scenarios, including White Paper modal shift measures (targeted investments in rail and inland waterways), fail to result in modal shift effects in passenger transport on a European level, while the modal shift impacts in freight transport on a European level are very modest. The environmental impact expressed in fewer emissions of the shift observed in this research program is very small. The study reveals that if other environmental impacts of new infrastruc-tures (e.g. dedicated freight rail lines) are taken into account (e.g. noise and adverse impacts on nature/landscapes), it is not at all certain if the modest modal shift observed in this White Paper policy scenario will be beneficial to the environment.
Modal shift on an urban level more promising
Increased traffic and urban congestion are noted in the White Paper to result in more air and noise pollution and accidents. The Commission promotes in the White Paper ‘good urban prac-tice’: more and better public transport in urban areas. Recent urban European research programs (Transecon, PROPOLIS) show that if economic, social and environmental goals are to be pursued in urban areas, it would seem especially effective to use the White Paper investment proposals in better public transport in combination with such other instruments as pricing policy (as proposed in the White Paper) and pollution source policy. Policy mixes like this could result in, for example, the desired modal shift from car to public transport and bicycles, one of the impacts contributing to urban social, economic and environmental benefits.
Modal shift is a confusing policy indicator
The analysis in this report shows the modal shift indicator/aim to be a confusing one. On one hand it is not certain that modal shift policy proposals have an effect on modal shift and are beneficial to the environment. On the other hand, this does not mean that all White Paper modal shift proposals are ‘bad’ policies per se. For example, investing in a specific dedicated freight rail line could result in hardly any modal shift. The investment may nevertheless be beneficial to the economy. One implication of the confusing character of the modal shift indicator could be to abandon the general modal shift aims. It would seem clearer to design and evaluate transport
policy proposals directly on their possible contributions to meeting desired economic, social and environmental end goals using techniques like societal cost-benefit analysis and strategic environmental impact analysis.
b) Pricing
Pricing policy proposals: progress is slow….
The aim of the Commission with respect to pricing, as stated in the White Paper, is that if appro-priate pricing and infrastructure policies were to be pursued, transport inefficiencies - e.g. congestion, pollution and accidents - would largely disappear over time. Currently, the progress in restructuring charges towards better internalization of external costs in the EU is slow. London has introduced a pricing scheme for congestion to improve the accessibility of the city centre. In France, Spain Portugal, Italy and Greece related toll charges apply to large parts of the motorways network. Despite many delays, kilometre charging for heavy duty vehicles on German motorways has started per 1 January 2005. There is no progress in adopting the White Paper proposal of aviation pricing.
…but pricing seems to be an effective policy
Limited empirical evidence (the London charging system) shows that pricing policies in inner cities can reduce congestion and emissions (10 to 20% in the charging zone). European pricing model studies (IASON, MC-ICAM) show that marginal cost-pricing schemes in Europe could result in overall welfare gains and in environmental improvements. Depending on the exact de-sign of the transport pricing system, CO2 emission reductions are reported of 1 - 3% to 8 - 16%
on a national level. Highest environmental impacts are reported for pricing system with full internalization of external transport costs, so charges which are differentiated with respect to mode, location, time, vehicle characteristics and so on.
c) Alternative fuels
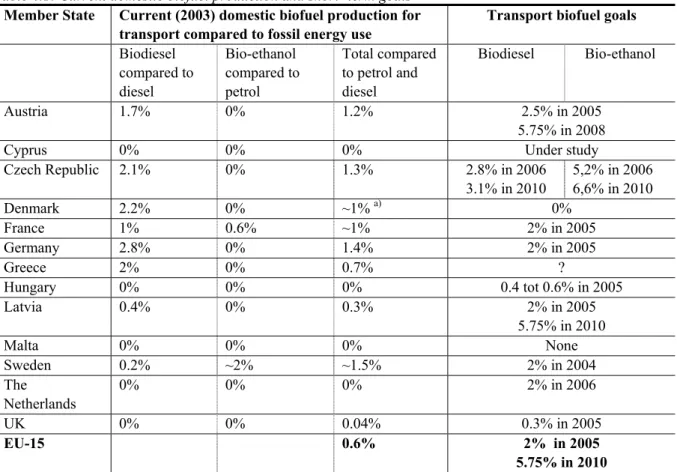
Alternative fuels promising lower-emission alternatives, but expensive
The Commission sees biofuels in the short and medium term, compressed natural gas (CNG) in the medium and long term and hydrogen in the very long term as lower-emission alternatives, and as means to make transport less dependent on oil. Studies show that biofuels and hydrogen offer indeed potential for a transport system with lower CO2 emissions and, in the case of hydro-gen and CNG, lower urban air polluting emissions.
The studies indicate that hydrogen from non-fossil sources (biomass, wind, nuclear) offer low overall greenhouse gas emissions, but renewable sources of hydrogen have limited potential as yet and are at present (very) expensive. So, the Commission seems right to consider hydrogen only in the very long term as a lower-emission alternative. CNG shows (very) low impact poten-tials on emissions of urban air pollutants. However, studies indicate that cost-benefit analysis seems required to evaluate if these benefits outweigh the costs compared to other solutions to improve urban air quality (like further innovations in conventional combustion engines). Recent studies show that the CO2 cost-effectiveness of biofuels is poor. From these studies it can be
concluded that due to competing land use, biofuels from agricultural biomass can probably only substitute a small portion of fossil fuels. The studies indicate also that it may be cost-effective to meet the White Paper aims of less oil dependency and lower CO2 emission by using biomass in
other sectors than the transport sector.
A policy strategy to tackle the climate change problem, and to reduce oil dependency would be to implement the White Paper pricing policy of ‘getting the pricing right’ (including a CO2
emis-sion levy) with more force on or implementation of an international system of tradable CO2
permits including transport. This could be combined with a gradual implementation of stricter emission standards for air-polluting substances for new vehicles. This policy strategy could lead to a full range of complementary solutions in transport: investing in alternative fuels (in or out-side the transport sector), investing in more fuel-efficient vehicle technology, investing in cleaner conventional technology improvements or, in the case of tradable permits, in buying cheaper emission reductions outside the transport sector or investing in all of these options. Recent scientific literature indicates that it would be useful for governments (as proposed in the White Paper) to continue the support of R&D in vehicle and fuel technologies currently conside-red ‘expensive’ and to continue small-scale demonstration projects of these new technologies, as in the Civitas and CUTE initiatives (both EU demonstration programs). For example, future grassy- or woody-based biomass may be much more cost-effective than the current biomass options. By funding R&D and small-scale demonstration projects, governments can show that clean technology could work in the future.
Samenvatting
Het doel van deze studie is het ondersteunen van de ‘Joint Expert Group on Transport and En-vironment’ (JEGTE)2 in hun review van de milieu-effecten van de EU White Paper - European
transport policy for 2010: time to decide. In dit rapport worden de potentiële milieu-effecten van
de White Paper geëvalueerd door in te zoomen op drie hoofdonderwerpen uit de Paper: a) modal shift en ‘schoon’ stadsvervoer, b) prijsbeleid, c) alternatieve brandstoffen.
Modal shift: geen effecten op Europees niveau, mogelijk wel effectief op stedelijk niveau Het hart van de White Paper vormt de wens tot ‘modal shift’ (verschuivingen in het gebruik van vervoerswijzen) van weg en lucht naar rail en water. De EU hoopt dat met modal shift econo-mische, sociale en milieudoelen dichterbij komen. Een recent Europees onderzoeksprogramma (TEN-STAC) laat zien dat beleidsscenario’s, inclusief de modal-shift beleidsvoor-stellen uit de White Paper, er niet in slagen op Europese schaal modal shift te bewerkstelligen in personenvervoer, terwijl de effecten op de verdeling van vervoerwijzen in het goederenvervoer zeer beperkt zijn. De emissie-effecten van de verschuiving zijn zeer klein. Modal shift lijkt een effectiever middel om in stedelijk gebied milieuwinst te behalen. Recent Europees onderzoek toont aan dat als economische, sociale en milieudoelen worden nagestreefd in stedelijk gebied, het vooral effectief is om het instrument van investeren in het openbaar te vervoer te combineren met prijsbeleid en bronbeleid.
Prijsbeleid: weinig voortgang maar in principe effectief
Het doel van de Europese Commissie met prijsbeleid is om transportinefficiënties - zoals con-gestie, milieuvervuiling en ongelukken - te laten verdwijnen. Op dit moment is de voortgang van Europees prijsbeleid in transport langzaam. In de luchtvaart is de voortgang zelfs nul. Model-studies laten zien dat het doorberekenen van de marginale kosten in de prijs van vervoer, zoals voorgesteld in de White Paper, kan resulteren in welvaartswinst, inclusief milieuwinst.
Alternatieve brandstoffen hebben milieu-potentie maar zijn vooralsnog duur
De Europese Commissie ziet biobrandstoffen op de korte en middellange termijn als middelen om emissies van transport te reduceren en om verkeer en vervoer minder afhankelijk te laten zijn van olie. Dit geldt ook voor aardgas op de middellange en voor waterstof op de lange termijn. Recente studies laten dat de alternatieve brandstoffen milieupotentie hebben, maar ze zijn, vooralsnog, (zeer) duur. De wetenschappelijke literatuur geeft aan dat het zinvol lijkt deze tech-nieken met R&D verder te ondersteunen en om door het uitvoeren van demonstratieprojecten op kleinere schaal, zoals geschiedt in de EU-programma’s Civitas en Cute, verder aan deze technologieontwikkeling te werken.
1.
Introduction
The aim of the evaluation documented here was to support the Joint Expert Group on Transport and Environment (JEGTE)3 in their review process of the ‘White Paper - European transport
policy for 2010: time to decide’ (European Commission, 2001a). The ‘White Paper’ was
publis-hed in 2001 with the general goal of striking a balance between economic development and the
quality and safety demands made by society in order to develop a modern, sustainable transport system for 2010. The Commission has proposed about 60 measures to develop a transport system
capable of shifting the balance between modes of transport, revitalising the railways, promoting transport by sea and inland waterway and controlling the growth in air transport.
The Dutch Ministry of Transport, a member of the JEGTE, asked the MNP RIVM to evaluate the possible environmental effects of the policy proposals in the White Paper by focusing on three main subjects in the Paper: a) modal shift, b) pricing and c) alternative fuels and cleaner urban transport policy proposals.
Evaluation questions
The White Paper on European transport policy for 2010 aims to optimise the transport system to meet the demands of enlargement and sustainable development, as set out in the conclusions of the Gothenburg European Council (European Commission, 2001a, p.10). A modern transport system would be sustainable from an economic, social and environmental viewpoint. The approach chosen to meet this sustainability goal was a series of proposals ranging from pricing to revitalising alternative modes of transport, to road and targeted investment in the trans-European network (trans-European Commission, 2001a, p.14). The ambition of the Commission is to have the market shares of the other modes return to their 1998 levels through an integrated approach and thus introduce on a shift of balance from 2010 onwards. The evaluation in the report will focus on the modal shift impacts of the White Paper proposals. Important research questions here are:
• Will the proposals lead to modal shift?
• And, if a modal shift takes place, will this lead to the desired ‘sustainable’ transport system? Here, the evaluation of ‘sustainability’ will be limited mainly to an evaluation of environmental impacts, considering that MNP RIVM was asked to evaluate the environmental effects of the White Paper. However, in the White Paper sustainability is defined from an economic, social and environmental viewpoint, so the economic and social impacts of the proposals will also be taken into account, although less extensively.
Next to the focus on modal shift impacts, the evaluation will focus on the environmental impacts of the White Paper proposals (pricing and alternative fuels) regardless of the question if modal shift takes place or not. Two research questions evolved:
• What are the environmental impacts of the White Paper proposals?
• Are these proposals known to be efficient and/or cost-effective?
In the report to follow these questions have not been answered using new (model) calculations, but answers will, instead, be based on a review of the literature, with special emphasis on research programs funded by the European Commission (e.g. TEN STAC, IASON, TRANS-ECON).
Neither will the report cover issues on whether quantified environmental objectives will be met in 2010 or 2020. Firstly, this is because not all environmental objectives are quantified at EU level: for example, no overall targets for emissions of greenhouse gases from transport have been agreed in the EU (EEA, TERM fact sheet 31). Secondly, and more important, the measures set out in this document are only first-stage ones, mapping out a more long-term strategy, as mentioned in the White Paper (p.20). So it would seem more useful to evaluate the White Paper on its potential implications for a term longer than up to 2010, for example. The report will try to look at general trends and the (likely) effect of the White Paper.
The EU monitoring tool - the TERM mechanism4 - has been used extensively in this evaluation
to describe progress in modal shift and pricing developments to date. TERM reports and fact sheets from the European Environment Agency’s (EEA) were found to contain very rich and useful data and information about developments in the relationship between transport and the environment.
Structure of the report
Chapter 2 describes progress in desired modal shift trends and on estimates of modal shift im-pacts of the White Paper policy proposals as found in the literature. The progress in pricing policy proposals is given in Chapter 3, along with a review of potential impacts of transport pricing based on recent large-scale European research programs. Chapter 4 describes trends and potential impacts of mainly the alternative fuel policy proposals of the White Paper.
2.
Modal shift
2.1
Introduction
The European Commission’s aim in the White Paper was to shift the balance between modes of transport (EC, 2001), i.e. ‘the growth in road and air traffic must be brought under control, and
rail and other environmentally friendly modes given the means to become competitive alternati-ves (p. 23)’. A further aim was to ‘ … maintain the modal share of rail transport at 35% in the candidate countries in 2010 by mobilizing private-sector finance’. The Commission sees modal
shift as a way to meet three ultimate goals: less congestion, more economic growth (because modal shift is seen as a way to accommodate the growth in transport caused by an enlarged European Union) and environmental benefits.
To meet the modal shift goal, the White Paper proposed several measures; a selection of measu-res that seem particularly aimed at shifting modes follows:
• Revitalizing the railways and gradually opening up the railway market.
• Supporting the creation of new infrastructure, in particular, rail freight freeways. Introducing the concept of ‘motorways of the seas’.
• Launching a large-scale programme (Marco Polo) to support intermodal initiatives and alter-natives to road transport in the early stages until they become commercially viable.
• Rethinking air transport taxation in the framework of the International Civil Aviation Organi-sation and negotiating the introduction of a kerosene tax by 2004 along with differential en-route navigation charges (see also next paragraph).
• Revising the trans-European networks (TEN) by developing corridors with priority for freight (see previously) and developing a rapid passenger network and traffic management plans for major roads.
• Making inland shipping and short sea more reliable, efficient and accessible.
• Proposing a framework directive setting out the principles and structure of an infrastructure-pricing system (see also next paragraph).
2.2
Trends 1990 - 2004
This section charts briefly the progress in White Paper policies (infrastructure investments, revi-talising the railways and pricing) and gives the current trends in modal shares for passenger and freight transport.
Policy trends
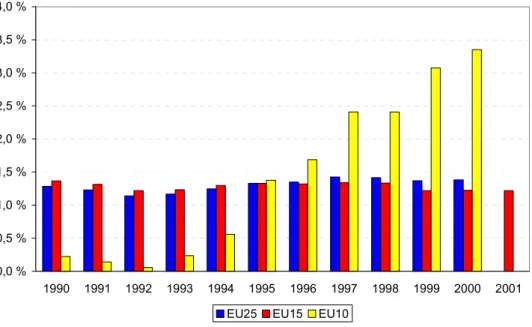
Currently, most infrastructure extensions are concentrated on motorways and high-speed rail in Europe (in the so-called EEA-315 countries) (EEA, 2004, TERM fact sheet 18). The total length
of motorways in the EEA-31 increased by almost 35% between 1990 and 2001. The motorway network in the EU-10 (new countries) grew by 62% (1045 km) between 1990 and 2001, and in the EU-15 by 35% (12606 km) (EEA, 2004). The length of railways and inland waterways was roughly unchanged in that period. Vilvan and Hilferink (2004) point out that only 20% of the total TEN projects have been completed, with delays mainly on cross-border and rail projects.
5 EEA31: Belgium, Denmark, Germany, Greece, Spain, France, Ireland, Italy, Luxembourg, the Netherlands,
Austria, Portugal, Finland, Sweden, the United Kingdom, Poland, Czech Republic, Slovakia, Slovenia, Hungary, Norway, Iceland, Turkey, Latvia, Bulgaria, Lithuania, Estonia, Liechtenstein, Romania, Malta, Cyprus
The Commission is in the process of preparing a major redefinition of the TEN Guidelines with a new time horizon of 2020.
The EU adopted the Marco Polo programme (European Commission, 2003a) in 2003 to support intermodal initiatives. The second railway package (European Commission, 2002) proposes to open up the entire rail freight market to competition by 2006. Documentation procedures for ships that call at EU ports have been simplified (European Commission, 2001b) and the market for inland navigation was opened per 1 January 2000 when Council Directive 96/gg52 entered into force.
The progress in realizing pricing mechanisms is slow. A kerosene tax scheduled for 2004 did not come into force (Chapter 3), but as concluded in EEA (2004, TERM fact sheet 22), small steps to internalisation have been made with the introduction of infrastructure charges for Heavy Duty Vehicles (HDVs) in Austria and a continuing increase of tolling motorways, (see Chapter 3 for more detail). On the other hand, it should be noted that fuel taxation in most EU countries has been reduced through fuel price protests, for example, leading to an overall decrease in total charges (EEA, 2004, p. 23).
Passenger transport trends in modal share
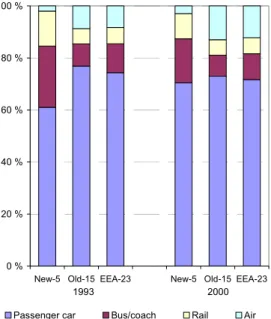
Contrary to the aim of the Common Transport Policy, the shares of aviation and road transport in passenger transport continue to increase, while the shares of rail, bus and inland shipping are gradually decreasing (EEA, 2004) (Figure 2.1).
In the EEA-23 (see footnote 4) regional passenger transport is dominated by the passenger car with a relatively stable share of 70 - 75%. The share of public transport is slowly declining: bus use declined from 12% in 1990 to 10% in 2001 and rail from 8% in 1990 to 6% in 2001 (EEA, 2004, TERM 12). Interesting to note is the regional disparity. In the new Member States car share has increased, while in the 15 old Member States it has decreased due to a faster growth of air transport.
0 % 20 % 40 % 60 % 80 % 100 %
New-5 Old-15 EEA-23 New-5 Old-15 EEA-23
Passenger car Bus/coach Rail Air
2000 1993
Figure 2.1: Developments in the share of passenger modes by region (EEA, Indicator Fact Sheet 12b) EEA23, see footnote6 .
Why are car and the air transport winning? Several reasons can explain this trend. For most con-sumers, cars have great advantages over public transport: less travel time, greater flexibility and more comfort. Dutch data show, for example, that 87% of all car trips made in 1999 had a travel time more than 1.5 times faster than trips made using public transport (V&W, 1999). In the same study travellers indicated that public transport would be an acceptable alternative if the travel time were not increased by more than 1.5 x compared to car travel time.
In EEA (2004, TERM fact sheet 20), the price level7of passenger cars (total costs) is estimated
at about 20 €ct per car km8: a rather stable price level for the period of 1995 - 2001. For rail and
bus the price levels are estimated at a stable 8 to 10 €ct per passenger/ per km. This seems at odds with the popularity of the car. However, two comments have to be made. First, as EEA (2004) remarks, individual transport decisions are generally more guided by the variable costs (notably fuel costs) than the total costs (variable costs per car km - estimated at about 11 -12 €ct - are more in line with the public transport prices per km). Secondly, when more than one person travels in the car, the variable price per car passenger km falls below the public transport prices per passenger km. The average car occupancy is 1.6, so it is clear that for most consumers,
current car price or perceived car price are not incentives to shift from car to public transport. The growing popularity of air travel is due to the rapidly growing tourism industry and the high
growth of low-cost airlines (EEA, 2004, TERM fact sheet 12b). The years 2001 and 2002 saw a small dip caused by the terrorist attacks, subsequent wars in Afghanistan and Iraq and the SARS epidemic. But since 2003, air transport has returned to its position of growth (EEA, 2004).
6 EEA23: the 15 old EU Member States (Belgium, Denmark, Germany, Greece, Spain, France, Ireland, Italy,
Luxembourg, the Netherlands, Austria, Portugal, Finland, Sweden and the United Kingdom) and 5 new Member States (Poland, Czech Republic, Slovakia, Slovenia and Hungary, plus Norway, Iceland and Turkey). Sufficient data was available for these countries.
7 Prices are based on the euro in 1995.
8 Based on data from 13 EEA countries: Belgium, Denmark, Spain, Finland, France, Greece, Ireland, Italy, Iceland,
Freight transport
EEA (2004, 13b) concludes that the share of road freight transport increased during the 1992 - 2002 period. The modal shares of rail and inland waterways continue to decrease, thereby moving away from the objective of stabilizing the share of alternative transport modes (Figure 2.2). The only mode with a demand generally declining in the EEA-30 was rail.
0% 10% 20% 30% 40% 50% 60% 70% 80% 90% 100% 1992 1994 1996 1998 2000 2002 road rail inland waterways 0% 20% 40% 60% 80% 100% EEA-30 EU-25 Old-15 New-10 CC-3 EFTA-2 share of road 1992 2002
Figure 2.2: Modal shares in freight transport demand in EEA-30 (left) and share of road freight transport in 1992 and 2002 in the different regions (right) (EEA, 2004 TERM 13b).
It is important to note that modes like maritime transport and pipelines are not included in Figure 2.2 (due to lack of data). For the old EU15, the modal shares include maritime transport and pipelines specified as follows: road 45%, short sea 40%, rail 8%, inland waterways 4% and oil pipelines 3% (data for 2001). In the old EU15, the share of road transport increased the most in the 1990 - 2001 period for the old EU15. Why is road freight transport the mode with relatively the highest growth? Several reasons can be given. One is that demand for fast and reliable freight transport has increased: the share of so-called perishable and high value goods (agricul-tural products and manufactured goods) in tonne-kilometres is rising (EEA, 2004 TERM fact sheet 13a). Especially road freight can ensure speed and a lot of flexibility. Furthermore, modern trade prefers more and more ‘just-in-time’ delivery of goods, which requires fast and flexible freight transport. This development in logistics also explains the growing importance of road freight transport. Another reason is that the road sector is liberalized to a great extent, while the inland waterway and rail sector have only recently been opened to broad competition.
The markets for the different freight modes overlap less than most people seem to think. For example, different modes carry different kinds of goods. An average road cargo is valued at 1674 €/tonne, while this is 924 €/tonne for rail and 86 €/tonne for inland shipping (EEA, 2004, TERM fact sheet 13 a). The prices reflect the difference in bulk (‘cheap’) versus more processed and manufactured materials and goods (‘more expensive’). The distance of the goods transported too determines modal choice. An average tonne of goods carried by road travels about 110 km, a distance over which rail or inland waterways are less efficient because road transport is needed to and from the loading point. So modal shift may be an option, but only for specific market seg-ments.
2.3
Modal shift and modal shift case studies
EU White Paper Scenarios
NEA et al. (2003) have made EU-wide traffic forecasts based on three scenarios. This socalled TEN-STAC project, funded by the European Community, contains three scenarios:
• TREND+: a) baseline socio-economic trends, b) liberalization and harmonization & c) TEN basic.
• EUROPEAN: a) baseline socio-economic trends, b) liberalization and harmonization, c) accompanying measures for TEN package I and d) TEN policy package I.
• EUROPEAN+: a) baseline socio-economic trends, b) liberalization and harmonization, c) accompanying measures for TEN package II and d) TEN policy package II.
The EUROPEAN scenario attempts to answer the question: ‘how can the White Paper measures related to the Trans-European Network be fruitfully applied? The accompanying measures to be applied to TEN corridors in this scenario include measures with respect to: a) interoperability, b) management of slots, c) the dedicated rail freight network, which, in fact, is a ‘priority freight network’, d) intermodal policy and e) sea motorways. The approach for accompanying measures consists of two steps in this scenario:
• accompanying measures stimulating rail and inland waterway transport routes with high volumes of road freight transport for distances longer than 400 to 500 km;
• accompanying measures stimulating rail and inland waterways transport in the TEN package I projects (15 Essen + 6).
The key feature of the EUROPEAN+ scenario is its inclusion of the White Paper measures, not only on the TEN projects but also in those of national interest.
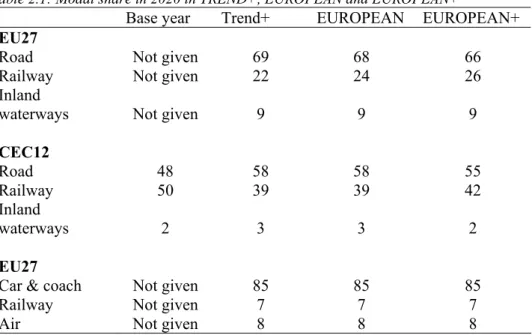
Table 2.1 shows the results of model calculations on the modal shares in 2020. Compared to the modal shift aim of the White Paper, these results are rather disappointing: the shift to rail freight transport is modest, even in EUROPEAN+, when compared to the baseline scenario, TREND+. No shift is expected to occur in passenger transport in the two ‘White Paper scenarios’ EUROPEAN and EUROPEAN+ compared to TREND+.
Table 2.1: Modal share in 2020 in TREND+, EUROPEAN and EUROPEAN+
Base year Trend+ EUROPEAN EUROPEAN+
EU27
Road Not given 69 68 66
Railway Not given 22 24 26
Inland
waterways Not given 9 9 9
CEC12 Road 48 58 58 55 Railway 50 39 39 42 Inland waterways 2 3 3 2 EU27
Car & coach Not given 85 85 85
Railway Not given 7 7 7
Air Not given 8 8 8
It is no wonder that NEA (2003) conclude that the infrastructure assumptions in the EUROPEAN and EUROPEAN+ (with clear emphasis on the rail mode) accompanied by other measures, are capable of only slightly reducing the emissions considered in the transport sector.
NEA (2003) are not certain if this slight improvement in emission levels means that these modal shift policies will be beneficial to the environment. NEA (2003) comments ‘however, [that-ed.]’
it has to be considered that the environmental assessment made at the European level neither takes into consideration damages caused by the infrastructure itself, nor allows conclusions about the European and European+ scenarios being capable of improving the situation for human beings and nature, since the level of concern caused by emission of particulates has not been considered. NEA (2003) also note that when the considerable growth in the transport
sector’s CO2 emissions in all three forecast scenarios are compared to the base year, a
develop-ment in contrast to European policy goals is highlighted. The CO2 emission is expected to grow
by about 40% in all three scenarios. The increase in CO2 emissions is due to the forecasted
inten-se growth of transport demand, particularly of freight transport. NEA (2003) concludes therefore that … as far as the emission of CO2 is concerned, the policy assumptions in the three forecast
scenarios are not far-reaching enough to provoke a significant break or change in trend.
Corridor case studies
Effects are estimated of three TEN rail network corridors (Kiel et al., 2004) in the so-called Iason project network. Iason, together with its sister projects TIPMAC and TRANSECON were set in answer to the call for proposals of the European Commission for projects in the 5th Frame-work RTD Programme. Three rail netFrame-work corridors have been examined for the transport network effects:
1. Paris-Bratislava rail network, corridor included 2. Berlin-Messina rail network, corridor included 3. Lyon-Budapest rail network, corridor included
The impact of developing all three rail network corridors on modal share for the entire European network is null (Kiel et al., 2004). Road and inland waterways show a small decrease in volume in 2020 (compared to the reference scenario), while the volume transported by rail increases approximately by 1%. Kiel et al. (2004) noted that the volume effects were relatively low, al-though possibly substantial at the origin - destination level. Unfortunately no figures were given.
Urban case study
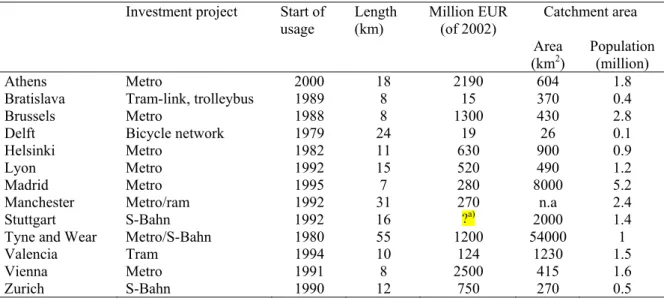
Traffic impacts of infrastructure investments on an urban level were analyzed in the so-called Transecon project (Transecon, 2003), carried out within the fifth framework programme of the European Commission under the key action ‘Sustainable Mobility and Intermodality’. The Transecon research project aims to provide qualitative and quantitative evidence for the existen-ce of direct and indirect effects and impacts of transport infrastructure investments in 13 European cities (see Table 2.2).
Table 2.2: The 13 urban investment cases in the Transecon project (round figures) Investment project Start of
usage Length (km) Million EUR (of 2002) Catchment area
Area
(km2) Population (million)
Athens Metro 2000 18 2190 604 1.8
Bratislava Tram-link, trolleybus 1989 8 15 370 0.4
Brussels Metro 1988 8 1300 430 2.8
Delft Bicycle network 1979 24 19 26 0.1
Helsinki Metro 1982 11 630 900 0.9
Lyon Metro 1992 15 520 490 1.2
Madrid Metro 1995 7 280 8000 5.2
Manchester Metro/ram 1992 31 270 n.a 2.4
Stuttgart S-Bahn 1992 16 ?a) 2000 1.4
Tyne and Wear Metro/S-Bahn 1980 55 1200 54000 1
Valencia Tram 1994 10 124 1230 1.5
Vienna Metro 1991 8 2500 415 1.6
Zurich S-Bahn 1990 12 750 270 0.5
a) not clear, total investment could only be given including highway investments in the same corridor
The environmental impact of transport infrastructure investment is positive or null in all the case studies just as the reduction of emissions is related to a decrease in car use (modal shift). But ex-cept for the Bratislava, Helsinki and Vienna, the authors note that the environmental impact is very small and probably not very significant. There is an important decrease in emissions for these three conurbations: about 15% of CO, NOx and PM10 in Helsinki; 10-30% of these pollu-tants in Bratislava and about 5% in Vienna; however, the impact is much less important for CO2
in all three cases (2 to 5%). In the Transecon study it is commented that metro results in higher car speed, making car travel more attractive. So why is there a decrease in car use in the Helsinki and Vienna case? It is not quite clear but one explanation could be that the cities in these cases took additional car restricting measures next to the metro investment project. This remark is based on the Transecon report, where authors point out (in the summary) the need for public transport policies combined with restriction policies on car traffic.
The general conclusion from the study is that transport investments offer great potential for socio-economic effects (Transecon, 2003). The authors note that not all of these effects are positive. The spatial developments in the settlement from the point of view of sustainable mobility and land developments will require special attention. For example, depending on the investment project and the changes of accessibility, both desired and undesired concentrations and/or urban sprawl can result. Therefore ‘everything is possible, it all depends on the
framework conditions’.
2.4
Specific studies on environmental impact of modal shift
Van Essen and Dings (2002) published a critical assessment of the modal split as an indicator for the EU Sustainability Strategy. An important point in their report is that recent studies by IFEAU-Heidelberg and CE (Appendix 2) show the differences in the environmental impact of competing segments of road and rail freight per tonne-kilometre to be much smaller than the average differences between road and rail. They point out that the most important growth in rail transport can be found in the market for containers and swap bodies. It is exactly in these markets that the differences in environmental performances between road and rail are small (see Appendix 2).
For road vehicles, in particular, technological innovations have led to a substantial decline in environmental impact. So, as Van Essen and Dings (2002) comment, potential environmental effects of modal shift are very limited: even if a shift occurs from one mode to another, the
decline in emissions per tonne-kilometre could be fairly modest. If the current share of rail in European freight transport (8%) were to double to 16% (here, a tremendous effort would be needed according to Van Essen and Dings, 2002) total CO2 emissions from European freight transport would decrease by between 1% and 2%.
So the final conclusion of these authors - that environmental transport policies aimed at modal shift in freight transport are very limited and not effective - is not surprising. Improving environ-mental performance of each mode is more effective. Stricter emission standards for road vehicles could be implemented. Considering that implementing source pollution policies (e.g. emission standards) for rail, inland shipping and sea shipping has only just started, a great emission re-duction potential for these modes are in theory foreseeable.
In 2003 Van Essen et al. (2003) analyzed the environmental performance of the principal modes of freight and passenger transport. Appendix 1 gives some of their results for passenger trans-port. The figures given here are presented as marginal emission factors: the emission factors of a hypothetical extra passenger in a given situation. Using marginal emission factors is considered to be fair, especially for evaluating modal shift impacts toward public transport off-peak. This is because during off-peak many seats in public transport are empty; these could be filled if a modal shift took place without much extra energy consumption (no extra buses or trains are re-quired). The figures for passenger transport show an unfavourable CO2 emission performance of
cars compared to that of buses and trains. The differences between the different passenger modes are less clear for NOx emission per passenger kilometre. However, Appendix 1 shows clearly
that a shift from car transport to electrical trains (also to trams and the underground) to result in fewer NOx emissions; a result which indicates that modal shift in passenger transport could
contribute to improving air quality, especially in urban areas.
The analysis of Van Essen et al. (2003) for freight transport is in agreement with the results presented in Appendix 2 and will not be reiterated here. These authors concluded that:
• From an environmental perspective it makes no sense to talk about clean or dirty modes of transport. Environmental performance generally depends more on installed technology and logistical characteristics than on mode per se;
• The results of any environmental comparison depend on the policy question for which an ans-wer is sought. If rail transport for a particular route shows loans-wer emissions per passenger kilometre than road transport, for example, this does not imply that building a new rail link will reduce the environmental burden. It is possible that none or only a small percentage of the car drivers will shift to the new rail service; this is because of such disadvantages as more travel time and less comfort.
2.5
Conclusions and discussion
Conclusions
Contrary to the aim of the Common Transport Policy, the shares of aviation and road transport continue to grow in passenger transport, while the shares of rail, bus, and inland shipping are gradually decreasing. In freight transport the modal shares of rail and inland waterways continue to decrease, thereby moving away from the objective of stabilizing the share of alternative transport modes.
Policy scenarios including White paper modal shift measures show no modal shift effects in pas-senger transport on a European level, while the modal shift impacts in freight transport on a European level are modest. The so-called ‘EUROPEAN+ White Paper’ scenario yields the fol-lowing results: modal shares of 66% (road), 26% (railway) and 9% (inland waterways) in 2020
compared to a modal split of 69% (road), 22% (railway) and 9% (inland waterways) in the trend scenario in 2020. The main feature of the EUROPEAN+ scenario is that it includes the White Paper measures not only valid for the TENs but also for projects of national interest. The environmental impact (expressed in fewer emissions) of this shift will be small. If other environ-mental impacts such as noise and adverse impacts of new infrastructures on nature/landscapes (e.g. dedicated freight rail lines) are taken into account, it is not at all certain, in this White Paper scenario, if the modest modal shift observed will be beneficial to the environment.
Thirteen cases of transport infrastructure investments on an urban level have shown either positi-ve or null environmental impacts. Except for three cases (Bratislava. Helsinki and Vienna), the environmental impact is slight. The positive environmental impacts were the result of a decrease in car use in the cities (modal shift). This modal shift is probably (the report on the 13 cases is not very clear on this point) the result of investment policies in public transport combined with restriction policies for car traffic.
Studies on the environmental performance of the principal modes of freight and passenger trans-port show that from an environmental perspective it is risky to talk about clean or dirty modes of transport in a general sense. Specific circumstances like installed technology (diesel versus electric), logistics (bulk versus containers), modal shift during peak or off-peak hours make the environmental differences between road transport and other modes of transport appear smaller than most people seem to think.
Discussion on policy implications
Modal shift is seen in the White Paper as an important intermediate goal for meeting economic, social and environmental end goals. However, the analysis in this report shows the modal shift indicator/aim to be confusing. It is not certain if modal shift policy proposals have an effect on modal shifts and are beneficial to the environment. At the same time, this does not mean that White Paper modal shift proposals are ‘bad’ policies per se. For example, in the European ‘Transecon’ study analysing 13 urban transport investment cases, it is noted that transport investments offer great potential for socio-economic effects in cities (some positive, some nega-tive). An implication of the confusing character of the modal shift indicator could be to abandon the general modal shift aims. It would seem clearer to design and evaluate transport policy pro-posals directly on their possible contributions to meeting desired economic, social and environ-mental end goals using techniques like societal cost-benefit analysis and strategic environenviron-mental impact analysis.
A few additional comments can be made from an environmental perspective:
• Improving environmental performance of each passenger and freight mode would seem more effective than general environmental policies aimed at modal shift;
• The urban case studies show the importance of evaluating policy proposals case by case. The impacts of investing in public transport, rail or inland water infrastructure are dependent on local or regional economic and social circumstances and policy framework (e.g. policies to encourage decreased car use in cities and infrastructure pricing on road freight).
• In the case-by-case environmental evaluation of transport policy plans several studies show that it is important to use specific environmental data per transport mode in the case instead of average data. The analysis in this chapter shows that the environmental performance gene-rally depends more on installed technology (diesel versus electric) and logistical characteris-tics than on mode alone.
• In the case-by-case environmental evaluation of transport policy plans, it is important not only to look at differences in CO2 and PM10 emission performance in the short term but also
considerable improvements in environmental performance, especially for road vehicles, have been shown in comparison to rail and inland shipping.
• ‘Environment’ stand for more than impacts of harmful emissions. For this reason it is also im-portant in the case of policy plans for new infrastructure (road or rail) to take impacts on noise and biodiversity, landscapes and scenic areas into account, as well as impacts on emis-sions.
3.
Pricing policy proposals
3.1
Introduction
While transport may be heavily taxed, it is, according to the White Paper, above all, poorly and unequally taxed. The ideal of the Commission is to have the price for use of infrastructure cal-culated by combining maintenance and operating costs with external costs stemming from, for example, accidents, pollution, noise and congestion. The aim of the Commission with respect to pricing is to have transport inefficiencies, e.g. congestion, pollution and accidents largely disap-pear in the course of time by pursuing appropriate pricing and infrastructure policies.
The White Paper proposes the following:
• A framework directive to establish the principles of infrastructure charging and a pricing structure, including a common methodology to incorporate internal and external costs. The directive would also aim at creating the conditions for fair competition between modes: (a) In the case of road transport, charges will vary according to the vehicle’s environmental
performance (exhaust gas emissions and noise), the type of infrastructure (motorways, trunk and urban roads), distance covered, axle weight and degree of congestion.
(b) In the case of rail transport, charges will be graded according to scarcity of infrastructure capacity and adverse environmental effects.
(c) In the case of maritime transport, the measures proposed will be linked to maritime safety.
• A directive on the inter-operability of toll systems to be introduced into the trans-European road network.
• Separating fuel taxes for private and commercial uses (directive on excise duties) and establishing harmonized taxation of fuel used for commercial purposes.
• Rethinking air transport taxation in the framework of the International Civil Aviation Orga-nisation and negotiating the introduction of a kerosene tax by 2004 and differential en route navigation charges.
3.2
Trends 1990 - 2004
This section will deal shortly with the progress in White Paper pricing policies.
Policy trends
EEA (2004, TERM fact sheet 26) reports slow progress in restructuring charges towards better internalization of external costs. Important developments are the introduction of urban pricing systems and distance-related pricing schemes on motorways. Price differentiation concentrates mainly on air pollution in the road sector and noise in the aviation sector. Very few measures have yet been taken to internalize costs of CO2 emission, and rail and road noise and congestion
(EEA, 2004 fact sheet 26).
Some examples can be given of pricing systems recently introduced in Europe. Austria introdu-ced a kilometre price on its motorways in 2004, varying from 0.13 to 0.27 €/km, depending on the number of axles. London introduced a congestion-charging scheme to improve the accessi-bility of the city centre. On large parts of the motorways network distance in France, Spain, Portugal, Italy and Greece related toll charges apply. A number of Italian and British towns are developing electronic urban road-pricing systems and Stockholm plans to introduce a system early in the summer of 2005 (CEMT, 2004/2). Despite many delays, kilometre pricing for heavy- duty vehicles (HDV) on German motorways started on 1 January 2005.
In line with the White Paper, the Commission launched a proposal, the ‘Eurovignette’ Directive, on the principles of infrastructure pricing to apply to member states. In this proposal pricing systems apply to HDVs over 3.5 tonnes Gross Vehicle Weight, and only to the so-called TEN-T network (EEA, 2004, fact sheet 26). The Directive proposal is at the moment being discussed be-tween the Commission, Council and Parliament. Here major discussion points are earmarking of the revenues and the possibilities of cross-financing.
Progress in aviation charging seems to be non-existent. A resolution was adopted at the Assem-bly of International Civil Aviation Organization (ICAO) of October 2004. With respect to market-based measures to curb emissions from air transport, ICAO has urged states not to intro-duce fuel taxes or distance-related charges for international flights. Contracting States are also urged to refrain from unilateral implementation of greenhouse gas charges prior to the next Assembly in 2007 (all information: EEA, 2004, TERM fact sheet 22).
3.3
Pricing policy scenario studies and specific case studies
Case Study - Congestion-Charging, London (based on TfL, 2004)
Congestion-charging was introduced in central London on 17 February 2003. Congestion within the charging zone has reduced by 30%, and the volume of traffic in the charging zone has reduced by 15% (vehicles with four or more wheels). By reducing the overall volumes of traffic within the charging zone, and increasing the efficiency with which it circulates, congestion-charging has been directly responsible for reductions of approximately 12% in emissions of NOx
and PM10 from road traffic within the zone (24-hour annual average day). Traffic changes on the
Inner Ring Road are estimated to have resulted in very small changes to emissions of NOx and
PM10 from road traffic: of less than plus/minus 2%, respectively. Traffic changes resulting from
charging are estimated to have led to savings of 19% in traffic-related emissions of CO2 and
20% in fuel consumed by road transport within the charging zone. It was not possible to identify congestion-charging effects for air quality improvement in the charging zone or the Inner Ring due to statistically unusual weather patterns in 2003. There is also no evidence from sample noise measurements in and around the zone of significant changes in ambient noise climate due to the charging systems.
Case Study - performance-related fee heavy duty vehicles Switzerland
Although it’s a case from outside the EU, the Swiss performance-related fee on heavy duty vehicles is included in this report because the case offers interesting results of a charging system for HDVs. The Swiss fee depends on three factors: a) the distance driven on the Swiss road net-work (all roads), b) the laden weight of vehicle and trailer, and c) the emissions of the vehicle (there are three emission classes). The fee was introduced in 1 January 2001 at a rate of 1.0 Swiss ct per tonne kilometre. In parallel, the weight limit was raised from 28 to 34 tonnes. On January 1st 2005 the rate has been increased to 1.6 ct/tonne kilometre and the weight limit to 40 tonnes. Balmer (2004) reports as the main effect of the new regime with the fee on the one hand and a higher weight limit on the other was that heavy good transport on the road has become much more efficient. It is estimated that the emissions of CO2 and NO2 caused by
HDV’s will be about 30% lower with the new regime than they might have been if the old regime (flat fee, no higher weight limit) had been maintained. As to the envisaged shift of goods transport from road to rail no remarkable shift could be noticed so far (Balmer, 2004).
EU Iason
Iason, together with its sister projects TIPMAC and TRANSECON, represents one answer to the call for proposals of the European Commission for projects in the 5th Framework RTD
Program-me (Tavasszy et al., 2004). The goal of the IASON project is to improve the understanding of the impact of transportation policies on short- and long-term spatial development in the EU, whilst simultaneously developing a unified assessment framework at the European level, integra-ting network, and regional and macro-economic impacts.
In the Iason study, for example, the ‘SCENES Regional Economic and Transport Model’ was applied to assess the effects in the transport system of charging for road freight transport. Exter-nal costs applied ranged from 5 euro cents per km in low population density areas to 70 euro cents per km in metropolitan areas. The model calculation shows:
• Less traffic in urban areas;
• A higher proportion of larger trucks in the fleet;
• Growth in combined and intermodal transport. Two per cent of road freight tonnes is trans-ferred to rail and coastal shipping. In the EU, 6% of road tonne kilometres shift to rail and shipping;
• Changes in trade and industrial locations. Approximately half of the reduction in total truck traffic stems from long-term changes in these patterns of trade. Traders tend to look for pro-duction and consumption markets that are located closer to each other.
According to the Iason study, the corresponding CO2 equivalent emission reduction could range from 8 to about 16% (road freight only) in 2020. The most interesting result from these model calculations is the wide range of behavioural impacts of pricing shown. Environmental improve-ments result not only from volume reductions but also from improved efficiency in the use of trucks and less traffic in urban areas, where the environmental impacts are relatively high.
EU Interurban
The so-called MC-ICAM project concerns the implementation of marginal cost-based pricing in transport. Its goals are to provide clear policy conclusions based on strong theoretical analysis, surveys and analyses of current situations in transport markets in different modes and countries, and a number of modelling case studies covering many different situations. The project is funded by the European Commission, 5th Framework Programme - DGTREN. In the MC-ICAM project,
the Institute for Transport Studies, University of Leeds et al. (2003) studied marginal cost-pricing impacts on interurban transport. They used three cases in which they applied four different charging system scenarios (see b- e listed below) compared to a ‘do minimum/do not-hing’ scenario (a):
a. Do minimum/do nothing (= no new policies);
b. The first best alternative (internalization of all external costs so that prices are equal to mar-ginal cost);
c. Gradual implementation of first best starting with road; d. As ‘c’ but only road pricing for freight;
e. As ‘c’ but only road pricing, all traffic.
In the Dutch case the model calculations showed pricing schemes to result in emission reduction of 1% to 3%, compared to ‘do minimum/do nothing’. Noise levels hardly change in the pricing schemes. Charging the marginal cost for all modes results in a relatively high increase of trans-port cost for rail and inland waterways, and as a consequence, a modal shift towards road transport. Full internalization of external costs with geographical differentiation of charges (the alter-native coming closest to the first-best optimum) leads to the highest welfare gain. In this case a considerable amount of the road traffic is diverted to other routes.
In the European case the full internalization of external costs with geographical differentiation of charges (the alternative coming closest to the first-best optimum) leads to the highest welfare gain. The environmental impacts are not stated very clearly in this case.
In the Norwegian case only three scenarios were applied: ‘do minimum’, marginal external cost-pricing for all modes and marginal external cost-cost-pricing for only road. The sum of total freight transport on road, railways and water in Norway (tonne kilometres) increases for all the sce-narios. Pricing schemes reduce transport volume by around 3% compared to ‘do minimum’. The relatively small differences between marginal cost-pricing scenarios compared to the changes in the level of transport in ‘do minimum’ (from 2001 tot 2022) is in part due to the fact that a great share of the externalities are already internalized along the ‘do minimum’ path as existing trans-port taxes. The small differences are also due to the fact that total transtrans-port costs constitute a relatively small share of commodity prices (approximately 4%), hence the relatively small changes in consumption and the total tonnes transported. Another explanation is that the mar-ginal external cost price is, in this case, differentiated according to urban and rural areas, which has the effect that especially road transport is directed outside urban areas to avoid higher taxes within these areas; this increases distance by road and tonne kilometres. The calculated external costs per tonne kilometre in the pricing schemes decrease by 2% (2012) and 6% (by 2022), when compared to ‘do minimal’.
The Institute for Transport Studies, University of Leeds et al. (2003) concludes that all pricing case-studies showed welfare gains for the pricing of both one mode and all modes. Under full geographical differentiation, the share of road transport is higher than in the ‘do nothing/do minimum’ implementation path. This applies even to the case in which only road traffic is charged and is due to the fact that geographical differentiation of pricing makes some road trans-port links cheaper, namely those through less densely populated areas.
EU Urban
In the same MC-ICAM project, De Palma et al. (2004) used four elaborate simulation models to study the design and impacts of first-best, and various second-best, pricing policies for urban area. Case studies were carried out for Paris, Brussels, Helsinki and Oslo.
No clear environmental impacts are given in the Paris case. The study does mention that pricing schemes (flat tolls, time-dependent cordon-toll) resulted in external cost reduction and welfare gains.
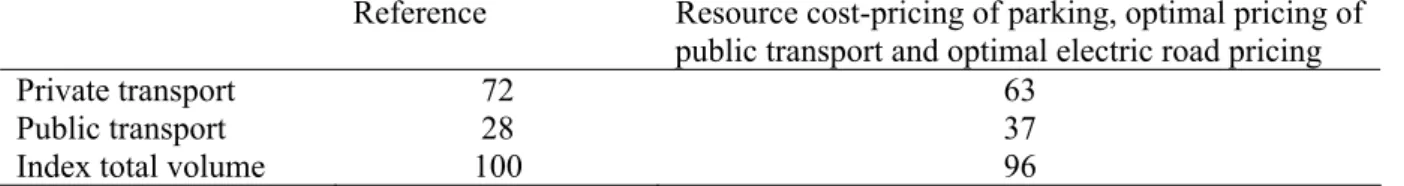
In the Brussels case, pricing policy resulted in urban transport volume reduction and modal shift (Table 3.1). The reduction of car transport in the city indicates environmental improvements. Table 3.1: Some impacts of pricing policy in Brussels
Reference Resource cost-pricing of parking, optimal pricing of public transport and optimal electric road pricing
Private transport 72 63
Public transport 28 37
Index total volume 100 96
In the Helsinki case, pricing policy consists of petrol price increases (+75% in the medium term) and public transport fare decreases (-25%), and radial/cordon-fixed road peak charges. There is a shift to public transport and a reduction in the average distance of car trips. As a result, auto travel decreases significantly, as do accidents and most types of emissions. The Helsinki urban pricing case results in 25% CO2 emission reduction compared to the base forecast in 2015; NO
Toll ring charges are applied in the Oslo case, with marginal social cost-pricing of car and public transport based on welfare optimization, peak toll ring charges and fuel taxes, either at current levels or with added CO2 charges. The calculation shows that environmental costs and accident costs are reduced along the implementation path. According to the study, adding in climate costs will increase the overall benefits radically. Drivers will experience a sharp increase in monetary costs due to toll charges but will gain much of it back in peak-period time savings due to a shift to transit, which results in less road congestion. Public transport users benefit from both money and time-savings. Time-savings accrue from an endogenous increase in service frequency to avoid crowding, as well as a reduction in congestion on the road because of fewer cars.
The general conclusion is that the estimated annual per capita welfare gains in the long-term scenarios of the case studies range from € 137 (Paris) to € 403 (Helsinki) (De Palma et al., 2004). Modal shifts are identified in all the case studies as being the largest contributor to the welfare gain in the long term. Efficiency gains are enhanced if policy measures are differentiated with respect to mode, location, time, vehicle characteristics and so on.
EU Pricing - general
Niskanen and Nash (2004) present results and conclusions with respect to overall impacts of marginal cost-pricing as taken from the MC-ICAM modelling case studies.
(1) The main results:
• Small changes in volumes and direct losses to a majority of users;
• Substantial overall welfare gains. (2) The apparent paradox resolved:
• Welfare gains are derived not only from reductions in real transport costs but also from indirect benefits from environmental improvements, reductions in levels of labour taxes and other distortions;
• Benefits to non-users accrue from environmental and other improvements.
Niskanen and Nash (2004) comment that the impact of full or first-best marginal cost-pricing on total transport volumes and modal shares can often be fairly minor compared to the effects of other factors and trends in transport demand, technology, etcetera. The question naturally arises whether trying to introduce marginal cost-pricing principles throughout the transport sector is worth all the effort required. Indeed, in many cases alternative policies and approaches may be more practical. However, this does not deny the usefulness of considering marginal cost-pricing principles (first-best, second-best) and corresponding modelling outcomes such as theoretical benchmarks, also in these cases.
EU Urban pricing in combination with other policies
PROPOLIS is a research project within the 5th Framework Programme of the EC (Lautso et al., 2004). Its aim is to define sustainable long-term urban strategies and to demonstrate their effects in European cities. Pricing is an important part of the strategies developed in this project.
The PROPOLIS project developed and analyzed potential urban policies for seven case cities: Helsinki, Dortmund, Naples, Vicenza, Inverness, Bilbao and Brussels.
The result of the study shows the environmental sustainability to deteriorate in all case cities when compared with the current situation. In the PROPOLIS study best results to stop this nega-tive trend are achieved by using policy combinations, i.e. push and pull measures consisting of car pricing policies and simultaneous improvements in public transport through reduced fares and better speed and service. Adopting the above line of action leads in the PROPOLIS case cities to a 15 - 20% reduction in CO2 emissions, 8 -17% reduction in traffic accident decreases and often at least small reductions in exposure to noise & pollutants and total spent time in
traffic. According to Lautso et al. (2004) the socio-economic benefits vary but are typically €1000 - 3000 per inhabitant (net present value). The authors stress in the conclusions that the op-timum level of the pricing actions is city specific. Next to pricing policies and investment programmes for better public transport speed and service, Lautso et al. (2004) also recommend a land-use plan supporting the new need for people to live near central areas, in satellite cities or along well-served public transport corridors.
3.4
Conclusions and discussion
Conclusions
The progress in restructuring charges towards better internalization of external costs is slow. Important developments are the introduction of urban charging systems and distance-related charging schemes on motorways. Progress in aviation pricing is null.
Limited empirical evidence (the London charging system) shows that charging policies in inner cities can reduce congestion and emissions. In the London case 12% of the emissions of NOx and
PM10 from road traffic and 19% of traffic-related emissions of CO2 are reduced within the
charging zone. Unfortunately, the impact of the charging system on air quality in the London case is not yet available.
What will happen to modal shift if external costs are internalized?
It seems rather simple: full internalization of external costs will result in a modal shift to rail and inland shipping because these modes have lower external costs per tonne kilometre than road. However, in reality the relationship between internalization and modal shift is not that simple at all. A few reasons ‘warning’ that internalization could lead to perhaps surprising impacts are given below.
1. The comparison between total external costs and charges currently paid gives complex results. Ricci (2003) found a clear undercharging for the Barcelona-Warsaw corridor for both road and intermodal transport. However, other corridors studied (such as Genova-Manchester & Patras-Gothenburg) show contradictory patterns (Ricci, 2003), where, in some cases, road transport ap-pears to be already covering its external costs, and intermodal transport is not. So, the relative price increases as a result of full internalization vary considerably between routes and countries owing to substantial differences in national charging policies, but also in the value of external costs (sensitive to the presence, for example, of urban or per-urban stretches in the corridors ana-lyzed) (Ricci, 2003);
2. Even if road transport becomes more expensive than rail and inland shipping due to internaliza-tion, the consequences are not straightforward. Lobé (2001) found that although price is a critical factor in the transport market, price elasticities are complex and highly route-dependent. For example, Ricci (2003) calculated that cost savings (only internal costs) with an intermodal option compared to an all road option could be 20% (in the Barcelona-Warsaw corridor). On the other hand, time-savings with an all-road option in this corridor is 430% compared to an intermodal option. So, if the cost difference between all road and intermodal transport due to internalization becomes larger, it is still questionable if this will result in much of a shift from road to intermodal transport. Perhaps the time loss is still regarded as a major drawback.
3. Rail and inland shipping often need pre- and post-haulage. According to Ricci (2003), this hau-lage carries relatively high external costs because the hauhau-lage occurs with vehicles that are less efficient and clean than those used for long haulage, where the percentage of empty trips is also higher. So pricing of road externalities could have a ‘high’ impact on intermodal transport (consisting of rail or inland shipping) also.
This analysis is not meant to demonstrate that internalization will always result in modal shift to road, but to show that the relationship between pricing policies and impacts on transport volumes and modal shift are highly complex, and strongly dependent on regional (or national) circumstances.