RIVM Letter Report 863001004/2007
Monitoring Black Smoke?
Monitoring the impact of abatement measures
H.J.Th. Bloemen, A. van der Meulen, D. Mooibroek, F.R. Cassee. Contact: H.J.Th. Bloemen RIVM/MEV/LVM Henk.Bloemen@rivm.nl
This investigation has been performed by order and for the account of Ministery of Housing, Physical Planning and Environment, within the framework of M863001 Air Pollution and Health
© RIVM 2007
Parts of this publication may be reproduced, provided acknowledgement is given to the 'National Institute for Public Health and the Environment', along with the title and year of publication.
Abstract
Monitoring Black Smoke? - Monitoring the impact of abatement measures
Non-compliance with EU Air quality directives requires abatement measures for particulate matter (PM10). Numerous volume and technology based measures have been defined and are currently being
implemented. Adequate policy evaluation demands appropriate evaluation of the impact of these measures. As many of the abatement measures are focussed on traffic emissions, motivated by notion that this source is widely considered as the most health relevant, an indicator specific for traffic is sought after.
In the Dutch National Air Quality Monitoring Network (LML) several parameters are measured routinely at a number of stations, including particulate matter (PM10), Black Smoke and the gaseous air
pollutant nitrogen oxides, carbon monoxide and sulphur dioxide. All these air quality parameters, except Black Smoke, are considered indicators lacking specificity for traffic emissions. In the current study the feasibility of monitoring Black Smoke to enable the evaluation of the impact of the abatement measures is assessed.
Based on the evaluation of emission profiles and the long term monitoring data base Black Smoke is found to be the most appropriate indicator for combustion sources of which traffic is the most important one in urban areas. Both the monitoring data of the LML as well as the evaluation of an intervention case illustrate the potential for following the success or failure of (local) abatement measures. To distinguish between volume or technology based measures the (relative) emission factor of the fleet cruising in the nearby surroundings of the monitoring station is required. An approach has been developed before and might be applied.
Monitoring data shows the relevance of the proximity of traffic and consequently assessing the exposure of people will need a more dense network than that of LML, reflecting the spatial (and possibly also the temporal) variation of the Black Smoke emissions and concentrations.
Rapport in het kort
Monitoring Zwarte Rook? - De waarde voor het volgen van de invloed van beleidsmaatregelen.
Zwarte Rook is een luchtkwaliteitsparameter die wordt gemeten in het Landelijk Meetnet
Luchtkwaliteit en die dienst kan doen als indicator voor de emissies van verkeer en daarmee de impact van de maatregelen die zowel lokaal als landelijk worden genomen.
Een verkennende studie gebaseerd op bestaande gegevens en de meetresultaten van het Landelijk Meetnet Luchtkwaliteit is uitgevoerd door het RIVM. Het doel van deze studie was de bruikbaarheid van de Zwarte Rook meetresultaten te onderzoeken voor het verkrijgen van inzicht in de effecten van de verschillende beleidsmaatregelen gericht op het reduceren van verkeersemissies (uitlaat emissies).
De emissie gegevens van een reeks van bronnen geven aan dat elementair koolstof vooral door verbrandingsprocessen wordt uitgestoten waarvan het verkeer de belangrijkste is in de stedelijke en geïndustrialiseerde omgeving. Evaluatie van de LML Zwarte Rook data laat zien dat de hoogste concentraties gemeten worden in een stedelijke en verkeerrijke omgeving . Op grond van meetgegevens ten tijde van een interventie in Utrecht bleek dat stagnatie van verkeer tot sterk verhoogde concentratie leidt die weer kunnen worden gereduceerd door specifieke maatregelen
waaronder het verbeteren van de doorstroming. Een eenvoudige trend analyse toont aan dat een geringe neergaande trend vooral grootschalig van aard is. In de stedelijke omgeving vinden weliswaar sinds 1997 geen sterke verhogingen meer plaats tijdens de winterperiodes maar de seizoensgebonden verhogingen (winter hoog, zomer laag) is voor de onderzochte locaties nauwelijks veranderd.
Deze inzichten onderstrepen dat Zwarte Rook een adequate indicator is voor verkeer en daarmee voor het effect van beleidsmaatregelen. Nu specifieke lokale maatregelen worden getroffen in de stedelijke wordt het aanbevolen om de opzet van het Zwarte Rook netwerk hieraan aan te passen.
Contents
1 Introduction 7
2 Black Smoke 11
2.1 Black Smoke as air pollutant 11
2.2 Black Smoke as source indicator 11
3 Measuring Black Smoke concentrations 13
3.1 Classical method 13
3.2 New methods 13
3.3 Equivalency 14
3.4 Volume or technology based abatement 15
4 Black Smoke Phenomenology 17
4.1 Annual average concentration 17
4.2 Temporal variation 19
4.3 Spatial Variation 21
4.4 Intervention case study 23
4.5 Black Smoke in other European Networks 25
5 Discussion and conclusion 27
6 Recommendations 31
1
Introduction
The current air quality situation in the Netherlands with persistent non-compliances with EU standards for particulate matter (PM10) and nitrogen dioxide (NO2), the strict legal implication for many
economical activities and the consequential need for governmental actions has set of the development and implementation of a vast number of policy measures. These measures are directed at the reduction of emission of various sources or the removal of particulate matter and nitrogen dioxide from the air. The majority of these measures focus on the emission of traffic, in particular the tail-pipe emissions Among the many initiatives to reduce tail-pipe traffic emissions the mounting of retrofit-filters for diesel-fuelled cars and trucks, the implementation of environmental (‘low-emission’) zones in inner-cities, cleaner public transport and fiscal incentives for early compliance with EURO-5 standards are some of the most relevant ones. Measures under investigation include optimizing vegetation near busy traffic roads, cleaning road surfaces and the application of titanium dioxide for removal of nitrogen dioxide.
However, the contribution of traffic to the PM10 concentration is limited to such an extent that even if
the implementation of abatement measures is fully successful it is not certain that the EU standards will be met. Since PM10 is a complex mixture that contains components with variable biological activity,
total mass is a rather crude measure to monitor population based impact on health. Other metrics have been proposed to be of higher relevance, though these may not be easily implemented in a routine air quality monitoring network.
The health relevance of Black Smoke (BS), assumed to be a good traffic tracer, has been emphasized in a number of epidemiological studies. Daily time-series studies have found associations between BS and daily mortality and hospital admissions (Pope and Dockery, 2006). Overall, these studies suggest a consistent association between mortality or hospital admissions and particulate matter. As PM10, PM2.5
and BS are highly correlated on a regional scale, it is difficult to separate single contributions. A study in the Netherlands found that BS was more consistently associated with total mortality than was PM10
(Fischer et al., 2007). In two Dutch studies on schools located within 400m of busy motorways, respiratory symptoms were increased near motorways with high traffic counts of trucks, not passenger cars. This suggests that especially diesel fuelled traffic is relevant for traffic associated health effects. More general, the carbonaceous part of PM is thought to be of more relevance to human health as compared to inorganic components such as sulphate, sea salt and crustal material. Following this association, WHO recommended recently in response to CAFE questions to give further consideration
to monitor black carbon or other measures of traffic “soot” (WHO, 2004) which is further supported by Buisman et.al. (2005).
Effective air quality management requires quantitative indictors to evaluate the impact of the various measures directed at the mobile emission source. In the Dutch National Air Quality Monitoring Network (LML) several regulated air pollutants are monitored at a regular basis that might function as appropriate indicators, such as the particulate matter metrics PM10 and PM2.5, NO2, sulphur dioxide,
carbon monoxide and BS. Other indicators used in various studies require more labour intensive monitoring activities and are not part of the network.
The time course of the PM10 levels most probably will not provide information on the success or failure
of the abatement measures; too many other sources, both natural and anthropogenic, contribute substantially and their contributions vary largely over time and from site to site. Even for the other particulate matter metric, PM2.5, this will be the case, although the contribution of natural sources and mechanically generated particles is substantially less than to PM10.
Nitrogen dioxide (NO2) is largely originating from traffic and currently the levels exceed the EU standards, in particular in the urban areas. Abatement measures are defined and are being implemented and need to result in the reduction of annual average levels. Counteracting these measures are the effects of mounting particulate filters on diesel fuelled cars, trucks and busses. These filters require NO2 for the regeneration of the filter material and consequently are tuned accordingly possibly resulting in higher NO2 emissions. Because of these measures with opposite effects on the NO2 levels this metric most probably will not provide the desired information.
Other air pollutants measured routinely in the LML include carbon monoxide and sulphur dioxide, both emitted by various combustion sources.
BS is a specific emittant for combustion processes of which traffic is the most important one and enables the discrimination between tail-pipe emissions and the other type of traffic emissions, e.g. road, tire and break wear, and resuspension of road dust. This might be the indicator looked for to follow the impact of mobile source directed measures. However, as no EU regulation is in force to monitor BS or similar metrics, current practise in the LML as in many networks in other European countries might lead to ending the long standing monitoring of BS. In only a few countries, e.g. UK, the need for BS monitoring is re-evaluated.
Given the need for an appropriate indicator, for which BS might qualify, and the still existing network for BS in the LML it was found that re-evaluation of the BS network was called for and this reports is a first step in this.
Although the LML is specifically designed for measuring air quality in general and monitor trends to support policy makers, air pollutants measured in the monitoring network, are frequently used for the exposure assessment of (sub-) populations in epidemiological studies. The applicability of the BS data in the current configuration and after upgrading is evaluated in this report as well.
The objective of the present study is to explore the feasibility of BS monitoring in the LML: to improve or assist the monitoring of the contribution of mobile sources, its trend and the
impact of abatement measures
to describe adequately population exposure to traffic emissions
to improve the understanding of the adverse health effects caused by exposure to particulate matter
In this report the notion of BS, the measurement methods, the phenomenology based on historical data from the Netherlands and possibly foreign networks, arguments for continuation monitoring or modifications of the network are discussed. The report concludes with recommendation regarding further research and adaptation of the current network.
2
Black Smoke
In this Chapter the notion of BS as an air pollutant is discussed, as well as the type of sources emitting substances that are measured as BS and the insights in the health relevance of BS.
2.1
Black Smoke as air pollutant
The component of particulate matter that causes adsorption of light is phenomenological defined as BS. The detection methods are in accordance with this observation and are based on the increased
adsorption or reduced reflection of light from a collection device (usually a filter). The concentration of BS is in general expressed in mass-per-volume units. To arrive at this unit a conversion factor is used that has been defined decades ago.
BS measurements belong to the earliest monitoring activities in many countries. However, as no EU directive for monitoring BS exists many air quality networks abandon BS monitoring activities or at least do not publish measurement data anymore. In Chapter 5 the existing BS datasets from other European network is discussed in more details.
2.2
Black Smoke as source indicator
In general all combustion processes, fed with organic material emit particles made up partially or completely of elemental carbon (EC). These are considered primary sources. Secondary sources of elemental carbon are re-emission of deposited particles by anthropogenic activities or wind driven. A relevant source for elemental carbon in certain areas and during certain periods is the burning of vegetation either anthropogenic of biogenic ignited. No elemental carbon is produced by atmospheric chemical processes although it has been argued that material that is oxidized or otherwise chemically converted by atmospheric processes can cause blackening of filters and is termed Brown Smoke (Andreae and Gelencser, 2006). They examined the potential impact of the presence of Brown Smoke and concluded that the presence will contribute to at least a factor-of-two-uncertainty and sometimes even to discrepancies between concentrations of elemental carbon and BS of a factor of seven. They argued further that the simplified concept of light adsorption being directly related to the presence of soot particles only applies in the most highly industrialized zones. We assume that most of the Netherlands qualifies for this.
Combustion processes emit particles in the sub-micron to micron range depending on the combustion temperature and other conditions. In the combustion processes numerous other compounds are produced and emitted along as internally mixed particles. During the atmospheric dispersion other compounds might be adsorbed or compounds might be oxidized.
A vast database of source profiles, compiled based on published research, is provided in the US.EPA Speciate database (USEPA, 2007) in which the composition of more than 400 sources containing elemental carbon (EC) is described. Examination of this database shows that the EC content of emissions varies from 0.5 to 30%. The most important sources are road traffic (diesel and petrol fuelled) emitting 5-30% EC (varying with the operation condition of the engine – ‘smokers’), air traffic (airplanes and helicopters, 17%), oil refineries and oil combustion (15-30%), residual wood burning and vegetation combustion (10-20%), and coal energy generation (10% reduced to 1-3% when emission reduction facilities are installed). Maybe unexpectedly cooking is listed (10% EC). Most, if not all data originate from studies in North-America (mainly USA) but it might be assumed that these figures apply for the situation in the Netherlands as well.
Secondary sources include air borne dust containing deposited combustion emission and is generated by wind or anthropogenic activities (traffic, farming, and building). More specifically characterized as urban and rural soil dust, building dust and desert sand. The elemental carbon content varies from 0.5-2%. The particle size distribution of these secondary sources follows that of mechanically generated dust and is mainly in the coarse range (PM2.5- PM10). The relevance of the contribution of these sources
can only be determined by the overall source strength. In published source apportionment studies the secondary source contribution is not marked relevant.
Schaap et al. (2004) estimated the emission of various sources based on the recent European emission inventory (excluding the former USSR, CEPMEIP) and work of Streets et al (2001) for the BC content of submicron PM. To compare emission data with concentration data they calculated PM2.5 levels and found that the model underestimates by a factor of two, mainly attributed to the underprediction of total carbonaceous material (BC and organic material). The main source contributions (85%) were transport 51% (road traffic 33% of which 30% diesel; 18% non-road traffic of which 5% international shipping) and other combustion sources 34% (20% small combustion sources, including households and small combustion sources, and 14% industrial sources).
3
Measuring Black Smoke concentrations
3.1
Classical method
Various methods are used to measure BS. Routine methods include adsorption or reflection of light of a filter on which particulate matter is collected. The function for the conversion of the detector signal (reflection or transmission) to mass concentration is determined decades ago and only differs for the combination of filter type and instrumentation. This non-linear function is derived from experimental work carried out in 1963. The concentration is expressed in “equivalent international standard smoke” units (e.i.s.s). The reference method adobted in 1988 guarantees a reproducibility better than 5 µg e.i.s.s. /m3 in the concentration range of 0-140 e.i.s.s. /m3. Nevertheless, it has been found that the function for the conversion shows variation with the type of monitoring site and the season. (Zierock, 1985; Schaap and Denier van der Gon, 2007).
The routine method applied in the LML is based on the method related to the EC Council Directive 80/779/EEC in detail described in EUR 14550/11 EN (Christolis et al., 1992). In the LML the EEL 43 Reference Method Reflectometer in combination with Whatman no filterpaper is used until 2002. The conversion to e.i.s.s. mass concentration uses a four degree polynomial function. In 2002 a more automatic method was introduced in the LML after extensive testing that showed good agreement (Hijink, 2002).
3.2
New methods
New techniques have been developed over the past decades and are frequently the method of choice when measuring carbon parameters (Elemental carbon, Organic carbon, Inorganic carbon (carbonate)) is required and are collectively referred to as spectrothermographic. The basic principle is the
combustion of organic material released by heat from the filter on which it was collected. The analysis method consists of various steps at different temperatures and under different oxidizing conditions in which collected carbonaceous material is either just evaporated or first oxidized to carbon dioxide. A major disadvantage is the premature conversion of organic carbon to elemental carbon (‘charring’) resulting in an overestimation of the elemental carbon and consequently underestimation of the organic carbon content. Systems to correct for this have been developed and include the application of the
measurement of reflection or transmission of the filter or the omission of conditions under inert gas. The result for elemental carbon (EC) and organic carbon (OC) obtained with these new techniques do not compare well (Birch, 1998; Watson and Chow, 2002). The sum (EC+OC) are usually in good agreement. Other methods, using only oxidizing conditions and hence discriminate only by temperature variation, suffer not from this disadvantage but produce different results. Instruments based on
aethalometry (aethalometers) have higher temporal resolution and are based on the optical
transmission. Some type of aethalometers uses light with several wavelengths in contracts with the classic method that applies white light. Quincy (2007) evaluated the principles of both measurement principles (aethalometer (Black Carbon) and ETL SC200 (Black Smoke)) and the results of a comparison applying both instruments at kerbside site in London. He concluded that although the instruments measure something different but are comparable when proper attention is given to conventions and parameters used in line with the conclusions of Hitzenberger et al.(1999).
3.3
Equivalency
Measuring BS involves the application of a calibration factor (conversion of light adsorption to mass). This factor is standardized and equals 19 m2/g. Sharma et al. (2002) found that this factor varies in the range from 6.4 to 20.1 m2/g depending on the age of the aerosol collected, the type of the station and the season. These can be interpreted as the effect of the composition of the aerosol. Schaap and Dernier van der Gon (2006) evaluated available data on EC measurements and data from the LML and found that the relation between BS levels and EC content was highly linear but the factors of the regression equation depended on the type of the monitoring site (urban regression factor 0.088 (ranging from 0.070 – 0.104) and regional-rural 0.056) confirming the findings of Sharma et al. (2002). Lavanchy et al. (1999) determined the factor for a remote location (Jungfrauloch): 9.3 ± 0.4 m2/g only 50% of the standard calibration factor. These findings are based on the measurement of EC with methods that have not been standardized itself. Watson and Chow (2002) and Chow et al. (2004) evaluated the different methods for EC and concluded that the different protocol gave results differing 30 – 80%.
Interlaboratory comparison of BS measurements in the PEACE study (Hoek et al., 1997) revealed that both the used filter material as well as the operational practise are main factors in the outcome of the measurements. They found differences up to a factor of three.
Overall it can be stated that BS measurements based on the adsorption of light are reproducible for a given site and season. Variation over time and in space are partially caused by the effect of the
composition of the collected particulate matter. Comparing results from other networks implies further careful inspection of the protocols used in those networks and the definition of the typing of sites.
3.4
Volume or technology based abatement
Monitoring BS does not easily enable the distinction between abatement measures based on
technological innovations or measures reducing the volume of mobile sources. The planned measures include both types. Discrimination between these two is possible when the trend in emission factors (emission/vehicle) is assessed along with monitoring trends in BS concentrations. The methodology developed by Bloemen et al (1998) (MEDAM) and applied too by Weijers et al. (2005) consists of the determination of the relative emission factor by ambient monitoring. This approach implies the hourly measurement of at least three air pollutants, for which one the emission factor is known (e.g. CO) and is not affected by the technological abatement measures. The other air pollutant (e.g. BS and NOx) is measured simultaneously. By combining the measurement concentration of both pollutants at a background and the street site the relative emission factor (relative to e.g. CO) can be derived. Information on the relative emission factor along with the development of the BS concentration in a particular area will provide insight in the success or failure on the local implemented abatement measures.
4
Black Smoke Phenomenology
In the LML BS had been measured at 29 station for the complete period down to only some months. These stations were characterized as regional representative, often referred to as rural, urban stations, including city background and street stations. In the past the design of LML BS has changed frequently for various reasons. Currently 12 stations are active (10 regional/rural and 2 street stations). At the stations where BS is measured some or all of the standard air pollutants (particulate matter (PM10),
NO2, ozone and sulphur dioxide) are measured as well. The monitoring methodology has been the same for a long time and when methods changed an extensive comparison exercise has been carried out to guarantee equivalency. The method generates daily averaged values.
Evaluation of the long standing data set of the LML BS monitoring over the years 1984 – 2006 provides an opportunity to study the phenomenology of BS in urban and rural environments in the Netherlands. The insights based on this phenomenology are relevant when addressing the feasibility for using BS monitoring and the issue of optimizing network design for evaluating specific abatement measures. In this Chapter the summary statistics are discussed and the temporal and spatial variation is captured in simplified models to generalize the BS concentration variability and assess trends.
4.1
Annual average concentration
Appedix 1 lists the annual average concentration measured at all the LML sites where for some time BS has been monitored (Figure 1). At 4 stations monitoring has continued from the start (April 1984) until 2006. Figure 2 shows the time course at these stations.
The correlation of the annual average concentration at these sites is high (0.91- 0.98). Two major observations can be made: (i) a tendency downwards for all sites; concentrations at the urban station has decreased from 25 to 15 ug/m3 and at the background station from 13 to 8 ug/m3, and (ii) no extreme deviation from the model since 1998, whereas before then levels could be up 50% higher relative to the next year.
Figure 1: Monitoring stations of the Dutch National Air Quality Monitoring Network active for some period or continuously since 1984.
Figure 2: Annual average BS concentration at 4 LML stations for the period 1984 – 2006.
0 5 10 15 20 25 30 35 1984 1986 1988 1990 1992 1994 1996 1998 2000 2002 2004 2006
Time (ye ar)
B S co n c en tr a tio n ( u g /m 3 ) 131 230 433 722
4.2
Temporal variation
To evaluate the temporal variation the moving averages (N=3) of the monthly averaged values are used. This reduces the short term variation. In general the BS concentration varies over time with maxima during the winter period and minima during the summer period. This periodical variation can be described by sinusoidal function, the trend is described with a monotone decrease over the entire period measurements are available:
where BS is the moving average monthly BS concentration, BSAmpl the variation being constant over
the entire period, (f/b)-c the frequency and phase of the temporal variation, BSOffset the starting monthly
average concentration and tr the constant trend over the entire period and finally Err, the error between model and measurement. The constants are obtained by minimizing Err using the least squares method. This approach reveals the long term trend and more or less corrects for year-to-year variation. A more adequate approach would be the meteorological correction for which, however, laborious dispersion model calculation runs would be required.
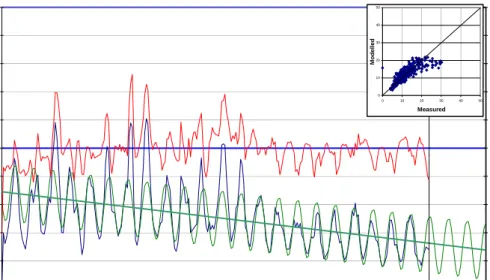
Figure 3 shows the temporal variation as measured at LML230, the modelled concentration, the difference between modelled and measured and the trend line. The regression graph compares the modelled and measured concentration. The temporal variation frequency equals once a year with the maximum in the months December and January. Substantial deviations from the model occurred in a number of years before 1997 (in particular ’87, ’89, twice ’91, 95 and 96). At other LML sites this also occurred during November 1994. In the years since 1996 the measured values follow the modelled levels or show a decrease down to 50% of the modelled amplitude (e.g. 1999). A forecast is added in the graph for the years 2007-2010 assuming the trend will continue; for LML230 the maximum levels (in the winter 2009-2010) are estimated at 11 ug/m3.
Table 2 lists parameters for the stations with at least 8 years of measurement data. For the other stations substantial less data were available. The offset and amplitude give the minimum and maximum values at the start of the measurement period (Offset- 2* Amplitude, Offset respectively). Regression analysis showed that the amplitude is proportional to the offset. The annual trend (in ug/m3/year) for the regional/rural stations range from 0.3 to 0.5 ug/m3/year. For the street station this is almost double (0.7-0.8 ug/m3/year) and is also found to be proportional to the offset and amplitude. The high value calculated for LML636 (2. ug/m3/year) is caused by the high concentration before 2001 and a sharp
Err
tr
BS
c
b
f
BS
BS
meas Ampl⎟
+
Offset−
+
⎠
⎞
⎜
⎝
⎛ −
⋅
=
.
cos
decrease that occurred in first quarter of 2001. A sequence of events is discussed to explain this (see paragraph on Intervention case study).
Figure 3: Temporal variation of monthly averaged BS concentration at LML230, measured (blue) and modelled (green) and trend line (solid green line), the difference between modelled and measured (red). The regression graph compares the modelled and measured concentration.
Table 1: Results temporal variation analysis of monthly moving average BS concentration measured at stations with at least 8 years of monitoring data. For details on coefficients see text. LML Station Type Amplitude (µg/m3) Offset (µg/m3) Trend (µg/m3/year) Correlation model-measurement N 131 Regional 4.6 16.8 -0.4 0.8054 273 133 Regional 5.0 18.6 -0.5 0.8127 226 230 Regional 5.1 17.3 -0.4 0.8565 273 318 Regional 5.5 15.6 -0.4 0.8912 248 433 Street 5.5 28.6 -0.7 0.8618 273 437 Regional 4.8 17.5 -0.5 0.8232 211 444 Regional 3.9 13.1 -0.4 0.7958 148 631 Regional 5.3 11.1 -0.1 0.8161 117 636 Regional 8.8 35.2 -0.8 0.8373 150 637 Street 12.0 83.7 -2.9 0.7363 180 640 City 5.2 21.0 -0.5 0.8311 180 722 Regional 4.4 12.7 -0.3 0.8539 273 928 Regional 5.1 11.8 -0.3 0.7934 187 0 25 50 4-1984 4-1985 4-1986 4-1987 4-1988 4-1989 4-1990 4-1991 4-1992 4-1993 4-1994 4-1995 4-1996 4-1997 4-1998 4-1999 4-2000 4-2001 4-2002 4-2003 4-2004 4-2005 4-2006 4-2007 4-2008 4-2009 Time (month) BS conc entrati o n (ug/ m 3 ) -25 -20 -15 -10 -5 0 5 10 15 20 25 Devi ati o n m odel -m easured 0 10 20 30 40 50 0 10 20 30 40 50 Measured M o d e lle d
The day-today variation during the winter periods with high monthly averages is illustrated in Figure 3. The concentrations in the 1995-96 period are somewhat lower than during the winter 1987 period but the pattern is similar.
0 20 40 60 80 100 120 140 160 1-12-1995 8-12-1995 15-12-1995 22-12-1995 29-12-1995 5-1-1996 12-1-1996 19-1-1996 26-1-1996 Time (date) B S co nc en tr at io n ( u g /m 3 ) 131 230 433 722 640
Figure 4: Day-to-day variation at a number of LML sites during winter 1987 and the winter 1995-96.
Schaap en Denier van der Gon (2006) evaluated the same BS data of the LML network as used in this report. Analysis of the variation over the week revealed that at rural stations the concentration on weekdays (Monday – Friday) was 30-50% higher than on Sunday and 40-60% on urban stations. At street stations the levels during weekdays was even 80-110% higher than on Sundays. This clearly illustrates the substantial contribution of traffic.
4.3
Spatial Variation
In a comparison of BS, elemental carbon and organic carbon data available from various studies in the Netherlands Schaap and Denier van der Gon (2006) found a low spatial gradient from south
(approximately 9 ug/m3) decreasing to the north-west (5.5 ug/m3). Based on European-scale modelling (using LOTUS-EUROS) and validated with measurement data they estimated a contribution of Dutch sources to the concentrations in the Netherlands to 40-60% and in the Randstad area 50-60%.
The high density of sources in the western part of the Netherlands leads to high contributions (up to 80%) of Dutch sources with westerly winds as relative clean air arrives at the western coast and is laden with the emissions in the western part of the Netherlands.
The spatial variation is studied by using the principal component analyses (PCA) of the BS
measurement data and the PM10 measurement data at the BS monitoring sites for the year 2006. This
0 20 40 60 80 100 120 140 160 1-1-1987 8-1-1987 15-1-198722-1-1987 29-1-1987 5-2-1987 12-2-198719-2-198726-2-1987 5-3-1987 12-3-1987 19-3-198726-3-1987 Time (date) BS C o nc en tr at io n ( u g /m 3 ) 131 230 433 722
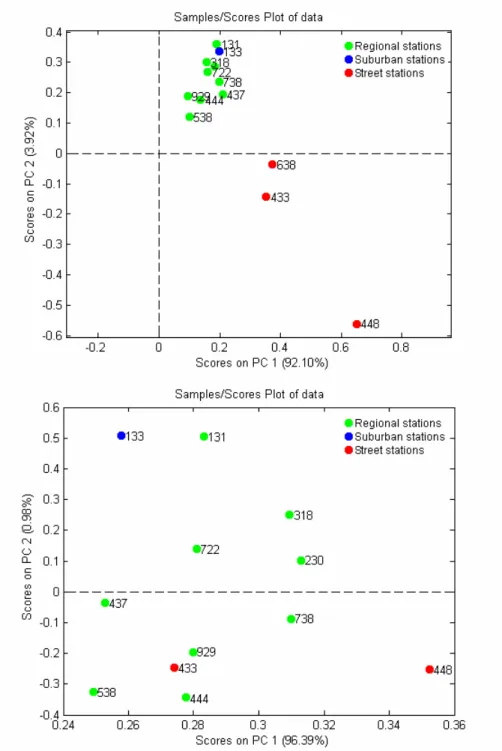
approach analyses the similarity and difference in the time coarse at the various monitoring sites. The plots for both the air quality parameters are given in Figure 5.
Figure 5: Principal-Component-Scores plot for the first two PCs for BS (top view) and PM10
(bottom view) explaining respectively 96% and 97% of the variation in the daily averaged concentrations measured in 2006.
Clearly the high similarity of the BS concentrations at the regional stations is seen and the substantial difference between the regional cluster and the street stations. The suburban site (133) is highly comparable with the regional sites. Within the regional cluster a gradient from 131 to 538 (high concentration to low – see Tabel in appendix 1) illustrates the gradient reported earlier by Schaap and Dernier van der Gun (2006). The street stations are well separated on both PCs demonstrating the specific behaviour of the BS levels over time at these sites.
For PM10 no distinct clusters are formed in the principal-component-scores plot illustrating the lack of
distinction between sites impacted by traffic and the regional sites. This is in line with the relative limited contribution of traffic emissions to the total PM10 concentrations in contrast with the
contribution of traffic to BS levels.
The correlation of PM10 and BS concentrations at the same monitoring site for 2006 only varies from
0,612- 0,821 for all sites and is only 0,635 maximum for the street locations. Muir and Laxen (1995) studied the relation between PM10 and BS at mainly urban background sites in the UK. They found
comparable values (58% of the variance of PM10 concentration is explained by BS concentrations) over
all years data were available for. A significant difference was observed for winter and summer regression which the authors explained by the difference in composition of BS as BS in summer contained more Brown Smoke than in winter. This caused the increase in BS not to be accompanied by a increase in PM10. The lack of correlation between PM10 and BS was also observed in the Peace
Study where the ratio PM10/BS ranged from 0.67 to 3.67 (Hoek et al, 1997).
4.4
Intervention case study
A large and sudden change of the BS concentration was observed at the LML637 station
(Wittevrouwenstraat, Utrecht) in the second half of 2000 and the first half of 2001 (see Figure 5). This was connected with the change in traffic management down-town Utrecht. In the new situation the inner-city was compartmentalized to prevent transit traffic using the centre of the city. Furthermore, buss routes were changed from the Wittevrouwenstraat to other streets. Before this could be realized, traffic, usually passing other streets, was redirected to the Wittevrouwenstraat during a limited period (phase A) starting in April 2000 and lead to more intense traffic (estimated at doubling the number of busses to 1400 daily) (Segaar, 2007). Nevertheless the BS concentrations reduced in April and May 2000 and were even lower than during the same period in 1999. Meteorological conditions were rather favourable (storms during May) for high dispersion. In June the concentrations at the
Wittevrouwenstraat (LML 637) increased sharply, slowly decreased over one year to the levels measured at the other traffic station located at the De Jongweg running just outside the centre of Utrecht (LML 636) and following in the meantime the temporal pattern also observed at the other stations, caused by the variation in source emission strength and the varying meteorological conditions. During this one year period reconstruction works in the Wittevrouwenstraat and other streets in the inner-city regularly lead to heavy congestions. Complaints of dwellers of the homes in the street and other public and political attention demanded additional traffic management initiatives. Tuning of traffic lights and changing priorities at crossings increased the traffic flow and reduced the congestion frequency. No traffic intensity data is available to relate the increase in concentration with.
Nevertheless the data shows that the temporarily increase of the traffic intensity (mainly busses) added 20 ug/m3 to the level measured before and that at the end of phase A the concentration at LML637 came down to the level measured at LML 636 and more or less stayed that way in the following years. Overall it can be concluded that the compartmentalization measures resulted in a decrease of the BS concentration in Wittevrouwenstraat of 15 ug/m3.
0 10 20 30 40 50 60 70 1-2000 7-2000 1-2001 7-2001 1-2002 7-2002 1-2003 7-2003 Date (month-year) B S c o nc e n tr a tion ( ug/m 3 ) 636 637 640 724
Start Phase A Start Phase B
Figure 6: BS concentration in Utrecht (LML637 – Wittevrouwenstraat; LML636 – De Jongweg, LML640 – University Library, LML724 – Wageningen) during the change of traffic management in fall 2000 and winter 2000-2001.
As more or less the traffic intensity did not change drastically during phase A the emissions are
expected to be reduced due to the improved flow and consequently the decrease emission per vehicle in the Wittevrouwenstraat. This shows the potency of BS over traffic intensity to monitor the impact of traffic management measures in relation to potential population exposure.
4.5
Black Smoke in other European Networks
A survey for other European networks where BS or another indicator for elemental carbon is measured results in the list given in Table 2. Other temporal monitoring networks (such as those used for
epidemiological studies) are not searched for. Measurement techniques are not always sufficiently clearly described. And even when identical methods are indicated only a close examination of protocols will eventually guarantee compliance (see remarks above). As BS is not a mandatory parameter the measurement is phased out or will be in the near future for some or many of the networks.
An exception is the UK where NPL (National Physical Laboratory) has recently started to redesign BS Network that consists of 21 sites. Nine out of the eleven new sites are urban background stations and there is one kerbside station in London (Butterfield et. al, 2007). The main rational for the redesign of the network was to optimize its use for epidemiological studies (Fowler et. al., 2006) and to move to systems with higher temporal resolution (Quencey, 2007b).
Table 2: Other European networks including BS measurements
Country/Province/City Organisation Remarks
NL- Rijnmond DCMR 2 sites Germany/Duisburg/Dusseldorf NRWF 3 sites Danmark none France none Norway none Austria none UK none
Sweden IVL 5 sites
Swiss none Belgium none
5
Discussion and conclusion
The non-compliance with PM10 EU directives is countered with a number of abatement measures that
are now in the process of implementation in various sectors, in particular transport.
For the evaluation of the impact of these measures monitoring information is required. Although PM10
is measured at a number of sites in accordance with the EU directive it is not expected that these data will provide the insight in the effect of the traffic related abatement measures; too many other sources, both natural and anthropogenic, contribute to the PM10 levels to guarantee that the reduction of the
sources focussed on will be subtracted from the PM10 monitoring data. Other air pollutants routinely
measured in the LML, such as nitrogen dioxide, carbon monoxide and sulphur dioxide, do not qualify as well.
Epidemiological studies focus on the effect of the exposure to traffic emissions and have used PM10
data, are increasingly applying PM2.5 data , PM1.0, number counts or carbon indicators such as BS and
EC. As BS monitoring data provides long term exposure estimates this metric is frequently selected. Hence for this purpose too continuing BS monitoring might be considered relevant.
To evaluate the potency of continuing monitoring of BS monitoring with or without modifications the following aspects are considered relevant:
1. Source indicator: BS is related to the combustion of organic fuel. The relevant sources for which BS is an indicator are road transport (51%) and industrial and domestic oil combustion (34%). In rural areas far away from urbanized and industrialized area BS measurements also include substantially Brown Smoke. Although, most of the Netherlands does not qualify as rural in this sense the contribution of Brown Smoke during summer needs to be looked after. Nevertheless BS measured in urban areas is to be considered as an appropriate indicator for anthropogenic combustion processes.
2. Measurement method: The classical method is used for many years but suffers from the dependency on the composition of particulate matter (reflected in the site and season dependency). New methods measure elemental carbon, assumed to be of the same nature as BS. However, these methods still give results that depend on methodology used and are not comparable for the elemental carbon results.
3. Monitoring Network: The BS monitoring network design has been modified regularly. At 29 sites BS has been measured for some time. At 4 stations the monitoring is started in 1984 and
continued until this date. Currently (2006) 13 sites are operational of which 2 are located at street station.
4. Phenomenology: Studying the large data set of the LML revealed that the annual averages for regional areas range from 4 – 9 ug/m3 and a spatial gradient exists south down to north-west from 9 – 6 ug/m3. At street stations BS concentrations are larger and range from 8 – 27 ug/3 in line with the proximity of the major source, traffic. The temporal pattern shows the usual episodes of some days to a week or longer, high levels during the winter and minimum during the summer months and a long term trend since the beginning of the monitoring (1984) of approximately 0.3 – 0.5 ug/m3/year for regional stations and 0.7 – 0.8 ug/m3/year for street stations. This trend is related to the reduction of the long-term averages rather than the variation over the year. Since 1997 the maximum values during the winter do not vary from year to year as much as before that date. The spatial correlation analysis revealed the high correlation with space and with function (regional and street station). For PM10 the spatial and
functional (street vs urban) no such correlation is obtained.
The spatial analysis describe a large scale background concentration of approximately 6 ug/m3 and local peaks up to 27 ug/m3 in heavy traffic streets.
5. Monitoring for policy evaluation: The intervention case study in Utrecht shows clearly the impact of a change in traffic management on BS concentrations: a reduction of approximately 15 ug/m3 in what was a heavy traffic street was obtained. High levels during the transition period were substantially reduced by optimizing traffic flow achieved by tuning traffic lights and changing priority at crossings. This intervention study clearly indicates the potency of BS monitoring over traffic intensity measurements.
6. Volume abatement measures vs technology measures. The planned abatement measures include both volume measures (environmental zones, speed limits, etc.) and technological modifications (filter etc). To discriminate between the impact of volume measures optimized site selection as was (unintentionally) the case in Utrecht is expected to be successful. To measure the impact of technological measures monitoring BS in an network optimally is accompanied by the assessment of the (relative) emission factor for BS. The MEDAM
approach will provide an easily conducted study for the emission factor of the fleet cruising the streets.
7. Monitoring for exposure assessment in epidemiological studies: The spatial distribution of BS will be related partially to the proximity of traffic emissions. A rough estimate can be made by comparing the regional concentration, the city background levels and the street stations. The data set of 2004 provides these data: (5.4 ug/m3 – regional (722), 7.7 ug/m3 – city background (LML640), 15.6 and 19.9 ug/m3 – at the street stations (LML637) and LML638). Based on
these values the contribution of nearby traffic is 4 times more the regional background concentration whereas at city background sites this is approximately 50% of the regional background concentration. This indicates the necessity to design the monitoring sites with a high density reflecting the distribution of traffic over the city. As traffic emissions and its dispersion show diurnal variation inclusion of aetholometers needs to be considered as well. Such a network will differ substantially from the type of network as LML currently is. 8. Modification the current BS monitoring Network: Changing the setup of the monitoring
network might use the current set of monitoring sites of the LML. In that case relocation of the BS monitors depends only on the available space in the (mainly urban) stations. As at present the housing of the instrumentation is in the process of renewing this redesign of the BS network needs to be included now. If the redesign of the network implies new stations substantially more is needed and completion will need more time and will need substantially more budget.
In summary it can concluded that BS monitoring would provide appropriate data for following the impact of abatement measures. The measurement method currently in use is probably the best choice although the site and season dependency is limiting the data for extrapolation.
6
Recommendations
To optimize monitoring BS in LML the following recommendations are formulated:
Redesign the BS monitoring network and focus on the impact of abatement measures. Select typical streets or heavy traffic areas, cities for which measures (volume measures such as environmental zones and specific traffic management) are formulated and will be implemented soon. Estimate minimum time and budget required for both the options of just relocating monitoring instrumentation or of including entirely new monitoring sites.
Assess the minimum regional sites keeping in mind the high temporal and spatial correlation. Start as soon as possible to obtain data on ‘zero’ situation (no measures implemented yet) Maintain the four sites where monitoring started in 1984 and are operation until now
(LML131, LML230, LML433 and LML722) to continue long-term trend assessment. Estimate the relative impact of both volume based abatement measures and reductions
obtained by the penetration of technology based measures. This is achieved by regularly obtaining the (relative) emission factors of the fleet cruising urban areas.
Install addition monitoring equipment, including aethalometers for high temporal resolution monitoring, when the redesigned network is to be used for exposure assessment in population based health effect studies.
Invest in research to compare the standard LML method with other methods currently in use to enable the extrapolation of LML data and evaluate these data in combination with other monitoring activities both in the Netherlands and abroad.
References
M.O. Andreae and A Gelencsér (2006). Black Carbon or brown carbon? The nature of light-absorbing carbonaceous aerosol. Atmos. Chem. Phys., 6, 3131-3148.
H.J.Th. Bloemen and E.M. van Putten (1998). Mobile Emission Factor Determination through Ambient Air Monitoring – MEDAM project
RIVM Report 723301008
M.E. Birch (1998). Analytisi of carboneceous aerosols. Interlaboratory comparison. Analyst, 123, 851-857.
E. Buijsman, J.P.Beck, L. van Bree L van, F.R. Cassee, R.B.A. Koelemeijer, J. Matthijsen, R. Thomas , K. Wieringa, (2005). Fijn stof nader bekeken / Particulate Matter, a closer look, ISBN:9069601249. MNP rapport 500037008.
D. Butterfield, P. Quencey, R. Yardley, P. Hughey and R. Lipscombe (2007). 2006 Annual report for the UK Black Smoke Network. NPL report AS 2, Londen UK.
M. Christolis, P. Clayton, P. Hecq, M. Payrissat and F. Petit-Coviaux (1992). Instruction Manual for air pollution monitoring. Volume II: Black Smoke Monitoring. EUR 14450/II EN.
P. Fischer et al (2007) In preparation
A.D. Fowler, J.N. Cape, R. Derwent, G. Hayman, R. Harrison, D. Laxen, A. Loader, S. Moorcroft, J. Stedman, M. Sutton and J. Targa (2006). A Review of the UK urban network for measurement of Black Smoke, SO2 and NO2: Summary report.
B.M. Hijink (2002). Acceptatierapport van 17 SX200 zwarte rook monitoren RIVM rapport 723101066.
R. Hitzenberger, S.G. Jennings, S.M. Larson, A. Dillner, H. Cahier, Z. Galambos, A. Roue and T.G. Spain (1999). Intercomparison of measurement methods for black carbon aerosols. Atmos. Env 33 (1999) 2823-2833.
G. Hoek, H. Welinder, E Vaskovi, G Ciacchini, N. Manalis, O Royset, A Reponen, J. Cyrys and B. Brunekreef (1997). Interlaboratorium comparison of Pm10 and Black Smoke measurements in the Peace study. Atmos Env 31, 3341-3349.
G. Hoek, B. Forsberg, M Borowska, S Hlawiczka, E. Vaskövi, H. Welinder, M. Branis, I. Benes, F. Lotesovex, L.O. Hagen, J. Cyrys, M. Jantunen, W. Roemer and B. Brunekreef (1997). Wintertime PM10 and Black Smoke concentrations across Europe: results from the Peace study. Atmos Env, 31 3609-3622.
V.M.H. Lavanchy, H.W. Gäggeler, S. Nyeki and U. Baltensperger (1999). Elemental carbon (EC) and black carbon BC) measurements with a thermal method and an aetholometer at the high-alpine research station Jungfraujoch. Atmos. Env. 33, 2759-2769.
C.A. Pope and D.W. Dockery (2006). Health Effects of Fine Particulate Air Pollution: Lines that Connect. J. Air & Waste Manage. Assoc., 56: 709-742.
P. Quincey (2007). A relationship between Black Smoke Index and Black Carbon concentration. Atmos. Env. In press doi: 10.1016/j.atmosenv.2007.09.033
P. Quincey (2007b). Personal communication.
Schaap et al. (2004). Antropogenic black carbon and fine aerosol distribution over Europe. J. of Geophysical Research 109, Doi:10.1029/2003JD004330.
M. Schaap and H.A.C. Denier van der Gon (2006). On the varaibility of Black Smoke and carbonaceous aerosol in the Netherlands. Atmos. Env. 41, 5908-5920.
S. Sharma, J.R. Brook, H. Cahier, J. Cjow, A. Gaudenzi and G. Lu (2002). Light adsorption and thermal measurements of black carbon in different regions of Canada. J of Geophysical Research, 107, D24, 4771, Doi:10.1029/2002JD002496.
D.G. Streets, S. Gupta, S.T. Waldhoff, M.Q. Wang, T.C. Bond and B. Yiyun (2001). Black carbon emissions in China. Atmos. Env. 35, 4281-4296.
P. Segaar, (2005). Personal communication.
USEPA (2007). Technology Transfer Network, Clearinghouse for Inventories & Emissions Factors (CHIEF), http://www.epa.gov/ttn/chief/index.html
J.G. Watson and J.C. Chow (2002). Comparison and evaluation of in situ and filter carbon measurements at the Fresno Supersite. J. of Geophysical Research, 107, No D21, 8341. doi: 10.1029/2001JD000573.
E.P. Weijers, G.P.A. Kos, J.H. van Wijnen, G.J. de Groot and H.J.Th. Bloemen (2005). Ultrafine particles measured near motorways, size distribution and emission factors.
In preparation
WHO, (2004) Health aspects of air pollution results from the who project “systematic review of health aspects of air pollution in europe” http://www.euro.who.int/document/E83080.pdf
K.H. Zierock, J. Smeets and H.P. Stief-Tauch (1985), Harmonization problems in the implementation of the EEC directive on air quality limit values and guide values for sulphur dioxide and suspended particulates. Environmental Monitoring and Assessment, 255-269.
Bijlage 1: Monthly average BS concentration at all sites of LML (at least 50% of daily averaged data available)
131 133 230 235 318 418 433 435 437 443 444 448 538 540 627 631 636 637 638 639 640 722 724 728 738 901 928 929 999 Type*) Reg Reg Reg Reg Reg Reg Str Reg Reg Reg Reg Str Reg Reg Reg Reg Str Str Str Str City Reg Reg Reg Str Reg Reg Reg Reg
1984 12,3 13,1 25,0 14,7 9,7 11,9 10,1 1985 14,5 13,7 26,0 14,6 10,5 11,0 10,7 1986 14,2 14,1 9,5 25,2 7,5 13,6 10,2 10,9 6,0 10,2 1987 19,6 16,1 20,2 17,4 16,6 32,9 19,8 12,5 11,5 18,5 14,0 15,2 14,4 10,8 14,0 1988 12,5 12,6 13,5 10,8 10,2 22,3 11,6 7,4 9,0 12,7 8,9 8,6 11,3 6,8 8,3 1989 15,6 16,9 16,4 15,7 14,3 18,5 27,9 14,5 14,0 9,3 11,9 15,5 11,6 29,3 46,4 18,1 11,7 14,6 27,6 10,0 1990 12,8 13,4 13,7 10,8 17,6 25,0 12,6 12,4 7,6 9,5 13,8 9,0 27,2 61,0 16,2 9,3 12,1 24,1 7,8 1991 19,1 18,5 19,5 16,8 17,2 23,4 30,9 16,9 17,8 12,0 15,2 18,6 13,2 35,3 69,1 16,7 13,4 17,4 28,0 12,3 1992 13,3 14,5 14,7 12,7 12,5 15,8 20,2 12,3 10,6 8,0 10,3 13,4 9,9 56,2 14,4 9,9 12,2 23,7 8,3 1993 12,1 13,1 13,7 11,9 11,4 18,9 11,9 12,8 7,7 12,1 8,8 23,9 53,6 14,1 9,2 11,4 7,6 1994 13,7 13,8 14,4 11,6 20,6 12,1 8,4 27,3 61,3 15,1 9,7 10,8 8,6 1995 13,1 13,7 13,3 11,2 22,1 12,1 9,3 7,9 27,2 61,0 17,3 10,2 12,3 8,3 1996 14,7 16,5 16,5 14,1 25,9 14,8 11,9 10,6 26,8 59,4 18,3 12,3 14,1 10,4 1997 13,0 14,2 13,4 10,3 22,2 12,1 9,1 7,8 24,9 44,1 14,3 9,8 11,8 7,2 6,6 1998 9,8 10,6 11,1 9,1 17,6 8,5 6,7 6,1 20,5 40,8 11,5 7,3 9,7 5,4 4,9 1999 8,8 9,8 9,6 8,1 17,6 8,0 5,7 5,4 19,7 48,6 23,3 11,4 6,6 8,4 4,9 4,6 2000 8,4 8,7 9,1 7,8 17,4 8,0 5,5 6,2 21,1 43,7 11,3 6,6 8,3 4,9 2001 7,6 8,8 9,6 7,6 16,1 7,6 4,7 4,0 19,1 26,2 11,1 5,7 7,6 4,7 2002 8,1 8,4 9,4 7,4 15,0 7,6 6,3 6,1 18,0 15,5 11,4 6,4 7,9 6,1 2003 8,2 9,1 9,7 9,4 15,6 8,5 6,4 5,3 14,1 18,6 10,6 6,1 7,8 5,0 2004 6,7 7,7 7,8 6,6 14,1 6,5 5,0 3,8 15,6 19,9 7,7 5,4 6,8 4,0 2005 7,7 7,7 8,1 5,8 14,2 6,1 4,6 34,1 4,4 18,4 5,8 6,7 4,3 2006 7,7 8,5 7,1 6,0 13,8 8,4 5,6 27,2 4,1 16,1 6,9 7,8 4,1