poly(methyl methacrylate) towards chemical recycling
Feedstock reconstruction and characterization of
Academic year 2019-2020
Master of Science in de industriële wetenschappen: chemie
Master's dissertation submitted in order to obtain the academic degree of
Counsellors: Kyann De Smit, Eli Moens
Supervisors: Prof. An Verberckmoes, Prof. Paul Van Steenberge
Student number: 01608327
Ruben Van der Venne
LABORATORY FOR CHEMICAL TECHNOLOGY
Technologiepark 125, 9052 Gent, Belgium
Declaration concerning the accessibility of the master thesis
Undersigned,
Ruben, Van der Venne
Graduated from Ghent University, academic year 2019-2020 and is author of the master thesis with title:
Feedstock reconstruction and characterization of poly(methyl methacrylate) towards chemical recycling
The author(s) gives (give) permission to make this master dissertation available for consultation and to copy parts of this master dissertation for personal use. In the case of any other use, the copyright terms have to be respected, in particular with regard to the obligation to state expressly the source when quoting results from this master dissertation.
31/05/2020
I
Preface
I would like to use this preface to thank a number people who have contributed to this work in different ways:
First of all, I would like to thank my supervisors Prof. Paul Van Steenberge and Prof. An Verberckmoes for giving me the opportunity to study this subject and sharing their expertise.
I wish to thank Kyann De Smit and Eli Moens for their guidance during this work. They were always available for questions or advise, corrected my thesis multiple times and provided me with useful feedback.
Thanks to the staff, researchers and direction of the LCT, I was able to carry out the experimental work in an open and friendly environment.
Special thanks goes out to Lies De Keer for letting me use her computer model for simulation of FRP. At last I would like to thank my parents for giving me the opportunity to follow this education and supporting me during it.
II
Abstract
A PMMA feedstock is reconstructed using bulk and emulsion polymerisation. H1-NMR, C13-NMR and
FTIR are evaluated as potential analysis techniques to characterize the obtained polymers making use of Chemdraw software. The CLD is determined using SEC (GPC), the degradation process is evaluated using TGA data from literature. Some characterization techniques to detect and quantify structural defects (unsaturated chain ends and head-to-head defects) in the polymer chain are discussed. The effect of reaction conditions (temperature and initiator concentration) is evaluated based on data obtained from a simulation model for FRP polymerisations. An increase of initiator results in an even increase of the number of head-to-head defects. Temperature increase will result in the dissociation of more initiator molecules forming more growing chains. This will also result in an increase of the number of head-to-head defects.
Keywords: PMMA, chemical recycling, structural defects, regioregularity, FRP, bulk, emulsion
Een PMMA feedstock wordt gereconstrueerd met behulp van bulk- en emulsiepolymerisatie. H1-NMR,
C13-NMR en FTIR worden geëvalueerd als mogelijke analysetechnieken om de verkregen polymeren te
karakteriseren aan de hand van Chemdraw software. De CLD wordt bepaald met behulp van SEC (GPC), het degradatieproces wordt besproken door het gebruik van TGA-gegevens uit literatuur. Sommige karakteriseringstechnieken om structurele defecten (onverzadigde ketenuiteinden en head-to-head-defecten) in de polymeerketen op te sporen en te kwantificeren worden besproken. Het effect van mogelijke reactieomstandigheden (temperatuur en initiatorconcentratie) wordt geëvalueerd op basis van gegevens verkregen uit een simulatiemodel voor FRP-polymerisaties. Een toename van de initiatiatorconcentratie resulteert in een evenredige toename van het aantal head-to-head defecten. Een stijging van de temperatuur zal resulteren in de dissociatie van meer initiatormoleculen en vervolgens ook meer groeiende ketens. Dit zal ook leiden tot een toename van het aantal defecten. Kernwoorden: PMMA, chemische recyclage, structurele defecten, regioregulariteit, FRP, bulk, emulsie
III
Feedstock reconstruction and characterization of
poly(methyl methacrylate) towards chemical recycling
Ruben Van der venne
supervisors: Prof. An Verberckmoes, Prof. Paul Van Steenberge counsellors: Kyann De Smit, Eli Moens
Abstract In chemical recycling, the pyrolysis process is a popular way of converting plastic waste feedstock back into monomer. For PMMA this process can have yields reaching up to 97%1.
The degradation process of PMMA can be influenced by so called initiation loci or structural defects. These defects can be the result of unusual regioregularities in the chain head-head defects or tail-tail defects (H-H or T-T) or unsaturations at the end of the chain. It is presumed that these defects initiate the degradation process. Therefore, it can be of great value to detect or perhaps quantify these defects in a PMMA waste feedstock. In this work a PMMA feedstock is reconstructed using both bulk and emulsion polymerisation. It is shown by simulations of spectra that C13-NMR and H1
-NMR could be addressed to detect these defects. A simulation of FRP polymerisation using a VBA coded model is used to verify the influence of reaction parameters on the amount of head-to-head defects.
Keywords: PMMA, chemical recycling, head-head defect, NMR, FRP, bulk polymerisation, emulsion polymerisation, regioregularity
Introduction
Chemical recycling and more specific pyrolysis can be used to convert a plastic waste feedstock into a monomer stream. This has many advantages compared to conventional mechanical recycling. Pyrolysis is the heating of polymer in a pyrolizer at high temperatures in the absence of oxygen to decompose the polymers into smaller sections.2 The products
of a pyrolysis can be oil, gas, residue, monomer or other products. For PMMA the pyrolysis returns mostly monomer (97%) which makes it a very promising material to set up a recycling system.1 Also for PS high monomer yields can
be obtained.
PMMA obtained from an FRP reaction consist of both head-to-head defects and unsaturated end groups. The thermal degradation mechanism is the following: First head-to-head defects will degrade because of their lower dissociation energy than regular C-C bonds in the polymer backbone.3–5 After that the
unsaturated chain ends will dissociate at a higher temperature. At even higher
temperatures the degradation of the whole PMMA chain will occur. This will mostly consist of end group scission rather than random chain scission. This because a PMMA has a strongly steric hindered structure.3,5 In Figure 1 the
mechanism for end group scission of PMMA is given.
Figure 1 schematic representation of the mechanism for end group scission of a PMMA chain
The earlier discussed defects are the result of the radical polymerisation mechanism. PMMA is often polymerized using the FRP mechanism. In FRP chains are initiated using a radical initiator, because of the highly reactive character of these radicals a fast propagation reaction is obtained. This results in typically high molecular weights and a fast conversion. The FRP mechanism for PMMA can be seen in
IV Figure 2. Head-to-head defects can be formed in two ways: either a MMA molecule undergoes a head-head propagation as shown in reaction (d) or two active chains combine into one in a bimolecular termination reaction (e). The first case is less likely to happen because of the steric hinderance a MMA molecule has on one side of the double bond. Also it would be highly uncommon for a primary radical to be formed instead of a more stable tertiary radical. Therefore the contribution of head-to-head propagation to the total amount of head-to-head defects can be neglected. All the head-to-head defects are formed by the combination reaction (e).
Figure 2 schematic representation of the FRP mechanism without transfer reactions
Results
I. Reconstruction of a PMMA
feedstock
MMA is polymerised in bulk using 0,6wt% AIBN initiator. The reaction mixture only consist of monomer and initiator at the start of the reaction. The reactor is heated to constant temperatures using a thermal oil system. The
mixture is constantly stirred (200 rpm) and the temperature is measured during the reaction. A draw of the experimental setup is given in Figure 3.
Figure 3 schematic representation of the experimental setup for bulk polymerisation
The conversion is measured using a
gravimetrical method to set out conversion profiles at different temperatures.
Figure 4 conversion profiles of bulk FRP at different temperatures
Below ±20% conversion the propagation and termination rate are more or less constant, explaining the linear evolution of the monomer conversion. When reaching higher conversions (>20%), diffusion limitation will effect mainly the termination reaction. Conversion will at this point increase rapidly as seen on Figure 4 for the curves of 50 and 60°C. The difference between the temperatures are the result of higher reaction rates at higher temperatures. Mostly the dissociation reaction will produce more radicals at higher temperatures resulting in a faster conversion. II. Characterization -0,1 0 0,1 0,2 0,3 0,4 0,5 0 50 100 150 200 M onom e r conv e rs ion (-) Time (min) 70°C 60°C 50°C
V Determination of the chain lengths of the reconstructed PMMA feedstock was done using SEC (GPC). To detect the earlier mentioned defects a number of analysing techniques can be used. In this study FTIR, H1
-NMR and C13-NMR were used to detect defects
located in the polymer chain.
Samples taken at ±10% and ±20% conversion, from experiments at different temperatures, are analysed using GPC equipment. The results show a shift towards lower molecular weight when increasing temperature. This is the result of higher initiator dissociation rates resulting in more and shorter chains at higher temperatures. The shift is illustrated by the arrow on the GPC traces in Figure 5.
Figure 5 chain length distributions of reconstructed PMMA
FTIR can be used to characterize the molecular nature of a polymer. A FTIR spectrum acts as a fingerprint of a certain molecule, therefore this technique might be used to identify impurities in the PMMA. By measuring the vibration and stretching energies of certain bonds in the polymer the presence of a C=C bond (unsaturated end group) could be detected. The C=C stretching band is expected to lie in the region of 1658-1648 cm-1.
NMR could be used to identify head-to-head defects. This technique measures the nuclear spin of a substance in a magnetic field. The chemical shift of protons or carbon atoms can be measured. This shift is related to their chemical environment, this allows for detection of: head-to-head defects, tail-to-tail
defects and unsaturated end groups. Spectra of both H1-NMR and C13-NMR were generated
using the chemdraw software.
H1-NMR allows for detection of unsaturated
end groups and tail-to-tail defects. The simulated H1-NMR spectrum for a chain of 10
monomer units containing a tail-tail defect is given in Figure 6, where the d peak at 1,54ppm corresponds to the methylene groups in the tail-to-tail defect.
Figure 6 H1-NMR spectrum of a PMMA chain of 10 monomer units containing a T-T defect
Tail-to-tail defects are formed after the formation of a head to head propagation. Since the formation of a tertiary radical is more favoured due to the greater stability. The primary radical prefers to react with the MMA monomer in a way that results in a tertiary radical centre and a preceding tail-to-tail defect.
Head-to-head defects could not be detected using H1-NMR. It should be expected that two
substituted carbons located directly next to each other cause a deviation in the chemical shift of the surrounding protons. Although when simulating the spectrum for this type of defect, no differences occurred in the spectrum.
The head-to-head defects could only be detected using C13-NMR. The peaks g and h on
the spectrum (Figure 7) are originated from respectively the quaternary carbons in the head-head defect and the carbons of the methyl groups directly on them. These show a chemical shift of 43,4 and 21,8ppm.
0 0,2 0,4 0,6 0,8 1 1,2 1,4 3 4 5 6 7 dw dl og( M ) log(M) 50 °C 60 °C 70 °C
VI Figure 7 C13-NMR spectrum of a PMMA chain of 10 monomer units containing a H-H defect
Tail-to-tail defects are harder to detect using C13-NMR. On the spectrum given in Figure 8 it
is clear that the f peak which corresponds with the methylene groups forming the tail-to-tail bond is not clearly visible. This is the result of the f peak falling together with d peaks originated from the quaternary carbons in the PMMA chain. A zoom of the spectrum between 20 and 40ppm is given in Figure 9.
Figure 8 C13-NMR spectrum of a PMMA chain of 10 monomer units containing a T-T defect
Figure 9 zoom of Figure 8 between 20 and 40ppm A summary of which type of defects can be detected by which techniques is given in Table 1. A quantitative study could be made by integrating the peaks on the NMR spectra. In order to do this the NMR equipment needs to have sufficient sensitivity to prevent that the signal of the few defects would go lost in the noise of the spectrum.
Table 1 summary of the different defects and detection techniques
DEFECT FEASIBLE DETECTION TECHNIQUES UNSATURATED END GROUP FTIR, H1-NMR and C13 -NMR HEAD TO HEAD C13-NMR
TAIL TO TAIL H1-NMR and C13-NMR
III. Kinetic Monte Carlo model to
simulate FRP
A kinetic Monte Carlo model to simulate a FRP polymerisation was further elaborated in visual basic for applications (VBA). This model contained four reactions: dissociation, chain initiation, propagation (head-to-tail) and termination by combination. Attempts were made to modify the code in order to keep record of the formed head-to-head defects. To do so two more reactions were added: one for the head-to-head propagation and one for the termination by disproportionation. Where the latter does not generate any head-to-head defects but is needed to ensure termination can occur in two ways.
The rate constants for the reactions were taken according to those of a AIBN initiated FRP of PMMA as described in literature.6 All used rate
constants are listed in Table 2. Because no literature values could be found for the reaction rate of head-to-head propagation this value is taken sufficiently low (ratio of 1/10.000 compared to the head-to-tail propagation). Table 2 overview of the rate constants used in the kinetic Monte Carlo model (all reaction rates for 70°C)
REACTION RATE COEFFICIENTS
I2 → 2I 3,20.10-5 I+M → R 1,04.103 R+M → R (H-T) 1,04.103 R+M → R (H-H) 1,04.10-2 R+R → P 1,44.108 R+R → P+P 5,59.107
In the model use is made of a kMC algorithm, random numbers are generated to select a
VII case that corresponds to a certain reaction. The probability by which a case (reaction) is selected is based upon the input (reaction rates and concentrations). This process is repeated until a monomer conversion of 70% is reached. A major flaw in this model is that it does not take any diffusion limitations into account. The data obtained from the kinetic Monte Carlo model can be used to set out conversion profiles. The first 20% of the conversion profile shows a similar shape than the ones obtained from experiments in bulk (Figure 10). Because below this conversion no diffusion limitations are observed. The conversion profile of the simulation shows a slightly flattened behaviour towards higher conversions. This is the result of a decreasing propagation rate due to the depletion of monomer. The initial initiator concentration could not be taken similar to the experiments because too few molecules would be generated by the computer model.
Figure 10 conversion profile of experiments of bulk FRP and a simulation of FRP using the kMC model in VBA The number of head-to-head defects is counted and returned as output of the VBA model. The initiator concentration was varied to measure the influence of this on the amount of defects formed. This relation is given in Figure 11.
Figure 11 relation between initiator concentration and number of H-H defects (T=70°C)
As expected a linear relation can be seen. When the input value of the initiator concentration is increased, the number of growing chains will increase evenly. More growing chains will result in more termination, since a fixed share of the total termination reactions is taken as combination. This will result in an even increase of the combination reactions. Each termination by combination reaction the code adds one to the number of head defects. The number of head-to-head defects originated from the propagation reaction can be neglected due to its low rate constant compared to that of the head-to-tail propagation. If in fact the head-to-head propagation reaction would be of significant value, the relation between initiator concentration and amount of defects would still be linear.
The influence of reaction temperature on the amount of head-to-head defects is visualized in Figure 12. An slightly exponential increase is observed. This is the result of both increasing dissociation rate and increasing termination rate at higher temperatures. Resulting in more and shorter chains containing more head-to-head defects. 0 0,05 0,1 0,15 0,2 0,25 0,3 0,35 0,4 0,45 0 10 20 30 40 50 M onom e r conv e rs ion (-) Time (min) 70°C 0,6% AIBN (bulk) 70°C 3% AIBN (kMC model) R² = 0,997 94000 96000 98000 100000 102000 104000 106000 108000 2% 3% 4% 5% 6% 7% n u m b er o f H -H d ef ects initiator concentration (wt%)
VIII Figure 12 relation between reaction temperature and number of H-H defects (conc. AIBN = 3%)
Conclusion
In this work a PMMA feedstock is reconstructed in bulk and emulsion. The obtained polymers are characterized using SEC, FTIR and NMR to detect structural defects in the polymer chains. SEC (GPC) is used to examine the influence of reaction parameters on the molecular weight and CLD. FTIR can be used to detect impurities and unsaturated chain ends. The NMR technique is found to be quite useful in detection and perhaps even quantification of structural defects (head-to-head, tail-to-tail and unsaturated end groups). A kinetic Monte Carlo model is further elaborated to simulate FRP. The outcome of the model is compared to results from actual experiments. They show good convergence below 20% conversion. Also the influence of reaction parameters on the number of head-to-head defects generated by the code is considered. More initiator and higher temperatures will result in more head-to-head defects.
References
1. Kaminsky, W., Predel, M. & Sadiki, A. Feedstock recycling of polymers by pyrolysis in a fluidised bed. in Polymer Degradation and Stability (2004). doi:10.1016/j.polymdegradstab.2003.0 5.002
2. Ragaert, K., Delva, L. & Van Geem, K. Mechanical and chemical recycling of
solid plastic waste. Waste Management 69, 24–58 (2017). 3. Ferriol, M., Gentilhomme, A., Cochez,
M., Oget, N. & Mieloszynski, J. L. Thermal degradation of poly(methyl methacrylate) (PMMA): Modelling of DTG and TG curves. Polym. Degrad. Stab. 79, 271–281 (2003).
4. Manring, L. E., Sogah, D. Y. & Cohen, G. M. Thermal Degradation of
Poly(methyl methacrylate). 3. Polymer with Head-to-Head Linkages.
Macromolecules 22, 4652–4654 (1989). 5. Kashiwagi, T. et al. Effects of Weak
Linkages on the Thermal and Oxidative Degradation of Poly(methyl
methacrylates). Macromolecules 19, 2160–2168 (1986).
6. Beuermann, S. et al. Critically evaluated rate coefficients for free-radical polymerization, 2: Propagation rate coefficients for methyl
methacrylate. Macromol. Chem. Phys. 198, 1545–1560 (1997). y = 6447e0,0382x R² = 0,9962 70000 90000 110000 130000 150000 170000 190000 210000 230000 65 75 85 95 nu m be r o f H -H de fe ct s Temperature (°C)
IX
Feedstockreconstructie en karakterisering van
poly(methylmethacrylaat) voor chemische recyclage
Ruben Van der Venne
Promotoren: Prof. An Verberckmoes, Prof. Paul Van Steenberge Begeleiders: Kyann De Smit, Eli Moens
Abstract In chemische recyclage is het pyrolyseproces een populaire manier om plastic afval terug om te zetten naar monomeer. Voor PMMA kan dit proces een rendement hebben tot 97%1.
Het afbraakproces van PMMA kan worden beïnvloed door zogenaamde initiatieloci of structurele defecten. Deze defecten kunnen het gevolg zijn van ongebruikelijke regioregulariteiten in de keten, kop-kop-defecten of staart-staart-defecten (K-K of S-S) of onverzadigde keteneindes. Er wordt aangenomen dat deze defecten het afbraakproces initiëren. Daarom kan het van grote waarde zijn om deze defecten op te sporen en eventueel te quantificeren in een PMMA-feedstock. In dit werk wordt een PMMA-feedstock gereconstrueerd met behulp van zowel bulk- als emulsiepolymerisatie. Uit gesimuleerde spectra blijkt dat C13-NMR en H1-NMR kunnen worden gebruikt om deze defecten
te detecteren. Door middel simulaties van een FRP-polymerisatie gecodeerd in visual basic for applications (VBA) is het mogelijk om de invloed van reactieparameters op de hoeveelheid kop-kop-defecten na te gaan.
Kernwoorden: PMMA, chemische recyclage, kop-kop-defect, NMR, FRP, bulk polymerisatie, emulsie polymerisatie, regioregulariteit
Inleiding
Chemische recyclage en meer bepaald pyrolyse kan worden gebruikt om een plastic afvalstroom om te zetten in een monomeerstroom. Dit heeft vele voordelen ten opzichte van conventionele mechanische recyclage. Pyrolyse is het verhitten van polymeer in een pyroliseoven bij hoge temperaturen en in afwezigheid van zuurstof om de polymeren in kleinere secties te ontleden.2 De eindproducten van een pyrolyse
kunnen olie, gas, residu, monomeer of andere producten zijn. Voor PMMA levert de pyrolyse meestal hoge hoeveelheden monomeer op (97%) hierdoor is PMMA een veelbelovend materiaal om een recyclagesysteem voor uit te werken.1 Ook voor PS kunnen hoge
monomeeropbrengsten worden verkregen. PMMA verkregen uit een FRP-reactie bestaat uit zowel kop-kop-defecten als onverzadigde keteneindes. Het thermische degradatie-mechanisme is het volgende: Eerst zullen kop-kop-defecten afgebroken worden vanwege
hun lagere dissociatie-energie vergeleken met de gewone C-C-bindingen in de polymeer-ruggengraat.3–5 Vervolgens zullen bij hogere
temperaturen de onverzadigde ketenuiteinden degraderen. Bij nog hogere temperaturen zal de afbraak van de hele PMMA-keten plaatsvinden. Dit zal eerder bestaan uit de afsplitsing van uiteindes van de keten dan splitsing van willekeurige bindingen in de polymeerruggengraat. Dit omdat PMMA een sterk sterisch gehinderde structuur bezit.3,5 In
Figuur 1 afspliting van de uiteindes van een PMMA-keten weergegeven.
Figuur 1 schematische weergave van het mechanisme voor de afspliting van uiteindes in een PMMA-keten De eerder besproken defecten zijn het resultaat van het radicalaire mechanisme (FRP)
X waarmee PMMA vaak wordt gepolymeriseerd. In een FRP-mechanisme worden de ketens geïnitieerd door middel van een radicalaire initiator. Door de hoge chemishe reactiviteit die radicalen bezitten wordt een snelle propagatie reactie bekomen. Dit resulteert in hoge moleculaire gewichten en een snelle conversie. Het FRP-mechanisme voor PMMA is te zien in figuur Figuur 2. kop-kop-defecten kunnen op twee manieren tot stand komen: ofwel ondergaat een MMA-molecule een kop-kop-propagatie zoals in reactie (d) ofwel combineren twee actieve ketens tot één keten in een bimoleculaire terminatiereactie (e). Het eerste geval is minder waarschijnlijk als gevolg van de sterische hinder in een MMA-molecule. Ook zou het hoogst ongewoon zijn om een primair radicaal te vormen in plaats van een stabieler tertiair radicaal. Hierdoor kan de bijdrage van K-K-propagatie in het totale aantal kop-kop-defecten worden verwaarloosd. Alle kop-kop-defecten zullen dus gevormd worden door de combinatiereactie (e).
Figuur 2 schematische weergave van het FRP-mechanisme zonder transfereacties
Resultaten
I. Reconstructie van een
PMMA-feedstock
MMA wordt gepolymeriseerd in bulk met 0,6 wt% AIBN initiator. Bij aanvang van de reactie bestaat het reactiemengsel enkel uit monomeer en initiator. De reactor wordt verwarmd tot een constante temperatuur met behulp van een thermisch oliesysteem gekoppeld op een thermometer. Het mengsel wordt constant geroerd (200 rpm) en de temperatuur wordt gemeten tijdens de reactie. In Figuur 3wordt een schets van de experimentele opstelling weergegeven.
Figuur 3 schematische weergave van de experimentele opstelling voor bulkpolymerisatie
De conversie wordt gemeten met behulp van een gravimetrische methode met als doel het opstellen van conversieprofielen bij verschillende temperaturen.
Figuur 4 conversieprofielen van bulk FRP bij verschillende temperaturen
Voor conversies lager dan ±20% zijn de propagatie- en terminatiesnelheid constant.
0 0,05 0,1 0,15 0,2 0,25 0,3 0,35 0,4 0,45 0,5 0 50 100 150 200 M onom e e r conv e rs ie ( -) Tjd (min.) 70°C 60°C 50°C
XI Hierdoor bekomt men in deze regio een min of meer lineair verloop van de conversiecurve. Bij het bereiken van hogere conversies (>20%), wordt de diffusie van grote radicalen gelimiteerd, wat een vermindering van de terminatiesnelheid tot gevolg heeft. De conversie zal op dit moment snel toenemen zoals te zien is op Figuur 4bij de curves van 50 en 60°C. Het verschil tussen de curves bij verschillende temperaturen is het gevolg van hogere reactiesnelheden bij hogere temperaturen. Meestal zal de dissociatiereactie meer radicalen produceren bij hogere temperaturen, wat resulteert in een snellere conversie.
II. Karakterisering
De ketenlengtes van het bekomen PMMA alsook de ketenlengteverdeling wordt opgemeten met behulp van SEC (GPC). Om de eerdergenoemde defecten op te sporen kunnen een aantal analysetechnieken worden gebruikt. In dit werk worden FTIR, H1-NMR en
C13-NMR gebruikt om defecten in de
polymeerketen op te sporen.
Stalen van experimenten bij verschillende temperaturen worden genomen bij ±10% en ±20 % conversie. Deze worden vervolgens geanalyseerd met behulp van GPC-apparatuur. De resultaten tonen een verschuiving naar een lager moleculair gewicht bij het verhogen van de temperatuur. Dit is het gevolg van meer initiatordissociatie bij hogere temperaturen resulterend in meer en kortere ketens. De verschuiving wordt geïllustreerd door de pijl op de GPC-grafieken in Figuur 5.
Figuur 5 ketenlengteverdelingen van het bekomen PMMA
FTIR kan worden gebruikt om de moleculaire structuur van een polymeer te karakteriseren. Een FTIR-spectrum fungeert als een vingerafdruk van een bepaalde molecule. Deze eigenschap laat toe deze techniek te gebruiken om onzuiverheden in PMMA op te sporen. Door het meten van de trillings- en strekkingsenergieën van bepaalde bindingen in het polymeer kan de aanwezigheid van een C=C-binding (onverzadigd keteneinde) gedetecteerd worden. De C=C strekkingsband zal naar verwachting in de regio van 1658-1648 cm-1 liggen.
NMR kan worden gebruikt om kop-kop-defecten te identificeren. Deze techniek meet de nucleaire spin van een component in een magnetisch veld. De chemische shift van protonen of koolstofatomen wordt opgemeten. Deze shift kan gekoppeld worden aan hun chemische omgeving. Dit maakt detectie van kop-kop-defecten, staart-staart-defecten en onverzadigde keteneindes mogelijk. Spectra van zowel H1-NMR en C13
-NMR werden gegenereerd met behulp van de chemdraw software.
Met H1-NMR kunnen zowel onverzadigde
eindgroepen als staart-staart-defecten gedetecteerd worden. Het gesimuleerde H1
-NMR-spectrum van een keten van 10 monomeereenheden met een staart-staart-defect wordt gegeven in figuur Figuur 6 deze figuur komt de d-piek bij 1,54 ppm overeen met de methyleengroepen in het staart-staart-defect. 0 0,2 0,4 0,6 0,8 1 1,2 1,4 3 4 5 6 7 dwdl og( M ) log(M) 50 °C 60 °C 70 °C
XII Figuur 6 H1-NMR-spectrum van een PMMA-keten van 10 monomeereenheden met een S-S-defect
Staart-staart-defecten worden gevormd na de vorming van een kop-kop-propagatie. Een primair radicaal zal de voorkeur geven om te reageren met een MMA-monomeer op een manier die resulteert in de vorming van een tertiair radicaal. Hierbij zal een staart-staart-defect gevormd worden.
Kop-kop-defecten konden niet worden gedetecteerd met behulp van H1-NMR. Er zou
verwacht kunnen worden dat de naast elkaar gelegen quaternaire koolstoffen een invloed zouden uitoefenen op de shift van de omliggende protonen. Dit bleek echter niet het geval te zijn voor de spectra bekomen uit de chemdraw software.
De kop-kop-defecten konden alleen worden gedetecteerd met behulp van C13-NMR. De
pieken g en h op het spectrum (figuur Figuur 7 de quaternaire koolstoffen in het kop-kop-defect en de koolstoffen in de methylgroepen direct daarnaast. Deze tonen een chemische verschuiving van 43,4 en 21,8ppm.
Figuur 7 C13-NMR-spectrum van een PMMA-keten van 10 monomeereenheden met een K-K-defect
Staart-staart-defecten zijn moeilijker op te sporen met behulp van C13-NMR. Op het
spectrum van figuur Figuur 8 de f-piek, die overeenkomt met de methyleengroepen die de Staart-staart-binding vormen, niet duidelijk zichtbaar is. Dit is het gevolg van het
samenvallen van de f-piek met d-pieken die zijn ontstaan uit de quaternaire koolstoffen in de PMMA-keten. Om dit te illustreren wordt een vergrote weergave van het spectrum tussen 20 en 40ppm weergegeven in Figuur 9.
Figuur 8 C13-NMR-spectrum van een PMMA-keten van 10 monomeereenheden met een S-S-defect
Figuur 9 zoom van figuur Figuur 8 tussen 20 en 40 ppm Een samenvatting van welk type defecten kan worden gedetecteerd met welke technieken wordt weergegeven in Tabel 1. Een kwantitatieve studie zou kunnen worden uitgevoerd door de integratie van de pieken op de NMR-spectra. Om dit te kunnen doen moet de NMR-apparatuur voldoende gevoelig zijn om te voorkomen dat het signaal van de weinige defecten verloren zou gaan in de ruis van het spectrum.
Tabel 1 samenvatting van de verschillende defecten en detectietechnieken
DEFECT MOGELIJKE DETECTIE TECHNIEKEN ONVERZADIGD KETENEINDE FTIR, H1-NMR en C13 -NMR K-K-DEFECT C13-NMR S-S-DEFECT H1-NMR en C13-NMR
III. Kinetisch Monte Carlo model om
XIII Een kinetisch Monte Carlo-model (kMC) om een FRP-polymerisatie te simuleren werd verder uitgewerkt in visual basic for applications (VBA). Dit model bevatte volgende vier reacties: dissociatie, keteninitiatie, propagatie (kop-staart) en terminatie door combinatie. Er werd getracht de code aan te passen om het aantal gevormde kop-kop-defecten bij te houden. Er werden twee reacties toegevoegd aan het model: één voor de kop-kop-propagatie en één voor de terminatie door disproportionering. De disproportionering levert geen kop-kop-defecten op, maar is wel nodig om te zorgen dat de terminatie op twee manieren kan plaatsvinden.
De snelheidsconstanten voor de reacties werden genomen in overeenstemming met de waarden uit de literatuur voor AIBN geïnitieerde FRP van PMMA.6 Alle gebruikte
snelheidsconstanten (voor een reactie bij 70°C) worden vermeld in tabel Tabel 2. Omdat er geen literatuurwaarden konden gevonden worden voor de snelheidsconstanten van kop-kop-propagatie wordt deze waarde voldoende laag genomen (verhouding van 1/10.000 ten opzichte van de kop-staart-propagatie). Tabel 2 overzicht van de snelheidsconstanten gebruikt in het kinetisch Monte Carlo model (alle
reactiesnelheidsconstanten voor 70 °C) REACTIE SNELHEIDSCONSTANTE I2 → 2I 3,20,10-5 I+M → R 1,04.103 R-M → R (K-S) 1,04.103 R-M → R (K-K) 1,04,10-2 R+R → P 1,44.108 R+R → P+P 5.59.107
In het model wordt gebruik gemaakt van een kMC-algoritme, willekeurige getallen worden gegenereerd om een case te selecteren die corresspondeert met een bepaalde reactie. De waarschijnlijkheid waarmee een case (en dus reactie) wordt geselecteerd, wordt gebaseerd op de input die bestaat uit zowel snelheidsconstanten als concentraties. Dit
proces wordt herhaald totdat een monomeerconversie van 70% is bereikt. Een belangrijke tekortkoming aan dit model is dat het geen rekening houdt met diffusielimitaties. De data verkregen uit het kMC model kan worden gebruikt om de conversie profielen op te stellen. De eerste 20% van het conversieprofiel vertoont een vergelijkbare vorm met die afkomstig uit experimenten in bulk (figuur Figuur 10). Omdat voor conversies lager dan 20% weinig diffusielimitaties worden waargenomen. Het conversieprofiel van de simulatie toont een licht afgevlakt gedrag bij hogere conversies. Dit is het gevolg van een dalende propagatiesnelheid als gevolg van de uitputting van het monomeer. De initiële initiatorconcentratie kon niet gelijk genomen worden met de die van de experimenten omdat er onvoldoende moleculen door het computermodel zouden worden gegenereerd.
Figuur 10 conversieprofielen van experimenten van bulk FRP en een simulatie van FRP met behulp van het model in VBA
Het aantal kop-kop-defecten wordt opgeteld en geretourneerd als output van het VBA-model. De initiatorconcentratie werd gevarieerd om de invloed hiervan op de hoeveelheid gevormde defecten te meten. De bekomen relatie is lineair en wordt afgebeeld op de grafiek in figuur Figuur 11.
0 0,05 0,1 0,15 0,2 0,25 0,3 0,35 0,4 0 10 20 30 40 50 M onom e r conv e rs ion (-) Time (min) 70°C 0,6% AIBN (bulk) 70°C 3% AIBN (kMC model)
XIV Figuur 11 relatie tussen initiatorconcentratie en aantal K-K defecten (T=70°C)
Zoals verwacht is een lineaire relatie te zien wanneer de inputwaarde van de initiatorconcentratie wordt verhoogd. Het aantal groeiende ketens neemt evenredig toe met de initiatorconcentratie. Meer groeiende ketens zullen leiden tot meer terminatie, aangezien een vast deel van de totale terminatiereacties als combinatie wordt beschouwd. Bij elke terminatie door combinatie voegt de code een kop-kop-defect toe aan de variabele die dit bijhoudt. Het aantal kop-kop-defecten dat uit de propagatiereactie voortkomt kan wegens zijn lage snelheidsconstante in vergelijking met dat van de kop-staart-propagatie verwaarloosd worden. Indien de kop-kop-propagatiereactie toch een aanzienlijke bijdrage zou leveren, zou de relatie tussen initiatorconcentratie en hoeveelheid defecten nog steeds lineair zijn. De invloed van de reactietemperatuur op de hoeveelheid kop-kop-defecten wordt weergegeven in Figuur 12. Een licht exponentiële toename wordt waargenomen. Dit is het gevolg van zowel de toenemende dissociatiesnelheid (exponentieel met temperatuur) en toenemende terminatie-snelheid bij hogere temperaturen. Dit resulteert in meer en kortere ketens die meer kop-kop-defecten bevatten.
Figuur 12 relatie tussen reactietemperatuur en aantal K-K-defecten (conc. AIBN = 3%)
Conclusie
In dit werk wordt een PMMA-feedstock in bulk en emulsie gereconstrueerd. De verkregen polymeren worden gekarakteriseerd met behulp van SEC, FTIR en NMR om structurele defecten in de polymeerketens op te sporen. SEC (GPC) wordt gebruikt om de invloed van reactieparameters op het moleculair gewicht en de ketenlengteverdeling na te gaan. FTIR kan worden gebruikt om onzuiverheden en onverzadigingen in de keteneindes te detecteren. NMR blijkt dan weer een heel nuttige techniek te zijn bij de detectie en later misschien zelfs kwantificatie van structurele defecten (K-K, S-S en onverzadigde keteneindes). Een kinetisch Monte Carlo model werd verder uitgewerkt om simulaties van een FRP-reactie te bekomen. De uitkomst van het model wordt vergeleken met de resultaten van experimenten uitgevoerd in bulk. Het model toont een goede convergentie onder de 20% conversie omdat hier de diffusie limitaties nog niet significant optreden. Voor conversies hoger dan 20% is het model minder geschikt. Ook de invloed van reactieparameters op het aantal kop-kop-defecten gegenereerd door de code werd onderzocht. Verhogen van de initiatorconcentratie en temperatuur leiden tot een toename van het aantal kop-kop-defecten.
Referenties
1. Kaminsky, W., Predel, M. & Sadiki, A. Feedstock recycling of polymers by R² = 0,997 94000 96000 98000 100000 102000 104000 106000 108000 2% 4% 6% 8% aan at l K -K -de fe ct en initiator concentratie (m%) y = 6447e0,0382x R² = 0,9962 70000 90000 110000 130000 150000 170000 190000 210000 230000 65 75 85 95 aan tal K -K -de fe ct en Temperatuur (°C)
XV pyrolysis in a fluidised bed. in Polymer Degradation and Stability (2004). doi:10.1016/j.polymdegradstab.2003.0 5.002
2. Ragaert, K., Delva, L. & Van Geem, K. Mechanical and chemical recycling of solid plastic waste. Waste
Management 69, 24–58 (2017). 3. Ferriol, M., Gentilhomme, A., Cochez,
M., Oget, N. & Mieloszynski, J. L. Thermal degradation of poly(methyl methacrylate) (PMMA): Modelling of DTG and TG curves. Polym. Degrad. Stab. 79, 271–281 (2003).
4. Manring, L. E., Sogah, D. Y. & Cohen, G. M. Thermal Degradation of
Poly(methyl methacrylate). 3. Polymer with Head-to-Head Linkages.
Macromolecules 22, 4652–4654 (1989). 5. Kashiwagi, T. et al. Effects of Weak
Linkages on the Thermal and Oxidative Degradation of Poly(methyl
methacrylates). Macromolecules 19, 2160–2168 (1986).
6. Beuermann, S. et al. Critically evaluated rate coefficients for free-radical polymerization, 2: Propagation rate coefficients for methyl
methacrylate. Macromol. Chem. Phys. 198, 1545–1560 (1997).
XVI
Table of contents
Preface ... I Abstract ... II List of abbreviations ... XIX List of Figures ... XXI List of tables ... XXIII Preamble regarding the influence of the 2020 Covid-19 crisis on this work ... XXIV
Introduction ... 1
1.1. Aim of this thesis ... 2
1.2. Structure of this thesis ... 2
Literature ... 4
2.1. Polymerisation mechanisms ... 4
2.1.1. Free radical polymerisation ... 4
2.1.2. Controlled radical polymerisation ... 9
2.2. Polymerisation techniques ... 12 2.2.1. Solution polymerisation ... 12 2.2.2. Bulk polymerisation ... 12 2.2.3. Emulsion polymerisation ... 13 2.2.4. Suspension polymerisation ... 13 2.3. Recycling of polymers ... 13 2.3.1. Mechanical recycling ... 14 2.3.2. Chemical recycling ... 15 2.3.3. Quaternary recycling ... 16
2.3.4. Closed loop and circular economy ... 16
2.4. Poly(methyl methacrylate) ... 17
2.4.1. Impact of poly(methyl methacrylate) on the environment ... 17
XVII
2.4.3. Production of methyl methacrylate ... 19
2.4.4. Free radical polymerisation of poly(methyl methacrylate) ... 20
2.5. Free radical polymerisation in bulk ... 22
2.5.1. Diffusion limitations ... 22
2.5.2. Conversion profile of bulk FRP ... 26
2.6. Free radical polymerisation in emulsion ... 26
2.6.1. Surfactants ... 27
2.6.2. Smith-Ewart-Harkins Theory ... 28
2.6.3. Coagulation of emulsion ... 31
2.7. Depolymerisation of polymers ... 31
2.7.1. Depolymerisation of poly(methyl methacrylate) ... 33
2.8. The effect of head-to-head defects and unsaturated end groups on the thermal degradation of poly(methyl methacrylate) ... 33
Materials and methods ... 36
3.1. Analyses ... 36
3.1.1. Gel permeation chromatography ... 36
3.1.2. Gravimetrical analyses ... 37
3.1.3. Fourier transformed infrared spectroscopy ... 38
3.1.4. Nuclear magnetic resonance ... 40
3.1.5. Thermogravimetric analysis ... 41
3.2. Chemicals ... 42
3.2.1. AIBN initiator ... 43
3.2.2. KPS initiator ... 43
3.2.3. Decomposition rate and half-life time ... 44
3.2.4. Thermal self-initiation ... 45
3.3. Methods ... 46
3.3.1. Removing of stabilizer from the MMA monomer ... 46
XVIII
3.3.3. Emulsion FRP of PMMA ... 47
3.4. Model for the simulation of free radical polymerisation ... 48
Results and discussion ... 50
4.1. Conversion profiles ... 50 4.1.1. Bulk FRP ... 50 4.1.2. Emulsion FRP ... 51 4.2. Molecular weight ... 53 4.2.1. Bulk FRP ... 53 4.2.2. Emulsion FRP ... 54
4.3. Simulation of FRP using kMC model in VBA ... 54
4.3.1. Conversion ... 55 4.3.2. Molecular weight ... 56 4.3.3. Number of defects ... 57 4.4. NMR ... 59 4.4.1. H1-NMR ... 59 4.4.2. C13-NMR ... 66 4.5. Conclusion ... 73
Conclusion and future work ... 74
5.1. conclusions ... 74
5.2. Future work ... 74
Reflection regarding sustainability ... 76
XIX
List of abbreviations
ABBREVIATION EXPLANATION ACH Acetone cyanohydrin
AIBN 2,2′-Azobis(2-methylpropionitrile) ATRP atom transfer radical polymerisation
BPA Bisphenol A
CLD Chain length distribution CMC Critical micellar concentration
CRP Controlled radical polymerisation CTA Chain transfer agent
DP Degree of polymerisation FRP Free radical polymerization
FTIR Fourier transformed infrared spectroscopy GPC Gel permeation chromatography
HCN Hydrogen cyanide H-H Head-to-head KMC Kinetic Monte Carlo
KPS Potassium persulfate MEHQ Methyl hydroquinone
MEP Methyl propionate MMA Methyl methacrylate
NMP nitroxide mediated polymerisation NMR Nuclear magnetic resonance
XX PDI Poly dispersity index
PI Post-industrial
PMMA Poly(methyl methacrylate) PS Polystyrene
RAFT reversible addition fragmentation transfer polymerisation RI Refractive index
SEC Size exclusion chromatography TGA Thermogravimetric analysis THF tetrahydrofuran
T-T Tail-to-tail VBA Visual basic
XXI
List of Figures
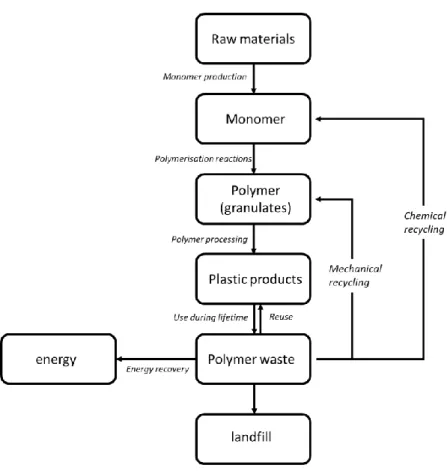
Figure 1 propagation reactions in FRP ... 5 Figure 2 transfer on CTA ... 6 Figure 3 termination reactions in FRP ... 7 Figure 4 schematic representation of the atom transfer radical polymerisation (ATRP) mechanism .. 10 Figure 5 schematic representation of the nitroxide mediated polymerisation (NMP) mechanism ... 11 Figure 6 chemical structure of 2,2,6,6-tetramethyl-1-piperidinyloxy (TEMPO) ... 11 Figure 7 schematic representation of reversible addition fragmentation transfer polymerisation (RAFT) mechanism ... 12 Figure 8 schematic representation of the options for managing polymer waste ... 14 Figure 9 circular economy for plastics16 ... 17
Figure 10 overview of the production routes of PMMA from basic chemicals to applications
(www.pmma-online.eu) ... 19 Figure 11 ACH process for production of MMA ... 20 Figure 12 MeP process for production of MMA ... 20 Figure 13 polymerisation of MMA ... 22 Figure 14 encounter pair model ... 23 Figure 15 conversion profile of FRP of PMMA in bulk33 ... 26
Figure 16 molecule structure of SDS ... 27 Figure 17 electrical and steric stabilization of particles in emulsion ... 28 Figure 18 representation of an emulsion polymerisation ... 29 Figure 19 different stages during an emulsion polymerisation process ... 30 Figure 20 schematic representation of the different degradation mechanism for PMMA ... 33 Figure 21 schematic representation of the degradation of PMMA containing a head-to-head defect 34 Figure 22 basic visualization of GPC technique45 ... 37
Figure 23 FTIR spectrum of PMMA ... 39 Figure 24 TGA analysis of PMMA form FRP (C) and anionic polymerisation (H)48 ... 42
Figure 25 TGA of PMMA with 3 levels of CTA (A=0,36, B=0,034 and C=0)48 ... 42
Figure 26 decomposition mechanism of AIBN ... 43 Figure 27 thermal self-initiation of MMA ... 45 Figure 28 setup for removal of the MeHQ from the MMA monomer ... 46 Figure 29 Sample taken from the bulk polymerisation (left after drying) (right after grinding) ... 47 Figure 30 conversion profiles of bulk FRP of PMMA ... 50
XXII
Figure 31 conversion profiles of emulsion FRP, different intervals can be seen for 50°C 0,3% KPS, line to guide the eyes ... 51 Figure 32 Half-life times of AIBN and KPS at different temperatures ... 52 Figure 33 conversion profiles of emulsion FRP comparing initiators KPS and AIBN ... 53 Figure 34 GPC traces of bulk FRP of PMMA at 10% (left) and 20% conversion (right) ... 54 Figure 35 conversion profile of experiments on bulk FRP compared to the conversion profile
generated by the kMC model in VBA ... 55 Figure 36 conversion profiles obtained from the simulation of FRP at different temperatures ... 56 Figure 37 CLD of the kMC model with 3% AIBN at 70°C ... 56 Figure 38 relation between conversion and molecular weight with data obtained from the kMC model (left Mn, right Mw) ... 57 Figure 39 number of head-to-head defects in relation to initiator concentration ... 58 Figure 40 number of head-to-head defects in relation to temperature ... 59 Figure 41 H1-NMR spectrum of PMMA containing 10 monomer units, all H-T ... 60
Figure 42 H1-NMR spectrum of PMMA chain of 10 monomer units containing one head-to-head
defect ... 61 Figure 43 H1-NMR spectrum of PMMA chain of 10 monomer units containing one tail-to-tail defect 61
Figure 44 H1-NMR spectrum of PMMA of 20 monomer units with one tail-to-tail defect ... 62
Figure 45 H1-NMR spectrum of a PMMA chain of 10 monomer units containing a H-H-T-T defect ... 63
Figure 46 H1-NMR spectrum of PMMA chain of 10 monomer units containing an unsaturated end
group ... 64 Figure 47 H1-NMR spectrum of a AIBN initiated PMMA chain... 65
Figure 48 H1-NMR spectrum of a KPS initiated PMMA chain ... 66
Figure 49 C13-NMR spectrum of PMMA of 10 monomer units, all H-T ... 67
Figure 50 C13-NMR spectrum of PMMA of 10 monomer units containing one head-to-head defect .. 68
Figure 51 C13-NMR spectrum of PMMA of 10 monomer units containing one tail-to-tail defect ... 69
Figure 52 C13-NMR spectrum of PMMA of 10 monomer units containing a H-H-T-T defect ... 70
Figure 53 C13-NMR spectrum of PMMA of 10 monomer units containing one unsaturated end group
... 71 Figure 54 C13-NMR spectrum of a AIBN initiated PMMA chain ... 72
XXIII
List of tables
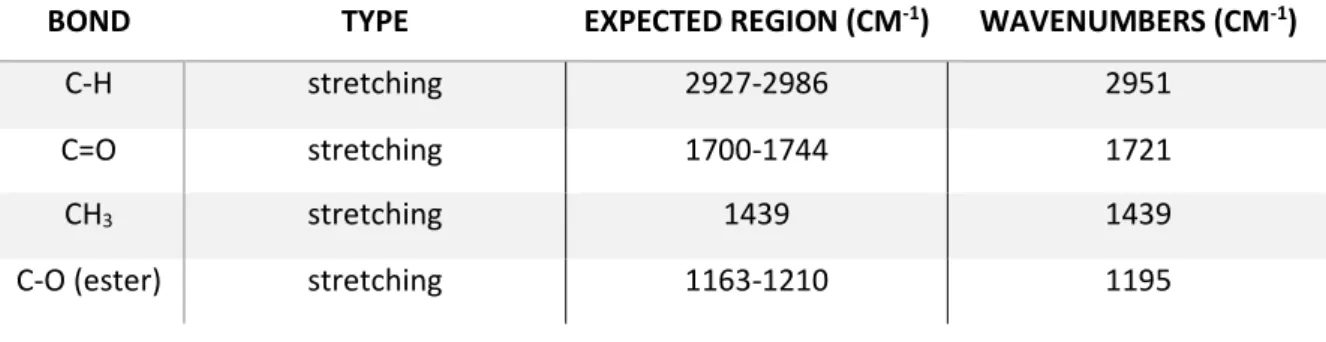
Table 1 ecological parameters of different types of PMMA ... 18 Table 2 properties of PMMA and MMA ... 18 Table 3 list of peaks and wavelengths of FTIR of PMMA47 ... 40
Table 4 summary of all chemicals used ... 43 Table 5 rate coefficients of the decomposition reaction of AIBN in benzene ... 44 Table 6 rate coefficients of the decomposition reaction of KPS in water ... 45 Table 7 overview of the used rate coefficients in the VBA model for a simulation at 70°C ... 49 Table 8 overview of molecular weights from the bulk FRP experiments at 20% conversion ... 54 Table 9 overview of the molecular weights from the VBA model at 60°C and 70°C at 20% conversion ... 57 Table 10 overview of the chemical shifts in a H1-NMR spectrum of H-T PMMA ... 60
Table 11 overview of the chemical shifts in a H1-NMR spectrum of PMMA containing one tail-to-tail
defect ... 62 Table 12 overview of the chemical shifts in a H1-NMR spectrum of PMMA containing one unsaturated
end group ... 64 Table 13 overview of the chemical shifts in a C13-NMR spectrum of H-T PMMA ... 67
Table 14 overview of the chemical shifts in a C13-NMR spectrum of PMMA containing one
head-to-head defect ... 68 Table 15 overview of the chemical shifts in a C13-NMR spectrum of PMMA containing one tail-to-tail
defect ... 69 Table 16 overview of the chemical shifts in a C13-NMR spectrum of PMMA containing unsaturated
end group ... 71 Table 17 overview of the different defects and their feasible defection techniques ... 73
XXIV
Preamble regarding the influence of the 2020 Covid-19
crisis on this work
Because of the practical character of the master program and especially the master thesis, some difficulties occurred following the Covid-19 crisis. During the second semester a lot of experimental work was planned. Both polymerisation reactions and instrumental analyses of the obtained polymer materials were set out to be executed. Polymerisation reactions, both in bulk and emulsion are quite time-consuming experiments which can take from 3 to 8 hours including preparation time. The instrumental analyses (GPC, TGA, NMR and FTIR) are carried out rather fast or can perhaps run overnight, although sometimes training or supervision from an experienced lab technician are needed. All these experiments were planned to be carried out at the laboratory for chemical technology (LCT). Due to the measures taken to prevent the spread of the coronavirus, the lab was not open for thesis students from the date of 16 March 2020 till the end of the second semester. In the first semester mainly literature study and bulk experiments were carried out. Already 16 bulk polymerisations and 4 emulsion polymerisations were executed, these include explorative experiments and testing of the setup. GPC traces were measured from 3 different samples (made in bulk) at 2 levels of conversion. The rest of the experiments on emulsion could not be carried out. The goal was to obtain data on the conversion to set out a conversion profile. Chain lengths would have been measured and compared to those of the polymers obtained from bulk polymerisation.
As a substitute for the experimental work on FRP polymerisations, a computer model will be used. This model uses a Monte Carlo algorithm to simulate an FRP reaction from the given input (initial concentrations and reaction rate constants). The model itself was already developed; only rather small adjustments were made in the code. The final model can be used to generate graphs and data that would otherwise been experimentally obtained.
The aim of the thesis was to seek a method on how to detect and perhaps quantify defects regarding the regioregularity of a poly(methyl methacrylate) polymer. To detect these defects H1-NMR, FTIR and
TGA analyses would have been carried out.
For the H1-NMR analyses the spectrum could not be obtained in an experimental way, therefore the
H1-NMR spectra were simulated using the Chemdraw software.
The FTIR experiments were about to start around the date of 16 march. Samples were already prepared and an introduction on how to use the FTIR spectrometer was given. However no useful spectrum was already generated due to technical problems with the FTIR equipment. The theory of
XXV
FTIR will be discussed in the materials and methods section as well as some assumptions on the outcome of the experiments.
The TGA analyses would have been carried out at the CPMT lab. Similar as for the FTIR analyses the theory of TGA will be discussed and assumptions will be made using experiments obtained from literature work.
It can be concluded that the Covid-19 crisis had a major impact on this thesis work. A large part of the practical skills and independent lab experience got lost. Nevertheless, we were able to shift from experimental work towards alternatives like simulations and computer models. Some more attention went out to the literature study where some topics are discussed with more detail than initially planned.
1
Introduction
Over the last decades polymers have become one of the most important materials in terms of everyday use. Every year millions of tons are produced for the most diverse applications. Polymers are often praised because of their light weight and easy to process properties. Therefore, they are ideal substitutes for metals and glass. However, in times of global warming and increasing worldwide pollution, the use of plastics has come under pressure. The main problem is that most synthetic polymers do not blend into the environment. And unlike for metals and glass there is no existence of a dedicated recycling system. This results in plastic packaging showing up in the earth’s environment. A growing demand for polymer recycling is the logical result.
Most polymer materials are a high value feedstock and thus need to be handled in a smart way. Apart from the traditional way of mechanical recycling, a new way of recycling polymer materials has come up. The on-purpose thermal degradation of polymers with the formation of a monomer product is often referred to as chemical recycling. The two main reactions taking place in this mechanism are random chain scission and depropagation or unzipping. It is known that the microstructure of a polymer can affect this degradation mechanism. In a polymer chain some irregularities, sometimes referred to as defects, can be present. These defects can be the result of the propagation or termination steps in the polymerisation mechanism. Terminating a polymerisation reaction results in the formation of either head-to-head defects (termination by combination) or unsaturated end groups (termination by disproportionation). The propagation step can also cause a regioregularity of the polymer chain which deviates from a classic head-to-tail sequence. These defects can strongly influence the degradation mechanism of the polymer. Therefore, it is important to be able to quantify the number of defects. This can be done by using analytical techniques such as Fourier-transformed infrared (FTIR) and nuclear magnetic resonance (NMR) spectroscopy. The degradation process can be verified using the thermogravimetric analysis (TGA). The amount and type of defects are dependent on the type of mechanism or polymerisation technique used.
Poly methyl methacrylate (PMMA) is found in many applications in different fields and industries. What sets PMMA apart from all other polymers is its huge potential for chemical recycling. When thermally degrading a PMMA waste feedstock, conversion to monomer occurs. For PMMA this process can reach values of almost 100% conversion to monomer. Separation techniques allow purification to a recycled feedstock which is comparable to MMA obtained from traditional synthesis.
In this work the FRP of PMMA will be carried out in both bulk and emulsion polymerisation. The goal is to find a method which can quantify these defects. The effect of temperature and initiator
2
concentration on the number of defects will be examined. A comparative study of the conversion and reaction kinetics for these two techniques will be carried out.
1.1. Aim of this thesis
The aim of this thesis is explained using three research questions:
1) How can we reconstruct/characterize the plastic waste feedstock for chemical recycling reactors?
2) How can we measure defects (initiation loci) in FRP products made in bulk and emulsion polymerisation?
3) What is the influence of initiator concentration in FRP on the number of defects in a polymer chain?
The primary aim of this work is to contribute in some way to the chemical recycling process of PMMA waste feedstock. This is done by characterisation of the microstructure PMMA materials. When chemically recycling polymers, the degradation process is influenced by the regioregularity of the polymer chain. A better view on the degradation process can be obtained when the structure of the polymer is completely known.
Some techniques to detect defects in the regioregularity of the PMMA chain will be considered (FTIR, NMR, and TGA). A comprehensive study is made between bulk and emulsion polymerisation. The influence of the type of polymerisation technique on the number of defects is studied.
Also, the influence of the initial initiator concertation in an FRP mechanism on the number of defects is studied. This is done by using a computer simulation in visual basic for applications (VBA) that counts these defects. In that way an estimation of the number of defects in a PMMA waste feedstock can be obtained. This information could later be used to optimize chemical recycling reactors.
1.2. Structure of this thesis
In the literature study first an introduction is given on polymerisation mechanisms and techniques with a more comprehensive approach to the FRP mechanism. A summary of different recycling techniques used for polymer recycling are summarized and discussed. Concepts like chemical recycling and circular economy are explained in function of the thesis. Afterwards a focus is brought on the PMMA polymer itself and its environmental impact and synthesis routes. The FRP mechanism is applied on the PMMA polymer and the use of FRP with PMMA in both bulk and emulsion techniques is explained. Hereby more attention is given to important concepts like, diffusion limitations in bulk FRP and colloidal stability in emulsion polymerisation. At last the thermal degradation process of polymers and specifically PMMA is given. The influence of the earlier mentioned defects on this process is discussed.
3
In the materials and methods section a summary of all analyses used to identify these defects is given. The used chemicals are listed with a greater focus on the initiators used in both techniques. The methods for, separation of inhibitor, polymerisation itself and coagulation of the emulsion latex are described. Also, a description of the used computer model and its purpose is given.
In the results and discussion section first the results of the polymerisation experiments are discussed. Conversion profiles and chain length distributions are given. A comparison is made between the results obtained from real experiments and those generated by simulation. then the generated NMR spectra from Chemdraw are discussed for both H1-NMR and C13-NMR of all the possible defects: head-to-head,
tail-to-tail and unsaturated end group. At last all the data obtained from both the earlier mentioned experiments and the simulations will be incorporated in a general conclusion.
4
Literature
The literature part of this work focusses mostly on the theoretical aspects of the FRP mechanism and the comparison of the two polymerisation techniques. All aspects are applied for polymerisation of PMMA. Some important concepts regarding recycling of polymer waste are discussed. At last the degradation mechanism itself and the influence of the discussed defects on this mechanism will be explained.
2.1. Polymerisation mechanisms
Polymers are macromolecules made from monomers. The technique used to convert monomers into polymers is called polymerisation. The mechanisms by which these reactions take place is called the polymerisation mechanism. There are different kinds of mechanisms for polymerisation, each mechanism has its own properties that affect the structure of the polymer. When monomer units containing a double bond are being added to a growing chain, it is called a chain growth mechanism. When the monomers are bi- or more functional and addition/condensation reactions take place, this is called step growth polymerisation.
The reactive centre of a growing polymer chain in a chain growth polymerisation can either be a radical or a positive or negative charged carbon. A free radical polymerisation (FRP) mechanism can also be “controlled” in some different ways (ATRP, NMP, RAFT). In controlled radical polymerisation the aim is to obtain a smaller PDI or generate polymers with a specific structure or produce copolymers. Besides a radical (FRP or CRP) and a charged carbon (anionic and cationic polymerization) there is also the mechanism of coordination polymerisation. In this case the monomer is coordinated towards a transition metal containing a d-orbital.
All mentioned polymerisation mechanisms will briefly be explained below. For FRP a more comprehensive description will be given including the kinetics of the reactions taking place.
2.1.1. Free radical polymerisation
FRP is a form of chain growth polymerisation where the active centre is a free radical. A free radical is an atom containing an unpaired valence electron. Radicals are known for their short lifetime and highly chemically reactive behaviour.1 This results in a high chain length at low conversions. The chains
formed at the beginning of the reaction are comparable in terms of molecular weight to those formed at high conversion. FRP is by far the most simple polymerisation mechanism and is often the preferred option for industrial production of vinyl polymers.
5
The free radical polymerisation mechanism consists of four reactions which are listed in the following sections.
2.1.1.1. Initiation
Initiation is the formation of free radicals from an initiator molecule. These free radicals will react with a monomer molecule to initiate a growing polymer chain. The first step, when the radicals are formed is called the initiator decomposition equation (1), the second step when a chain is initiated is called the initiation step equation (2).
𝐼2 𝑘𝑑
→ 2 𝐼∗ (1)
𝐼∗+ 𝑀→ 𝑅𝑘𝑖
𝑖 (2)
In which I2 is an initiator molecule and M being a monomer molecule, kd is the rate coefficient for the
decomposition reaction and ki is the rate coefficient for initiation. Usually the rate of initiator
decomposition is considered slower than the initiation step. Therefor the reaction rate for initiation ri
is given by equation (3)
𝑟𝑖= 2 ∙ 𝑘𝑑∙ 𝑓 ∙ [𝐼2] (3)
In which f is the initiator efficiency and [I2] is the concentration of initiator.
2.1.1.2. Propagation
The propagation step involves the addition of a new monomer molecule to a growing chain. This step is very fast and often exothermic wherefore with high levels of propagation a lot of heat is produced during the reaction. The propagation step can be regioselective so that there are two types of propagation that can take place. Either a new monomer adds itself on a growing chain in the same way the previous monomer molecule did (head-to-tail) or the monomer adds to the chain in the opposite way (head-to-head). Both head-to-tail (a) and head-to-head (b) propagations are given in Figure 1.
6
The likelihood of a head-to-head propagation taking place is depended on the bulkiness and the chemical nature of the X-group in Figure 1. Monomers with large steric hindrance will favour the head-to-tail addition. When monomers with less steric hindered groups polymerize, head-to-head or even tail-to-tail additions could take place. In general, the propagation reaction is given by equation (4).
𝑅𝑖∗+ 𝑀 𝑘𝑝
→ 𝑅𝑖+1∗ (4)
In which Ri* resembles a growing chain with chain length i and kp is the rate coefficient for the entire
propagation reaction. The reaction rate for propagation rp is given by equation (5).
𝑟𝑝= 𝑘𝑝∙ [𝑀] ∙ [𝑅∗] (5)
In which [M] is the concentration of monomer and [R*] is the concentration of all growing chains in the
reaction mixture. 2.1.1.3. Chain transfer
Chain transfer is the transfer of the active section of a growing polymer, which in the case of FRP is always a free radical. This radical can transfer to either a monomer, polymer, solvent or a chain transfer agent (CTA) molecule. In transfer reactions there is always the termination of a growing chain and the initiation of a new polymer chain. Transfer on a CTA as illustrated in Figure 2 will be discussed below.
Figure 2 transfer on CTA
In general, the reaction equation for transfer on CTA is described as in equation (6). 𝑅𝑖∗+ 𝑇
𝑘𝑡𝑟𝐶𝑇𝐴
→ 𝑃𝑖+ 𝑇∗ (6)
In this case a CTA is used, these agents often have a weak single bond which allows them to break easily and form a new radical. Popular CTA’s are mercaptans and halocarbons. The reaction rate for transfer on CTA rtrCTA is given in equation (7).
7
Where ktr is the rate coefficient for the transfer reaction and [T] is the concentration of the transfer
agent.
2.1.1.4. Termination
There are two ways for a growing polymer chain to terminate. If two chains combine to form a larger chain, it is called combination as seen in equation a in Figure 3. Termination by combination leads to head-to-head defects and the formation of a polymer chain with a chain length of the two chains combined.
Figure 3 termination reactions in FRP
When two growing polymer chains react with each other to form two dead polymer chains of which one has a saturated end group, it is called disproportionation. This is illustrated in equation b on Figure 3.
In general, the reactions for combination and disproportionation are given by respectively equation (8) and (9). 𝑅𝑖∗+ 𝑅𝑗∗ 𝑘 𝑡𝑐 → 𝑃𝑖+𝑗 (8) 𝑅𝑖∗+ 𝑅𝑗∗ 𝑘 𝑡𝑑 → 𝑃𝑖+ 𝑃𝑗 (9)
Where the reaction rate for termination, rt is defined in equation (10)
𝑟𝑡 = 2 ∙ 𝑘𝑡∙ [𝑅∗]2 (10)
Where rt is a superposition of the rate of termination via combination and disproportionation. This is
shown in equation (11).
8
To determine the Rp (rate of polymerisation) for a given mechanism the principle of uniform activity
should be accepted. This means that the rate coefficients are not affected by the length of a polymer chain. In real polymerisation systems the rate coefficients will be affected by the chain length because of steric hindrance.
A steady state can be defined when the rate of formation of free radicals and the rate of destruction of free radicals is equal (equation 13). This is possible because the rate coefficient of the termination reaction is significantly higher than the rate coefficient of the initiation reaction. However, the concentration of free radicals is much lower than the concentration of initiator molecules so that the rate for initiation can be set equal to that of the termination reaction.
Steady state is valid when:
𝑟𝑖 = 𝑟𝑡 (13)
When we substitute ri by equation (3) and rt by equation (10) equation (13) becomes:
2 ∙ 𝑘𝑑∙ 𝑓 ∙ [𝐼2] = 2 ∙ 𝑘𝑡∙ [𝑅∗]2 (14)
Therefor [R*] can be given by equation (15).
[𝑅∗] = √𝑘𝑑∙𝑓∙[𝐼2]
𝑘𝑡 (15)
The rate of polymerisation (Rp) is defined as the rate by which monomer reacts. Using equation (5) this
results in:
𝑅𝑝= − 𝑑[𝑀]
𝑑𝑡 = 𝑟𝑝= 𝑘𝑝∙ [𝑀] ∙ [𝑅
∗] (16)
Substituting [R*] by equation (15) the R
p can be defined as:
𝑅𝑝= 𝑘𝑝∙ [𝑀] ∙ √ 𝑘𝑑∙𝑓∙[𝐼2]
𝑘𝑡 (17)
Here is assumed that the amount of monomer molecules used in the chain initiation and transfer reactions can be neglected compared to the amount of monomer used in the propagation reaction. An estimation of the chain length can be made using the average degree of polymerization (DP) as shown in equation (19).
𝐷𝑃
̅̅̅̅ = 𝑟𝑝