Netherlands Environmental Assessment Agency (MNP), P.O. Box 303, 3720 AH Bilthoven, the Netherlands; Tel: +31-30-274 274 5; Fax: +31-30-274 4479; www.mnp.nl/en
MNP Report 500114006/2007
Post-2012 Climate Policy Scenarios
S. Boeters1), M.G.J. den Elzen2), A.J.G. Manders2), P.J.J. Veenendaal1) and G. Verweij1)
Contact:
Michel den Elzen
Global Sustainability and Climate (KMD) Michel.den.Elzen@mnp.nl
1)
CPB Netherlands Bureau for Economic Policy Analysis 2)
MNP Netherlands Environmental Assessment Agency
This research was conducted as part of the Interdepartmental Policy Research (IBO) ‘Future International Climate Policy’ led by the Ministry of Finance.
© MNP 2007
Parts of this publication may be reproduced, on condition of acknowledgement: 'Netherlands Environmental Assessment Agency, the title of the publication and year of publication.'
Acknowledgements
This study was conducted by the CPB Netherlands Bureau for Economic Policy Analysis and the MNP Netherlands Environmental Assessment Agency as part of the Interdepartmental Policy Research (IBO) ‘Future International Climate Policy’ led by the Ministry of Finance. The report of this IBO is meant to inform the council of ministers about the environmental efficiency and economic consequences of different forms of cooperation of countries in future climate policy.
We would like to thank Joop Oude Lohuis (MNP), George Gelauff (CPB) and Herman Stolwijk (CPB) for their input and comments. Members of the task group IBO provided useful comments as well. In particular, we would like to thank Merrilee Bonney (Ministry of Housing, Spatial Planning and the Environment) and Paul Koutstaal (Ministry of Finance). Their critical but supportive attitude was very helpful. Their creative and useful suggestions improved this study.
Rapport in het kort
Scenario’s voor post-2012 klimaatbeleid
De ontwikkeling van een toekomstig internationaal klimaatbeleid is met vele onzekerheden omgeven. Dit rapport concentreert zich op de onzekerheid ten aanzien van het klimaatbeleid dat door andere landen mogelijk gevoerd zal worden. Deze context speelt een grote rol binnen de Nederlandse beleidsdiscussie. De beleidsopgave is immers een wereldwijde en de beleidsopties zijn dus sterk afhankelijk van de beleidsinspanningen van andere landen. Met vier verschillende scenario’s schetst dit rapport alternatieve toekomstbeelden. De vier scenario’s onderscheiden zich aan de hand van twee dimensies: de urgentie waarmee tegen het klimaatprobleem wordt aangekeken en de bereidheid die landen tonen om gezamenlijk aan een oplossing te werken. Samen vormen ze mogelijke, uiteenlopende ontwikkelingen in de beleidsomgeving van de EU die relevant zijn bij het identificeren van een robuuste keuze voor opties op het terrein van het klimaatbeleid voor Nederland en de EU. De
scenarioanalyses laten zien dat alleen als alle belangrijke landen al vóór 2020 actief betrokken worden bij het reduceren van hun broeikasgasemissies, er substantiële reducties van broeikasgas emissies kunnen worden gehaald. Alleen dan is er een gerede kans op het halen van de 2 graden Celsius temperatuurdoelstelling van de EU. Bij kleinere
samenwerkingsverbanden met minder strikte reductiedoelstellingen, stijgen de kosten voor de deelnemers aan een coalitie, terwijl de milieueffectiviteit afneemt.
Trefwoorden: klimaatverandering, klimaatbeleid, scenario’s, cap-and-trade, broeikasgas
Contents
Summary...6
1 Introduction ...7
2 Description of the scenarios...10
2.1 Grand Coalition...10
2.2 Fragmented...12
2.3 Largest Common Denominator...14
2.4 Impasse...15
2.5 Which scenarios provide the highest likelihood of achieving the 2°C target?...17
2.6 Which measures are necessary to achieve the 2°C target? ...22
2.7 Options for the Netherlands ...23
3 Conclusions and discussions ...25
3.1 Conclusions...25
3.2 Discussion ...27
References...30
Appendix A: Characteristics of the models used and of the baseline scenario ...32
A.1 WorldScan ...32
A.2 Allocating emission allowances within coalitions...34
A.3 IMAGE, TIMER and FAIR...34
Summary
Many uncertainties are involved in the shaping of post-2012 climate policies. Of these this report focuses on the uncertainties with respect to the climate policies that may be
implemented in other countries. These are predominantly important in the climate policy discussion as the policy question is a global one, whence national policy options crucially depend on the policy efforts of other countries. With four alternative scenarios this report sketches possible, alternative developments in the climate policy domain. These four
scenarios are characterised by two dimensions: the sense of urgency expressed by the policy goal, and the willingness to resolve the climate problem through concerted action. Together these provide a background that is thought to be relevant for identifying the best mitigation options to reduce future greenhouse gas emissions, both in the Netherlands and the EU, in alternative future states of the climate policy domain. The analysis shows that only if all major countries become actively involved in emissions abatement before 2020, the
substantial long-term greenhouse gas emissions reductions can be achieved that are needed to meet the EU climate target of limiting the global temperature increase to 2oC in this century. If coalitions become smaller and reduction targets less binding, the costs to coalition
1 Introduction
The climate problem is full of uncertainties. These uncertainties are present in assessing the expected rise in temperature due to increased concentrations of greenhouse gases in the atmosphere, in assessing the consequences of rising temperatures for both the economy and the environment and in the phasing, timing and intensity of measures that will be aimed at mitigating greenhouse gas emissions. Uncertainties surrounding the climate policies that may be implemented in other countries predominantly affect the climate policy discussion: the policy question is a global one, and therefore national policy options greatly depend on the policy efforts of other countries. It is not possible to foresee which measures will be taken by the non-EU countries, both in the first commitment period under the Kyoto Protocol (2008-2012) and the years thereafter. It therefore seems sensible to show a number of alternative scenarios of future developments that together provide a background allowing policy makers to assess the effectiveness of the mitigation options available.
This report aims to provide further information on these scenarios, to briefly describe the outcomes for the year 2020, and to indicate the extent to which the EU long-term climate target of 2°C above pre-industrial levels can be achieved.
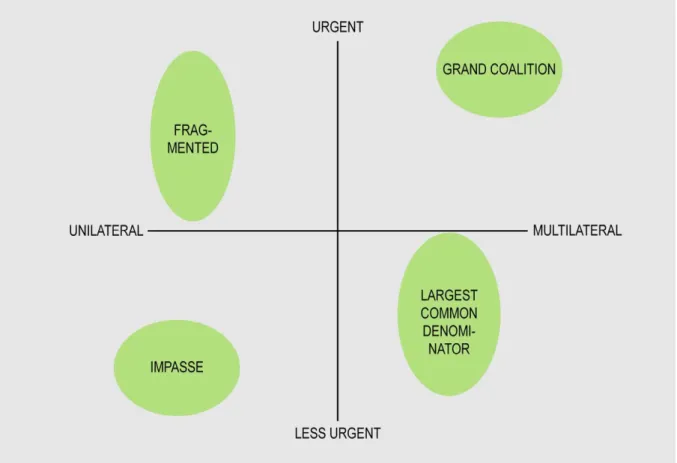
Scenarios are – at their level of aggregation – feasible, internally consistent representations of the future. They are not predictions, but simply provide alternative future developments that – from today’s point of view – have similar chances to materialise. Since the emphasis lies on exploring globally diverging climate policy situations, this report distinguishes these
scenarios along two dimensions: the extent of urgency expressed by the policy measures, and the willingness to resolve the climate problem through international collaboration –
unilaterally or multilaterally. In principle, four scenarios are defined by these two
distinguishing dimensions. The following figure indicates these dimensions and the positions of the scenarios.
Figure 1.1 Positioning of the scenarios according to ambition and international collaboration
GRAND COALITION and IMPASSE diagonally oppose each other. In the former scenario the
seriousness of the situation is widely recognized and there is a considerable willingness to collaborate internationally towards a solution. As a result, effective international agreements are made between a large number of countries. The latter scenario shows what would happen if many countries and regions fail to see the need to contribute towards climate policy. This would result in no collective policy measures being pursued and ineffective policies being implemented. There is insufficient political will for collaborative international agreements, and the countries that do implement policies do not show great ambitions, in the knowledge that strict policy measures will make very little difference, but will impose high abatement costs.
The scenarios FRAGMENTED and LARGEST COMMON DENOMINATOR are also diagonally opposing each other. The former scenario generally accepts that climate change is a serious problem, but countries cannot agree on the priority that should be given to address this problem. For example, the USA sees the security of energy supplies as an equally important problem. Partly as a result of priority differences between countries, the will and the
opportunities to work together are also limited. This creates a broad, multicoloured palette of policy measures without international collaboration. On average, LARGEST COMMON
DENOMINATOR shows little urgency, but there is some consensus on the targets for
but none of them is willing to take the lead. The result is that international agreements are set at the level of the least ambitious country: the LARGEST COMMON DENOMINATOR.
All four scenarios have been simulated up to the year 2020, against the background of a baseline up to the year 2100. This baseline scenario does not include climate policy. The WorldScan model is used to sketch the economic implications (in 2020) of the climate policies deployed, and the associated emission reductions in terms of fossil CO2. The
assessed costs pertain to the costs of reducing fossil CO2 emissions. Adaptation costs and the economic damages caused by climate change are not included. The models IMAGE, TIMER and FAIR indicate the climate implications of greenhouse gas concentrations in the longer term, and thus the probability of achieving the 2°C target. With this approach this study establishes trade-offs between the 2020 costs of reducing emissions on the one hand and the likelihood of meeting the EU temperature target by 2100 on the other hand. Though the time horizon of the scenario’s that are simulated with WorldScan is 2020, the assessment of the mean global rise in temperature is based on numerous simluations of similar scenario’s until 2100 with IMAGE, TIMER and FAIR. Appendix A briefly describes the main characteristics of the models used, and their common baseline scenario. Section 2 describes the assumptions for the international and national climate policies incorporated in the four scenarios, and the consequences of these for the economy, CO2 emissions and the likelihood of achieving the 2°C target. The last section concludes and discusses several aspects that are relevant to the policy discussion.
2 Description of the scenarios
2.1 Grand Coalition
This scenario forms the ‘ideal’ future climate policy that is the target of international negotiations by the Netherlands and the EU. The negotiations succeed in forming a GRAND
COALITION that includes not just the Annex I countries, but also large, fast-growing
developing countries such as China, India and Brazil. A new climate mitigation regime follows the so-called ‘multi-stage approach’ (Den Elzen et al., 2006), and stipulates specific efforts such that the 2°C target is expected to remain feasible. The level of development and emissions per capita of the various participating countries determine the extent of the mitigation efforts and the type of commitment (absolute, relative or no commitment at all). Emissions of the least-developed countries are therefore not restricted, but more advanced developing countries must commit themselves to relative targets. The Annex I countries accept absolute emissions reduction targets.
The costs of significant emissions reductions remain limited because emissions trading is used on a large scale. Not just the countries with absolute targets (Annex I), but also the nations with relative targets (China, India and Brazil) use emissions trading, at least for the energy-intensive sectors. Using the opportunities of the Clean Development Mechanism (CDM) is an option in countries with no restrictions on emissions. But since the greatest potential for relatively inexpensive mitigation options is in the fast-developing countries and can be reached via emissions trading, CDM plays only a minor role.
This scenario is quantified as follows. Annex I countries have post-2012 emission targets that gradually lead to overall reductions of fossil CO2 emissions by 20% compared to 1990 levels in the year 2020. For the allocation of emission reductions to individual Annex I countries, the per capita emission levels are taken into account, and therefore the countries with the highest emissions per head will face relatively large reduction targets (see Appendix A). In the long term this leads to a convergence in the per capita emission allowances. From 2011 onwards Latin America, the Middle East and China will reduce their annual emissions by 1% compared to the baseline scenario, while the annual relative reduction for India will be 0,5%. All emission allowances can be traded. The rest of the world has no reduction commitment and de facto does not contribute via CDM either. On a modest scale, financial resources for adaptation will become available through a tax of 0.1 €/tCO2 on emission allowance imports by Annex I countries. These resources are transferred to non-Annex I countries in proportion to the size of their population.
Table 2.1 GRAND COALITION, 2020
Percentage CO2 reduction Emission price National income
Target (actually in 2020) compared to 1990 emissions Target compared to baseline emissions 2020 Emissions 2020 compared to baseline emissions 2020 (%) (%) (%) € / tCO2 % change compared to baseline Annex I -20 -34 -19 24 -0.3 EU-25 -23 -38 -15 24 -0.4 USA -24 -47 -20 24 -0.3
Former Soviet Union -13 7 -22 24 0.8
Rest of OECD -16 -39 -18 24 -0.4 Non-Annex I (100) -- -23 -- 0.0 China 101 -10 -45 24 0.4 India 210 -5 -30 24 0.1 World (28) -- -21 -- -0.2 Source: WorldScan
Under these quantitative assumptions world emissions in 2020 will have risen by 28% compared to 1990 levels (see Table 2.1). This falls just within the emissions envelope for stabilisation of greenhouse gas concentrations at 450 ppm CO2-eq., that is considered to be compatible with meeting the 2°C target with a high probability (see section 2.5). The table also shows that the majority of the Annex I countries are importing emission allowances, both from the Former Soviet Union and non-Annex I countries. As a result of permit tradability the emission price amounts to 24 €/tCO2 in 2020 under the GRAND COALITION scenario. Annex I countries experience an average welfare loss of 0.3% in terms of national income. Russia achieves a welfare increase of 0.8% by selling emission allowances, under a non-restrictive emission target. The improved welfare for non-Annex I countries is generally modest, although China increases its national income by 0.4% by the export of emission permits.
In general, GRAND COALITION clearly shows that international collaboration is cost effective:
the -20% target for Annex I countries is achieved in 2020 with relatively minor changes in economic welfare. In addition, the scenario is also effective from the environmental point of view as it is likely to meet the 2°C target with sufficient probability (see section 2.5).
2.2 Fragmented
Also in this scenario the urgency of the climate question is recognised, yet at different levels in different countries. Hence, little consensus exists on the strictness of the measures that should be taken in the various nations and it turns out impossible to make binding
international agreements. Countries and (within national borders: states, regions, provinces or towns), groups of countries, companies and sectors establish their own individual policies – without worldwide coordination. This produces a colourful palette of internationally
FRAGMENTED climate policies. The possible co-benefits of climate policy, in the form of
security of energy supplies or the mitigation of local environmental problems, play an important role in policy designs.
In the USA the federal emphasis is primarily on technology development. Improving the security of energy supplies plays an important role. Considerable attention is given to biofuels and the improvement of energy efficiency, for example by implementing labels or product norms, and by agreements with industry. Internationally, the USA continues to focus on the continuation and further extension of technology forums and the Asian Pacific
Partnership. CDM does not play a role in the USA – not just due to the general lack of emissions trading opportunities, but also because CDM does not help to improve the security of energy supplies. However, a number of states within the USA is more ambitious than the federal government. Some states are introducing emissions trading (e.g. California and several northern states), while others establish regulations regarding the minimal share of renewable energy or experiment with CO2 capture and storage from coal-fired power plants.
Australia and Canada also focus primarily on technology development. The EU continues the system of setting an absolute ceiling with emissions trading, and also Japan remains a
supporter of this system. The emissions trading systems used by the EU, Japan and a number of American states are eventually linked, thus creating a larger market with lower costs. The larger and fast-developing countries focus primarily on security of energy supplies and local air quality. Specific investments in reducing greenhouse gas emissions only get off the ground if they receive funding from other countries or institutions, such as via CDM. However, the extent remains limited. When there are no effective agreements between countries, initiatives that involve local governments (such as the emissions trading between the American states and the EU or Japan) and by the private sector, gain in importance. Several sectors make international agreements on emissions reduction, which can be in the form of a voluntary emissions ceiling, or agreements on efficiency targets. Since it is not reasonable to expect private sectors to succeed in making effective agreements, where policy makers have failed to reach these at the national level, the measures at sector level only make a modest contribution to emissions reduction.
The following assumptions are made in order to quantify this scenario. The EU sets an emissions ceiling (for the year 2020) that is 15% lower than 1990 emission levels. The allocation of emission reductions to Member States is based on emissions per capita. Around 20% of the emissions reduction is achieved through CDM projects in Latin America, the Middle East, China and India. Japan also sets an emissions ceiling – 10% below 1990 emission levels. Emission allowances are traded freely between the EU and Japan. The remaining OECD countries and the Former Soviet Union freeze their emission levels at 2006 levels via an emissions tax. They do not trade emission allowances and do not use CDM. Latin America, the Middle East, China and India succeed in improving their annual energy efficiency by 0.5% compared to the baseline scenario. The rest of the world puts no
restrictions on emissions. Multinational corporations make agreements that lead to energy efficiency improvements of 0.15% per year in energy-intensive sectors outside the EU-25, compared to the baseline scenario.
The main assumption in shaping the FRAGMENTED scenario is that USA climate change policies are not very restrictive. It then is considered unlikely that other Annex I countries will make efforts that go much further than those assumed here (see also section 2.5).
Table 2.2 FRAGMENTED, 2020
Percentage CO2 reduction Emission price National Income
Target (actual in 2020) compared to 1990 emissions Target compared to baseline emissions 2020 Emissions 2020 compared to baseline emissions 2020 (%) (%) (%) € / tCO2 % change compared to baseline Annex I -1 -19 -17 25 -0.3 EU-25 -15 -32 -27 51 -0.6 USA 25 -12 -12 14 -0.0
Former Soviet Union -25 -7 -7 7 -0.7
Rest of OECD 3 -25 -20 34 -0.4 Non-Annex I (147) -- -5 -- 0.0 China 105 -5 -8 2 0.0 India 203 -5 -7 4 0.0 World (45) -- -11 -- -0.2 Source: WorldScan
Under the FRAGMENTED scenario global emissions increase by 45% compared to 1990 levels.
The welfare loss for Annex I countries is, on average, comparable to that of GRAND
COALITION (-0.3%). Yet, there are considerable differences in welfare impacts amongst Annex I countries. For example, costs increase considerably for EU-25 (-0.6%) and within the Former Soviet Union (-0.7%), while the USA achieves lower costs (-0.0%) with less
effort involved. The extra loss of welfare for the EU-25 is explained by the significantly higher emission price (51 €/tCO2 in 2020) due to the limited international availability of emission allowances. The loss of welfare in the Former Soviet Union is the result of terms of trade losses (due to the lower price of crude oil) and the lack of sales opportunities for ‘hot air’. The non-Annex I countries achieve a minimal welfare increase.
In total, the FRAGMENTED scenario illustrates the major importance of an internationally integrated approach: roughly speaking, the macroeconomic costs of climate policy are comparable with those of the GRAND COALITION, but the environmental effectiveness is far less (45% emissions increase compared to 1990 levels, as against 28% in GRAND
COALITION).
2.3 Largest Common Denominator
This scenario also recognises that global warming is a problem. However, the urgency to find a solution is not felt equally amongst the most important stakeholders. There is some
willingness – also in the USA – to take action, provided this is coordinated multilaterally, particularly with respect to the costs and the consequences for competitiveness. In countries where the climate problem is seen as more urgent, such as in the EU and Japan, people are careful not to get too far ahead of the others. These countries also focus on collaboration. Negotiators are prepared to be flexible in one area of international collaboration provided that agreements can also be made in other areas. Thus, the USA agrees with new international agreements on emissions reduction. The EU accepts that the targets will therefore not be very ambitious. The ambition level of the new protocol is determined by the LARGEST COMMON
DENOMINATOR: the level that is acceptable to everyone.
The Annex I countries participate in this new international protocol, although the targets are not very ambitious. Emissions trading is continued (EU-25) or implemented (the USA and Canada) and CDM is also continued. The large, fast-growing countries participate in CDM.
The LARGEST COMMON DENOMINATOR scenario is quantified as follows. EU-25 and Japan continue to impose the Kyoto targets until 2020. Emission allowances are based on emissions per capita. Other Annex I countries implement an emissions ceiling in 2020 that is equal to actual emissions in 2006. Within Annex I emission allowances are traded freely, with 10% of the reductions in Annex I countries being achieved via CDM in Latin America, the Middle East, China and India.
Globally, in 2020, the LARGEST COMMON DENOMINATOR scenario shows emissions
increasing by 48% (compared to 1990), at an emission price of 18 €/tCO2 for Annex I countries. The loss of welfare in Annex I countries amounts at most to 0.3% of national
income, while the welfare changes in non-Annex I countries are negligible. Although the mitigation targets for Annex I countries are less ambitious than those of the GRAND
COALITION scenario, actual reductions in Annex I countries are not much lower. If the
developing countries would also have set targets and participated in emissions trading, as in the GRAND COALITION scenario, the mitigation targets for Annex I countries could have been
far more ambitious without substantially raising their abatement costs. The difference in ambition level between the two scenarios is mainly covered by imports of emission allowances from the fast-growing developing countries in GRAND COALITION.
Table 2.3 Largest Common Denominator, 2020
Percentage CO2 reduction Emission price National income
Target (actual in 2020) compared to emissions 1990 Target compared to baseline emissions 2020 Emissions 2020 compared to baseline emissions 2020 (%) (%) (%) € / tCO2 % change compared to baseline Annex I 1 -17 -16 18 -0.1 EU-25 -8 -26 -13 18 -0.3 USA 25 -12 -17 18 -0.0
Former Soviet Union -25 -7 -19 18 -0.2
Rest of OECD 4 -24 -15 18 -0.2 Non-Annex I (156) -- -1 -- 0.0 China 118 -- -2 -- 0.0 India 221 -- -2 -- 0.0 World (48) -- -9 -- -0.1 Source: WorldScan
2.4 Impasse
Despite intensive negotiations, the developed and the larger, fast-developing countries fail to achieve post-2012 climate agreements. In particular, the USA, Russia and China do not consider global warming an urgent issue. This leads to an IMPASSE, and no follow-up
agreements are made for the post-2012 period. The USA continues its policy of encouraging technology development, and continues to participate in the Asian Pacific Partnership. The EU tries internally to keep its emissions trading system alive – in expectation of better times at a low ambition level. Thus, it is hoped that later, when climate policy would rank higher on the international policy agenda, it will be relatively easy to switch over to stricter emission restrictions. CDM remains an option, but will rarely be used with a low CO2 price. The other Annex I countries hardly implement climate policies – any policies they put in place are integrated where possible into other policy areas, such as those focusing on security of energy
supplies and local pollution. Japan, Australia and Canada fall back on the Asian Pacific Partnership, where the voluntary agreements have little effect. The developing Asian countries also continue to participate in Asian Pacific Partnership. These developing countries take no new initiatives, but are prepared to continue with CDM.
IMPASSE is quantified as follows. EU-25 sets an emissions target for 2020 that is 5% lower than 1990 emission levels. Emission allowances are allocated according to emissions per capita. The remaining OECD countries succeed in reducing their emissions by 0.25% per year, compared to the baseline scenario. CDM is not used and there is no trade in emissions allowances outside the EU internal market.
Table 2.4 IMPASSE, 2020
Percentage CO2 reduction Emission price National income
Target (actual in 2020) compared to 1990 emissions Target compared to baseline emissions 2020 Emissions 2020 compared to baseline emissions 2020 (%) (%) (%) € / tCO2 % change compared to baseline Annex I 12 -8 -8 11 -0.2 EU-25 -5 -24 -24 42 -0.5 USA 39 -3 -3 2 0.0
Former Soviet Union -21 -3 -3 2 -0.4
Rest of OECD 33 -3 -3 3 0.0 Non-Annex I (161) -- 0 -- 0.0 China (123) -- 0 -- 0.0 India (228) -- 0 -- 0.0 World (56) -- -4 -- -0.1 Source: WorldScan
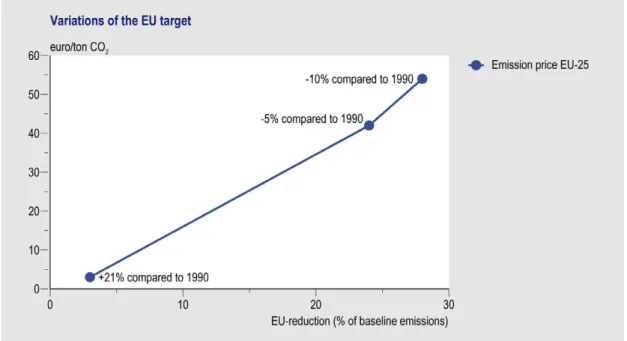
Under the IMPASSE scenario global emissions increase by 56% compared to 1990 levels. In EU-25 an emission price of 42 €/tCO2 applies in 2020 and the loss of welfare amounts to 0.5% of national income. In this situation there is little point in the EU being more ambitious. This is shown by the results of a variant in which the EU ceiling is set at 10% emissions reduction compared to 1990 levels (see Figure 2.1). In this case abatement costs increase to 54 €/tCO2 in 2020, and the welfare loss increases to 0.6% of national income, while the impact on global emissions is almost negligible. Partly due to the fact that emitting activities migrate to other countries, increased efforts by the EU only lead to an extra reduction of worldwide emissions by one percentage point in terms of 1990 emissions.
If the EU decides to do the same as the other OECD countries, i.e. -0.25% reduction per year compared to the baseline, then emissions by EU-25 Member States will eventually be 21% above 1990 levels, at an emission price of only 3 €/tCO2.
Figure 2.1. Variations of the EU target in IMPASSE.Source: WorldScan.
2.5 Which scenarios provide the highest likelihood of
achieving the 2°C target?
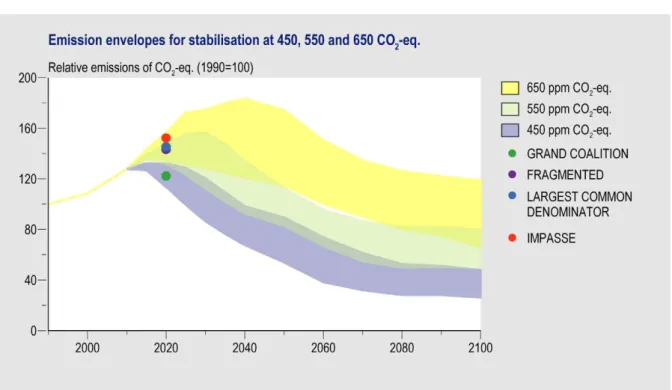
Figure 2.2 compares the 2020 greenhouse gas emissions shown by the various scenarios (see Table 2.5) with ‘ranges’ of interrelated sets of emission pathways (‘emission envelopes’). These emission envelopes show the range within which the emissions for this century must remain, in order to achieve the stabilisation levels for greenhouse gases of 450, 550 and 650 ppm CO2-eq. (Den Elzen et al., 2006).
The top of the envelope is mainly determined by the fact that further postponement of reductions will mean that the intended concentration levels in the atmosphere will no longer be feasible. The emission pathways that in the short term (2020-2030) are found at the top of the envelope, the so-called ‘delayed response’ pathways, will switch to the bottom of the envelope after a period of maximum emission reduction (2% per year for 650 ppm, 2.5% for 550 ppm, and 3% for 450 ppm). The reverse is true for pathways that start at the bottom of the envelope, the so-called ‘early action’ pathways.
The newly compiled ‘emission envelopes’ show that the need for action is urgent. If the world fails to reverse the increase in emissions before 2025 and to let these fall sharply afterwards, it will not be possible to achieve low concentration levels within a reasonable timeframe. A temperature increase of over 2°C is then very likely. In order to achieve the 2°C
target with over 50% certainty (assuming the probabilistic density function for the climate sensitivity1 of Wigley and Raper, 2001), the greenhouse gas concentrations need to be
stabilised at 450 ppm CO2-eq. (Den Elzen and Meinshausen, 2005). In the long term (2050) this means emission reductions of 30-50%, compared to 1990 levels.
Figure 2.2 Emission reductions of the scenarios compared to the emissions envelopes for stabilisation of concentrations, and the chance of achieving the EU climate target, based on Den Elzen et al. (2006). The temperature increase is based on an climate sensitivity of 2.5oC and an uncertainty range of [1.5-4.5]oC, and is in 2100 about 1.9oC [1.1;2.5] for the GRAND COALITION, 2.3oC [1.4;2.8] for the FRAGMENTED and 2.6 oC [1.7;3.1] for the LARGEST COMMON DENOMINATOR and IMPASSE. Source: FAIR.
For 450 ppm CO2-eq. this study assumed that the concentrations up to 2060 may increase up to 500-510 ppm, considering the current high concentrations, and will only stabilise at 450 ppm after the year 2150. If this type of ‘overshoot’ is not accepted, emission reductions of around 70% (compared to 1990 levels) will be necessary in 2050 in order to stabilise concentration levels at 450 ppm CO2-eq. (see, for example, Stern, 2006). The Stern Review warns for the risks associated with allowing an overshoot, such as the one described here. If an overshoot is allowed then the temperature will rise faster and remain high for a longer period before starting to fall. Therefore, Stern does not consider any overshoot, and considers stabilisation at 500 ppm CO2-eq. the lowest concentration level that is feasible. However, a limited overshoot to 500-510 ppm will in the short term not lead to higher temperature
1 Climate sensitivity summarizes the key uncertainties for long-term climate projections and is expressed as the
expected warming of the earth’s surface for a doubling of pre-industrial CO2 concentrations (2x278=556ppm). Several studies have estimated probability density functions (PDFs) for the climate sensitivity. Here, we have used the one by Wigley and Raper (2001), which is built to match the conventional IPCC 1.5 to 4.5oC uncertainty range as being a 90% confidence interval of a lognormal PDF.
increases than stabilisation at 500 ppm CO2-eq., but the long-term stabilisation at 450 ppm leads to lower temperature levels.2 In the longer term (22nd century) the temperature effects
of the overshoot and stabilisation at 450 ppm will be equal.
2 More specifically, the decline of CO
2-equivalent concentration after the peak of 500-510 ppm towards a stabilisation at 450 ppm avoids a further increase in temperature, which would result from a continued
stabilization of concentrations at 500 ppm (as Stern assumes). Therefore, our long-term temperature increase for stabilisation at 450 ppm is lower than for stabilisation at 500 ppm.
GRAND COALITION leads to an increase in fossil CO2 emissions of +28% compared to the 1990 level. This scenario strongly resembles the 450 ppm CO2-eq. scenario (Den Elzen, et
al., 2006), which envisages global greenhouse gas emissions (including non-CO2 emissions and the CO2 emissions of land use) increasing slightly less – by 22% in 2020.3 For GRAND COALITION, the increase in fossil CO2 emissions (+28%) is translated into a 22% increase in global greenhouse gas emissions, as shown in Figure 2.2 and Table 2.5. GRAND COALITION is
the only scenario that falls within the 450 ppm CO2-eq. envelope, and offers a reasonable chance (over 50%) of achieving the EU climate target of a 2°C temperature increase.
3
This is due to the fact that in the short-term the relatively cheap abatement options for some of the non-CO2 gases, lead to more
non-CO2 emission reductions than CO2 emission reductions.
Box 1. Emission envelopes
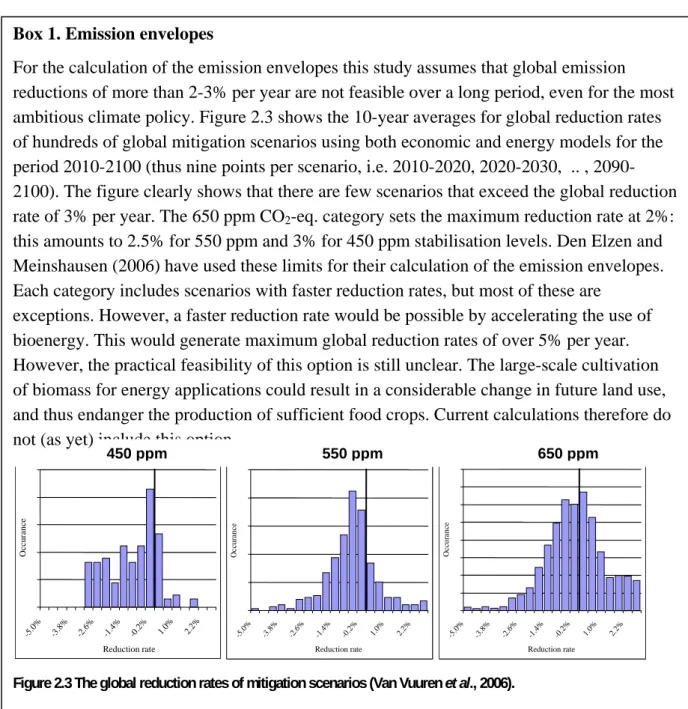
For the calculation of the emission envelopes this study assumes that global emission reductions of more than 2-3% per year are not feasible over a long period, even for the most ambitious climate policy. Figure 2.3 shows the 10-year averages for global reduction rates of hundreds of global mitigation scenarios using both economic and energy models for the period 2010-2100 (thus nine points per scenario, i.e. 2010-2020, 2020-2030, .. , 2090-2100). The figure clearly shows that there are few scenarios that exceed the global reduction rate of 3% per year. The 650 ppm CO2-eq. category sets the maximum reduction rate at 2%: this amounts to 2.5% for 550 ppm and 3% for 450 ppm stabilisation levels. Den Elzen and Meinshausen (2006) have used these limits for their calculation of the emission envelopes. Each category includes scenarios with faster reduction rates, but most of these are
exceptions. However, a faster reduction rate would be possible by accelerating the use of bioenergy. This would generate maximum global reduction rates of over 5% per year. However, the practical feasibility of this option is still unclear. The large-scale cultivation of biomass for energy applications could result in a considerable change in future land use, and thus endanger the production of sufficient food crops. Current calculations therefore do not (as yet) include this option.
Figure 2.3 The global reduction rates of mitigation scenarios (Van Vuuren et al., 2006).
-5.0 % -3.8 % -2.6 % -1.4 % -0.2 % 1.0% 2.2% Reduction rate O ccu ra n ce -5.0 % -3.8 % -2.6 % -1.4 % -0.2 % 1.0% 2.2% Reduction rate O ccurance -5.0 % -3.8 % -2.6 % -1.4 % -0.2 % 1.0% 2.2% Reduction rate O ccu ra n ce -5.0 % -3.8 % -2.6 % -1.4 % -0.2 % 1.0% 2.2% Reduction rate O ccurance -5.0 % -3.8 % -2.6 % -1.4 % -0.2 % 1.0% 2.2% Reduction rate Occ u rance -5.0 % -3.8 % -2.6 % -1.4 % -0.2 % 1.0% 2.2% Reduction rate Occ u rance 450 ppm 550 ppm 650 ppm
Table 2.5 Increase in all greenhouse gases, in relation to the increase in fossil CO2, by scenario, 2020
Increase of fossil CO2
emissions compared to 1990 levels (%)
Increase of all greenhouse gas emissions compared to 1990 level (%)
GRAND COALITION +28 +22
FRAGMENTED +45 +43
LARGEST COMMON DENOMINATOR +48 +45
IMPASSE +56 +52
FRAGMENTED leads to a substantial increase in worldwide emissions (+45% CO2 emissions in 2020 compared to 1990), and only offers a limited chance (34%) (almost ‘unlikely’4) of
achieving the 2°C target. The LARGEST COMMON DENOMINATOR scenario leads to slightly higher emissions and is unlikely to meet the 2°C objective.
Would it be possible through enhanced mitigation efforts of the coalition taking on reduction commitments to increase this chance of meeting the 2°C target? Under the FRAGMENTED
scenario, the coalition of Annex I countries that commits itself to mitigation targets consists only of the EU and Japan, and these countries will eventually need to achieve reductions that are more than 60% (compared to 1990) in order to achieve the 450 ppm target. This is a much higher reduction than under the GRAND COALITION scenario (by a factor of 3). This clearly shows that even a partial involvement of the USA in the reductions in the coming two decades (as assumed in the FRAGMENTED scenario) will lead to ‘unrealistic’ fast and deep
emission reduction commitments for the EU and the rest of Annex I in order to achieve the low stabilization level of 450 ppm. Such deep reductions seem politically, technically and economically unfeasible. This study therefore concludes that even if the FRAGMENTED
assumptions are implemented and that countries take more ambitious policy actions (although uncoordinated and without international agreements resulting from a climate protocol), this would still not lead to a reasonable chance of achieving the 2°C target. The assumed size of the coalition and the intensity of the policy measures determine whether a scenario is
compatible with the temperature target. It is also doubtful (under the FRAGMENTED scenario)
whether the EU would take such far-reaching action to reduce emissions, for example from the viewpoint of security of energy supplies or local environmental quality. With respect to policies concerning the security of energy supplies, it is expected that cost-effective measures will clearly be less radical than those for climate policy. In addition, there may be conflicts between security of energy supply policies and climate policies, if these lead to greater use of ‘dirty’ coal. As yet the literature includes little substantiation as to how far countries are prepared to go n taking mitigation measures in areas other than climate policy, such as air quality or security of energy supplies. The synergy with air quality policy can sometimes be considerable, e.g. in East-European countries, China and India. There are very few studies focussing on the interactions with policies concerning the security of energy supplies, and this subject should be studied further.
4
See IPCC TAR Working Group I Summary for Policymakers: Virtually certain (>99%), very likely (90%-99%), likely (66%-90%), medium likelihood (33%-66%), unlikely (10%-33%), very unlikely (1%-10%), exceptionally unlikely (<1%).
The scenario IMPASSE leads to emissions increases in 2020 that are so substantial that limiting the temperature increase to 2°C thereafter becomes very unlikely.
2.6 Which measures are necessary to achieve the 2°C target?
A recent MNP report (Van Vuuren et al., 2006) establishes the mitigation measures that will be required in order to achieve the climate target of stabilising greenhouse gas concentrations at 450 ppm CO2-eq. In theory, the potential of mitigation measures is large enough to achieve emission reductions of up to 60% within the next five decades. The range of mitigation measures available is therefore considerable: from nuclear energy to renewable energy sources, from saving energy to carbon sinks. Saving energy is thus an important option that, certainly over the next few decades, can form an important part of the total mitigation package. Reducing emissions of non-CO2 greenhouse gases is also a very attractive option, due to the low costs involved. In the longer term, the transition to carbon-neutral systems plays an increasingly greater role. Alongside greater reliance on renewable energy sources or nuclear energy, CO2 storage worldwide may become an attractive technology for the future. These options serve more than just to address climate change, but they also lead to less dependence on fossil fuels, access to advanced ways of using energy sources, better air quality (and thus health), as well as to innovative and new market opportunities for industry. The relative value of these options will partially depend on the extent of these co-benefits.
Figure 2.4 Contributions of global mitigation options in stabilising concentrations at 450 ppm CO2-eq. (Van Vuuren et al., 2006). Source: TIMER.
These options are included in simulations using the TIMER model (Van Vuuren et al., 2006). The carbon price in this model is clearly higher than the price in comparable WorldScan simulations. The higher price of the TIMER model allows more expensive options (such as renewable energy) to be used even before 2020. In the WorldScan model, lower emission prices mean that most of these options are not viable before 2020. Emission reduction in WorldScan occurs because less polluting energy carriers replace the more polluting ones, and because fossil energy is replaced by capital, both in production (capital goods) and
consumption (durable consumption goods), thus reducing energy intensity.
2.7 Options for the Netherlands
The opportunities for climate mitigation options in the Netherlands (up to 2020) have recently been reviewed (Daniels and Farla, 2006). Their review shows that, in theory, the Netherlands has sufficient mitigation options available to achieve a reduction of greenhouse gas emissions in an order of 5-15% in 2020. A domestic reduction of 15% (compared to 1990 levels) is possible at a cost of 1-2 bln euro per year. Yet, technically the potential is as high as 25%. Excluding certain mitigation options leads to higher costs. The review clearly shows that achieving a 15% reduction requires considerable policy efforts.
In order to remain in line with the global reductions necessary to achieve the 2°C target, the Netherlands not only relies on domestic emission mitigation measures, but also uses
measures outside the country, including CDM projects. The ratio between domestic and foreign emission mitigation measures will form an important part of the discussion when determining climate policy for the years following 2012. The costs of climate policy will also need to be weighed against the co-benefits, such as avoiding the costs of air quality policies.
3
Conclusions and discussions
The aforementioned scenarios are meant to sketch possible, alternative developments in the climate policy domain of the EU that are relevant for identifying the best mitigation options to reduce future greenhouse gas emission, both in the Netherlands and the EU. The
conclusions arising from this scenario analysis are based on both the simulation outcomes using WorldScan (up to the year 2020), and the simulation experiments with the three other models: IMAGE, TIMER and FAIR.
3.1 Conclusions
Reducing emissions
The scenario analysis illustrates that only a global approach to address climate change with all major countries being involved will achieve substantial long-term greenhouse gas
emissions reductions that offer a good chance of achieving the EU 2oC climate target. In 2020 the fossil CO2 emissions could increase by around 20-30% compared to 1990 levels. A global approach would mean that the USA, as well as fast-growing, large developing countries such as China, India and Brazil, would be actively reducing their greenhouse gas emissions before the year 2020. In the longer term, achieving the 2°C target would require even greater
mitigation efforts (that lead to 30-50% emissions reduction in 2050, compared to 1990 levels).
Only the GRAND COALITION scenario seems compatible with the EU climate target, and this
scenario assumes that the rich countries will take the lead by achieving greater reductions than the developing countries. The developing countries participate in a phased fashion. Depending on their level of development, they initially accept relative reduction targets, followed by absolute reduction targets. All these reduction targets are technically feasible – using existing, available mitigation measures. The scenarios FRAGMENTED and LARGEST
COMMON DENOMINATOR achieve rather limited reductions in the worldwide growth of
emissions. It is unlikely that these scenarios will eventually be compatible with the 2°C temperature target. In the IMPASSE scenario the rise of emissions up to 2020 is so substantial that it becomes very unlikely that the temperature increase can be limited to 2°C.
Costs
Using worldwide emissions trading the reduction costs in 2020 for industrialised countries can be limited to 0.3% of national income, at an emission price of 24 €/tCO2. The costs per region may vary, and partly depend on the way in which emission allowances are allocated. If the allocation of emission reductions is based on countries’ emissions per capita, then
industrialised nations will bear relatively high costs. The costs to developing countries will be relatively modest, and they may benefit from the export of emission permits.
Stricter mitigation targets and a smaller coalition will both lead to increased costs. A scenario whereby a small coalition contributes to a relatively low global emissions reduction can be relatively more expensive than a scenario whereby a large coalition contributes to a relatively high worldwide emissions reduction. Thus the costs in 2020 for the EU under the
FRAGMENTED scenario will exceed the costs of the GRAND COALITION scenario (with 0.2% of national income).
Figure 3.1 Percentage changes in national income, by scenario and region, 2020. Source: WorldScan.
Relative targets
In a number of scenarios (including FRAGMENTED) it is assumed that, during the period given, there is no support for a global coalition or absolute CO2 reduction targets. Relative targets to reduce the greenhouse gas intensity of economic production have the advantage that they offer more certainty about the expected costs involved. However, the disadvantage is that they offer less certainty with respect to environmental effectiveness.
Emissions trading and CDM
Emissions trading plays a role in all scenarios, although to a varying extent. It makes policies particularly cost-effective, regardless of how emission allowances are allocated. For example, GRAND COALITION achieves a much lower level of greenhouse gas emissions than
FRAGMENTED.Yet, the costs are very similar. Under the IMPASSE scenario a European trading
system is maintained at limited costs (0.5% of national income in 2020). A higher EU ambition level would increase costs further, without substantial benefits in terms of
participate in a mandatory regime. In incomplete coalitions, CDM can reduce the costs of climate policy by making use of relatively inexpensive reduction options elsewhere. However, CDM also has some disadvantages (see ‘Discussion’).
Consequences of lower environmental effectiveness
Three of the four specified scenarios have an outcome showing that the EU target (2°C temperature increase) cannot be achieved. Emissions under LARGEST COMMON
DENOMINATOR and IMPASSE are very similar to those of the baseline scenario, therefore these scenarios will probably lead to greenhouse gas concentrations of over 900 ppm CO2-eq. in 2100, and to a rise in temperature of 3.7°C compared to pre-industrial levels (climate sensitivity of 2.5°C). After 2100 the temperature will continue to rise for many years. Only the GRAND COALITION scenario offers a reasonable chance of achieving the 2°C target. Under the FRAGMENTED scenario, future emissions eventually lead to concentration levels of around 650 ppm CO2-eq. in 2100, and thus to a long-term temperature increase of around 2.3°C compared to pre-industrial levels. Even though FRAGMENTED assumes that countries
implement a more ambitious policy (without international coordination and commitments), this policy would still not lead to a reasonable chance of achieving the 2°C target. In 2020 the EU countries and Japan would need to reduce their emissions by over 60% (compared to 1990 levels) to gain a real chance of achieving the 2°C target.
3.2 Discussion
We would also like to mention the following points that seem to be relevant to the policy debate, although they can not directly be derived from the aforementioned scenarios.
Sector-based targets
A possible alternative is to set worldwide targets per sector, for example based on the best performance in the industry (‘benchmarking’, or sectoral targets). Such sector-based transnational agreements with developing countries could be attractive, in particular in helping to maintain a level playing field for globally competitive industrial sectors. The main difference between relative and absolute targets is the implicit distribution of the costs. Under a relative system the costs are mostly borne by countries with a low energy productivity level.
Technology
Strengthening technology development and dissemination can be an important factor within the climate protocol, for example in accommodating participation of the USA and other countries such as Japan. Developing countries are interested in agreements concerning ‘clean’ developments and technology transfer. However, R&D alone is not enough to reduce
not enough. It is just as important to introduce the ‘pull’ via a market where a specific price is attached to CO2. A lack of ‘pull’ makes adoption and development of new technologies much less probable (De Coninck et al., 2006).
Leakage effects of CDM
CDM is less effective than emissions trading in a regime with absolute caps. Leakage effects of around 10-40% are possible (Bollen et al., 2005). Revenues from CDM projects can lead to price reductions in the sector where CDM is applied. This may induce extra demand and an upward pressure on emissions. On local energy markets, reducing the demand for energy may result in lower energy prices. In addition, difficulties in monitoring the baseline and reduction efforts result in high transaction costs. A first recommendation arising from these analyses would be to use CDM merely as a transitional measure, to prepare developing countries for complete participation in a climate regime. A second recommendation would be to guard against high leakage effects when investing in the energy sector.
Security of energy supplies
There are important synergy effects between measures that limit climate change and those that improve the security of energy supply. Measures that lead to reduced CO2 emissions (energy savings, renewables, nuclear energy) generally also reduce dependence on oil and gas imports. But not always: CO2 capture and storage only improves the security of supply if it also results in an increased use of coal. Replacing coal with gas is good for emissions, but bad for a country’s dependence on natural gas imports. Emissions trading within a broad coalition only leads to limited domestic effort: the energy system changes little, as does the dependence on imports. Vice versa, measures that specifically improve the security of energy supplies do not always have a positive effect on emissions. Leaning more heavily on coal usage may limit gas imports, but will in general also increase emissions.
How robust are these results?
Several explanatory remarks are needed with respect to the cost estimates. The adjustment costs of economic restructuring (temporary and local unemployment, accelerated depreciation of capital goods etc.) are neglected in the calculations. Stricter environmental policies render past investments less profitable and require a number of adjustments in both human and physical capital. Higher energy costs lead to a reduction in real wages. Wage rigidity can lead to (temporary) unemployment.
Monopolistic market behaviour can also lead to higher costs. Emissions markets are assumed to work perfectly, but in reality there may be a limited number of suppliers exerting market power. For example, this would apply to a country like Russia, when it would possess large quantities of hot air in a small coalition. CDM project suppliers may also display
monopolistic behaviour, so that the CDM price comes closer to the emission price on the emission market than would be the case in more competitive circumstances.
The WorldScan analysis only takes account of fossil energy related CO2 emissions, while other (possibly less expensive) mitigation options fall outside the scope of the analysis. Reducing emissions of non-CO2 greenhouse gases may reduce costs in the medium term. In addition, carbon storage and sequestration is not included as an option.
Costs depend on the underlying scenario used. A scenario with higher economic growth leads – in the baseline scenario – to higher emissions, and requires greater reductions in order to achieve certain (absolute) levels (Bollen et al., 2004). Varying trade barriers and transport costs in scenarios may also affect the substitution possibilities in the regions distinguished. Reduced substitution possibilities make climate policy more expensive.
Costs are given for the year 2020, a rather arbitrary moment in time. These costs do not denote a structural long-term impact. It is important to remember that, over the course of time, the mitigation efforts will increase further and the costs will rise accordingly. Previous simulations to realise the 2°C target assess costs to amount to several percents of global GDP in 2040 (Bollen et al., 2004).
Models always produce incomplete pictures of reality. Different models therefore also produce different results. For example, Van Vuuren et al. (2006), using the TIMER model, arrived at an emission price of 50 €/tCO2 for GRAND COALITION (the 450 ppm scenario). TIMER aims to present an overview of the usage of the available technical opportunities for emissions reduction. Using comparable reduction targets and the same baseline scenario, the WorldScan model results in a lower emission price of 24 €/tCO2. This model focuses on showing the economic substitution processes that are set in motion when greenhouse gas emissions are ‘priced’. TIMER takes account of the slow responses of the energy system: it takes time to switch over to cleaner energy carriers. WorldScan does not take explicit account of modification paths, and simply sketches a long-term outcome. The two models have different characteristics (technical versus economic orientation, dynamic short-term versus equilibrium long-term effects), which naturally result in different outcomes.
References
Bollen, J., Manders T., and Mulder M. (2004), Four Futures for Energy Markets and Climate Change, The Hague, Netherlands Bureau for Economic Policy Analysis CPB and National Institute for Public Health and the Environment RIVM.
Bollen, J., Manders T. and Veenendaal P. (2005), Caps and Fences in Climate Change Policies, Trade-offs in shaping post-Kyoto, MNP report 500035003/2005, Bilthoven.
Coninck, H. de, Fischer, C., Newell, R.G. and Ueno T. (2006), International technology-oriented agreements to address global climate change, ECN Amsterdam and Resources for the Future, Washington, DC (concept).
Daniels, B.W. and Farla, J.C.M., 2006, From Climate objectives to emissions reduction. Insights into the opportunities for mitigating climate change. MNP report 773001039 (www.mnp.nl), MNP - Netherlands Environmental Assessment Agency, Bilthoven, the Netherlands. (in Dutch)
Den Elzen, M.G.J., Berk, M.M., Lucas, P., Criqui, C. and Kitous, A., 2006, Multi-Stage: a rule-based evolution of future commitments under the Climate Change Convention. International Environmental Agreements: Politics, Law and Economics, 6: 1-28.
Den Elzen, M.G.J. and Lucas, P. (2005), The FAIR model: a tool to analyse environmental and costs implications of climate regimes, in Environmental Modeling and Assessment, 10(2): 115-134.
Den Elzen, M.G.J., Meinshausen, M. and Van Vuuren, D.P., (2006), Multi-gas emission envelopes to meet greenhouse gas concentration targets: costs versus certainty of limiting temperature increase. Global Environmental Change (in press).
Den Elzen, M.G.J., and Meinshausen, M. (2005), Meeting the EU 2°C climate target: global and regional emission implications. MNP report 728001031 (www.mnp.nl/en), MNP - Netherlands Environmental Assessment Agency, Bilthoven.
Dimaranan, B.V. and McDougall R.A. (eds.), (2006, forthcoming), Global Trade, Assistance, and Production: The GTAP 6 Data Base, Center for Global Trade Analysis, Purdue University, West-Lafayette.
IMAGE-team (2001), The IMAGE 2.2 implementation of the SRES scenarios. A comprehensive analysis of emissions, climate change and impacts in the 21st century. CD-ROM publication 481508018, MNP - Netherlands Environmental Assessment Agency, Bilthoven, the Netherlands.
Lejour, A., Veenendaal P., Verweij G., and Leeuwen N. van,(2006), WorldScan; a Model for International Economic Policy Analysis, CPB document 111, CPB, The Hague, the Netherlands.
Meinshausen, M. (2006), What Does a 2°C Target Mean for Greenhouse Gas Concentrations? A Brief Analysis Based on Multi-Gas Emission Pathways and Several Climate Sensitivity Uncertainty Estimates. In: H.J. Schellnhuber, W. Cramer, N. Nakicenovic, T. Wigley and G. Yohe (Editors), Avoiding Dangerous Climate Change, Cambridge, UK.
Stern, N., 2006. The Economics of Climate Change, The Stern Review. Cambridge University press, Cambridge, UK.
Van Vuuren, D.P., Den Elzen, M.G.J., Eickhout, B., Lucas, P.L., Strengers, B.J. and Ruijven, B. (2006), Stabilising greenhouse gas concentrations. Assessment of different strategies and costs using an integrated assessment framework, in Climatic Change (in press).
Wigley, T. M. L. and Raper, S. C. B., 2001. Interpretation of high projections for global-mean warming, Science, 293(5529): 451-454.
Appendix A: Characteristics of the models used and of
the baseline scenario
A.1 WorldScan
The quantitative, economic characteristics of the various scenarios are based on simulation outcomes from WorldScan (Lejour et al., 2006), which is a general equilibrium model for the world economy. This model was developed in the 1990s for scenario construction and is often used for scenario studies and for all kinds of policy studies, also in the field of global warming (see, for example, Bollen et al., 2004, and Bollen et al., 2005). The model is based on neo-classical theory and shows the outcome of microeconomic behaviour of the agents, subject to balance conditions and additional restrictions. In establishing an equilibrium for the global economy, the welfare of the various consumers is maximised and all balance equations and eventual policy restrictions (such as CO2 emission ceilings) are met.
General equilibrium models generally take account of the interdependencies between individual markets for various goods and production factors. It is usually assumed that there are no frictions in these markets, so that each of the production factors is fully utilised. In addition, the use of production factors can be immediately reallocated across the various sectors. This means that the model outcomes for the policy scenarios can be seen as ‘long-term’ reactions to the policy used: the costs of restructuring and modifications in the medium term are not taken into account. Supply, demand and trade are modelled in WorldScan as follows.
Supply
Potential production is determined for each region by the availability of primary production factors. WorldScan differentiates between labour, capital, natural resources and technology. The supply of labour is exogenous, and is based on projections of participation levels for various demographic cohorts. International capital mobility is incomplete. The capital goods available depend on both the investment opportunities and national savings. The availability of natural resources and the speed of technical progress are exogenous. The simulations take account of the fact that developing countries can learn from the rich nations. Across the globe there is some convergence of total productivity. However, at the sectoral level the rate of productivity expansion varies considerably – in accordance with historic patterns.
Demand
The demand for goods and services shifts over the course of time. The demand for services becomes relatively more important than that for manufactured or agricultural products. This shift in demand is the result of varying income elasticities and varying developments of relative prices – which partially depend on sectoral growth differences. National savings rates depend on the demographic structure – according to empirical estimates.
Domestic market tensions between supply and demand can be partially relieved by international trade. However, trade opportunities are limited. Goods and services from different origins are not fully substitutable (the Armington assumption). International trade is made more difficult by transport costs, trade tariffs and non-tariff barriers.
Table A.1 Overview of regions, sectors and production inputs (WorldScan)
Regions Sectors Inputs
Germany Agriculture Factors:
France Minerals Low-educated workers
UK Oil Well-educated workers
Italy Coal Capital
Spain Oil refinery products Fixed factor The Netherlands Natural gas
Other EU-15 Electricity Energy carriers: New Member States Energy-intensive products Coal
Other European countries Chemicals Oil refinery products
Turkey Consumer goods Natural gas
USA Capital goods Commercial biomass
Canada Transport Renewable energy sources
Australia Other services
Other OECD countries Other intermediary inputs:
Former Soviet Union Agriculture
China Minerals
India Oil
Brazil Electricity
Other Latin America Energy-intensive products Middle East and North Africa Chemicals
Rest of the world Consumer goods
Capital goods Transport Other services
WorldScan takes its data for the base year (2001) from the GTAP-6 database (Dimanaran and McDougall, 2006), which contains integrated data of bilateral trade flows and input-output data for 57 sectors and 87 countries (or groups of countries). The WorldScan version used for this scenario study distinguishes thirteen markets for goods and services, one labour market and a capital market for each of the 21 countries and regions shown in Table A.1. Five different primary energy carriers are distinguished: coal, oil refinery products, natural gas,
commercial biomass and renewable energy. Only the first three of these contribute to the CO2 emissions generated by the model.
A.2 Allocating emission allowances within coalitions
Under the aforementioned scenarios, emission allowances are allocated to coalition partners based on emissions per capita. Countries with a relatively high emission-per-capita level therefore have a relatively heavy reduction target. If eti is the emission volume of coalition member i in year t and cit the emission volume per capita, then
∑
= j j t j t i t i t i t c e c e μ (A.1)is the share of country i in the intended emission reduction rtof the total coalition. Suppose
that the intended reduction in target year teis a certain fraction e
t
ρ of the emissions in the base year t0, or
∑
= j j t t t e r e e ρ 0 (A.2)and that the reduction path is started immediately after year ts. There is therefore a transition period of τ =te−ts years during which the reduction target is gradually achieved. Over this
period the emission allowances eti are allocated to coalition members as follows: ) ,..., 1 ( )) ) ( ( )( ( )) ( 1 ( 0 ` 1 1 e s t j t j j t i t i t s i t s i t t t e t t e e e r t t t e e s s s s + − − − + = + − − = τ− τ− μ
∑
(A.3) Note that with (A.3) the coalition achieves exactly the reduction target of the target year.∑
∑
= − j j t t j j t e e e e (1 ρ ) 0 (A.4)In the scenarios the triple (t0,ts,te) takes the value (1990, 2010, 2020).
A.3 IMAGE, TIMER and FAIR
Three integrated models were used to calculate the emission envelopes (see Section 2.5): the ‘integrated assessment model’ IMAGE 2.3 (IMAGE team, 2001), the energy system model TIMER (Van Vuuren et al., 2006) and the climate policy model FAIR (Den Elzen and Lucas, 2005). The calculations were performed in three steps:
1. The first step involves constructing a baseline scenario for future greenhouse gas emissions, using the IMAGE and TIMER models. The TIMER model also yields the
availability of mitigation options and the associated mitigation costs, while the IMAGE model provides options and costs for the land-related sources, including biomass.
2. The second step involves using the FAIR model to produce ‘envelopes’ of emission reductions (groups of feasible emission pathways) that match the stabilisation targets for concentration levels (450, 550 and 650 ppm CO2-eq.) (Den Elzen and
Meinshausen, 2005). Within these envelopes a set of measures was sought that would result in the ‘least expensive’ global emission pathway for the various regions, sectors and greenhouse gases. Climate calculations were made using a simple climate model: MAGICC 4.1.
3. Finally, IMAGE and TIMER produce the specific eventual mitigation scenario (emissions, land use and energy system) with emission levels and the international market price of emissions allowances, as determined in the previous phase.
When determining the reduction envelopes it was assumed that, due to technical limitations, the worldwide reduction rate would not be higher than 2-3% per year (see box of Section 2.5). When defining the set of measures no limitations were put on using reduction options in the various sectors, greenhouse gases and regions. In theory this might be rather optimistic as far as the costs are concerned. Limiting the use of measures per sector can lead to
considerably higher costs, in particular if some of the relatively cheap non-CO2 reduction options are excluded.
All calculations using IMAGE, TIMER and FAIR distinguish 17 regions. The targets can be achieved not just by utilising measures within the region, but also through emission
reductions elsewhere. Emissions trading systems allow these reductions to be traded between the different regions. In total, the models used provide insight into the chances of achieving the 2°C temperature target, the contribution made by the various measures, and the (regional) costs, assuming that the measures can be realised in all regions. The costs involved refer only to the direct costs of the climate policy. Additional costs, such as restructuring costs or loss of fossil fuel exports, are not included in these calculations. On the other hand, additional co-benefits (such as lower costs for air pollution policy) are also excluded from this study.
A.4 Baseline scenario
All analyses are based on a so-called middle-course scenario without climate policy, which has been developed by MNP (Van Vuuren et al., 2006). This scenario is based on estimates of trends, and is comparable to the reference scenario used by the International Energy Agency (IEA) and the so-called B2 scenario used by the IPCC. According to this baseline scenario, the global population will continue to expand to 9-10 bln in the middle of this century, and decrease slightly thereafter. Combined with a worldwide economic growth of around 2% per year, the global demand for energy will increase significantly: doubling current consumption in 2050, and trebling it in 2100. This expansion will primarily take place
in the nations currently known as developing countries, which will thus partially reduce the gap in energy consumption per capital with the industrialized countries.
Table A.2 Data for base year, 2001
Population GDP
Energy
consumption Emissions
Energy
intensity CO2 intensity
(million) (billion $) (Mtoe) (GtCO2) (USA=100) (USA=100)
Annex I 1271 24575 5398 13.78 107 96 EU-25 453 8261 1503 3.73 88 93 USA 288 10085 2076 5.52 100 100 Former Soviet Union 282 415 868 2.13 1017 92 Rest of OECD 248 5815 951 2.40 79 95 Non-Annex I 4796 6703 3168 8.97 230 107 China 1292 1332 974 3.17 355 122 India 1033 478 311 0.98 316 118 World 6067 31279 8566 22.75 133 100
a) Total of coal, refinery products, natural gas, commercial biomass and renewable energy Source: WorldScan
Without climate policy it would be primarily the fossil fuels that meet the energy demand and CO2 emissions would increase accordingly. In the baseline scenario the total greenhouse gas emissions increase from around 30 bln tons (=Gt) CO2-eq. in the year 2000 to some 50 bln tons in 2050, and 70 bln tons in 2100. The projections from other (alternative) baseline scenarios are sometimes higher and sometimes lower (between 40 and 90 bln tons). Fossil CO2 emissions increase in the baseline scenario from almost 23 GtCO2 in 2001, to around 34 GtCO2 in 2020 (see Tables A.2 and A.3). Although historically the total greenhouse gas emissions were largely caused by the rich nations (around 80%), just as with energy
consumption growth, the growth in emissions is now greatest in developing countries: their share in global emissions increases from around 50% (current levels) to 65% in 2100.
Table A.3 Characteristics of baseline scenario, average annual growth, 2001-2020 Population GDP Energy consumption Emissions Energy intensity CO2 intensity % % % % % % Annex I 0.2 2.6 1.4 1.2 -1.2 -0.2 EU-25 0.0 2.3 1.4 1.2 -0.9 -0.2 USA 0.9 3.0 1.2 1.1 -1.7 -0.1
Former Soviet Union -0.2 5.5 1.8 1.5 -3.5 -0.3
Rest of OECD 0.1 2.1 1.4 1.1 -0.7 -0.2 Non-Annex I 1.3 5.0 3.3 3.0 -1.7 -0.3 China 0.6 7.4 2.7 2.4 -4.4 -0.3 India 1.5 5.8 3.6 3.4 -2.1 0.2 World 1.1 3.2 2.2 2.0 -1.0 -0.2 Source: WorldScan
This trend is also visible for fossil-based CO2 emissions over the period 2001-2020. Although the contribution by non-Annex I countries to worldwide emissions amounted to around 40% in 2001 (see Table A.2), this appears to increase to over 48% in 2020 (according to Table A.3). Emissions per capita in the current OECD countries remain higher than those of developing countries. Compared to current levels (around 425 ppm CO2-eq.) the greenhouse gas concentration in the baseline scenario rises to more than double in 2100 (above 900 ppm CO2-eq.) and continues to increase thereafter. At an average estimate of climate sensitivity (2.6°C), the temperature increase in 2100 will be 3.7°C (Den Elzen et al., 2006b).