International review of
IMAGE 3.0
Report of the 2014 IMAGE Advisory Board
Leen Hordijk (Chairman), Nigel Arnell, Dieter Gerten, Martin van Ittersum, Ger Klaassen, Keywan Riahi, Jörn Scharlemann, Peter Janssen (secr.)
Table of Contents
Executive summary ... 3
1. Introduction ... 8
2 Brief description of IMAGE ... 9
2.1 A brief history ... 9
2.2 The IMAGE 3.0 model ... 9
3 Evaluation procedure ... 14
4 General observations and recommendations ... 15
4.1 General impression of book, website and research output ... 15
4.2 Transparency ... 16
4.3 Methodological aspects ... 17
4.4 Model evaluation and uncertainty ... 18
4.5 Staffing, collaboration and funding ... 19
4.6 Future strategy ... 20
4.7 Future research directions ... 21
5 Specific observations and recommendations ... 25
5.1 Agro-economy - MAGNET ... 25
5.2 Land use allocation ... 25
5.3 Livestock ... 26
5.4 Human systems ... 27
5.5 Energy ... 28
5.6 Biodiversity and Ecosystem Goods and Services ... 28
5.7 LPJmL - Crops and grasslands ... 30
5.8 GLOFRIS ... 31
5.9 Nutrients ... 31
5.10 Water ... 32
References ... 33
Annex 1: Applications of IMAGE ... 36
Annex 2: Addressing questions of Prof. Maarten Hajer, director of PBL ... 38
Annex 3: Short bios of the Advisory Board members ... 40
Executive summary
This report summarizes the findings of the IMAGE Advisory Board meeting, which took place from 9 to 11 July 2014 in The Hague. The Advisory Board was asked by PBL Netherlands Environmental Assessment Agency to evaluate the newly released version of the integrated assessment model framework IMAGE – IMAGE 3.0, and to reflect on the future development and application strategy of the IMAGE framework.
IMAGE is one of the world’s leading integrated assessment modelling frameworks, and the current version has been improved to strengthen its relevance in assessing global, long-term environmental and sustainability problems and identifying possible response strategies. Earlier versions of IMAGE have been used to support various international assessments, including IPCC assessments, UNEP’s Global Environment Outlooks, OECD’s Environmental Outlooks and the Millennium Ecosystem Assessment. Moreover, it has been extensively used in the scientific literature.
General impression of book, website and research output
The Advisory Board commends the IMAGE team with the progress made in recent years and with the productivity of the IMAGE team as shown by the extensive publication record. It considers the IMAGE framework and its applications as a prime example of innovative use of system/analytical approaches where a blend of different models are coupled for integrated and holistic analyses of environmental and societal challenges. The model applications and resulting publications are of high scientific excellence and policy relevance. The IMAGE 3.0 book is an excellent, well organized and well written source and documentation for the IMAGE 3.0 framework and its use in assessing key policy issues. The accompanying website/wiki offers a novel approach and a comprehensive portal to the various parts of the IMAGE 3.0 framework and contributes significantly to accessibility and transparency.
Transparency
The Advisory Board recommends to further enhance transparency by extending the
website/wiki to include information on all salient model assumptions, model equations, model parameters, data (that are not intellectual property protected or privacy sensitive) and
scenarios involved, and by providing more explicit information on linkages and interactions of the model(component)s which are part of the IMAGE framework.
In addition the Advisory Board recommends to develop a strategy for dealing with the
increasing demand for open data and open model access, fitting within given legal contexts and also within contexts of the requirements in international assessment studies (e.g. IPCC, IPBES). Moreover the Board suggests that the IMAGE team thinks about further ways to enhance scientific credibility through transparency and offering peers the possibility to review the model quality. It recommends to explore the possibility to include representatives of the user
users/clients to identify their needs. It is also advised to consider an increased frequency of Advisory Board meetings (e.g. once in five years as opposed to the current eight year interval). General methodological aspects
The Advisory Board signals that IMAGE model(component)s show a large variation of
application ranges. Joint use of these model(component)s (e.g. in long-term scenario analyses) causes the risk that IMAGE as a whole operates outside its tested ‘safe operating space’. Moreover, given that some model(component)s of the IMAGE framework are being developed outside the core IMAGE team, it is of great importance to establish a quality assurance protocol for model(component)s that are the responsibility of partners both within PBL and outside. The Board recommends that the IMAGE team identifies and prioritizes the major missing links amongst model(component)s and decides how to deal with this (e.g. by including some
additional links/feedback).
The Advisory Board observes that some aspects appear more than once in different parts of the IMAGE framework. It is important that common components, for instance hydrology and land use, are treated in a consistent way across all IMAGE model(component)s involved.
The Board recommends that the regions currently used in IMAGE be reviewed and potentially re-aligned to match current political regions and therefore ensure IMAGE’s continued policy relevance.
Model evaluation and uncertainty
The Advisory Board observes that while the IMAGE team has done structured uncertainty analyses, in the IMAGE 3.0 book uncertainties are often only partially and qualitatively
discussed. Moreover, validation of the outcomes or specific ranges of the results (as given e.g. by model parameter uncertainties) are not shown. Therefore, the Board recommends to extend model evaluation/validation and uncertainty analysis, with focus not only on separate
model(component)s but also on their combined use. The Board refers to the valuable
contribution of the IMAGE team in the Integrated Assessment Modelling Consortium (IAMC) model which deserves continuation.
Furthermore the Advisory Board suggests considering to what extent models can be evaluated by ‘ground-truthing’, e.g. by comparing model results with empirical data and/or information from more location specific approaches. Moreover, it recommends to use a systematic and computationally efficient approach for sensitivity/uncertainty analyses, to characterise overall uncertainty and assess the contribution of different sources of uncertainty to key IMAGE output metrics and impact indicators.
Staffing, collaboration and funding
The Advisory Board finds the decline in permanent funding regrettable – it puts at risk sustained development, maintenance, consistency checks and data storage, especially since several
to be ensured, possibly also by way of outsourcing model development to other institutes or companies.
The balance between permanent and project/temporary staff has changed considerably in the recent years, which is some reason for concern. The Advisory Board thus recommends to increase the number of permanent staff to restore the balance between permanent and temporary staff, and to retain a critical mass for code and data maintenance, continuity in core competence, overview and expertise, and coordination among model(component)s and
collaborators, while also safeguarding core innovation and intellectual leadership.
An important strategy to respond to limited budget and human resources at PBL are the recent developments of PBL staff being also professors at different universities (e.g. Utrecht
University). This development should be actively encouraged. It has helped to diversify core model development and innovation under leadership of PBL staff at universities. Benefits include increased inflow of young talent, increased overall research efficiency and increased output (at reduced costs for PBL).
The Advisory Board recommends to establish soon a strategy for the development and
maintenance of the entire IMAGE framework including a division of labour between PBL and its collaborators on model(component)s of IMAGE. In this context it also recommends to explore the advantages and disadvantages of making IMAGE a community model, as opposed to the option to locate all software development of the framework at PBL.
Future strategy
Given the decline in permanent funding and given the major model developments in the previous phase, the Advisory Board recommends a visioning process in the near future. As part of this visioning process the Board recommends to identify potential (new) users of IMAGE 3.0 (policy-makers, scientists, business sectors and companies), and explore their needs and what IMAGE wants to do/achieve. The Board recommends to further enhance IMAGE’s potential for analysing nexus problems. The linkages between environmental challenges (impacts and response strategies for simultaneously addressing climate change, air pollution, biodiversity, etc.) and their implications for broader development objectives (e.g. Sustainable Development Goals (SDGs)) are highly policy relevant, and present a good basis for research foci.
The IMAGE leadership needs to prioritise the currently numerous issues for improvement and/or extension of parts of the IMAGE framework, in the light of overall IMAGE goals and limited resources. Additionally, the Advisory Board, recommends that the IMAGE leadership establishes a clear strategy on ownership issues and quality assurance for model(component)s that are the responsibility of partners both within PBL and outside.
Future research directions and potential new clients
Future improvements and extensions of model(component)s in the IMAGE framework need to be done in a balanced and focused way, taking into account what is needed for serving (new)
clients/communities and enabling nexus-like studies and integrative policy advice – a traditional strength of the IMAGE team.
The Advisory Board recommends to identify which major improvements in both the Human system and Earth system and their interconnections are needed to better address these tasks.
It is to be expected that the IMAGE framework will be used more frequently by policy
Directorates General (DG) of the European Commission. More work could come from the DGs Climate Action, Research and Innovation, Environment, and Agriculture, especially for nexus questions. Several UN related bodies can be approached more actively to gain clients. In order to enhance the IMAGE model’s capability for macro-economic analysis the already existing collaborations with IIASA, PIK and FEEM could be extended to e.g. Cambridge Econometrics to capture macroeconomic feedbacks.
Global businesses in the energy, agriculture and extractive sectors could be interesting new clients for IMAGE analysis as well. It is to be expected that these sectors would like to see more sectoral detail in the respective IMAGE modules. Consider also to approach the World Business Council for Sustainable Development for potential clientele.
The Advisory Board does currently not see a role for IMAGE for analyses and assessments at city level. This would require a major investment in geographical and process detail of the model, which would only be possible with additional funding or outsourcing of the modelling and data work.
In the light of this potential new clientele and novel application areas the Advisory Board
considers the following general issues to be of relevance in further outlining the future research directions:
• The IMAGE model development efforts in the areas of energy and land-use change should be carefully balanced. E.g. results for the energy model TIMER can be made yet more policy-relevant by more explicit modelling of behavioural change, human
preferences, market dynamics, and including a better representation of salient heterogeneities (in consumer groups, rural/urban, income distributions). E.g. forestry and agricultural land use appear as separate issues in the current IMAGE version. To allow a more complete trade-off analysis in land-use allocation - as is requested when contributing to e.g. nexus studies on biodiversity, energy and food security - these aspects should preferably be more fully integrated, allowing also an analysis of the competition between agriculture and forestry. Moreover, to be more able to respond to changing policy and research demands, it is worthwhile to consider what improvements in the representation of agro-economy in IMAGE, in relation to land-use and agricultural modelling, may be possible and what streamlining of the land-use and agricultural part could be feasible and helpful in this.
• The Board also recommends to consider the inclusion of low probability high-impact events, given their potentially major impacts and policy relevance.
• The Board recommends to update the base year from 2005 to a more recent year, e.g. 2010 or 2012, which will possibly require a substantial effort, but which is of importance to keep the assessments up to date.
• Applications should include realistic policy scenarios, which reflect current policies, while it is also important to develop visionary scenarios that go beyond current policies and established thinking.
• Putting water higher on the agenda as a link between human and natural systems and as a major policy domain (as important as energy and land-use policy) is desirable. Given the importance of the marine system as a source of food and protein, and its role in climate change, consider what features of oceans and water in general to include in future IMAGE versions.
• The Board considers the GISMO model, which models human health and human development related issues, a strategically very important part of IMAGE, enabling the consideration of broader development policy objectives (e.g. SDGs). Many other Integrated Assessment Models are not able to do this to this extent. Given this importance, the Board expresses concerns about the current staffing of GISMO and recommends to reconsider this and the position of GISMO within the IMAGE framework during the visioning process.
In addition to these more general issues, the Advisory Board has expressed further concerns and recommendations on specific model(component)s which are part of the IMAGE-framework. These are presented in more detail in chapter 5 of this report, and are not further specified here.
1. Introduction
Starting in the late 1980s as a single world model for assessing the climate change process globally, the IMAGE integrated assessment modelling framework developed at the PBL
Netherlands Environmental Assessment Agency (and its predecessors) has gradually evolved as a tool to analyse global environmental change and sustainability problems.
Recently a new version, IMAGE 3.0, has been released1 accompanied by new model
documentation – provided as a book (Stehfest et al. 2014) as well as an expanded website/wiki2– intended as a complete and concise description of the framework. The
documentation highlights how the framework is used to assess key policy issues, such as climate change, air pollution, land-use change, biodiversity loss, and water scarcity.
In the light of this new release and the strategic discussion on the future development and application strategy of the IMAGE framework, PBL has asked an Advisory Board to evaluate the present version of IMAGE and its documentation, and posed the following guiding questions:
1. Does the book (and the web-based Wiki documentation) serve as a complete, concise reference book for the IMAGE 3.0 framework?
2. How complete is the model framework as a whole, in light of current societal, policy and research issues?
3. Are the different framework components of adequate detail and scientific rigor, taking into account requirements of an overall, global integrated assessment framework? 4. Are the inter-linkages between the components sufficient in kind and type to support
the overall outcomes?
5. Are the purpose and use of the framework sufficiently clear from the descriptions provided; in Chapter 2 for the framework, in Chapters 3-8 for the components? 6. Are limitations and uncertainties sufficiently addressed to be able to put the results in
perspective of conceivable ranges?
Moreover, the Advisory Board was asked to reflect on the issues addressed in a draft IMAGE strategy document (version July 2014). This document addresses the current status of the model and identifies the focal questions for IMAGE in the next five years. Against this setting the strategy document discusses consequences for ambition, research focus, model
development and application. The document also considers how this could be established strategically and operationally, taking into account how to organize the work involved and with whom to collaborate.
1 See http://www.pbl.nl/en/news/newsitems/2014/image-30-released 2http://themasites.pbl.nl/models/image/index.php/Main_Page
2 Brief description of IMAGE
32.1 A brief history
IMAGE 3.0 (Stehfest et al. 2014) is the most recent, operational version of the model framework progressively developed since the late 1980s. After publication of the IMAGE 2.4 book
(Bouwman et al. 2006) and a subsequent progress review by the IMAGE Advisory Board in 2006 (Hordijk et al. 2007), the framework has been further developed. These developments were published in journal articles and conference papers, but no new versions were officially released.
For example, representation of energy demand was improved by more bottom-up modelling of household energy systems in TIMER for rural and urban population by income level. Selected industries were better represented in more technical detail to underpin energy demands and emissions. The forestry sector model was enriched by forestry management options in addition to clear-cutting.
In cooperation with Wageningen University (WUR, Wageningen UR) and the Potsdam Institute for Climate Impact Research (PIK, Germany), the IMAGE natural vegetation and crop
components were replaced by the LPJmL Global Dynamic Vegetation Model. This enabled modelling of linked natural and agricultural vegetation dynamics, carbon and water cycles, and adding a dynamic global hydrology module to IMAGE, which was not available in previous versions. Modelling biodiversity impacts as provided by the GLOBIO model was extended to cover freshwater systems as well as terrestrial biomes.
2.2 The IMAGE 3.0 model
IMAGE 3.0 is a comprehensive integrated assessment model framework of interacting human and natural systems. The model framework is suited to conduct large-scale (mostly global) and long-term (up to the year 2100) assessments of interactions between human development and the natural environment, and integrates a range of sectors, ecosystems and indicators. The impacts of human activities on the natural systems and natural resources are assessed and how such impacts affect the provision of ecosystem services that sustain human development. The model identifies socio-economic pathways, and projects the implications for energy, land, water and other natural resources, subject to resource availability and quality. Unintended side effects, such as emissions to air, water and soil, climatic change, and depletion and degradation of remaining stocks (fossil fuels, forests), are taken into account in future projections.
Features
IMAGE has been designed to be comprehensive in terms of human activities, sectors and environmental impacts, and where and how these are connected through common drivers, mutual impacts, and synergies and trade-offs. IMAGE 3.0 has the following features:
• Integration of energy and land systems was a pioneering feature of IMAGE. Recently, other Integrated Assessment Models (IAMs) have been developed in similar directions. Currently five global IAMs with similar coverage exist, with IMAGE retaining its position at the forefront of global IA modelling.
• Coverage of all emissions by sources/sinks including natural sources/sinks makes IMAGE
appropriate to provide input to bio-geochemistry models and complex Earth System Models (ESMs).
• In addition to climate change, which is the primary focus of most IAMs, the IMAGE
framework covers a broad range of closely interlinked dimensions. These include water availability and water quality, air quality, terrestrial and aquatic biodiversity, resource depletion, with competing claims on land and many ecosystem services.
• Rather than averages over larger areas, spatial modelling of all terrestrial processes by
means of unique and identifiable grid cells captures the influence of local conditions and yields valuable results and insights for impact models.
• IMAGE is based on biophysical/technical processes, capturing the inherent constraints
and limits posed by these processes and ensuring that physical relationships are not violated.
• Integrated into the IMAGE framework, MAGICC-6 is a simple climate model calibrated to
more complex climate models. Using downscaling tools, this model uses the spatial patterns of temperature and precipitation changes, which vary between climate models.
• Detailed descriptions of technical energy systems, and integration of land-use related emissions and carbon sinks enable IMAGE to explore very low greenhouse gas emission scenarios, contributing to the increasingly explored field of very low climate forcing scenarios.
• The integrated nature of IMAGE enables linkages between climate change, other
environmental concerns and human development issues to be explored, thus
contributing to informed discussion on a more sustainable future including trade-offs and synergies between stresses and possible solutions.
Model components
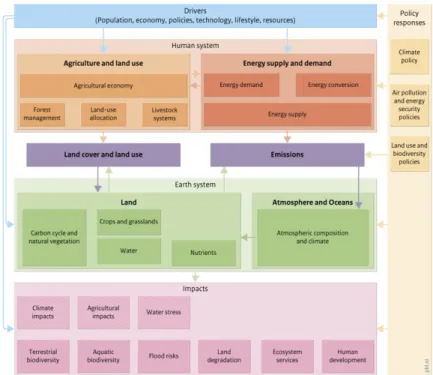
The components of the IMAGE framework are presented in Figure 1, which also shows the information flow from the key driving factors to the impact indicators.
Future pathways or scenarios depend on the assumed projections of key driving forces. Thus, all results can only be understood and interpreted in the context of the assumed future
environment in which they unfold.
As a result of the exogenous drivers, IMAGE projects how human activities would develop in the Human system, namely in the energy and agricultural systems. Human activities and associated demand for ecosystem services are linked to the Earth system through the ‘interconnectors’ Land Cover and Land Use, and Emissions.
Assumed policy interventions lead to model responses, taking into account the relevant internal interactions and feedback. Impacts in various forms arise either directly from the model, for example the extent of future land-use for agriculture and forestry, or the average global temperature increase up to 2050. Other indicators are generated by activating additional models that use output from the core IMAGE model, together with other assumptions to estimate the effects, i.e. for example, biodiversity (GLOBIO) and flood risks.
The IMAGE 3.0 model has a wide range of outputs, including: • energy use, conversion and supply;
• agricultural production, land cover and land-use; • nutrient cycles in natural and agricultural systems; • emissions to air and surface water;
• carbon stocks in biomass pools, soils, atmosphere and oceans; • atmospheric emissions of greenhouse gases and air pollutants;
• concentration of greenhouse gases in the atmosphere and radiative forcing; • changes in temperature and precipitation;
• sea level rise;
• water use for irrigation.
These standard outputs are complemented with additional impact models with indicators for biodiversity, human development, water stress, and flood risks.
Spatial resolution
To capture spatial and multi-scale differences, IMAGE models socio-economic developments in 26 world regions. Land use, land cover, and associated biophysical processes are treated at grid level to capture local dynamics. The grid resolution has been increased to 5 x 5 arcminutes in IMAGE 3.0 (corresponding to 10 x 10 km at the equator), from 30 x 30 arcminutes (0.5 x 0.5 degrees) in IMAGE 2. Operating within global boundaries, the regional approach provides insight to identify where specific problems manifest, where the driving factors are concentrated, and how changes in some regions influence other regions.
Areas of application
IMAGE has been used for an impressing wide array of purposes and studies, as documented in more detail in Annex 1.
Modular structure
Over the years, various components of the IMAGE framework have been replaced by specific expert models developed outside IMAGE, which can be used either as stand-alone models or within the IMAGE framework.
The IMAGE 3.0 core model comprises most processes in the Human system, the Earth system and their connectors Land cover/Land use and Emissions, and parts of the impacts (see the figure 1). This core model consists of IMAGE/TIMER energy and IMAGE/Land & Climate. The latter also includes the LPJmL model, which is an essential component of any IMAGE model run, representing carbon, water, and crop and vegetation dynamics.
The IMAGE 3.0 framework facilitates linkage to and includes other models that are employed to generate impacts (such as GLOBIO, GLOFRIS and GISMO), and models that describe parts of the
Human system, such as agro-economic models (MAGNET and IMPACT) to project future agricultural production requirements. Furthermore, policy models, such as FAIR, are used in exploring effectiveness, efficiency and equity of climate policy regimes, and to provide input on emission constraints and price signals arising from climate policy proposals. For an overview of the various models involved in the IMAGE 3.0 framework see
3 Evaluation procedure
The Advisory Board consisted of seven members with a broad range of expertise (see Annex 3). The Board received its instructions from the PBL management (see chapter 1) and met from 9 to 11 July 2014 at the PBL head office in The Hague. Scientific staff of the IMAGE team presented the current state of IMAGE 3.0 and plans for future development (see the program of the meeting in Annex 4). The director of the PBL, Prof. Maarten Hajer, informed the Advisory Board about PBL’s strategy and its commitment to further develop and use the IMAGE model.
The Advisory Board (AB) had access to the IMAGE3.0 book and the associated website in which the model is described, as well as to a version of the IMAGE Strategy document, dated July 2014. Additional information consisted of the review report of IMAGE 2.4 by the previous Advisory Board in 2006 (Hordijk et al. 2007)4 , the report of the recent international scientific
audit of PBL in 2012, and PBL’s responses to that audit.5 During the review meeting concise and
focused presentations of the IMAGE framework and its various components were given by researchers involved in IMAGE studies and a vivid interaction between Board and IMAGE staff took place, leading to a better understanding of the IMAGE model.
The Board drafted the first version of this report during the review meeting in The Hague and presented its preliminary findings to IMAGE staff and PBL management on 11 July 2014.
A definite version of the findings was elaborated during the summer period, and is presented in the subsequent chapters. The material in these chapters covers the issues which were provided by PBL to the AB as potential guidance and focus for the IMAGE evaluation (see chapter 1). Supplementary to this, in Annex 2 the questions are addressed which were posed by the director of the PBL, Prof. Maarten Hajer in his opening address. Responses to these questions are in line with the observations and recommendations presented in subsequent chapters.
4http://www.pbl.nl/en/publications/2007/Reportofthe2006IMAGEAdvisoryBoard
4 General observations and recommendations
In this chapter we present general findings of the AB regarding model documentation,
transparency, methodology, model evaluation and uncertainty analysis, staffing and funding, future strategy and research directions. Where relevant we refer to IMAGE documentation, applications and other sources. Detailed observations and recommendations about the IMAGE framework and its modules follow in the subsequent chapter.
4.1 General impression of book, website and research output
The AB is very impressed by the progress made in recent years, and by the productivity of the IMAGE team as shown by the extensive publication record. Many improvements have been achieved. These include addressing most recommendations from the 2006 review of that year’s AB (Hordijk et al. 2007). Examples include: greatly improved documentation (much more comprehensive than for other Integrated Assessment Models), a focus on one atmospheric module, MAGICC (i.e. abandoning the computationally costly Speedy model), salient (demand-side) improvements to the energy model TIMER, and the inclusion of different new
models/modules: the LPJmL coupled vegetation, agriculture and water resources model, additional impact components, and nutrient soil budgets.
The IMAGE 3.0 book is an excellent, well organized and well written source and documentation for the IMAGE 3.0 framework and its use in assessing key policy issues, such as climate change, air pollution, energy poverty, land-use change, biodiversity loss, and water scarcity.
The accompanying website/wiki offers a novel approach and a comprehensive portal to the various parts of the IMAGE 3.0 framework. It provides the possibility to view and download scenario data of IMAGE runs for a number of projects and allows easy maintenance. The AB highly appreciates this feature of IMAGE as it contributes significantly to accessibility and transparency.
The scientific publications have served to increase the credibility of the IMAGE framework and its modules. The IMAGE team also plays a recognized role in international assessments and major international scientific networks.
Overall, we find that the IMAGE model and its applications are a prime example of innovative use of systems-analytical approaches where a blend of different models are coupled for
integrated and holistic analyses of environmental and societal challenges. The model
applications and resulting publications are of high scientific excellence and policy relevance.
4.2 Transparency
The publicly accessible website/wiki is an important contribution to transparency and enhances the credibility and legitimacy for assessments in which IMAGE plays a role. The website can be used to extend and regularly update all information on the IMAGE framework as it develops – unlike the printed book.
The AB recommends to further enhance transparency of the IMAGE framework by extending the website/wiki to include information on all salient model assumptions, model equations, model parameters, data (that are not intellectual property protected or privacy sensitive) and scenarios involved. In many cases this can be achieved by better crosslinking the wiki to
underlying publications and/or external databases, which host important input assumptions and outputs of the IMAGE model. This should also apply to model(component)s not owned by PBL. The AB recommends to provide more explicit information on linkages and interactions of the model(component)s which are part of the IMAGE framework. It would welcome new flowcharts on the website visualizing which named model(component)s and their linkages are part of IMAGE 3.0, and what parts they cover. In providing this information incomplete couplings and possible redundancies can also be identified and amended where necessary. It seems that models such as PCR-GLOBWB / GLOFRIS run almost independently of the IMAGE core model – hence, it is necessary to develop procedures to clarify what model(component)s qualify as IMAGE model(component)s (‘corporate identity’ of IMAGE to be guaranteed).
At the moment, the IMAGE schematics show sectors or impact areas6. To further enhance transparent illustration the AB recommends also to provide schematics in the wiki on
model(component)s (e.g. LPJmL) spanning several sectors, or on sectors where several models are involved.
The AB notices an increasing demand for open data and open model access. Therefore the AB recommends developing a strategy for dealing with this increasing demand, fitting within legal contexts and also within the contexts of the requirements in international assessment studies (e.g. IPCC, IPBES). Moreover the AB recommends that the IMAGE team thinks about further
ways to enhance scientific credibility through transparency and offering peers the ability to review the model quality.
The AB recommends to explore the possibility to include representatives of the user community in the AB or have separate engagement with current and potential users/clients to identify their needs. It is also advised to consider an increased frequency of AB meetings (e.g. 5 years as opposed to the current 8-yr interval). The AB also requests PBL to provide written feed-back on the reports of the AB in which it inter alia informs in what way it will deal with the comments made by the AB.
4.3 Methodological aspects
This section highlights several methodological aspects related to the IMAGE framework as a whole. Methodological observations and recommendations at the level of model(component)s can be found in the following chapter.
IMAGE model(component)s show a large variation of application ranges. Joint use of these model(component)s (e.g. in long-term scenario analyses) causes the risk that IMAGE as a whole operates outside its tested ‘safe operating space’ (see also the comments on the time horizon used in the applications of the agro-economic model MAGNET in the subsequent section 5.1). Given that some model(component)s of the IMAGE framework are being developed outside the core IMAGE team, it is of great importance to establish a quality assurance protocol for
model(component)s that are the responsibility of partners both within PBL and outside. The AB recommends that the IMAGE team identifies and prioritizes the major missing links amongst model(component)s and decides how to deal with this (e.g. by including some additional links/feedback). Special attention is needed for feedbacks between the Human and the Earth systems which are currently limited in number.
The linkages between and the combined use of IMAGE, MAGNET, LPJmL, the forestry model and the livestock model in the analysis of agriculture, land use and biofuels deserve special
attention, explicitly addressing the competition for land between agriculture and forestry. The AB observes that some aspects appear more than once in different parts of the IMAGE framework. Examples include hydrology in the LPJmL model, in the nutrient subsystem and in the floods model. It is important that common components, for instance hydrology and land use, are treated in a consistent way across all IMAGE modules involved.
For future international policy making it would be advisable to restructure the 26 regions of IMAGE so that major countries and political units/unions are represented. The AB therefore recommends that the regions currently used in IMAGE be reviewed and potentially re-aligned to match current political regions and therefore ensure IMAGE’s continued policy relevance. While further disaggregation into more regions is not recommended, addressing some of the model development challenges might require an increase of the resolution to better represent salient heterogeneities (e.g. consumer groups with different characteristics, rural/urban, energy and income distributions).
4.4 Model evaluation and uncertainty
The AB observes that while the IMAGE team has done structured uncertainty analyses, in the IMAGE 3.0 book uncertainties are often only partially and qualitatively discussed. Moreover, validation of the outcomes or specific ranges of the results (as given e.g. by model parameter uncertainties) are not shown. Therefore, the AB recommends a number of future activities on model evaluation/validation and uncertainty analysis, and their documentation. This will enhance the IMAGE model’s capability for providing robust policy advice:
• There is a need for further model validation and/or evaluation at the model component level (e.g. LPJmL), going beyond comparing IMAGE results with other models as in the AgMIP and ISI-MIP intercomparison projects, and comparing/‘validating’ with empirical data and/or with projects that follow a more local approach (e.g. www.yieldgap.org ). Seminal work in this area using the IMAGE energy model TIMER in the past includes e.g. validation experiments by historical hindcasts of the transport sector (van Ruijven et al, 2010). Similar work could be extended to other sectors or components of IMAGE. • In addition, a continued effort to validate the entire, coupled model (rather than
individual components) in a benchmark study is desirable, possibly with a pioneer IAM intercomparison focused on major cross-sectoral features (probably to be coordinated with the Integrated Assessment Modelling Consortium, IAMC). This work could build upon already ongoing initiatives in a number of European projects where IMAGE is involved in a leading role (e.g., FP7 projects AMPERE and ADVANCE). Such work will highlight the internationally unique status of IMAGE and at the same time show why several IAMs are needed.
• Hence, the AB recommends that the involvement of the IMAGE team in the IAMC model validation/evaluation activities will be continued. The AB recommends further
historical spin-up of IMAGE from the 1970s, the IMAGE framework might be in a unique position to do “hindcasting” experiments or ex-post analyses for model evaluation. • It is important to decide how to characterise the effects of uncertainty in the various
model components, and to systematically assess the contribution of different sources of uncertainty to key IMAGE output metrics. This would give useful information on the magnitude of overall uncertainty, and also help focus efforts to improve model representations. Important examples of structured and formal uncertainty analyses using IMAGE in the past include Van Vuuren et al. (2008) or Van der Sluijs et al. (2002). Similar efforts should be undertaken for more input parameters and using more recent scenarios. Given the many parameters involved and the substantial computational load required for these analyses, the AB recommends to use computationally efficient sensitivity/uncertainty analyses.
• The AB considers uncertainty analysis for each of the impact indicators as critical. It recommends to use a simple measure, e.g. a ‘traffic lights’ categorization, to indicate the degree of uncertainty in the assessment. Also, the sources and references used to
estimate relationships underlying impacts must be made available, so that gaps in knowledge and uncertainties are better understood.In this context AB recommends to explicitly document the evidence base for the dose-response/cause-effect relationships between IMAGE outputs and the impact model(component)s and related impact-indicators. What are the slopes and confidence intervals? How many empirical studies were included? Not only is it necessary to document these relationships (tabulated on the IMAGE 3.0 website), it is also recommended to characterise the uncertainty: the form of the relationships will very likely influence the sensitivity to environmental change (see also section 5.6).
4.5 Staffing, collaboration and funding
The AB finds the decline in permanent funding regrettable – it puts at risk sustained development, maintenance, consistency checks and data storage, especially since several groups within and outside PBL are involved and require coordination. The essential resources for such core activities need to be ensured, possibly also by way of outsourcing model
development to other institutes or companies.
The balance between permanent vs. project/temporary staff has changed considerably in the recent years, which is some reason for concern. The AB thus recommends to increase the number of permanent staff to restore the balance between permanent and temporary staff, and to retain a critical mass for code and data maintenance, continuity in core competence,
overview and expertise, and coordination among model(component)s and collaborators, while also safeguarding core innovation and intellectual leadership.
A major asset given the more limited internal PBL resources is the recent development of PBL staff being also Professors at different universities (e.g. Utrecht University). This is important for PBL on the one hand for scientific networking, but perhaps more importantly, helps to diversify core model development and innovation under leadership of PBL staff at universities and thus benefit from increased inflow of young talent. Given limited resources, this strategy might become more and more important to leverage limited internal PBL resources by access to young talent and thus increase overall research efficiency and output.
The IMAGE framework already has a broad coverage. In order to make IMAGE even more comprehensive PBL could consider to closely collaborate with a research group that provides a global economic model. Existing collaborations with IIASA, PIK and FEEM could then be
extended by including e.g. Cambridge Econometrics and/or other research groups that own relevant economic models. Another option is to strengthen links through formal collaboration agreement between IMAGE, GAINS, and the IIASA Integrated Assessment Modelling Framework (MESSAGE-GLOBIOM). This can facilitate joint developments on land and energy as well as estimating air pollution co-benefits of future scenarios. Also other collaborations, as e.g. in case of the GLOBIO model with UNEP-WCMC, University of British Columbia and UNEP Grid Arendal are important to consolidate for IMAGE.
The AB recommends to establish soon a strategy for the development and maintenance of the entire IMAGE framework including a division of labour between PBL and its collaborators on model(component)s of IMAGE. In this context it also recommends to explore the advantages and disadvantages of making IMAGE a community model, as opposed to the option to locate all software development of the framework at PBL.
4.6 Future strategy
The AB has discussed the IMAGE Strategy Document (version July 2014) that was presented and has the following comments.
Given the decline in permanent funding and given that there were major model developments in the previous phase, the AB recommends a visioning process in the near future. While the AB agrees with many priorities/objectives and model developments described in the current IMAGE Strategy Document, there is the clear need to further improve and clarify the current draft. This would include 1) the consolidation of the present model version (rather than expansion), particularly concerning the land-based modelling tools, and 2) the need to align model development and research more clearly with research foci and user needs.
As part of this visioning process the AB recommends to identify potential (new) users of IMAGE 3.0 (policy-makers, scientists, business sectors and companies), and explore their needs and what IMAGE wants to do/achieve. What are the main questions IMAGE wants to address? What are the unique selling points to differentiate it from other IAMs, i.e. what is IMAGE’s niche? Careful consideration needs to be given when approaching these potential new clients, avoiding consultancy type of work and assuring scientific integrity as the highest priority in defining projects.
The AB recommends to further enhance IMAGE’s potential for analysing nexus problems. The linkages between environmental challenges (impacts and response strategies for simultaneously addressing climate change, air pollution, biodiversity, etc.) and their implications for broader development objectives (e.g. Sustainable Development Goals (SDGs)) are highly policy relevant, and present a good basis for research foci. Furthermore, the AB also recommends to apply multi-objective/multi-criteria approaches to explore critical policy linkages between e.g. food, energy and water, and how these linkages might be affected by climate change. More emphasis on the linkages between these objectives in IMAGE can provide important information for policy making (particularly if trade-offs and synergies are explicitly modelled).
Future improvements and extensions of model(component)s in the IMAGE framework thus need to be done in a balanced and focused way, taking into account what is needed for serving (new) clients/communities and enabling nexus-like studies and integrative policy advice – a traditional strength of the IMAGE team.
The IMAGE leadership needs to align priorities from the strategy document with those
suggested in the individual presentations of the IMAGE framework components during the AB meeting of 9-10 July 2014, which are currently numerous and not prioritised in the light of overall IMAGE goals and limited resources.
An additional point which deserves explicit attention in the future strategy – especially when collaborative efforts in modelling are consolidated or further extended – concerns the generic question when to consider model(component)s which are candidates for coupling with IMAGE as ripe for inclusion. The AB recommends that the IMAGE team establishes a clear strategy for deciding on this. Moreover, also ownership issues (corporate identity, and intellectual property) should be addressed as well as employing a quality assurance protocol for model(component)s that are the responsibility of partners both within PBL and outside.
4.7 Future research directions
As stated in section 4.6, the AB recommends an inclusive visioning process to arrive at an elaborate IMAGE strategy. Regarding future research directions, the AB on the one hand
recognizes the need for consolidation, but on the other hand sees the need for selected model improvements and extensions. The AB recommends that finding a balance between these two requirements shall take into account user needs, PBL staffing and funding.
The AB considers the following research issues to be relevant, but they should only be dealt with if they fit in the overall IMAGE strategy that is to be consolidated.
• Identify which major improvements in both the Human System and Earth system and their interconnections are necessary to better address global problems extending beyond climate change. Options include the food/energy/water nexus and related biodiversity/agro-economic/energy interplay issues and the UN Sustainable
Development Goals (SDGs).
• The future strategy for prioritizing model developments and extensions should carefully balance efforts in the areas of energy and land-use change. The AB also recommends to consider the inclusion of low probability high-impact events, given their potentially major impacts and policy relevance.
• The AB recommends to update the base year from 2005 to a more recent year, e.g. 2010 or 2012, which will possibly require a substantial effort, but which is of importance to keep the assessments up to date.
• Consider a limited restructuring of the regionalisation, so that major countries and political blocs are represented, to better address future international policy making (see section 4.4).
With these improvements and a step change in validation and uncertainty analysis (see section 4.5), it is to be expected that the IMAGE framework will be used more frequently by policy Directorates General (DG) of the European Commission. More work could come from the DGs Climate Action, Research and Innovation, Environment, and Agriculture, especially for nexus questions. Several UN related bodies can be approached more actively to gain clients. In order to enhance the IMAGE model’s capability for macro-economic analysis the already existing collaborations with IIASA, PIK and FEEM could be extended to e.g. Cambridge Econometrics to capture macroeconomic feedbacks.
Global businesses in the energy, agriculture and extractive sectors could be interesting new clients for IMAGE analysis as well. It is to be expected that these sectors would like to see more sectoral detail in the respective IMAGE modules. Consider also to approach the World Business Council for Sustainable Development (WBCSD) for potential clientele.
The AB does currently not see a role for IMAGE for analyses and assessments at city level. This would require a major investment in geographical and process detail of the model, which would only be possible with additional funding or outsourcing of the modelling and data work.
In the light of this potential new clientele and novel application areas the AB recommends to consider the following consequences for the various model(component)s of the IMAGE framework:
a) Consolidation of the land-use modelling frameworks and their linkages is highly recommended, and should include:
1) A clear strategy for setting priorities for critical ‘in-house’ model developments in contrast to expertise that is outsourced (which bears the risk that models are used as ‘black boxes’). Currently core land use and agricultural modelling is within PBL while agro-economy modelling (MAGNET) is outside PBL. This might make the ambition for increasing policy relevance more difficult.
2) The agricultural/land part of IMAGE model has become more and more complex over time with numerous (partially overlapping) model(component)s and linkages that need to be managed. This can pose a barrier for the potential of running fast and being able to respond to changing policy and research demands. It might be useful to devote some resources for the development of simple tools with reduced-form representation
(metamodel) of the more complex models. These tools could be used flexibly and quickly within the framework and help focus development on areas where returns might be biggest (FAIR is a good example in the area of policy decision tools, and MAGICC in the area of climate modelling).
b) Current plans for future developments of the energy model are comprehensive and
consistent with the main objectives in the strategic document that has been circulated. They might be expanded to incorporate more explicit modelling of behavioural change, human preferences, and market dynamics (see section 5.5). This would further help to make results of TIMER yet more policy relevant. Moreover, while further disaggregation into more regions (currently 26) is not recommended (given associated model maintenance needs and the expected marginal returns), the resolution used in TIMER might benefit from a better representation of salient heterogeneities (e.g., consumer groups with different
characteristics, rural/urban energy, income distributions) in order to address future policy questions.
c) Applications of the model should include realistic policy scenarios, such as the
representation of current policies in baselines (e.g. policies that are agreed upon, such as the EU Emission Trading System, energy efficiency measures; renewable energy targets, agricultural and forest policies). They should preferably also include explicit measures to enhance the carbon sink and represent suitable indicators for exploring the SDGs. It is also important to develop visionary scenarios that go beyond current policies and established thinking.
d) Putting water higher on the agenda as a link between human and natural systems and as a major policy domain (as important as energy and land-use policy) is desirable. This will require some further improvements, see section 5.10.
e) The marine realm is not currently represented in IMAGE. It is relevant for some model(component)s, in particular concerning impacts and livestock. It is an important source of food and is subject to important impacts of climate change (ocean acidification). Moreover aquaculture is increasingly competing for land. The AB recommends the IMAGE leadership to consider what features of oceans and water in general will be included in future IMAGE versions.
The extensions and improvements recommended above should all be considered in the light of striking a balance – in content and timing – with consolidation of IMAGE.
5 Specific observations and recommendations
In this chapter we present detailed observations and recommendations about the IMAGE framework and its model(component)s.
5.1 Agro-economy - MAGNET
In the IMAGE framework the agro-economic model MAGNET is used to calculate the future development of the agricultural economy. MAGNET is a computable general equilibrium (CGE) model, connected via a soft link to the core model of IMAGE.
Since this type of models (CGE) is typically designed for 5-10 years time horizon, not for 40-90 years time horizons as used in IMAGE, the AB recommends to clarify why and how MAGNET can still handle the time horizons used in IMAGE.
Moreover in the AgMIP model comparison (Nelson et al. 2014, von Lampe et al. 2014), MAGNET was found to have an intermediate to more extreme position. The AB wonders how this affects the results in the IMAGE framework. This certainly involves a more integrated uncertainty analysis rather than a partial uncertainty analysis of MAGNET.
The specification of technological progress in MAGNET (and virtually all similar models) is not very clear or explicit – see section 5.7 below under the LPJmL model. Moreover, food demand is mainly expressed in calories: can other nutritional requirements be addressed?
A further concern is the limited capacity to address feedback mechanisms of the natural system, and specifying technological progress by using a management factor (cf. IMAGE 3.0 book,
Stehfest et al. 2014, page 59).
MAGNET is part of the IMAGE framework, but developed and maintained outside of PBL. This can increase the total time for the IMAGE framework to address policy questions. It can also be a hindrance to quickly address research demands.
The AB recommends to examine – given the current level of knowledge and the limited
resources available – to what extent and how the representation of agro-economy in IMAGE can be improved to address the above comments.
5.2 Land use allocation
IMAGE appears to use two ways to represent land-use dynamics and to determine the location of new agricultural lands. On the one hand a simple regression-based suitability assessment is applied for determining future land-use patterns. On the other hand a dynamic link is provided
to CLUMondo (Van Asselen and Verburg, 2013), which enables a more detailed representation of land-use systems and their dynamics. CLUMondo can handle heterogeneity of landscapes, and has own endogenous way of deciding about intensification and extensification.
The AB found the current practice to present both CLUMondo and the regression approach in the IMAGE framework confusing, especially given the fact that the approaches give different results (e.g. intensification results of CLUMondo are not consistent with those of MAGNET applying the regression based land-allocation of IMAGE; the dynamics of CLUMondo are not yet trusted). It recommends to consider CLUMondo as development and work in progress and to not yet include it in IMAGE until the IMAGE team is fully satisfied. This reflects also the more generic question raised in section 4.6, on when to include (externally developed)
model(component)s for coupling with IMAGE.
The parameterisation of a regionally differentiated regression model which underlies the land-use allocation in IMAGE is based on the 2005 land-land-use situation and is employed for
determining the future land-use change. The AB asks whether IMAGE appropriately accounts for potential time-dependent changes in these relations or if the uncertainty in these correlations can be captured.
The AB further notices that forestry and agricultural land use appear as separate issues. To allow a more complete trade-off analysis in land-use allocation, as is requested when contributing to e.g. nexus studies on biodiversity, energy and food security, these aspects should be more fully integrated, allowing also an analysis of the competition between agriculture and forestry.
5.3 Livestock
In the livestock model of IMAGE interactions between crop and livestock productions are described and also the consequences of changing practices in livestock farming for production of food crops and grass. For this purpose IMAGE distinguishes pastoral livestock systems and mixed and landless (industrial) production systems.
The AB notes that fisheries, including marine, freshwater, wild and aquaculture, is an important source of food (protein), but apparently gets less attention, especially concerning the amount of fish produced in aquaculture (see section 7.6, page 279 of IMAGE 3.0 book, Stehfest et al. 2014). MAGNET seems to include e.g. only one category for fisheries and does not distinguish between marine and terrestrial/aquaculture catches. Given the fact that aquaculture is increasingly competing for land the AB recommends to consider this issue more explicitly.
Moreover more specific attention to intensification (and extensification) of the agricultural sector, for crops as well as livestock, is recommended, especially highlighting also the
externalities of these processes. For instance, what are the implications of intensifying livestock production (efficiency, manure production, animal welfare issues, etc.)?
The livestock model is only briefly explained in the reference book, more information should be given in the wiki.
5.4 Human systems
In the IMAGE framework, the Global Integrated Sustainability Model (GISMO) quantifies
changes in human development, including access to sanitation, food and energy, and the impact of economic, social and environmental changes. The model also includes the Human
Development Index (HDI), population health measures (e.g. child mortality and life expectancy), and many indicators for the Millennium Development Goals (MDGs).
The AB considers the GISMO model a strategically very important part of IMAGE, enabling the consideration of broader development policy objectives (e.g. SDGs). Many other IAMs are not able to do this to this extent.
However, the AB expresses concerns about the current staffing of GISMO and recommends to reconsider this and the position of GISMO within the IMAGE framework during the visioning process as recommended earlier.
The AB wants to signal a number of issues which deserve further attention:
• In the health-impact discussion the presence of nonlinearities in the dose-response relations and the effects of background situation (saturation effect; indoor/outdoor effect) could play an important role.
• Cultural factors can strongly influence the effectiveness of policy measures. To what extent could this dimension be incorporated in the assessments with GISMO?
• To what extent can one explicitly handle/consider policy-handles/levers in the model? To what extent is one able to take into account information on the local situation, e.g. urban air pollution effects?
• How realistic is the approach for determining the impacts on human well-being, especially if one wants to take into account the social situation and human behaviour? Can the model reliably extrapolate from a few biophysical parameters to human well being, without explicitly considering human behaviour? Are the complexities not too large to make meaningful projections? What are the limits to modelling in this respect?
• What linkages with other themes/impacts would be interesting to address, and how could this be taken into account? Is there a linkage with Ecosystems Goods and Services,
agricultural productivity?
• Estimating of several human development indicators would benefit a lot from accounting for human nutrition rather than calories.
5.5 Energy
The TIMER model is used in the IMAGE framework for the assessment of energy scenarios and the implications of energy system changes for environmental, social and economic objectives. The model has improved considerably over the last years, particularly with respect to
representation of the energy demand sectors, and the representation of distributional issues, such as energy poverty and energy access. Specific recommendations of the AB for future model development and improvements are broadly consistent with the plans presented by the IMAGE strategy document and include:
• Further enhancements of the representation of key mitigation options in energy end-use, particularly focusing on behavioural aspects (this would help to better represent important implementation barriers).
• Improved representation of integrating variable renewable energy into energy supply. • Better representation of energy-related air pollution legislation, going beyond emission
factors, including control costs and the assessment of health benefits.
• Better representation of non-technical factors driving the energy system, such as institutional and governance changes.
• New approaches to assess macro-economic feedbacks of energy system changes. To be sure, it is not recommend here to add another macroeconomic model to the IMAGE framework, but to develop novel approaches that would allow simplified representation of economic feedbacks (which are currently not represented sufficiently).
• More explicit linkages between energy system changes and their implications for competition over land (bioenergy vs. food) and water, including implications of climate change on energy.
5.6 Biodiversity and Ecosystem Goods and Services
The GLOBIO model is used in the IMAGE framework to assess the impact of environmental drivers and potential policy options on biodiversity. As a key measure of biodiversity GLOBIO
uses the mean species abundance (MSA) which expresses the mean abundance of original species relative to their abundance in undisturbed ecosystems, as a reflection of the degree to which an ecosystem is intact. Two additional biodiversity metrics are employed, Wilderness area, and Species Richness Index (SRI).
The AB notices that several issues which were raised in the GLOBIO3 advisory board report 2005/07, need still to be addressed. For example, although some progress has been made, the need to document/publish in peer-reviewed literature still exists. Especially details of SRI and ecosystem services need to be clearer on wording, e.g. the ecosystem service map only captures seven ecosystem services, so one needs to ensure that users understand that only a subset of all services is presented in the map, and the SRI methodology is not documented in sufficient detail.
Furthermore the AB is unclear about the current process for updating GLOBIO3 and
incorporating updated versions within IMAGE, since new data are becoming available, e.g. the BioFRAG project database (Pfeifer et al. 2014) and the PREDICTS project (predicts.org.uk). In addition, the AB thinks that there is a need to clarify or even revise the selected biodiversity indicators:
• The MSA indicator should be revised. The following aspects could be considered (a)
accounting for species-specific/taxon-specific differences, (b) weighting by observed species richness (although a change of MSA in various contexts can be similar, these aspects can work out entirely different in terms of biodiversity; compare e.g. the Amazon with a desert), (c) removing the cap for original species, (d) change to geometric mean.
• The species richness indicator needs to be documented, providing information on how it is produced and what it describes (is it e.g. alpha, beta or gamma diversity)?
Finally as a related and more generic issue (see Section 4.5 on Model evaluation and uncertainty analysis), the AB recommends to document the evidence base for the dose-response/cause-effect relationships between IMAGE outputs and the impact model(component)s and indicators, like GLOBIO and MSA. What are the slopes and confidence intervals? How many empirical studies were included (e.g. for MSA, ecosystem services)? Not only is it necessary to document these relationships (tabulated on the IMAGE 3.0 website), it is also recommended to assess the uncertainty: the form of the relationships will very likely strongly influence the sensitivity to environmental change.
5.7 LPJmL - Crops and grasslands
In IMAGE 3.0 the terrestrial carbon and water cycle, natural vegetation dynamics and crop and grass production are modelled internally consistently with the LPJmL Dynamic Global Vegetation Model. The model is used to determine productivity at grid cell level for natural ecosystems and crops on the basis of plant and crop functional types. Key inputs include climate conditions, soil types and assumed technology/management levels. The model iterates with the agricultural production components as it provides input on potential productivity, while land used for agriculture and forestry is a key input. Changes in land cover, land use and climate at grid cell level have consequences for the carbon cycle, and for crop and grass productivity (see page 42, 43 in Stehfest et al. 2014).
According to the AB there are a number of points that require attention in a further development and integration of LPJmL in the IMAGE framework.
• It is very important to ensure that the integration of the environmental system and the socio-economic system works. Therefore, LPJmL should communicate with other models such as the nutrients model7 and MAGNET, and the sequence of calculating cropland expansion vs. intensification should be clarified.
• According to the AB the carbon balance studies would greatly benefit from using the latest LPJmL version with permafrost and a new hydrology scheme. Also ensure that LPJmL vs. 4 (to be released in 2015 at PIK) will be implemented.
• Moreover, interaction of LPJmL and the nutrient model is desirable to improve integrated modelling of the carbon cycle, the water cycle and plant growth. It is advised to also improve feedback (at least via CO2) from dynamically changing natural ecosystems to the climate.
• The specification of the technological progress could be improved. Page 155 of the IMAGE 3.0 book states that yields can increase as a result of four processes. However, the first two processes (technical change/intensification) are not very explicit and the AB finds them confusing. According to the AB yields per hectare can increase from an agronomic point of view along two pathways:
o Narrowing the yield gap, that is the difference between the actual and potential yield, by increasing actual yields through improved management (generally described as intensification) combined with some breeding focused on tolerance/resistance to stress or pests and diseases.
o Increasing yield potential, e.g. through breeding.
7 On page 184 in Stehfest et al. 2014 it is stated that a limitation of the LPJmL model is that as yet it does not
include nutrients, although nitrogen is assumed to modify the reaction of crops and natural vegetation to elevated CO2 concentration levels and climate change.
• The AB recommends to model technological progress and intensification more explicitly along these lines, such that it can benefit from agronomic insights. Both pathways for yield improvement have been studied and empirical material is available.
• Multiple cropping per year is accounted for via a cropping intensity factor. Does this capture differences between seasons? Usually the dry and wet season have different productivity. • How valid are global gridded crop model simulations? Rosenzweig et al. (2014) compared a
range of these models and the differences between the model results are very significant. At continental level the trends will probably be right, but at a more detailed regional level this is most probably not the case. The AB recommends evaluating models like LPJmL with some ‘ground truthing’. This is feasible through linking up with more location specific approaches that are available.
• LPJmL does not yet capture consequences of soil degradation, i.e. loss of nutrients and soil organic matter. This could be improved by links with other model(component)s in IMAGE (if not already done so).
• Finally the AB asks, with an eye on supporting the evaluation of the effectiveness of
different policy responses, whether IMAGE can benefit from incorporating more mechanistic representations of adaptations to climate change. For example, consider adaptation by changing cropping schemes on basis of process-based mechanistic modelling (GLAM-model;
cf. http://www.see.leeds.ac.uk/research/icas/climate-impacts-group/research/glam/ and
Challinor et al. (2009), instead of yield factor manipulation).
5.8 GLOFRIS
GLOFRIS estimates the effect of land cover and climate change on global flood risks in river catchments and coastal areas. The model seems to be very complicated, and requires many very highly localised data and therefore high-resolution assumptions. It does not seem to link with IMAGE 3.0 very well (it does e.g. not use the climate information on the same aggregation level as IMAGE; it uses the IMAGE socio-economics providing information on a 0.5x0.5 degree scale which is then downscaled still further to 1x1 km), and takes a long time to run. The AB
recommends to consider using a much simpler, but more generalised representation of flood risk, perhaps using LPJmL to ensure water balance consistency.
5.9 Nutrients
To assess eutrophication as a consequence of increasing population, economic and