REGIONAL
QUALITY OF LIVING
IN EUROPE
PBL report 1271
Contents
ABSTRACT
4
SAMENVATTING
5
1
INTRODUCTION
7
2
METHODS
8
2.1 Theory 82.2 Concept for composition of the Regional Quality of Living Index (RQI) 10
2.2.1 Index based on 9 categories and 25 indicators 10
2.2.2 NUTS2 regions as level of analysis 10
2.2.3 Weighting factors 11
2.3 Data calculation methods 11
3
RESULTS
14
3.1 Maps and information for 9 RQI categories 14
3.2 Regional Quality of Living Index for European regions 19
3.2.1 Ranking of European regions for RQI 19
3.2.2 Regional differences in the Quality of Living in European countries 22 3.2.3 Correlation of the RQI index with regional characteristics 22 3.3 Comparison of Dutch regions with a benchmark for the best regions in Europe 24 3.3.1 Indicators that can be influenced by policy measures 26
4
CONCLUSIONS
28
5
RECOMMENDATIONS
30
6
REFERENCES
31
7
APPENDIX
33
7.1 RQI indicators; databases, maps and sub-indicators 33
7.2 Methods of data calculation (more details) 50
7.2.1 Distance decay method 50
7.2.2 Merging national data and perception data 51
7.2.3 Robustness analysis 52
7.3 Dutch regions vs. Best in Europe; 25 indicators 54
Regional Quality of Living in Europe
ABSTRACT
This report sets out the conceptual framework and results of the Regional Quality of Living. As part of this project, a Regional Quality of Living Index (RQI) was developed for
benchmarking European regions. This RQI for non-business-related indicators may help to improve the attractiveness of regions, thus attracting people or companies to settle in those regions. Data from reliable sources were collected and aggregated to NUTS2 level to match data from other studies on European regions. Finally, 25 indicators in 9 categories were calculated to determine the RQI score and ranking of European NUTS2 regions.
The highest RQI scores were found for regions in Switzerland, Sweden, Norway and the Netherlands. A wide divergence in regional scores could be observed for some countries, such as Italy and Spain, with more southerly regions ranking lower than those in the north. Another conclusion is that the regions where the capital city was found offered a better Quality of Living. Exceptions to this were seen in Germany, Belgium and Rumania.
A benchmark comparison of Dutch regions and the average scores of the best 25 European regions (Best in Europe; in terms of GDP per capita) revealed the strengths and weaknesses of Dutch regions with regard to the Quality of Living. Most of the Dutch regions have
remarkably better scores than the Best in Europe for Public services, Recreation and Education and similar scores for Social environment, Health and, Purchasing power and employment. The scores for Housing and Natural Environment for almost all Dutch regions were lower than for the Best in Europe.
The northern Dutch regions compared with the Randstad regions showed better scores for Governance, Social environment and Housing but worse scores for Education, Recreation and Public services.
The RQI can be used to benchmark the Quality of Living in European regions, and could play a role in achieving Dutch policy ambitions to elevate Dutch regions to the top 10 most competitive economic regions in the world.
SAMENVATTING
Dit rapport beschrijft het conceptuele kader en de resultaten van het project Regional Quality of Living in Europe. Als onderdeel van dit project, is een Regionale Quality of Living Index (RQI) ontwikkeld. Deze index die is samengesteld uit niet-bedrijfs-gerelateerde indicatoren kan een bijdrage leveren aan het verbeteren van de aantrekkelijkheid van regio’s als vestigingsplaats voor mensen en bedrijven.
Gegevens uit betrouwbare bronnen werden verzameld en samengevoegd tot NUTS 2 ofwel provincie-niveau om aan te kunnen sluiten op andere studies over de Europese regio's. Met behulp van 25 indicatoren in 9 categorieën werden scores berekend voor de Europese NUTS 2 regio’s om een ranking te kunnen bepalen en om sterke en zwakke punten van regio’s te identificeren.
De hoogste RQI scores werden gevonden voor regio's in Zwitserland, Zweden, Noorwegen en Nederland. Grote verschillen in regionale scores binnen landen konden worden
waargenomen voor onder meer Italië en Spanje, met lagere scores voor de zuidelijke regio’s vergeleken met het noorden. Een andere conclusie is dat de Quality of Living in regio’s met een hoofdstad beter scoort. Uitzonderingen op deze werden gezien in Duitsland, België en Roemenië.
Een vergelijking van Nederlandse regio's en de gemiddelde scores van de beste 25 Europese regio's (Best in Europa, in termen van het BBP per hoofd van de bevolking) geeft inzicht in de sterke en zwakke punten van de Nederlandse regio's met betrekking tot Quality of Living. De Nederlandse regio’s scoren beter dan Best in Europa voor Publieke voorzieningen,
Recreatie en Onderwijs en hebben vergelijkbare scores voor de Sociale omgeving, Governance, Gezondheid en Koopkracht en werkgelegenheid. De scores voor Wonen en Natuurlijke omgeving waren voor bijna alle Nederlandse regio's lager dan bij de benchmark Best in Europa. De Noordelijke provincies lieten vergeleken met de Randstad regio's betere scores zien voor Governance, Sociale omgeving en Wonen maar scoorden slechter voor Onderwijs, Recreatie en Publieke voorzieningen.
De RQI kan een bijdrage leveren aan het realiseren van de Nederlandse beleidsambitie om Nederlandse regio's te laten stijgen tot de top 10 van meest concurrerende economische regio's in de wereld.
Regional Quality of Living in Europe
Credits
PBL report 1271 – Regional Quality of Living in Europe
With additional contributions by:
Hans Visser (statistic advice), Marnix Breedijk (maps), Otto Raspe (advice), Annemieke Righart (editing)
The draft of this report was reviewed by:
Peter Janssen (PBL), Jeroen Boelhouwer (SCP), and Lewis Dijkstra (EC, Regional and urban Policy)
Participants at the internal and external workshops:
Internal participants (PBL, Netherlands Environmental Assessment Agency) : Olav-Jan van Gerwen, Anet Weterings, Mark Thissen, Jan Ritsema van Eck, Martijn van de Berge, Leendert van Bree, Ries van der Wouden, Henk Hilderink, David Evers, Frank van Rijn, Johan van der Schuit, Hans Visser, Rienk Kuiper (chair), Piet Lagas
External participants: Douwe Jan Harms (IenM), Gijsbert Borgman (IenM), Ellen Driessen (IenM), Nils Klopper (Province of Noord-Holland), Mirjan Bouwman (RLI), Anja Steenbekkers (SCP).
This study is part of the PBL Project: Monitor Infrastructuur en Ruimte (no. M500303, project leader: Rienk Kuiper)
1 INTRODUCTION
The Dutch policy document on infrastructure and spatial planning (SVIR; IenM 212a) sets out the Netherlands’ ambition to be among the top 10 most competitive economies in the world. High standards for the business climate for internationally operating companies are important. SVIR emphasises the importance of powerful regions with a good 'Quality of Living'’, optimum accessibility and good connections to the rest of Europe and the world. In 2012, the realisation of these objectives was evaluated by PBL Netherlands Environmental Assessment Agency (Kuiper and Van der Schuit, 2012).
Results from several studies have been published about the attractiveness of the Dutch regions to companies in terms of the economic environment (Raspe et al., 2010; Weterings et al., 2011). The Regional Competitiveness Index (Dijkstra et al., 2011; Annoni and Dijkstra, 2013) shows the competitiveness of European regions. These studies mainly took economic factors into account, without including the characteristics of a good Quality of Living for residents and employees. Although economic factors are important in relation to the attractiveness of regions to companies, the quality of the living environment also plays a role and therefore deserves attention. The Quality of Living, currently is not being measured systematically.
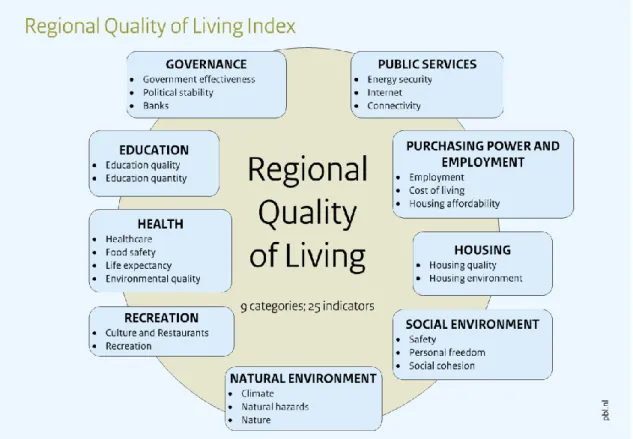
The Regional Quality of Living Index (RQI) aims to fill this gap with a set of 25 indicators in 9 categories. The RQI provides an international benchmark of non-business-related indicators that are important to living standards and the quality of the human environment. The results can be used for other purposes, too. For example, to improve the attractiveness of specific regions to students, or in the context of population decline.
Besides the economic arguments, foreign investors will have more reasons for starting a business in the Netherlands. According to a recently published survey (Barometer Nederlands vestigingsklimaat; EY, 2013) in which foreign investors were asked about the most important non-economic factors that make the Netherlands an attractive place to do business, the factors most highly rated were: Quality of Life (86% answered that this factor makes The Netherlands moderately or very attractive) along with Internet (telecoms) (81%), Stable Political Environment (78%) and Connectivity (71%). It is important that the Netherlands maintains or improves on the scores for these Quality of Living factors.
Regional Quality of Living in Europe
2 METHODS
2.1 Theory
A review of the scientific literature on the Quality of Living leads to the conclusion that, at present, there is no consensus on either the definition of the concept or specification of the underlying dimensions (Morais et al., 2011; Van Kamp et al., 2003). Several terms and definitions have been presented in the literature for concepts such as Quality of Living, quality of life, liveability, and standards of living. Quality of Living, as a concept, is attracting growing interest in the scientific literature. The subject has been picked up from different points of view by various institutes and researchers.
Regional Quality of Living (life) in the European Commission
In the European Union this topic has gained more attention as it has become an essential element in the development of cities and regions. A European Parliament resolution (2005) on regional expansion indicates that these places are not only locations where problems are concentrated, but also where the future lies.
In 2008 the Commission on the Measurement of Economic Performance and Social Progress (CMEPSP) was created at the instigation of President Sarkozy of France because he was dissatisfied with the current level of statistical information about the state of the economy and society. The Commission’s aim was to identify the limits of GDP as an indicator of economic performance and social progress. It was suggested that more attention should be given to Quality of Life as well as Sustainable Development and the Environment (Stiglitz, et al., 2009). Eurostat recently published new Quality of Life indicators for various countries in Europe (Eurostat, 2014).
Internationally, there are several indices that reflect Quality of Living or liveability. Several institutes or companies have considered this concept from various angles and at different levels of aggregation.
The Mercer Quality of Living index (Mercer, 2010) and the Liveability index (EIU, 2012a) have been used for determining the amount of compensation awarded to workers who temporarily have had to accept a lower standard of living. These indices are intended for people working for companies in foreign countries. Other indices (International Living, 2012; Numbeo, 2012) focus on holiday or retirement situations. However there is no benchmark for European regions based on the Quality of Living compiled from public data.
Another difference between indices is the level of analysis. Some international indices have been published with a benchmark for countries (International Living, 2012; OECD Better Life Index, 2012; EIU, 2012a). Country data, however, are not generally representative of regions because of the inhomogeneity of countries. City indices are published by a number of institutions, such as in the Quality of Living Index (Mercer, 2010), the Economist Intelligence Unit’s Liveability Index (EIU, 2012) and Monocle's Most Liveable Cities index (Monocle, 2012).
Table 1 Index categories used by Morais, Mercer, Liveability Index, OECD Better Life Index and International Living.
Index Morais et al. (2011) Mercer Quality of Living Index (2010) * categories only used by Mercer Liveability Index of the Economist Intelligence Unit (2012a) ; 5 categories and 23 indicators OECD
Better Life Index
International Living (2010)
Aggregation level
regions countries countries countries Factors/ categories Political and social environment Economic environment Socio cultural environment * Health issues Schools and education Public services and transport Consumer goods * Recreation Housing Natural environment Stability Health care Culture & environment Education Infrastructure Housing Income Jobs Community Education environment Civic engagement Health Life satisfaction Safety Work–life balance Cost of living Culture and leisure Economic environment Freedom Health Infrastructure Safety and risk
Several categories have been chosen to characterise Quality of Living or liveability (Table 1). The study by Morais et al. grouped the indicators into eight categories, similar to those used in the Mercer index. Mercer’s categories socio-cultural environment and consumer goods were not included in the study of Morais et al. because they are not sufficiently differentiated for Europe. The EIU Liveability Index has 23 indicators in 5 categories.
Quality of Living vs quality of life
Quality of life is specific to people
Quality of Living should not be confused with quality of life which is a broadly used term (Investipedia, 2011). Quality of life is about a person’s emotional state and personal life. As Veenhoven (1996) stated: 'Quality of life is happy life expectancy = product score of life expectancy (in years) and the mean ‘happiness’. Many studies have been carried out on people’s life situation. The ‘Life Situation Index’ in
Regional Quality of Living in Europe
2.2 Concept for composition of the Regional Quality of
Living Index (RQI)
2.2.1 Index based on 9 categories and 25 indicators
The approach to Quality of Living of Mercer (2010) and Morais et al. (2011) was to some extent applied in this study. This means that indicators and categories were chosen which are important for people individually or people with their families related to foreign companies when they want to settle in a specific region, either for some time or permanently.
Some indicators in the Mercer index were changed or omitted because they were not
relevant for benchmarking European regions (e.g. ‘infectious diseases’ and ‘troublesome and destructive animals and insects’ in the category Health Care). For the same reason, we left out the Consumer Goods category because consumer goods can be bought in all European regions. In the Economic Environment category, we added Employment, Cost of Living and Housing Affordability and introduced the heading Purchasing power and employment to emphasise this. In the category Housing, factors such as furniture and maintenance services were omitted and replaced by Housing environment.
After collecting data from several databases (Appendix 7.2) and selecting relevant sub-indicators, we subsequently selected 25 sub-indicators, representing people's Quality of Living (Figure 1). Most indicators were calculated as averages of several sub-indicators (Appendix 7.2). The indicators focus on the quality, availability and affordability of certain services. Some statistical methods were then applied to create a database for NUTS2 regions. The condition applying to the data was that these should be publicly available from recognised institutes, such as Eurostat, World Bank and OECD.
2.2.2 NUTS2 regions as level of analysis
International comparisons can be made for NUTS0 regions (countries), NUTS1 regions (certain parts of countries), NUTS2 regions (provinces), NUTS3 regions (city regions) or metropolitan areas (cities and their surrounding countryside, as well as smaller cities). The disadvantage of data at national level is that these data are not representative of important regions within a country, as some countries are very heterogeneous. Italy, for example, where there is a wide divergence between the less developed south and the more developed north. The same applies to Turkey, Flemish and Walloon Belgium, former East and West Germany, and the southern and northern parts of Sweden, Finland and Norway.
According to Daniel Hyslop (personal communication, 2013), metropolitan regions would be the preferred choice but there are insufficient data available on these types of regions. NUTS3 regions (cities) are too small because, although the built environment is important, these regions do not include the categories for outdoor activities.
Therefore, data were collected for the European NUTS2 regions (NUTS2 codes 2010), as was done for research carried out on Dutch top sectors and their European competitors (Raspe et al., 2012). This is consistent with the approach adopted for the EU Regional Competitiveness Index (Dijkstra et al., 2011, and Morais et al., 2011). Europe has 316 NUTS2 regions, with 270 of these in the EU27 and 46 in Turkey, Switzerland, Croatia, Liechtenstein and
Figure 1 Indicators in the Regional Quality of Living Index, representing Governance and the Socioeconomic and Physical Environment.
Although our results on the Quality of Living mostly was based on objective data, we also used subjective data when objective regional data were unavailable. We took advantage of data acquired for a large, EC-funded project on measuring the Quality of Governance in the EU (DG Regional Policy, 2010). This involved a survey of approximately 34,000 EU citizens from 172 NUTS1 and NUTS2 regions in 18 EU member states based on survey questions concerning people’s perceptions of the Quality of Governance. Data from the European Perception Survey (Eurostat, 2010) were also used.
2.2.3 Weighting factors
Weighting factors generally depend on the objective of the index in question. Indicators are often equally weighted in the literature. Category scores and the RQI were calculated using the 'equal weighting' method. The results of a robustness analysis with different weighting schemes are given in Section 2.3
Regional Quality of Living in Europe
Figure 2 Diagram of the process of creating the Regional Quality of Living Index
Assumptions with regard to extrapolation of city data
City data from several databases (EEA - 500 cities; Urban Audit - 418 key cites; Perception Survey – 75 cities) were used for the calculation of the regional indicators. We assumed that most of the people living in a particular region live in the largest cities in that region. When a region contained two or more cities a population weighted average value was calculated and considered as representative for the region. For regions were no data were available, the average value of the NUTS1 level (or NUTS0) was sometimes used when – on the basis of expert judgement – it was assumed that this would be acceptable.
Calculation of indicators and sub-indicators
As shown in Appendix 7.2, most of the indicators were calculated with at least 2 and up to 7 sub-indicators. All indicators and sub-indicators were scored using the Max–Min method (Box 1). The score was normalised/scaled on the basis of the minimum and maximum score, resulting in a scoring from 1 to 10. For all indicators, a score of 10 represents the best and 1 the worst. Equation 2 was applied when a high negative value was scored for Quality of Living.
Disclaimer: Consequently a low index/category/indicator score does not automatically mean that the situation is bad or unacceptable, because only relative scores were calculated. Similarly, a high score does not mean that it is good or acceptable.
In some situations, outliers were responsible for very high or very low average values of the data set or a skewed distribution. When the average of the scaled data was lower than 4 or higher than 7, winsorisation of the data was applied by taking the 95 percentile value as the maximum and/or the 5 percentile value as the minimum (Nardo and Saisana, 2008). When data were unreliable or unexplainable ‘no data’ (nd) were used. Expert judgement was applied to decide whether data were acceptable or not. For example, nd was entered for the Spanish, Portuguese and French islands off the European continent and for some data sets for Iceland and non-EU countries, such as Turkey, Switzerland, Norway, Croatia,
Box 1 Equation used to determine score of categories and indicators
Equation 1 –
Equation 2 –
Value Y = score between 1 and 10 for a sub-indicator, indicator, category or RQI where 10 is the best score
X = value original data set
Min = minimum value original data set Max = maximum value original data set
Merging national data and perception data
When objective data only were available at national scale and subjective perception data were available on the regional scale, we used these data for regional differentiation. The national average of the perception data of the different regions inside a country was
calculated. The deviation of this national average for a region was used to calculate regional values for the ‘objective’ national scale data. (See Appendix 7.2.2 Merging national data and perception data).
Distance decay method
A log-logistic ‘distance decay method’ (Appendix 7.2.1) was used for neighbourhood effects. For example, to which degree regions benefit when a nearby region has a university (see also Iacono et al., 2008). A matrix was developed for this purpose, containing the distances between all NUTS2 regions. See also Appendix 7.2.1: Regional potential score calculated with Distance decay function.
Robustness analysis
Calculations to determine the sensitivity of different weighting factors were carried out by applying the Ordered Weighted Averaging Method (Yager, 1996). This resulted in a high value for RQI (RQI OWA max) when the best scoring categories are given high weighting
factors and low for the worst scoring categories; for this situation the focus is given to the best characteristics of a region. The RQI low value (RQI OWA min) was calculated by applying
highest weighting to the lowest scoring categories (Appendix 7.2.3, Equation 4). It was concluded that the weighting factors have little influence on the results because the
difference in results between the two methods of weighting were relative small. The method and the results are described in Appendix 7.2.3 Robustness analysis.
Regional Quality of Living in Europe
3 RESULTS
3.1 Maps and information for 9 RQI categories
The maps of Europe for the 9 RQI categories are presented here. The legend of the maps shows values ranging from 1 to 10, where 10 is the highest score and 1, the lowest. The scores for these categories were calculated after averaging 2, 3 or 4 indicators in these categories.
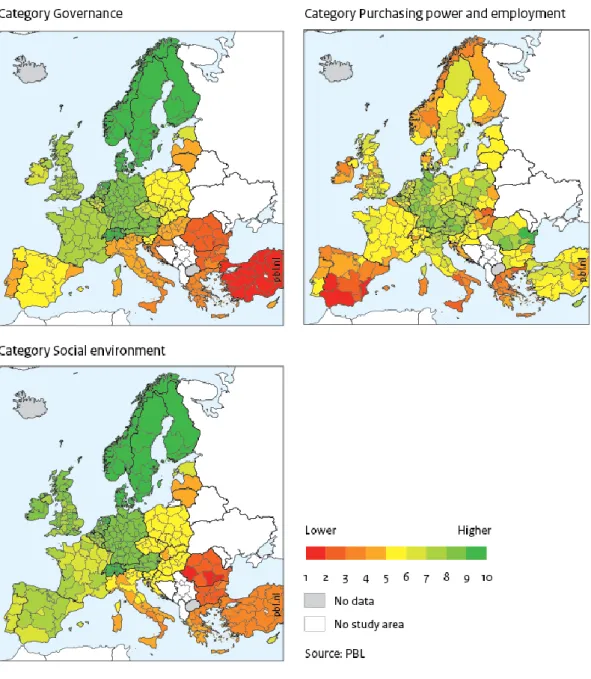
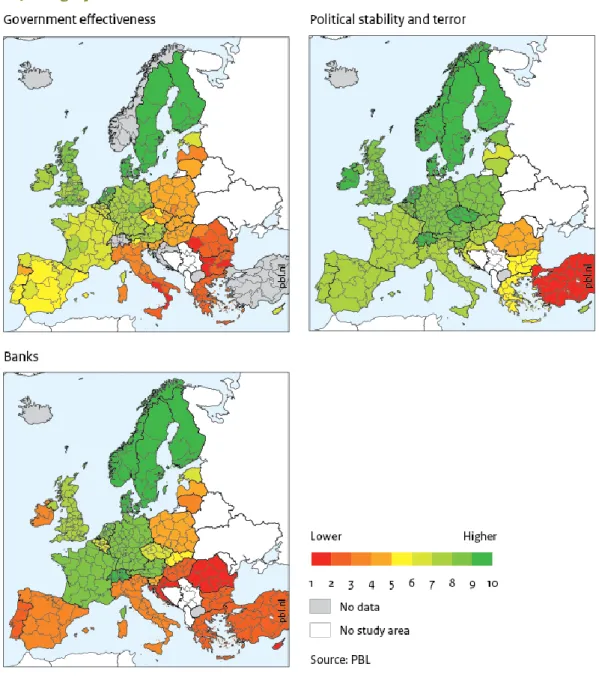
Figure 3 Maps of Europe for RQI categories Governance, Purchasing power and
RQI 1. Governance
Governance is an important factor for people when deciding to settle in a region. This was taken into account in all ‘Quality of Living’ indices. The category Governance was calculated with the indicators RQI 1.1 Government Effectiveness, RQI 1.2 Political Stability and Terror and RQI 1.3 Banks. Governance data were derived from the World Bank (World Governance Indicators, 2012), a recent study on regional variation in quality of government within the EU (DG Regional Policy, 2010) and from the World Bank (2012). Data on corruption were also taken into account, as well as EU regional statistics and perception data from the EU Urban Audit (Perception Survey, Eurostat, 2010). Data from the Global Peace Index were used (Vision of Humanity, 2012) for Political Stability and Terror. The scores for Banks resulted from a benchmark using OECD data on the soundness of banks taken from Sustainable Governance Indicators (OECD, 2011) and the Standard and Poor’s credit rating per country. The northern countries of Europe showed the highest scores. The lowest scores were found in south-east Europe, including southern Italy.
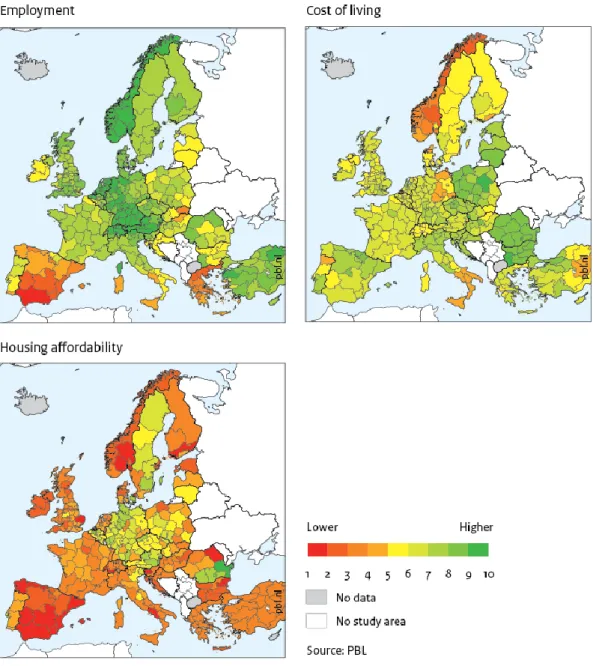
RQI 2. Purchasing power and employment
Only non-business-related data important to people's Quality of Living were taken into account for each region. These indicators were used for several indices that rank the Quality of Living. The category RQI 2 Purchasing power and employment is the result of the average of three indicators: RQI 2.1 Housing Affordability, RQI 2.2 Employment and RQI 2.3 Cost of Living. For the RQI 2.2 Employment data for unemployment of people aged from 15 to 24, and 20 to 65, were derived from Eurostat's regional labour market statistics. Price level indices with a correction for income per capita were used for the RQI 2.3 Cost of Living. The indicator RQI 2.1 Housing Affordability refers to the property price per square metre, divided by income per capita. The highest scores were found in the centre of Europe with low values in Greece and Turkey, as well as the southern regions of Spain and Italy as a consequence of the poor economic situation in those areas.
RQI 3. Social environment
When people decide whether or not they intend to settle in a certain region, Freedom, Safety in the personal environment and Social cohesion are important factors, representing the Social environment. RQI 3.1 Safety was calculated with the indicators RQI 3.1 Safety, RQI 3.2 Personal freedom and RQI 3.3 Social cohesion. Data for Safety were obtained from DG Regional Policy research (Charron et al., 2012) and the EU perception survey. The indicator RQI 3.2 Personal freedom was constructed with country data from Sustainable Governance Indicators (OECD, 2012) with a regional correction. Regional data on Voice and
Accountability were derived from a recent study on regional variation in the quality of government in EU member states (DG Regional Policy, 2010). The data for Social cohesion were derived from the European Social Survey (ESS, 2014) and Eurofound (2014). The northern countries show high scores, with good scores also for central Europe.
Regional Quality of Living in Europe
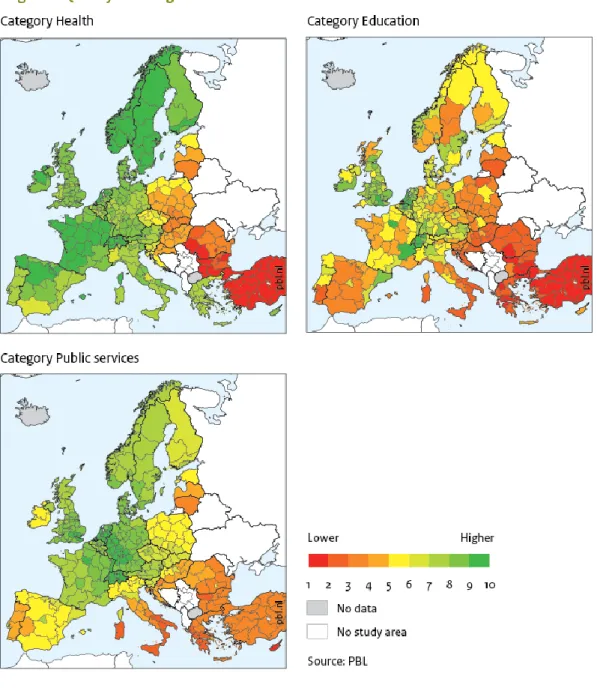
Figure 4 Maps of Europe for the RQI categories Health, Education and Public
services.
RQI 4. Health
The category Health was calculated with four indicators. RQI 4.1 Healthcare represents the average of 7 sub-indicators of qualitative and quantitative aspects of healthcare. RQI 4.3 Life Expectancy includes life expectancy at birth and at the age of 65, and healthy years at the age of 50. RQI 4.4 Environmental quality was focussed on health effects as a consequence of environmental pollution. Objective data on air quality (particulate matter and ozone) and noise, as well as perception data were used for calculation of the score for Environmental quality. Most of these data were derived from the urban audit data ‘Key Cities’, a database on 416 cities (Eurostat, 2012) and European Environmental Agency (EEA, 2009). RQI 4.2 Food Quality and Safety is a country indicator that was derived from the Global Food Security
Index (EIU, 2012b). The map shows gradients from east to west and from south to north because there is a fairly strong correlation between health and GDP.
RQI 5. Education
Education is an important settlement factor for both companies and potential residents. The qualitative aspects (RQI 5.1) as well as the quantitative aspects (RQI 5.2) were considered. Quality standards and education opportunities (including higher education) are among the factors that people take into account when choosing to settle in a specific region. The data used for the indicator RQI 5.1 Education quality were derived from PISA (2012), university rankings and the EU Urban Audit (perception surveys). The ‘Distance decay method’ was applied for the indicator RQI 5.2 Education quantity. Regions near to those with universities benefit from this. The best scores were found in regions with a high population density, universities and foreign schools, as well as a positive correlation with regional GDP.
RQI 6. Public services
Public services are important to potential residents when deciding where to settle. This category includes information from the indicator RQI 6.1 Energy security, RQI 6.2 Internet and RQI 6.3 Connectivity. Data for Energy security were derived from the World Economic Forum where the use of renewable energy sources produces high scores. The data used for the RQI 6.2 Internet (availability and quality) indicator were derived from the EU Urban Audit. The indicator RQI 6.3 Connectivity refers to potential accessibility of the region by road, rail, and air (ESPON, 2011). In terms of connectivity inside the region, only data from the EU perception surveys (Eurostat, 2010) were available. The map shows high values for the central European regions with the highest population and GDP.
Regional Quality of Living in Europe
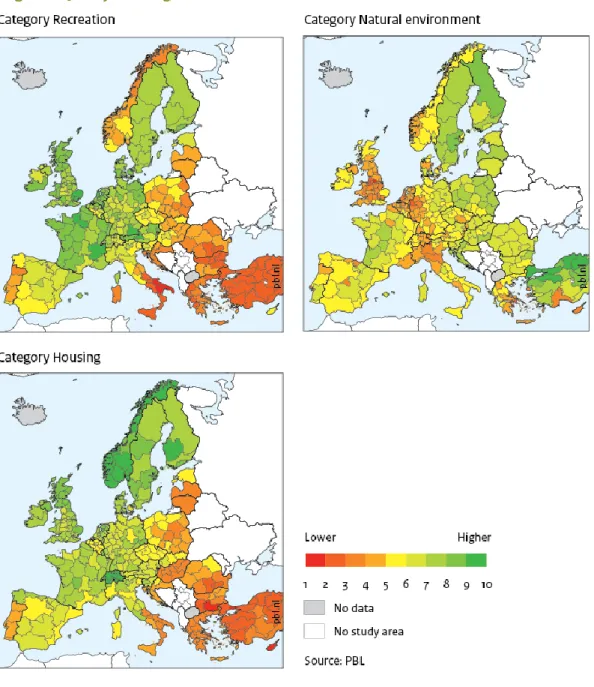
Figure 5 Maps of Europe for the RQI categories Recreation, Natural Environment and Housing.
RQI 7. Recreation
The presence of restaurants or cultural possibilities and recreational opportunities are factors that also determine the quality of the living environment. This category was calculated with data from the indicators RQI 7.1 Culture and Restaurants and RQI 7.2 Recreation
possibilities. Regions near those with high ranking restaurants (e.g. with Michelin stars) benefit from this factor based on the Distance decay method. RQI 7.2 Recreation was calculated with data from Urban Audit – Key cities, LUCAS and the Perception survey. The highest values for Recreation were found in countries and regions with relative high GDP.
RQI 8. Natural environment
Although the natural environment and in particular climate cannot directly be influenced by policy measures, it is a factor that is taken into account when people choose to settle in a certain region. Three indicators were used for this: RQI 8.1 Climate, RQI 8.2 Natural hazards and RQI 8.3 Nature. Climate data on temperature and precipitation were taken from the EU Urban Audit. Regions with medium temperatures and precipitation levels generally scored best, as high and low levels are not comfortable to most people (KNMI, 2013). The indicator RQI 8.2 Natural hazards refers to the aggregated exposure potential for 11 Natural hazards, including floods, forest fires, droughts, earthquakes and tropical storms. The regions’ integrated sensitivity and response capacity (ESPON, 2013) were also taken into account for this indicator. RQI 8.3 included Land Use (LUCAS-Eurostat, 2009) and biodiversity data. The map shows the reverse to the other categories as a consequence of high scores for regions with low risks for Natural hazards, a good climate and plenty of space for nature. These regions are mostly characterised by a low population density and a relatively low GDP.
RQI 9. Housing
Housing covers RQI 9.1 Housing quality which refers to the quality of both privately owned and rented housing and RQI 9.2 Housing environment which is made up of several sub-indicators, such as the amount of green space and green/blue urban areas, as well as data from the EU perception survey (Eurostat, 2010) with respect to satisfaction with the Housing environment, such as public spaces and greenery. The map shows a gradient from south to north, and from east to west further to a correlation between regional GDP.
3.2 Regional Quality of Living Index for European regions
3.2.1 Ranking of European regions for RQI
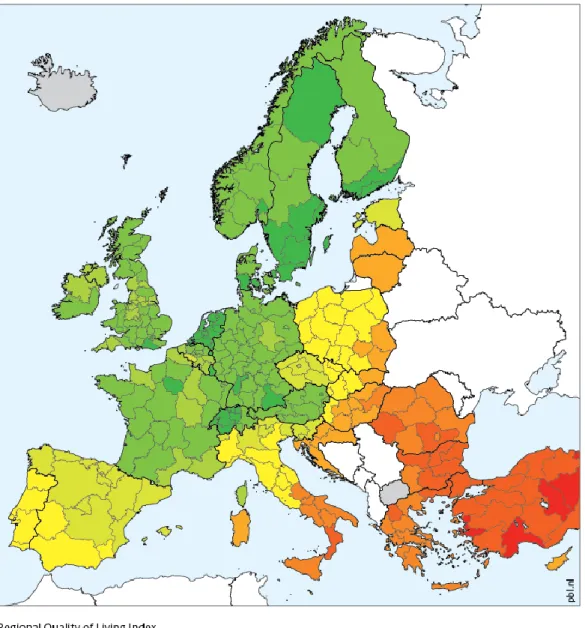
On a map of the European regions (Figure 6) the highest values for the Regional Quality of Living Index can be seen in western Europe. The average values for 9 categories were calculated. A gradient from south to north and from east to west can be observed ranging from values of 2 to 3 in Turkey, and 3 to 6 in eastern Europe, southern Spain and northern Italy, to values of 6 to 8.5 in northern and western Europe.
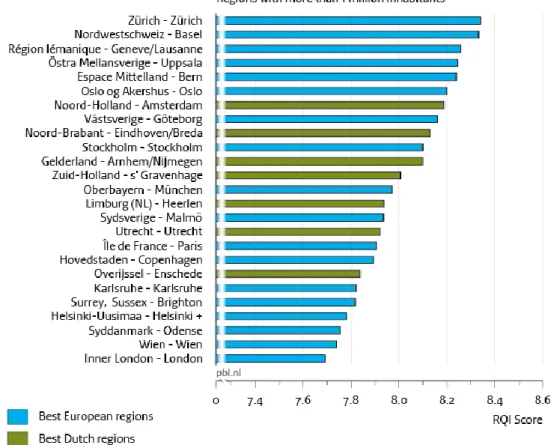
Figure 7 shows the highest scoring regions with more than 1 million inhabitants. The highest scores are seen in Swiss, Swedish, Norwegian and Dutch regions. The Dutch regions with more than 1 million inhabitants are all among the best 30 on the list. Relative high scores were also found for some Danish, German and British regions and the regions of Iles de France and Wien.
Regional Quality of Living in Europe
Figure 6 The Regional Quality of Living Index for European regions ranked on a scale of 1 to 10 (in which 10 is the best score).
Figure 7 The highest scoring regions in Europe with more than 1 million
inhabitants, according to the Regional Quality of Living Index with equal weighting for all the 9 categories. The figure shows the average value for 9 Quality of Living categories.
Regional Quality of Living in Europe
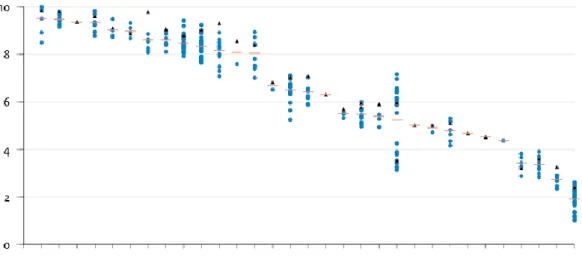
Figure 8 RQI values for the European NUTS2 regions, showing the average RQI value per country and its capital city
3.2.2 Regional differences in the Quality of Living in European countries
For 11 countries, the capital city region scored relatively higher than other regions in that country. Extremely high scores for RQI regions that included a capital city were found for Norway (Oslo region), Ireland (Dublin region), Czech (Prague region) and Slovakia (Bratislava region).This was not the case, however, with Belgium (BE), Germany (DE), Greece (EL), Romania (RU) and Denmark (DK). In these countries, the regions that include the capital city are large with high population densities, and the Quality of Living scored relatively low compared to other regions in these countries. A large spread within countries was found for Italy (IT) and Spain (ES). The northern regions of both these countries scored better in terms of the Quality of Living.
3.2.3 Correlation of the RQI index with regional characteristics
The Quality of Living is significantly correlated with regional GDP/cap (Gross Domestic Product per capita), FDI/cap (Foreign Direct Investments per capita) and population density in the European regions (Figure 9). Foreign Direct Investment is a measure of the presence of foreign companies in a specific region. One of the aims of Dutch policy is to attract foreign companies to improve the Dutch economy. To account for potential outlier effects in the calculated correlations due to a skewed wide data range in some regional variables, the correlation has also been calculated for log-transformed data. Some correlations then became more prominent. Negative correlations are found for number of inhabitants and the area of the regions.
Low or even negative correlation for area and number of inhabitants is most likely the result of the underlying choice in which NUTS regions are composed. The number of inhabitants is the major factor and thereby determines the size of the area of a region.
The negative correlation for area can be explained by relative low population density and less economic activity with consequently fewer Public services, education and some other Quality of Living elements.
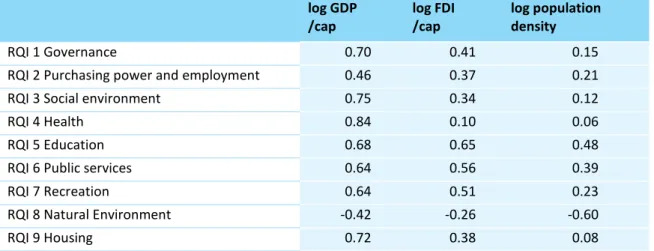
The correlation between the 9 RQI categories and GDP/cap showed positive correlations for all categories except Natural Environment (Table 2). This is the logical result of the negative correlation between Nature (forests, areas of protected nature) and Natural hazards (mostly rural areas with a low population density) and economic activity.
Improving the Quality of Living may contribute to increased economic activity resulting in a higher GDP/cap. Conversely, a high GDP/cap could lead to a better Quality of Living because there will be more money available for investment in better Public services, Recreation, Health and Education. Table 2 shows the strong correlation between these variables. The strongest correlation between RQI and FDI/cap was found for the categories Education, and Public services. Foreign investment takes place in regions with high Education scores and good Public services such as Connectivity and Internet facilities. The weaker correlations between GDP and FDI for the category Natural Environment can be explained by the fact that these regions have a low population density.
The difference between GDP/cap and FDI/cap with respect to the RQI category Health is noteworthy. The score for Health seems not to be relevant for decisions concerning foreign investment, while the strongest correlations were calculated for GDP.
Regional Quality of Living in Europe
Table 2. Correlation between RQI categories and some general regional variables
log GDP /cap log FDI /cap log population density RQI 1 Governance 0.70 0.41 0.15
RQI 2 Purchasing power and employment 0.46 0.37 0.21
RQI 3 Social environment 0.75 0.34 0.12
RQI 4 Health 0.84 0.10 0.06
RQI 5 Education 0.68 0.65 0.48
RQI 6 Public services 0.64 0.56 0.39
RQI 7 Recreation 0.64 0.51 0.23
RQI 8 Natural Environment -0.42 -0.26 -0.60
RQI 9 Housing 0.72 0.38 0.08
3.3 Comparison of Dutch regions with a benchmark for
the best regions in Europe
A benchmark with the best 25 European regions (with respect to GDP per capita) will provide insight into the strengths and weaknesses of the Dutch regions. A benchmark with the Best in Europe will offer more information than a comparison with the average in Europe because the stages of development differ. Besides which, the aim of the Dutch policy is to be among the world’s top ten countries.
Dutch regions have better scores than the Best in Europe for categories Education, Public services and Recreation. Slightly higher values where found for the northern regions of the Netherlands for Governance and Social environment because there perceptions about the reliability of government, the incidence of corruption and personal safety differ from those in other parts of the country. The differences between regions for the category Health are very small and the scores are approximately the same as the average of Best in Europe. Better air quality, especially with regard to particulate matter, would improve the scores of the Dutch regions (see Appendix 7.3 and 7.4 Dutch regions vs Best in Europe; 25 indicators). The scores for Education are high as a result of several good universities in the vicinity. These universities are situated in the Randstad (western conurbation) so higher scores for Education are found there as a result.
The scores for Purchasing power and employment are sometimes better than or equal to the Best in Europe. Better scores can be achieved by realising low unemployment and improving the affordability of housing. The scores for Public services too, are higher than in the Best in Europe because connectivity by road, rail, and air and the internet are all very good. Scores for the indicator Energy are relatively low for the Netherlands because of the dependence on non-renewable energy sources. Several other European countries have higher percentages for renewable energy (see also Appendix 7.3). The score for Housing is better for the northern regions, where the quality of the Housing environment is more highly appreciated.
Next page -->
Figure 10 Benchmark for the 9 RQI categories comparing Dutch regions and Best in Europe.
Regional Quality of Living in Europe
The scores for Recreation are slightly better than the Best in Europe. The relatively high scores for Flevoland, Noord-Holland and Limburg are due to the relatively large area available for recreational facilities, such as cycle paths, golf courses and tennis courts. The Best in Europe regions and the Dutch regions have remarkably low scores than the other European regions for the Natural Environment. The average score for Best in Europe is 5. This is a result of the low values for all indicators in this category, Nature, Natural hazards and Climate (Appendix 7.3) . Flevoland scores best because vulnerability to hazards is low while the Randstad regions (western conurbation covering the provinces Noord-Holland, Utrecht, and Zuid-Holland) with the greatest population density, has the worst score.
3.3.1 Indicators that can be influenced by policy measures
With regard to the indicators for Quality of Living, which that can be influenced by policy measures it may be concluded that all the Dutch provinces scores better for Governance Effectiveness and Internet (Table 3). Almost all Dutch provinces scored better on
Employment (low unemployment), Connectivity, Culture and Restaurants, Recreation, Education quality and Education quantity. The northern Dutch provinces sometimes showed lower scores as a result of their less central position compared to the Randstad regions. Population density in the Randstad regions is greater which results in a better score for Education quantity and Connectivity but worse scores for Housing environment, Nature and Natural hazards.
It should be noted that a red or yellow symbol does not mean that the standard for a specific indicator is unacceptable or insufficient. The standard of Health Care in the Netherlands (average score 8.1) is very good, for example, but compared to the best European regions (score 8.6) the symbol is yellow or red. Housing quality is also good in the Netherlands but it is also very good in the best European regions.
There are several possible measures which could improve the scores of the Dutch regions after benchmarking with the best European regions. Measures need to be focused not only on indicators with a relatively low score, but also on indicators with a high score, in order to maintain top positions. Some possible measures for environmental and spatial policy include:
Creating a larger area for recreation with suitable facilities, for example, cycle paths, tennis courts or golf courses, and more green parks, especially in the Randstad regions. This will raise the scores for Recreation possibilities and Housing environment.
Improving Connectivity by road, rail and air, particularly for the northern regions of the Netherlands.
Creating larger areas for nature (Natural Environment) or green or blue (water) spaces in the cities of the region, which will result in better appreciation of the Housing
environment.
Making Safety improvements which will lead to a higher level of safety perception, especially in the big cities (Social environment).
Improving air quality, especially with regard to particulate matter, and reducing noise will lead to better quality health and less noise nuisance in larger cities (Environmental quality - Health).
Table 3 The relative score of the Dutch regions compared to the benchmark of Best in Europe for a selection of 17 Quality of Living indicators that can be influenced policy measures
Regional Quality of Living in Europe
4 CONCLUSIONS
The Regional Quality of Living Index, using non-business-related indicators, could help to improve the attractiveness of regions, thereby encouraging people and companies to settle in these regions. The highest scores in the RQI were found for regions in Switzerland, Sweden, Norway and the Netherlands.
European regions
Some countries showed a wide divergence between regional scores. The southern regions of Italy and Spain, for example, had significantly lower scores than those in the north. In addition, regions in which the capital city is situated were found to have a better Quality of Living. with Germany, Belgium, Romania and Denmark being the exceptions.
Significant correlations were found between RQI and Gross Domestic Product (GDP) and Foreign Direct Investment (FDI) for European regions. Quality of Living is one of the factors that can to some extent be influenced by policy measures which could lead to an
improvement in GDP and FDI.
Benchmark for Dutch provinces
Benchmarking Dutch regions alongside the best 25 European regions (Best in Europe in terms of GDP per capita) provides insight into the strengths and weaknesses of the regions in terms of the Quality of Living. The Dutch regions have remarkably higher scores than the Best in Europe regions for Public services and Recreation and often better scores for
Education. The scores for Purchasing power and employment are higher for some regions and lower for others. The scores for Governance and Social environment are at the same level. The scores in the category Natural environment and Housing were lower than for the Best in Europe for almost all Dutch regions.
The regions in the Randstad (western conurbation of the Netherlands) showed higher scores for Public services (Connectivity; distance to Schiphol airport) and Education (several universities in the vicinity), but lower scores for Social environment as well as Natural Environment as a result of the greater population density than in other Dutch regions. The provinces of Flevoland and Noord-Holland had the highest RQI score of the Dutch regions. Although the province of Zeeland had the lowest score, this region is still one of the better regions of Europe.
The northern regions of the Netherlands showed lower scores because of lower scores for Public services (Connectivity; distance to Schiphol airport), Education and Recreation. Conversely, Governance and Social environment did better due to scoring better in perception surveys.
Opportunities for improving the Quality of Living in the Netherlands
The RQI score could be influenced with policy measures at national, regional and municipal levels. There is not much room to exercise influence over categories such as Governance and Education at regional level. However, regional environmental and spatial policy could be applied to improve the Quality of Living with measures such as:
Creating a larger area for recreation with suitable facilities, for example, cycle paths, tennis courts or golf courses and more green parks, especially in the Randstad regions (Recreation and Housing environment).
Improving Connectivity by road, rail and air, particularly for the northern regions of the Netherlands (see Appendix 7.3).
Creating larger areas for nature (Natural Environment) or green or blue (water) spaces in the cities of the region (Housing environment).
Making Safety improvements which will lead to a higher level of safety perception, especially in the big cities (Social environment).
Improving air quality, especially with regard to particulate matter, and reducing noise nuisance in larger cities (Environmental quality - Health).
Improving the Quality of Living can help to make the Dutch regions more attractive for local residents and businesses as well as attract the personnel that companies need.
The RQI can be used to benchmark the Quality of Living in European regions. Improving the quality of the living environment could well help to achieve the policy ambitions of the Dutch government in elevating the Dutch regions into the top 10 most competitive economies in the world.
Regional Quality of Living in Europe
5 RECOMMENDATIONS
The design of a Regional Quality of Living Index which is presented in this report should be seen as an initial concept. Some suggestions for further improvements and potential applications will be given here.
In order to monitor changes in the Quality of Living over time, consideration should be given to the methods of determining the scores for the various indicators. The methods applied resulted in relative scores and not absolute scores. This method will make it possible to show whether one region has improved more than another region. In terms of the primary purpose of the RQI, however, it is important not only to improve several aspects but also to achieve a higher ranking.
Investigations should be carried out using functional units instead of NUTS2 regions. One option would be to combine regions as in the Regional Competitiveness Index (Dijkstra et al., 2012). In that study regions with high population density (Inner London, for instance) were combined with the surrounding region.
Another option would be to investigate whether it would be possible to calculate the RQI at NUTS3 level or city regions for the Dutch situation. There is more data available for the Netherlands than for Europe.
An investigation could be carried out for the Dutch regions to compare them with their specific equivalent regions. For each Dutch region and several economic activities equivalents would be identified and a benchmark created based on Quality of Living characteristics.
The results of the RQI could then be used for comparison with the Quality of Life index (Boelhouwer, 2012) or a happiness index.
Cluster analysis could be carried out to identify regions with similar characteristics in relation to the various categories. The problem with the European regions is that there are wide differences in economic development between the regions. This would allow regions to find, peers thereby creating a more useful benchmark for comparing regions. Assess the robustness of the ranking of the RQI outcomes with respect to the uncertainty
6 REFERENCES
Annoni P and Dijkstra L. (2013). EU Regional Competitiveness Index RCI 2013 Unit of Econometrics and Applied Statistics, DG JRC, Ispra * Economic Analysis Unit, DG Regio, Brussels.
Boelhouwer J and Gilsing R. (2012). De sociale staat van de gemeente. Lokaal gebruik van de SCP-leefsituatie-index (co-productie met het Verwey-Jonker Instituut). Charron N, Lapuente V and Dijkstra L. (2012). Regional Policy Regional Governance
Matters: A Study on Regional Variation in Quality of Government within the EU. A series of short papers on regional research and indicators produced by the Directorate-General for Regional Policy WP 01/2012.
DG Regional Policy (2010). ‘Measuring Quality of Government and Sub-national Variation’ Report for the EU Commission of Regional Development, European Commission Directorate-General Regional Policy, Policy Development Directorate.
Dijkstra L, Annoni P and Kozovska K. (2011). Working Paper: A New Regional Competitiveness Index: Theory, Methods and Findings. EU Regional Policy no. 2/2011.
EIU (2012a). Global Liveabilty ranking. Economist Intelligence Unit. EIU (2012b). Global Food Security report, Economist Intelligence Unit. ESPON (2011). Espon data Accessibility index for Rail, Road and Air.
ESPON (2013). Territorial Dynamics in Europe, Natural hazards and climate change in European regions. Territorial Observation no. 7, 2013.
ESS (2014). European Social Survey. http://www.europeansocialsurvey.org/ EU,2009. Perception survey Analytical report; Perception survey on quality of life in
European cities.
Eurofound (2014). The European Foundation for the Improvement of Living and Working Conditions (Eurofound) is a tripartite European Union Agency,
www.eurofound.europe.eu.
EEA (2009). (EEA). Ensuring quality of life in Europe's cities and towns European Environment Agency EEA Report no. 5/2009.
Eurostat (2010). Perception survey, Survey on perceptions of quality of life in 75 European cities, 2010. European Union Regional Policy. Eurostat-rapport. Eurostat (2014). New Quality of Life indicators, 2014.
Eurostat (2011). Culturel employment statistics 2011. Eurostat pocketbooks. Eurostat (2012). Eurostat website. Urban Audit database.
EY (2013). De attractiveness surveys van EY Barometer Nederlands vestigingsklimaat 2013; Nederland op koers.
http://www.ey.com/NL/nl/Issues/Business-environment/Barometer-Nederlands-vestigingsklimaat-2013. Future Brand (2010). Country Brand Index 2010. Summary of report.
Hyslop D. (2013). Institute for economics and Peace Sydney Australia, Global peace indicator (personal communication, 6 February 2013).
Regional Quality of Living in Europe
demarcation of concepts; a literature study. The Netherlands Landscape and Urban Planning 65 (2003) 5–18.
KNMI (2013). Personal communication, Rob Sluijter.
Kuiper R and Van der Schuit J. (2012). Monitor Infrastructuur en Ruimte; nulmeting. PBL Report number 500303001.
Mercer (2010). Defining Quality of Living.
http://www.mercer.com/referencecontent.htm?idContent138046. Monocle (2012). Monocle’s most liveable cities index 2012.
Morais P and Camanho AS. (2011). Evaluation of performance of European cities with the aim to promote quality of life improvements. Omega 39 (2011) 398–409.
Nardo M and Saisana M. (2008). OECD/JRC Handbook on constructing composite indicators. Putting theory into practice. European Commission - Joint Research Centre, Institute for the Protection and Security of the Citizen, Unit of Econometrics and Applied Statistics.
NUMBEO (2012). Numbeo is a collection of web pages with numerical and other itemizable data about cities and countries. www.numbeo.com
OECD / Bertelsman Stiftung (2011). Sustainable Governance Indicators OECD fhttp://www.sgi-network.de/.
OECD (2011). Sustainable Governance indicators.
OECD (2012). Your better life index, interactive web application.
National Center for Education Statistics (2012). Programme for International Student Assessment (PISA). OECD, 2012.
Quality of Life Research (2012). International journal published by Springer. Raspe O, Weterings A and Van Oort F. (2010), De economische kracht van de
Noordvleugel van de Randstad. PBL Netherlands Environmental Assessment Agency, The Hague.
Raspe O, Weterings A and Thissen M. (2012). De internationale concurrentiepositie van de topsectoren, ISBN: 978-90-78645-92-4 PBL report number 500210003, PBL Netherlands Environmental Assessment Agency, The Hague.
Stiglitz J, Sen A and Fitoussi JP. (2009). Report by the Commission on the Measurement of Economic Performance and Social Progress.
World Bank (2012). World Governance Indicators, www.govindicators.org.
Veenhoven R. (1996). Happy life-expectancy; a comprehensive measure of quality-of-life in nations. Published in Social Indicators Research, 1996, vol. 39, 1–58. Vision of Humanity (2012). Global peace indicator.
Weterings A, Raspe O and Van den Berge M. (2011). The European landscape of
knowledge-intensive foreign-owned firms and the attractiveness of Dutch regions, PBL Netherlands Environmental Assessment Agency, The Hague.
WIKI (2012). List of international schools.
World Economic Forum (2013). http://reports.weforum.org/global-energy-architecture-performance-index-2014/eu28-analysis-of-eapi-performance/.
Yager RR. (1996). ‘Quantifier guided aggregating using OWA operators.’ International Journal of Intelligent Systems, 11: 49–73.
7 APPENDIX
7.1 RQI indicators; databases, maps and sub-indicators
Choice of NUTS2 European regions
Data were collected for the European NUTS2 regions (NUTS2 codes 2010), in the same way as in the approach used for the EU Regional Competitiveness Index (Dijkstra et al., 2011 and Morais et al., 2011). This was consistent with research that has already been carried out for Dutch prime sectors and their European competitors (Raspe et al., 2012). Europe has 316 NUTS2 regions, 270 of which are in the EU27and 46 in Turkey, Switzerland, Croatia, Northern Liechtenstein and Macedonia.
Data were collected for 463 European regions. Data on French, Portuguese and Spanish NUTS2 regions that are not on the European continent were not taken into account. Macedonia, Liechtenstein and Iceland were also missing from most data sets. Most of the analyses were therefore performed for 305 NUTS2 regions.
Table 4 NUTS 0, 1, 2 and 3 regions in Europe
NUTS0 countries NUTS1 NUTS2 Total
EU 27 27 97 270 394 Turkey 1 12 26 39 Norway 1 1 7 9 Switzerland 1 1 7 9 Croatia 1 1 3 5 Northern Ireland 1 1 1 3 Liechtenstein 0 1 1 2 Macedonia 0 1 1 2 Total 32 115 316 463
The databases that were used for the calculation of indicators are presented in Table 5. The sub-indicators that were used to calculate the indicator scores are given in Table 6 to 14. The maps of the indicator scores are presented in figure 11 to 19.
Regional Quality of Living in Europe
Table 5 Databases from which data were derived to calculate Regional Quality of Living scores.
Code Database Content
DG/RP EU/ DG regional policy on Regional Governance
Matters NUTS2 regions
Eurofound European Quality of Life Survey, 2011–2012 33 countries
EEA European Environment Agency (EEA) c. 500 European cities ESS European Social Survey Countries -NUTS2- regions ESPON TRACC Potential Accessibility Travel Indicators NUTS3 regions
ESPON Hazard data NUTS3 regions
GCB Global Corruption Barometer (Transparency
International) 32 countries
GFI Global Food Security Index (Economic Intelligence
Unit) 31 countries
GPI Global Peace Index 32 EU countries
HRI Human Rights Index / Cingranelli-Richards (CIRI) 31 countries LUCAS LUCAS - Land use and land cover statistics (Eurostat) 379 NUTS2 regions
OECD Several databases EU countries
Pisa National Center for Education Statistics - Program for
International Student Assessment Countries PPP Eurostat / purchasing power parities 31 countries RDS Eurostat / Regional demographic statistics NUTS2 regions RegStat Regional statistics (Eurostat) 379 NUTS2 regions RHS Eurostat / Regional health statistics NUTS2 regions RISS Eurostat / Regional information society statistics NUTS2 regions RLMS Eurostat / Regional labour market statistics NUTS2 regions SGI Sustainable Governance Indicators (OECD) 24 EU countries UA-Key Key cities (Urban Audit; Eurostat) 418 Key cities UA-PS Perception survey (Urban Audit; Eurostat) 75 European cities WDI World Development Indicators (World Bank) 32 EU countries
WEF World Economic Forum 32 EU countries
WIKI Wikipedia various data Cities/countries WGI World Governance Indicators (World Bank) 32 EU countries
RQI 1. Governance
Regional Quality of Living in Europe
Table 6 Sub-indicators used to calculate indicators of the Regional Quality of Living category Governance
Name Indicator/ Sub-indicator Data source (Table 5)
Year
RQI 1.1 Governance Effectiveness
Government Effectiveness WGI 2011
Regulatory Quality WGI 2011
Rule of Law: DG/regio 2009
Control of Corruption DG/regio 2009
Corruption GCB 2012
RQI 1.2 Political Stability and terror
Political Terror Scale GPI 2011
Political Stability and Absence of Violence/Terrorism: WGI 2011
Physical Integrity Rights Index GPI 2011
Political stability HRI 2011
RQI 1.3 Banks (country indicator)
Standard & Poor country ratings WIKI 2013
RQI 2. Purchasing power and employment
Regional Quality of Living in Europe
Table 7 Sub-indicators used to calculate indicators of the Regional Quality of Living category Purchasing power and employment
Name Indicator/ Sub-indicator Data source (Table 5)
Year
RQI 2.1 Housing Affordability
Price owner-occupied housing (relative) UA-Key 2009
Price rented housing (relative) UA-Key 2009
RQI 2.2 Employment
Unemployment 15–24 year age group) RLMS 2012
Unemployment 20–65 year age group) RLMS 2012
RQI 2.3 Cost of living
Price goods PPP 2010
RQI 3. Social environment
Regional Quality of Living in Europe
Table 8 Sub-indicators used to calculate indicators of the Regional Quality of Living category Social environment
Name Indicator/ Sub-indicator Data source (Table 5)
Year
RQI 3.1 Safety
Feel safe in this city UA-PS 2009
Most people can be trusted UA-PS 2009
Feel safe in this neighbourhood UA-PS 2009
Business costs of crime and violence (Country data) DG-RP 2011 Reliability of police services (Country data) DG-RP 2011
Organised crime (Country data) DG-RP 2011
RQI 3.2 Freedom (Country Indicator)
Civil Rights SGI 2011
Access to Information SGI 2011
Voice and accountability WGI 2011
RQI 3.3 Social cohesion (country indicator)
Most of the time: people helpful or mostly looking out for themselves ESS 2011 Important to help people and care for others well-being ESS 2011 Important to be loyal to friends and devote to people close ESS 2011 Participating in social activities of a club, society or association Eurofound 2011 How often did you do unpaid voluntary work in the last 12 months? Eurofound 2011
Regional Quality of Living in Europe
Table 9 Sub-indicators used to calculate indicators of the Regional Quality of Living category Health
Name Indicator/ Sub-indicator Data source (Table 5)
Year
RQI 4.1 Healthcare
Infant mortality rate RDS 2009
Satisfied with hospitals UA-PS 2009
Cancer death rate DG/RP 2010
Per capita government expenditure on health WHO 2011
Satisfied with healthcare UA-PS 2009
Satisfied with doctors UA-PS 2009
Heart disease death rate DG/RP 2010
Per capita total expenditure on health at average exchange rate
(USD) WHO 2011
RQI 4.2 Food quality and safety
Food quality and safety GFI 2012
RQI 4.3 Life expectancy
Life expectancy at given exact age DG/regio 2010
Life expectancy at birth OECD 2012
Life expectancy, Females at age 65 OECD 2012
Life expectancy, Males at age 65 OECD 2012
Number of years of healthy life expected RDS 2010
RQI 4.4 Environmental quality
Air pollution is a big problem here UA-PS 2009
Noise is a big problem here UA-PS 2009
This is a clean city UA-PS 2009
Number of days ozone concentration exceeds 120 µg/m³ UA-Key 2011 Number of days particulate matter concentration (PM10) exceeds 50
µg/m³ UA-Key 2011
Accumulated ozone concentration in excess 70 microgram/m3 UA-Key
2011 Annual average concentration of PM10 UA-Key 2011
RQI 5. Education
Figure 15 Maps of Regional Quality of Living indicators of the category Education Table 10 Sub-indicators used to calculate indicators of the Regional Quality of Living category Education
Name Indicator/ Sub-indicator Data source (Table 5)
year
RQI 5.1 Education quality
Satisfied with schools UA-PS 2009
Quality of University – best 20% in world = 5 etc. WIKI 2012
Regional Quality of Living in Europe
RQI 6. Public services
Figure 16 Maps of Regional Quality of Living indicators of the category Public
Table 11 Sub-indicators used to calculate indicators of the Regional Quality of Living category Public services
Name Indicator/ Sub-indicator Data source (Table 5)
Year
RQI 6.1 Energy security
Energy security and access WEF 2012
RQI 6.2 Internet
Satisfied with public internet access UA-PS 2009 Households with access to the Internet RISS 2009
Households with broadband access RISS 2009
Individuals who ordered goods or services over the Internet RISS 2009
RQI 6.3 Connectivity
Satisfied with public transport UA-PS 2009
Rail accessibility Espon – TRACC 2011
Road accessibility Espon – TRACC 2011
Regional Quality of Living in Europe
RQI 7. Recreation
Figure 17 Maps of Regional Quality of Living indicators of the category Recreation
Table 12 Sub-indicators used to calculate indicators of the Regional Quality of Living category Recreation
Name Indicator/ Sub-indicator Data source (Table 5)
year
RQI 7.1 Culture and Restaurants
Michelin star restaurants (Distance decay calculation) WIKI 2012
Satisfied with cultural facilities UA-PS 2009
Satisfied with cinemas UA-PS 2009
RQI 7.2 Recreation possibilities
Satisfied with sports facilities UA-PS 2009
Area for recreational sports and leisure use UA-Key 2011 Land area for recreational sports and leisure use/cap UA-Key 2011
Length of bicycle network UA-Key 2011
Satisfied with outdoor recreation UA-PS 2009
RQI 8. Natural environment
Regional Quality of Living in Europe
Table 13 Sub-indicators used to calculate indicators of the Regional Quality of Living category Natural environment
Name Category Indicator/ sub-indicator Data source (Table 5)
Year
RQI 8.1 Climate
Number of days of rain per year UA-Key 2011
Average number of hours of sunshine per day UA-Key 2011 Average temperature of warmest month UA-Key 2011 Average temperature of coldest month UA-Key 2011
Rainfall UA-Key 2011
RQI 8.2 Natural hazards
Aggregated hazard exposure potential ESPON 2010
Sensitivity and response ESPON 2010
RQI 8.3 Nature
Satisfied with outdoor recreation UA-PS 2009
Recreation, leisure and sport LUCAS 2009
Nature reserves LUCAS 2009
Forestry LUCAS 2009
RQI 9. Housing
Figure 19 Maps of Regional Quality of Living indicators of the category Housing Table 14 Sub-indicators used to calculate indicators of the Regional Quality of Living category Housing
Name Indicator/ Sub-indicator Data source (Table
5) Year RQI 9.1 Housing quality
Average price per m2 – apartment UA-Key
2009 Average price per m2 – house UA-Key
2009
Rooms per person YBLI 2009