RIVM report 481505015
Technical Report on Chemicals, particulate matter
and human health, air quality and noise
W.L.M. Smeets, W.A.J. van Pul, H.C. Eerens,
R.B.C. Sluyter, D.W. Pearce, A. Howarth, A.
Visschedijk, M.P.J. Pulles, A.E.M. de Hollander
May 2000
This Report has been prepared by RIVM, EFTEC, NTUA and IIASA in association with
TME and TNO under contract with the Environment Directorate-General of the European
Commission.
Abstract
The economic assessment of priorities for a European environmental policy plan focuses on twelve identified Prominent European Environmental Problems such as climate change, chemical risks and biodiversity. The study, commissioned by the European Commission (DG Environment) to a European consortium led by RIVM, provides a basis for priority setting for European environmental policy planning in support of the sixth Environmental Action Programme as follow-up of the current fifth Environmental Action Plan called
‘Towards Sustainability’. The analysis is based on an examination of the cost of avoided damage,
environmental expenditures, risk assessment, public opinion, social incidence and sustainability. The study incorporates information on targets, scenario results, and policy options and measures including their costs and benefits.
Main findings of the study are the following. Current trends show that if all existing policies are fully implemented and enforced, the European Union will be successful in reducing pressures on the environment. However, damage to human health and ecosystems can be substantially reduced with accelerated policies. The implementation costs of these additional policies will not exceed the environmental benefits and the impact on the economy is manageable. This requires future policies to focus on least-cost solutions and follow an integrated approach. Nevertheless, these policies will not be adequate for achieving all policy objectives. Remaining major problems are the excess load of nitrogen in the ecosystem, exceedance of air quality guidelines (especially particulate matter), noise nuisance and biodiversity loss.
This report is one of a series supporting the main report: European Environmental Priorities: an Integrated Economic and Environmental Assessment. The areas discussed in the main report are fully documented in the various Technical reports. A background report is presented for each environmental issue giving an outline of the problem and its relationship to economic sectors and other issues; the benefits and the cost-benefit analysis; and the policy responses. Additional reports outline the benefits methodology, the EU enlargement issue and the macro-economic consequences of the scenarios.
Technical Report on Chemicals, particulate matter and human health, air quality and noise
This Report has been prepared by RIVM, EFTEC, NTUA and IIASA in association with TME and TNO under contract with the Environment Directorate-General of the European Commission. This report is one of a series of reports supporting the main report: European Environmental Priorities: an Integrated Economic and Environmental Assessment. Reports in this series have been subject to limited peer review.
The report consists of four parts:
Section 1: Chemicals and particulate matter
Prepared by Winand Smeets and Addo van Pul (RIVM)
in close collaboration with Antoon Visschedijk and Tinus Pulles (TNO)
with contributions from Drs. G.J. Reinds and Dr. W. de Vries (Alterra, The Netherlands). Section 2: Human health and air quality
Prepared by Hans Eerens and Rob Sluyter (RIVM); Appendix I by Guus de Hollander (RIVM)
Section 3: Benefit assessment
Prepared by D.W. Pearce, A. Howarth (EFTEC) Section 4: Policy assessment
Prepared by D.W. Pearce, A. Howarth (EFTEC)
References
All references made in the sections on benefit and policy assessment have been brought together in the Technical Report on Benefit Assessment Methodology. The references made in the sections 1 and 2 on environmental assessment follows at the end of their section.
Note to the reader:
This 'technical report' provides background information on two issues in the main report: 'Chemicals and particulate matter' and 'Human Health and Air Quality'.
There are four sections.
Section 1 deals with a) emissions and costs of emission abatement of primary particulate matter and persistent organic pollutants (POPs), such as dioxins, and b) emissions and depositions of heavy metals, which are often attached to primary particulate matter, and of some pesticides.
Section 2 deals with air quality in urban and rural areas for a selected number of pollutants: • primary particulate matter, lead, B(a)P, and benzene and
• secondary particulate matter (from SO2, NOx and NH3), and SO2, NOx, of which the emissions are dealt with in the context of acidification and eutrophication (see Technical Report on Acidification).
Economic Benefits with regard to human health are dealt with in Section 3, where also cost-benefit ratios (especially for particulate matter) are presented.
Finally, Section 4 deals with a set of possible policy measures to reduce emissions of pollutants (see section 1) beyond baseline levels.
The findings, conclusions, recommendations and views expressed in this report represent those of the authors and do not necessarily coincide with those of the European Commission services.
Contents
1.
CHEMICALS AND PARTICULATE MATTER
7
1.1 Introduction 7
1.2 Methodology 10
1.2.1 Emissions 10
1.2.2 Atmospheric transport and deposition 13
1.2.3 Critical loads 14
1.3 Results and analysis 15
1.3.1 Emission scenarios 15
1.3.2 Emissions and costs EU 18
1.3.3 Emissions and costs in accession countries 32
1.3.4 Emissions other countries 33
1.3.5 Depositions and critical loads 34
1.4 Conclusions 36
REFERENCES
37
2.
HUMAN HEALTH AND AIR POLLUTION
40
2.1 Introduction 40
2.1.1 Overview 40
2.1.2 Human health Indicators 41
2.1.3 Exposure indicators 41
2.1.4 Study outline 43
2.2 Methods 43
2.2.1 Emissions 43
2.2.2 Selected cities 44
2.2.3 Urban emission processing 45
2.2.4 Meteorological data 46
2.2.5 Modelling 46
2.2.6 Concentration calculation methodology 49 2.2.7 Conversion of annual means into percentiles 51
2.3 Conclusion and Results 56
2.3.1 Main trends 56
2.3.2 Urban Air Pollution: Road Transport Takes the Lead 56
REFERENCES
58
3.
BENEFIT ASSESSMENT
61
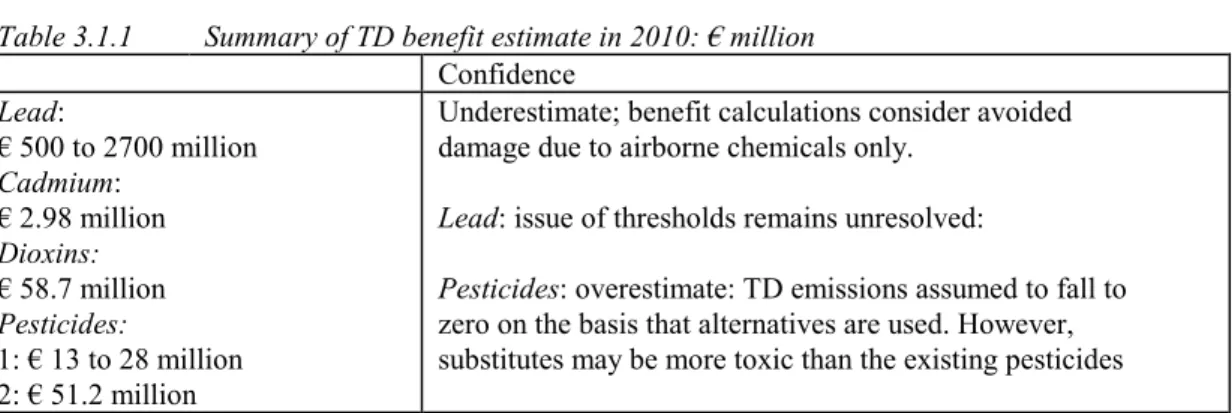
3.1 Chemicals and particulate matter 61
3.1.1 Public opinion 61
3.1.2 Expert opinion 61
3.1.3 Benefit estimation 61
3.2.1 Public opinion 66
3.2.2 Expert opinion 66
3.2.3 Benefit assessment 66
3.2.4 Benefit assessment noise nuisance 71
4.
POLICY PACKAGE
77
4.1 Chemicals and particulate matter 77
4.1.1 Key issues 77
4.1.2 Recommended key actions 77
4.1.3 Multiple benefits 78
4.2 Human health and air pollution 78
4.2.1 Key issues 78
4.2.2 Recommended policy initiatives 78
4.2.3 Multiple benefits 80
4.3 Policy assessment chemical risks and particulate matter 80
4.3.1 Causal criterion 80
4.3.2 Efficiency criterion 80
4.3.3 Administrative complexity 81
4.3.4 Equity criterion 81
4.3.5 Jurisdictional criterion 81
5.
POLICY ASSESSMENT HUMAN HEALTH AND AIR POLLUTION
83
5.1 Causal criterion 83 5.2 Efficiency criterion 83 5.3 Administrative complexity 84 5.4 Equity criterion 85 5.5 Jurisdictional criterion 85
APPENDIX
87
APPENDIX A-1. EMISSIONS EU (SNAP90 LEVEL 1)
87
APPENDIX A-2. EMISSIONS 10 ACCESSION COUNTRIES
90
APPENDIX B-1. EMISSIONS PM
10IN EU COUNTRIES (SNAP90 SECTOR
LEVEL 1)
96
APPENDIX B-2. EMISSIONS PM
10IN ACCESSION COUNTRIES (SNAP90
SECTOR LEVEL 1)
100
APPENDIX B-3. EMISSIONS PM
10OTHER COUNTRIES (SNAP90 SECTOR
APPENDIX C: MAPS FOR DEPOSITION AND EXCEEDANCES OF CRITICAL
LOADS
106
APPENDIX D: REVISIONS OF PRELIMINARY TNO EMISSION DATA SET 112
APPENDIX E: 1990 AND 2010 EMISSION FACTORS FOR 23 EUROPEAN
AGGLOMERATIONS
116
APPENDIX F: 1990 EN 2010 URBAN EMISSION FACTORS FOR 15 EU
COUNTRIES
120
APPENDIX G: 1990 EN 2010 CONCENTRATION, EXCEEDANCES AND
EXPOSURE FOR VARIOUS POLLUTANTS FOR 15 EU
COUNTRIES
123
APPENDIX H: RANKING OF 15 EU COUNTRIES RELATIEVE TO EMISSION
AND CONCENTRATION
140
APPENDIX I: BURDEN OF DISEASE ASSOCIATED WITH ENVIRONMENTAL
1. Chemicals and particulate matter
1.1 Introduction
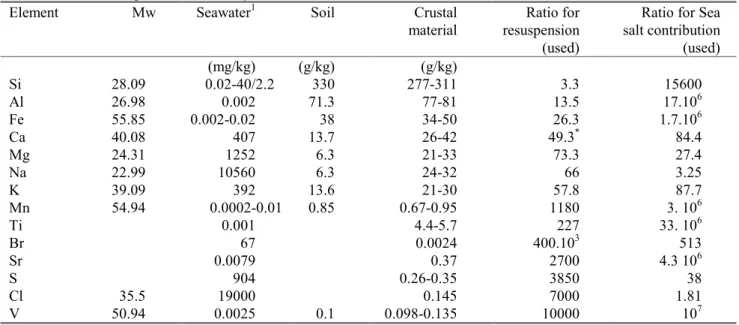
This section on chemicals and particulate matter considers the future emission trends to air of primary particulate matter (PM), heavy metals (HMs) and persistent organic pollutants (POPs), and also briefly discusses deposition for some selected HMs (cadmium, copper, lead), and POPs (dioxins/furans, atrazine, endosulfan, lindane, pentacholorophenol). In addition, impacts on forest soils are evaluated for cadmium, copper and lead. Human exposure to selected air pollutants (PM, Benz(a)Pyrene, benzene, lead) is dealt with in a separate section (see section 2). Impacts of HMs on non-forest ecosystems and impacts of POPs have not been assessed.
Primary particulate matter consists of particles emitted from anthropogenic and natural sources such as combustion, industrial processes1, sea-salt spray and suspended soil dust. Secondary PM is formed by chemical reaction from SO2, NOx, and NH3 gases, condensation of organic vapours emitted from various anthropogenic sources and photochemical reactions. This study uses PM102 as main indicator for the effects of human exposure to particulates. Emission trends presented in this section only relate to emissions from anthropogenic origin.
Chemicals are introduced into the environment through human activities. These include the release from production and use, but also the dispersion as unwanted by-products during combustion and industrial processes. Chemicals are dispersed into the air, water and soil, and may lead to unwanted effects on human health and ecosystems.
Among the large number of chemicals entering the environment, HMs and POPs represent two groups that are of particular importance due to their persistent, bio-accumulative and toxic characteristics. HMs and POPs are known to be a threat to human health (blood and organ disorders, carcinogenic effects, birth defects,
intellectual development) and the environment (forest ecosystem stress, reproductive impairment). Clearly, there are tens of thousands of chemicals (including pesticides) that could be considered, but this study will focus on emissions of heavy metals (HMs) and persistent organic pollutants (POPs) to air that are subject to EU, UN-ECE and other international agreements and for which a reasonable amount of data exists. The environmental problems around chemicals (or hazardous substances) are presented in detail in the state-of-environment reports brought out by the EEA (EEA, 1998; 1999). The risk assessments of new and existing non-assessed chemicals dealt with in EU regulations are discussed in Box 1.1.
Emission targets have been established for specific HMs and POPs under the auspices of the UN/ECE Convention on Long-Range Transboundary Air Pollution (CLRTAP). According to the protocols on HMs and POPs, countries are obliged to reduce atmospheric emissions of lead (Pb), cadmium (Cd), mercury (Hg), dioxins/furans and polycyclic aromatic hydrocarbons (PAHs) to below a reference year, most probably 1990 for the EU. Emissions of these substances, together with copper (Cu), which is not covered by the CLRTAP Protocol, are used as the main pressure indicators for chemicals in this study. Future emissions of
polychlorinated biphenyls (PCBs) and pentachlorophenol (PCP) are only briefly referenced due to the effective control on emissions through current EU regulations. Four agricultural pesticides (atrazine, endosulfan, lindane and pentachlorophenol (PCP)) have been considered in the baseline scenario only. Three principal emission scenarios have been assessed in this study. Making use of a 1990-2010 timeframe, future trends in emissions under current legislation were assessed in the baseline scenario (BL), while the technology-driven scenario (TD) assumes full penetration of advanced end-of-pipe emission control technologies, such as high efficiency electrostatic precipitators, fabric filters and highly efficient wet scrubbers. The accelerated policy scenario (AP) takes into account the effects of policy action on climate
1 Non-combustion related emission sources in industry (stack plus diffuse emissions). 2 PM
10 are particles with diameter less than 10 µm that can follow the inhaled air into the respiratory system and the lungs.
change and acidification. Advanced end-of-pipe technologies to reduce emissions of primary PM10 and selected HMs and POPs are considered in the AP scenario also.
Box 1.1.: The assessment of chemicals
The output of the chemical industry worldwide is almost € 1500 billion per year. A 30% share in this output makes the EU a major player on the global market. Within the EU there is sufficient regulatory legislation to adequately reduce risks associated with chemical substances. Although existing assessment procedures implied in current legislation can always be improved, they should not be regarded as a significant bottleneck in the proper handling of chemical risks. The efficacy of directives and international agreements in substantially reducing chemical risks varies greatly. Whereas risks associated with the introduction of new chemicals can be largely avoided, the degree of manageability of risks associated with existing substances is not sufficient.
Adequate management of chemical risks implies targeted risk reduction measures that are based on risk assessments when an apparent concern has been established for a given chemical. The EU started assessing the risks of the 100,000 existing chemicals in 1993, giving priority to the 2,500 so-called High Volume Production Chemicals (HVPCs; >1,000 tonnes per year). Since then, the risks of some 30-40 chemicals have been assessed. For a few chemicals risks were sufficiently high to warrant proposal of proper risk management programmes to be adopted by the Commission. At this pace it will take ages to assess all HVPCs adequately. Assessment costs vary from € 100,000 for a basic set of toxicity data to an estimated € 5 million for comprehensive toxicity testing of one substance.
Full risk assessment of more HVPCs is prevented due to inadequate toxicity information (for 75% of these HVPCs minimal toxicity data for a preliminary assessment are lacking). In many cases where this information is present, limited or lack of information on emissions and exposure prevents further action.
To overcome these obstacles, a joint EU-wide professional organisation is needed to promote and monitor progress in producing adequate and free access (eco-) toxicity information on existing chemicals, and substances that fall into special categories, such as biocides, pharmaceuticals, etc. A recent study recommended improving the integration of the myriad of directives and regulations. The aim was to clarify definitions, provide clear guidance on the determination and weighing of advantages and implications of risk reductions measures and to develop tools, including voluntary agreements, to speed up the slow chemical-by-chemical approach [Van Leeuwen et al., 1996].
1.2 Methodology
The environmental risks of PM10, selected HMs and selected POPs were evaluated following a Driving forces − Pressure − State − Impact − Response (DPSIR) analysis. The Driving forces and the subsequent Pressure in terms of the emissions to air were determined first (PM10, Cd, Cu, Pb, Hg, dioxins/furans, PAHs, benzene and the pesticides atrazine, endosulfan, lindane and pentachlorophenol). Results of such calculations at the national level are presented in section 1.3. Urban emissions are discussed in a separate section on human health and air pollution (see section 2 of this technical report). Section 1.3. also briefly discusses European-scale deposition for some selected HMs (Cd, Cu, Pb), and POPs (dioxins/furans, atrazine, endosulfan, lindane, PCP) (State). In addition, exceedances of critical loads for accumulation of HMs (Cd, Cu, Pb) in forest soils are evaluated 3 (Impact). Human exposure to selected air pollutants (PM10, B(a)P, benzene, Pb) is dealt with in a separate human health and air pollution section (see section 2.). Impacts of HMs and POPs on non-forest ecosystems have not been assessed.
1.2.1 Emissions
1.2.1.1 Methodology for emission calculation
Pollutant definitionFor PAHs only a limited set of indicator components have been studied: benz(a)pyrene, benzo(b)fluoranthene, benzo(ghi)perylene, benzo(k)fluoranthene, fluoranthene, indeno(1,2,3-c,d)perylene. These six are known as the '6 Borneff PAH'. In the case of PCB either all PCB (when dealing with leakage) or six indicator PCB (PCB 28, 52, 101, 118, 153 and 180) have been selected. Emissions of different congeners of dioxins/furans are given in toxicity equivalents (TEQ) in comparison to the most toxic 2,3,7,8-tetrachloordibenzo-p-dioxine (2,3,7,8-TCDD) using the system proposed by the NATO Committee on the Challenges of Modern Society (NATO-CCMS) in 1988. PM10 are defined as particles with a diameter less than 10 µm that can follow the inhaled air into the respiratory system and the lungs
1990
Emission estimates for the base year 1990 have their origin in emission inventories carried out earlier by TNO (Visschedijk et al., 1998; Berdowski et al., 1997a,b). Emissions for selected HMs and POPs are based on a European emission inventory carried out within the framework of OSPARCOM, HELCOM and the UN-ECE (Berdowski et al., 1997b). This inventory was based on emission estimates produced by the countries themselves. However, if these data were not available default TNO-estimates were used.
Emissions for PM10 are based on a European inventory carried out within the framework of a Dutch research program on PM10 (Berdowski et al., 1997a). PM10 emissions were estimated using country statistics and a default set of emission factors. Due to information lacking, this study could only make a general distinction between emission factors for Western Europe and Central/Eastern Europe; no further distinction in country-specific emission factors was made.
In the study prepared by TNO, emission estimates for 1990 were partly revised by RIVM4. Total EU 1990 emissions for Cu, Cd, Pb, PAHs (and future trends) turned out to be dominated by one single sector in a particular country. Emissions for copper, cadmium and lead were dominated by the 'other transport' sector in Spain, and emissions for PAHs by combustion in 'the residential, commercial and other' sector in France. Since such figures seemed unlikely, it was decided to bring those high figures in line with much lower emissions reported for other countries. PM10 emissions for agriculture were revised on the basis of new knowledge on the emissions from livestock stables. Details are presented in Appendix D.
2010
The Baseline scenario (BL) has been reported by the European Environment Agency (EEA, 1999). It was based on the socio-economic and energy scenario described in this study (see Technical Report on Socio-Economic Trends, Macro-Economic Impacts and Cost Interface for details of these scenarios). Results of the work done by TNO and
3 The critical load of a heavy metal equals the load causing a concentration in a compartment (soil, soil solution, groundwater, plant etc.) that does not exceed the critical limit set for that heavy metal.
methodological aspects have been reported in a separate background document for this study prepared by TNO (Visschedijk et al., 1998).
As mentioned earlier, emission projections prepared by TNO were revised by RIVM for the following substances: PM10, Cu, Cd, Pb and PAHs. Details on these revisions are presented in Appendix D. In addition, RIVM calculated the spill-over effects of policy actions in the field of acidification. These were not reflected in the
TNO-calculations.
Effects and costs of possible further emission control options for hazardous substances have been estimated by TNO on the basis of the results of earlier TNO studies performed for the Dutch Government in the framework of the UN/ECE HM and POP protocols (Berdowski et al., 1997c and 1998).
Spatial allocation
For the purpose of atmospheric transport modelling it is neccessary that results of the inventories and projections, calculated on a country level, are spatially distributed. Therefore, national emissions (calculated per detailed source category) have been allocated to point and/or area sources based on stored information in the TNO-databases (Visschedijk et al., 1998). Emissions from power generation and waste incineration have fully been treated as point sources. The major part of combustion and process emissions from industry (SNAP3 and SNAP4) have also been treated as point sources; remaining industrial emissions have been treated as diffuse sources and distributed according to population density. Emissions from residential, commercial and institutional combustion (SNAP2), solvent use (SNAP6), road transport (SNAP7) and other transport (SNAP8) have been treated as area sources and distributed according to population density. Agriculture related emissions (SNAP 10) have been treated as area sources and allocated according to the distribution of arable land.
Results have been prepared for air quality modelling as point and area source emission data per UN/ECE-source category (SNAP90 level 1). The resolution used for area sources was 10 x 0.50 longitude-latitude grid.
1.2.1.2 Uncertainties in emission estimates
The uncertainty in emissions varies per substance, source category and region or country in Europe. The available data for emissions of PM10, HM and POP do not enable an in-depth uncertainty analysis. However, based on mainly TNO-work an effort was made to give a first order quantitative indication of uncertainties (Berdowski et al., 1997a and 1997b; Wesselink et al., 1998). Uncertainty factors presented apply in principle to the baseyear 1990 and the country level, and should only be considered as an indication of the degree of uncertainty. An uncertainty factor of 4 indicates in this study that there is a 95% chance of the real value deviating by no more than a factor of ¼ (25%) or 4 (400%) from the estimated value.
PM10
Unknown PM10 sources
The bulk of the anthropogenic PM10 sources are expected to find inclusion in this study. However, some potential sources for which almost no information is available have not been considered. Such sources are resuspension of dust due to the motion of vehicles along the road, agricultural activities (blown-up dust from bare agricultural land areas, land preparation and harvesting), mining and quarrying, and finally, construction sites. Emissions of natural sources have not been estimated in this study. Important natural sources may be blown-up dust from non-cultivated land, sea-salt and biological particles such as pollen grains, fungal spores, bacteria and viruses (QUARG, 1996). Results from the Dutch research programme on particulates show that computed concentrations of PM10 (primary plus secondary) explain only 50 (rural) to 75% (industrial areas) of measured concentrations (Bloemen et al., 1998). The observed gap in concentration levels is assumed to be partly explained by unknown sources described above.
Known PM10 sources
Knowledge about the emissions of known sources is also limited. For known sources, uncertainties in emission estimates are large. National emission totals for PM10 have been calculated by TNO on the basis of a generalised set of default emission factors (one set for Western European countries and one for Central/Eastern European countries). Therefore, when interpreting uncertainty figures it should be realized that uncertainty factors given here not only reflect the uncertainty within a country but also the scatter in emission factors between countries (due to differences in techniques and control measures).
The largest uncertainties exist for emissions from 'industrial processes' and 'stationary fuel combustion in the energy sector and industry' (at a factor 4). Emission estimates for 'road transport' (exhaust emissions), 'waste incineration', 'residential, commercial and institutional combustion' and 'agriculture' (stables) are expected to be more accurate (at a factor 1.5 to 2).
• Unfortunately, exhaust road transport emissions (25% of the EU total in 1990) have been systematically overestimated in this study due to methodological reasons (at a factor 1.25 for 1990 to 1.03 for 2010) (see appendix D for details). Disregarding this methodological error which is typical for this study only, exhaust emissions to air from road transport are relatively accurate and well known (uncertainty at a factor 1.3). • Stationary combustion emissions for the energy sector and industry (34% of the EU total in 1990) depend
highly on the type of emission control applied. However, with a few exceptions no exact information about the type and degree of emission control in distinct EU-countries was available. Therefore default emission factors were used on the basis of information from the United States (EPA, 1995) and Germany (UBA, 1989). It is difficult to give quantitative indications of the representativeness of these emission factors for the 1990 behaviour of sources in individual EU countries. However, an indication may be given of the reliability of emission estimates. A tentative uncertainty at a factor 4 may be assumed. In addition, it should be noted that emissions probably have been overestimated for countries such as Germany and the Netherlands, both situated at the top end of the EU emission control spectrum (ERM, 1996).
• Emissions from industrial processes (18% of the EU-total in 1990) highly depend on the type and degree of emission control. Generalised emission factors have been used mainly on the basis of information from the Dutch emission inventory. Emissions are probably underestimated because the Dutch emission inventory (1997 database) underestimates the difuse emissions caused by ventilation of industry buildings. A tentative uncertainty at a factor 4 may be assumed.
• Emissions from residential and institutional combustion (18% of the EU-total in 1990) are largely
uncontrolled. Uncertainty is therefore less than for other stationary combustion sources. A tentative uncertainty factor of 2 may be assumed. This uncertainty is largely associated with uncertainties in the amount of wood combusted in households in different countries as well as in applied emission factors.
• Emissions from waste incineration (4% of the EU-total in 1990) are based on a comprehensive study on dust emissions from Western European countries for the year 1990 (Rijpkema, 1993). An uncertainty factor of 1.5 may be assumed (Berdowski et al., 1997a).
Other pollutants
For heavy metals (HM), a tentative uncertainty at a factor 1.5 may be assumed for North Western European countries. For Central/Eastern European countries, the uncertainty in heavy metals emissions is expected to be larger (at a factor 3.5), and for Southern European countries a value in between is assumed to be applicable (Berdowski et al., 1997b).
The uncertainty in national emission estimates for PAHs within Europe is assumed to range from 2 to 5 depending on the country, mainly because of the uncertainty of domestic (wood) fuel consumption data, and of national activity statistics and composition data related to wood preservation.
For dioxins/furans, the uncertainty in emission estimates for European countries is assumed to range from a factor 5 to 20 dependent on the country (Berdowski et al., 1997b).
The uncertainty of emission figures for PCBs is large due to the fact that they are based on limited number of measurements. An uncertainty factor of 10 may be assumed although the fairly good agreement of calculated concentrations with measurements indicates that the uncertainty of estimates is probably smaller (Baart et al., 1995).
For pesticides, the uncertainty in national emission estimates is also quite large ranging from a factor 2 to 5, mainly explained by incomplete usage statistics, limited knowledge on application methods and the use of emission factors which are partly based on extrapolations from chemically related substances.
1.2.2 Atmospheric transport and deposition
1.2.2.1 Methodology for calculating transport and deposition
The general concept of the atmospheric transport models EUTREND and EUROS centres on the concentration of substances in air being calculated from its emissions and subsequently transported by the mean wind flow and dispersed by atmospheric turbulence. Meanwhile, the substance is removed from the atmosphere by dry and wet deposition and (photo-)chemical degradation.
EUTREND
Heavy metals, dioxins/furans, B(a)P and atrazine were calculated with the EUTREND model (Van Jaarsveld 1995), used in many studies on the deposition of contaminants over Europe and the seas forming its borders (Warmenhoven et al., 1989; Van den Hout et al., 1994; Van Jaarsveld et al., 1997). Recently, the EUTREND model has been used for the calculation of the depositions of heavy metals to the convention waters in the
framework of OSPARCOM (Van Pul et al., 1998). The model also participated in the model intercomparison study carried out by EMEP/MSC-E (Sofiev et al., 1996).
In the model the dispersion and advection at a long range are described using trajectories assuming a well-mixed boundary layer, while local transport and dispersion is described with a Gaussian plume model. The latter describes the air concentration as a function of source height and meteorology-related dispersion parameters but, in the case of high stacks, it also allows for (temporary) transport of pollutants above the well-mixed boundary layer.
Transport and deposition of particles is calculated separately by the model for five different size-classes separately, each with specific deposition parameters. Particle growth is not incorporated in the model but is implicitly assumed to take place in the lowest size-class (d < 10m). The particle size distribution which has to be specified is the distribution of the particles as they are primarily emitted. As the larger particles tend to be removed faster than small particles, the actual size distribution is a function of transport distance and hence also of the effective deposition velocity. Size distributions used in this study, based on measured values in the Netherlands, are taken from Van Jaarsveld et al., (1986).
The deposition velocity is also a function of the roughness of the receptor area. The deposition velocity above grass, which is the dominant land cover, is taken for use in the EUTREND model domain. However, the deposition velocity above forests is considerably larger i.e. typically a factor of 2 to 3 (Ruijgrok et al., 1994). Therefore adjustments using a factor 2 and 3 of the deposition to forests were made to the original calculations of the deposition.
EUROS
The pesticides endosulfan, lindane and PCP were calculated with the EUROS model. EUROS is an Eulerian atmospheric transport model which describes the advection and dispersion of substances in the lower troposphere. This model has been used for acidification and ozone calculations (De Leeuw and Van Rheineck Leyssius, 1990; Van Loon, 1996) and has recently been extended to describe the deposition of persistent organic pollutants (POP) as well (Jacobs and Van Pul, 1996). Part of this model development is carried out in coöperation with MSC-E of the UN-ECE/EMEP framework.
Since many POP are semi-volatile at atmospheric conditions they may be re-emitted from the soil and water surfaces where they have been deposited. Due to the deposition and re-emission cycling of POP, the description of the deposition process generally used for components which only deposit, such as most acidifying components and heavy metals, cannot be applied. Instead, deposition should be considered as a net deposition, i.e. the sum of the deposition and re-emission fluxes. For this reason, a dynamic model which describes the gaseous exchange of POP at soil and sea surfaces (dry-deposition and re-emission) was coupled to the EUROS model (Jacobs and Van Pul, 1996).
1.2.2.2 Uncertainties in depositions
The uncertainties in modelling depositions of HMs and POPs are very large, particularly for POPs. The total uncertainty in the deposition calculations is caused by:
b) uncertainties in substance-specific parameters, c) uncertainties in emissions.
Ad a) This includes all the processes relevant in describing dispersion and deposition. Such general aspects can be tested using the model for substances such as SO2, for which much more reliable data (emissions and
measurements) are available. This type of uncertainty is expected to be relatively small (in the order of ± 30% for the deposition on a yearly basis). The range in the deposition data due to different meteorological conditions is also included in this figure.
Ad b) The choice of deposition parameters has a great impact on the calculated deposition. The dry and wet deposition rates of the HM are highly dependent on the particle size. The uncertainty of the particle size distribution of the emitted compounds could cause a range in the deposition of 30-50%.
For POP, the dry and wet deposition rates are also dependent on the physicochemical properties of the substance and properties of the receiving surface. The uncertainty in the yearly deposition data is estimated at a typical factor of 2.
Ad c) The uncertainties in the emissions are large as has been discussed in section 1.2.1.2.
A comparison between calculated and measured heavy metal concentrations in air (EMEP/CCC and
OSPAR/CAMP networks) showed, in general, a good correlation (R2 = 0.6-0.7) close to the 1:1 line. Practically all calculated depositions are within a factor of 2 of the measurements. However, for Cd and Pb two distinct regions in concentration levels are found: lower values in NW Europe (coastal stations) and higher values in Central Europe. For Cd, this means that the calculations underestimate the measurements by a factor of 2. This was also found in the study on deposition to the Convention Waters of OSPARCOM (Van Pul et al., 1998).
PAH and dioxins/furans do not form part of any monitoring programme in Europe. Therefore very limited measurement data (mostly urban and data for campaigns) are available to check the model results on a European scale. Van Jaarsveld and Schutter (1993) and Van Jaarsveld et al., (1997) have carried out a validation of their EUTREND model calculations for B(a)P and dioxins using soil data and some national monitoring data. They concluded that the agreement between modelled and calculated levels, in general, was fairly good. For B(a)P concentrations were found to be underpredicted in remote areas and overpredicted in industrial areas. Since the same model is used in this study, deviations from the above findings will be mainly due to a difference in emission data.
Of the pesticides only for lindane are a few measurements available from the EMEP/OSPAR network (Nordic countries and locations round the North Sea). This comparison between model calculations and methods showed calculations to approximately overestimate the measurements by a factor of 3. For endosulfan and PCP no data could be found. Since both substances have similar physicochemical properties to lindane, it is expected that the uncertainty in the results will be in the same order of magnitude as for lindane, i.e. where the uncertainty in the emissions is not taken into account. Previous calculations for atrazine showed the EUTREND modelled concentrations to be seemingly in reasonable agreement with measured data (within a factor of 2 of 3) in the Netherlands and Northern Germany (Baart et al., 1995).
1.2.3 Critical loads
1.2.3.1 Methodology for calculating critical loads
The critical loads for cadmium, lead and copper were calculated with both a steady-state and simple dynamic approach as described in detail by De Vries and Bakker (1998). Critical loads are computed on the basis of either: • critical dissolved metal concentrations, since these criteria are good indicators of ecotoxicological effects.
Using this steady-state approach implies that adsorption and complexation descriptions are not needed, and that critical load is mainly dependent on hydrological and vegetation data.
• a simple dynamic approach in which the accumulation up to a given critical metal content in the soil is accepted in a finite period (100 years) as preferred to an infinite period (steady-state approach). This approach, which implies the use of metal content present, may be regarded as one of the methods to derive target loads.
At the Bad Harzburg workshop it was recommended to calculate the target loads using the simple dynamic approach for a time frame of 50-100 years and the steady-state critical loads for infinity.
In this study all critical load maps were calculated with the simple dynamic approach using a time frame of 100 years.
1.2.3.2 Uncertainties in critical loads
Various sources of uncertainty in deriving critical loads exist, namely critical limits, calculation methods and input data. Uncertainties due to differences in critical limits can be very large. Uncertainties in calculation methods due to assumptions, such as equilibrium partitioning in a homogeneously mixed system, may give rise to a high uncertainty in certain situations. The uncertainty in data, either by spatial variability or because of lack of knowledge, can be quantified through an uncertainty analysis. Such an analysis, which also gives insight into which parameters are main determinants of the uncertainty in the resulting critical load, has been performed for cadmium and copper (Groenenberg 1999, in prep.). This uncertainty analysis was carried out for critical loads calculated with (i) a steady-state model, using background concentrations in the soil solid phase as critical limits and (ii) a simple dynamic model, using effect-based critical concentrations in the soil solution, including an acceptable net accumulation in the soil. Results showed that parameters describing the adsorption are generally of importance for both cadmium and copper, and both types of models and critical limits. Additionally, complexation plays a dominant role for copper, whereas hydrological parameters are important for cadmium, especially when using a dynamic model combined with a critical limit for the soil solution.
1.3 Results and analysis
1.3.1 Emission scenarios
1.3.1.1 Outline emission scenarios
The primary objectives of the emission calculations performed are:
• to assess future trends in emissions of primary PM105 and selected HMs and POPs based on existing EU and ECE policies, and to compare these baseline trends with emission targets insofar as such targets have been set,
• to assess spill-over effects of policy action in the field of climate change (Kyoto targets) and acidification (commission proposal for a EU National Emission Ceilings Directive 1999c),
• to address further policy measures for emissions control of primary PM10 and selected HMs and POPs. Three principal emission scenarios have been assessed in this study (see Box 1.2). Making use of a 1990-2010 timeframe, future trends in emissions under current legislation were assessed in the baseline scenario (BL), while the technology-driven scenario (TD) assumes full penetration of advanced end-of-pipe emission control technologies, such as high efficiency electrostatic precipitators, fabric filters and highly efficient wet
scrubbers. The accelerated policy scenario (AP) takes into account the effects of accelerated policy action on climate change (Kyoto targets) and acidification (commission proposal for a EU NEC Directive, 1999c). Advanced end-of-pipe technologies to reduce emissions of PM10 and selected HMs and POPs are considered in the AP-scenario also6. Assessed control options are presented in detail in section 1.3.1.2.
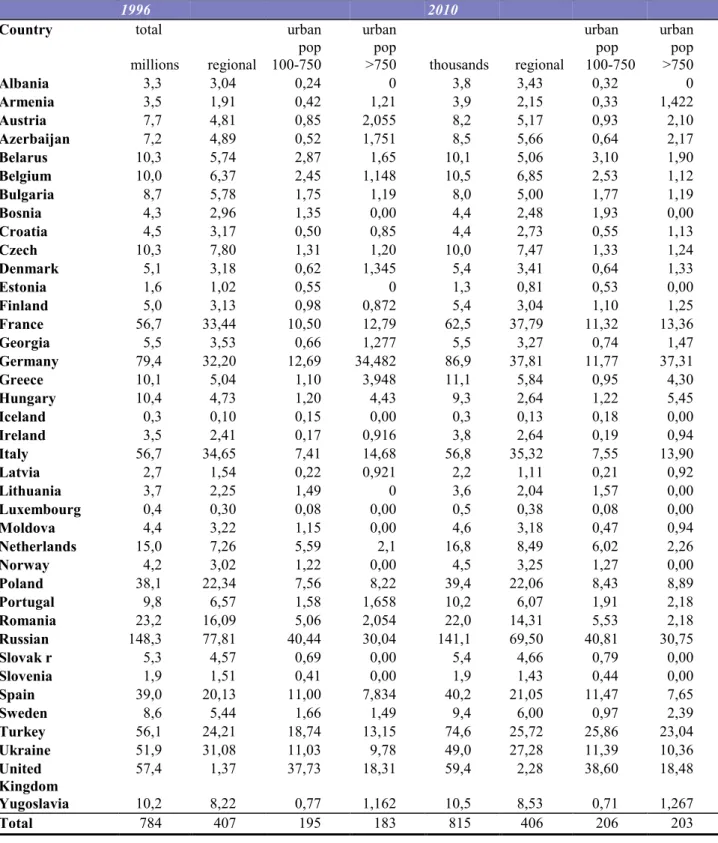
Calculations have been performed at the country level. A description of projected baseline changes to basic socio-economic parameters such as population, GDP growth and energy consumption is presented in Technical Report on Socio-Economic Trends, Macro-Economic Impacts and Cost Interface. The scenarios BL and TD are based on the 'pre-Kyoto Business-as-Usual' energy scenario (BAU). The AP-scenario is based on the 'post-Kyoto no-trade' energy scenario. For this 'post-Kyoto no-trade' energy scenario it was assumed that the provisions of the Kyoto protocol are met assuming no-trade in GHG emissions. Details incl. costs concerning assumed control measures for the attainment of Kyoto protocol targets and NEC-targets are evaluated in the context of technical reports climate change and acidification respectively.
5 Particles with diameter less than 10 µm (<0.01 mm) that can follow the inhaled air into the respiratory system and the lungs
6 For the macro-economic feedback only costs involved with PM emission control have been taken into account.
The 'post-Kyoto no-trade' energy scenario differs substantially from the 'pre-kyoto BAU' scenario. For the EU total primary energy supply for the 'post-Kyoto no-trade' energy scenario is about 10% decreased when compared to BAU (6700 PJ); consumption of coal and oil (for energy purposes) falls by 46% (3100 PJ) and 16% (4200 PJ), respectively, and consumption of gas (for energy purposes) is more or less unchanged. The use of other fuels such as waste and biomass rises about 30% (700 PJ).
Under the AP-scenario, spill-over effects from policy action on climate change and acidification were analysed separately from the effects of full application of advanced abatement technologies for control of PM10 and selected HMs and POPs. Results of the spill-over calculations are presented as separate scenarios in this background report (see box). The Spill-Over Kyoto Protocol scenario (SO-KP) considers spill-over effects of Kyoto protocol targets only. The Spill-Over scenario (SO) considers effects of Kyoto Protocol targets as well as NEC emission targets for acidification as specified in the commission proposal (1999c).
1.3.1.2 Control measures
Control measures included in the various scenarios will be overviewed here.
Hazardous chemicals are largely emitted in solid form adsorbed onto particles and thus may be effectively controlled by dust arresters such as electrostatic filters, fabric filters and scrubbers. This applies to most heavy metals. However, a substantial amount of mercury is emitted in the vapour phase, just like organic pollutants such as dioxins/furans and PAHs. To minimize the emissions of these partly gaseous pollutants, special techniques should be installed in addition to dust arresters.
Dust emissions may be reduced by improved operation of the combustion or production process, or by cleaning of the flue gas. Cleaning of exhaust gases by some type of dust arrester is common practice in coal combustion in power plants and industry, and also in many industrial production processes. Oil-fired
installations in power plants and industry are, in general, not equipped with any dust cleaning device as is the case for firing devices in the 'residential, commercial and institutional' sector and motor engines. Dust emissions by municipal waste incineration are generally effectively controlled within the EU, although in some EU countries7 significant amounts of municipal waste are incinerated without an any type of emission control (Berdowski et al., 1997a,d). However, the situation in these countries is improving thanks to current EU legislation.
It should be noted that measures to reduce emissions of acidifying compounds, such as desulfurization processes and low-S fuels, also have substantial side-effects on emissions of particulates and adsorbed chemicals.
7 France, Italy, Spain, United Kingdom
Box 1.2.: Emission scenarios
The Baseline scenario (BL) is based on the Business-As-Usual socio-economic scenario presented in Technical background report 11, assuming the continued implementation of existing EU policies as of August 1997. All measures or policies agreed upon after that date are not included in the Baseline scenario. Furthermore, spill-over effects resulting from the continued post-1990 implementation of current policies in the field of acidification have not been considered in this scenario.
The Technology Driven scenario (TD) assesses maximum feasible emission reductions in the year 2010, assuming full application of advanced end-of-pipe emission control technologies for particulates, HMs and POPs, against the background of the BAU-scenario.
The Spill-Over Kyoto Protocol scenario (SO-KP) has been developed to assess the spill-over effects of policy action on climate change i.e. Kyoto Protocol targets, assuming no trade in GHG emissions. Spill-over effects have been assessed by repeating BL-calculations using a 'post-Kyoto no-trade' energy scenario, keeping all other socio-economic parameters unchanged.
In addition, a Spill-Over scenario (SO) has been developed to assess spill-over effects of policy action on climate change as well as on acidification. This scenario incorporates Kyoto Protocol targets as well as proposed EU
Baseline scenario (BL)
BL: stationary sources
• Large Combustion Plants Directive (EC, 1988, 88/609/EEC); emission limits are 50 mg/Nm3 for dust for new (post-1987) combustion plants > 500 MWth and 100 mg/Nm3 for new combustion plants between 50 and 100 MWth.
• The majority of utility and industrial combustion plants in the EU already complied with these dust emission limit values in 19908 (Berdowski et al., 1998). Thus, there is no legal obligation to reduce dust emissions further. Nevertheless, it may be expected that dust emissions from large combustion
installations will decline substantially in the period 1990 to 2010 due to spill-over effects of SO2-related control measures (SO2 emission standards). Such spill-over effects are not included in the baseline scenario.
• Municipal Waste Incineration directives for existing installations (EC, 1989b, 89/429/EEC) and for new installations (EC, 1989a, 89/369/EEC): general emission limit values of 30 mg/Nm3 for dust and 0.2 mg/Nm3 for mercury have been applied. For dioxins/furans a limit value of 0.1 ng I-Teq/Nm3 has been used in line with the Commission proposal for the amendment of current waste incineration directives9 (EC, 1999a).
• EURO-CHLOR emission reduction programme for the chloro-alkali industry.
The organisation of chlorine producers has developed a programme of voluntary measures to control mercury emissions which implies a specific emission of mercury of 1.5 g Hg/tonne chlorine-producing capacity by 2010 (Berdowski et al., 1998).
• Decreases in S-content of heavy fuel oil in oil refineries: a 40% reduction in the 1990 emission factor has been assumed (Visschedijk et al., 1998).
BL: mobile sources
• Compliance with EURO-3 particulates emission standards (phase-in from 2000) has been assumed for passenger cars, light-duty vehicle and heavy-duty vehicles. A lifetime of 10 years has been assumed for all vehicles.
Technology Driven scenario (TD) TD: stationary sources
• High performance 4-field electrostatic precipitators have been assumed for coal and biomass combustion in the 'Public power, cogeneration and district heating' and 'Industrial combustion' sectors, with an assumed particle concentration in the flue gas of 20 mg/m3 (Visschedijk et al., 1998).
• Electrostatic precipitators have been assumed for heavy fuel oil combustion in the 'Public power, cogeneration and district heating' and 'Industrial combustion' sectors.
• Combustion systems with optimised burning rates have been assumed for coal and biomass combustion in the 'Residential, Commercial and Institutional combustion' sector, with an assumed overall abatament efficiency of 25% (UN/ECE, 1998b; Hulskotte et al., 1999).
• For reducing dust emissions from industrial processes10, many different control measures such as high performance electrostatic precipitators, fabric filters, and highly efficient wet scrubbers combined with waste gas collection systems have been assumed. In addition, specially designed techniques have been assumed for the control of gaseous emissions (Visschedijk et al., 1998; Berdowski et al., 1997c; 1998). • For municipal waste incineration, emission standards have been assumed to be in line with the proposal for the amendment of current EU waste incineration directives: emission limit value of 10 mg/Nm3 for dust 11 , 0.05 mg/Nm3 for mercury and 0.1 ng I-Teq/Nm3 for dioxins/furans (EC, 1999a).
• A full switch to PAH-free techniques for wood preservation has been assumed.
8 With the exception of 'industrial combustion' and 'industrial processes' in southern Europe (Spain, Greece, Italy and Portugal) which in 1990 did not fully comply with requirements of the Large Combustion Plant Directive for dust.
9 Strictly speaking, the emission limit value for dioxins/furans of 0.1 ng I-Teq/Nm3 should not be accounted for in the Baseline because this standard had not yet been decided on by the EU per August 1997.
10 Non-combustion related emission sources in ferrous, non-ferrous, cement, glass, chloro-alkali and the oil refining industry.
11 TD-scenarios for waste incineration are by mistake based on a dust standard of 30 mg/Nm3 (=BL-value) although the stricter TD-value of 10 mg/Nm3 should have been used. However, effects on presented results are negligible.
TD: mobile sources
• Compliance with EURO-4 particulates emission standards (phase-in from 2005) has been assumed for passenger cars, light-duty and heavy-duty vehicles
• Particulates emission standards in compliance with EURO-2 for heavy duty vehicles have been applied for vehicles in the off-road transport sector.
Spill-over Kyoto Protocol scenario (SO-KP)
In addition to control measures listed for the BL scenario, the SO-KP scenario incorporates spill-over effects from policy action on climate change i.e.:
• Kyoto targets for reduction of GHG emissions, assuming no trade in emissions. Spill-over scenario (SO)
In addition to spill-over effects from climate change, the SO-scenario incorporates spill-over effects from acidification (commission proposal for a National Emission Ceilings Directive, 1999c) i.e.:
• Limit sulfur content in heavy fuel oil to 1% (EC, 1999b).
• Spill-over effects are caused by the continued (post-1990) penetration of flue gas desulfurization techniques (FGD) on coal combustion in the 'Public power, cogeneration and district heating' and 'Industrial combustion' sectors. Spill-over effects have been calculated on the basis of IIASA estimates for the penetration of FGD technology in the separate EU countries in the years 1990 and 2010 (see Technical report on acidification); with particle concentration levels in the exhaust gas -without and with FGD - of resp. 50 and 20 mg/Nm3 (EEA/EMEP, 1996).
• A realistic turnover rate of 10 years has been modelled for passenger cars, light-duty and heavy-duty vehicles. Thus, half the vehicle fleet is anticipated to satisfy EURO-4 emission standards (phase-in from 2005) in 2010; the other half is anticipated to comply with the less stringent EURO-3 standards (phase-in from 2000).
• Particulates emission standards complying with EURO-2 for heavy duty vehicles have been applied for vehicles in off-road transport sector.
Spill-over effects caused by by an EU limit of 0.1% for the sulphur content of gasoil for stationary sources (directive on sulfur in liquid fuels) is not reflected in the AP-NT scenario, because of a lack of information on the relationship between S-percentage for gasoil and particulates emissions. However, these effects, based on preliminary calculations using available relationships for heavy fuel oil, are expected to be rather small.
Accelerated Policy scenario (AP)
The AP scenario projects emissions, taking into account the effects of policy action on climate change and acidification. High performance technologies to reduce emissions are considered also (see list of control measures mentioned above for the TD-scenario).
1.3.2 Emissions and costs EU
This section on emissions and costs starts with a brief general analysis of the formation and emissions to air of primary PM10 and selected HMs and POPs. Next, main anthropogenic source sectors in 1990 are assessed. Finally, results for the calculated emission scenarios are discussed.
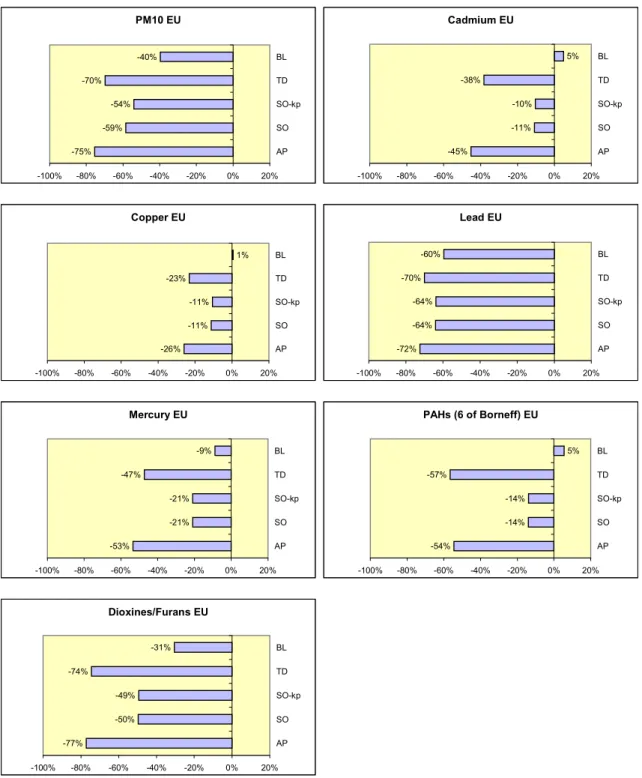
Emission tables for the base year 1990 and different scenarios are presented for the EU-region in Appendix A-1. For PM10, emissions are also presented by country (see Appendix B-1). Figure 1.1. illustrates the
differences between scenarios for the EU-region in terms of percentage emission reduction in 2010 compared to 1990. A further analysis of results is presented in figures 1.2. to 1.4.. These figures illustrate for the EU resp. the contribution of sectors to emission totals in the year 1990 and 2010, the importance of various source categories for overall emission trends in the period 1990 to 2010 and the sectoral emission changes in this period)
Origin of emissions
Heavy metals are present in trace amounts as a natural element of fossil fuels and biomass, and raw materials such as iron, zinc, copper and lead ores. Consequently, combustion and industrial processes are, in principle,
important potential emitters of heavy metals. Furthermore, metals are used in a variety of products such as pigments, batteries, fuel additives and fertilisers. These products end up in the waste stream and may ultimately be disposed of by incineration, giving rise to air emissions. Emission rates of heavy metals are determined by the content of trace elements in the fuels or wastes combusted or the raw materials processed, by the applied combustion or production technology, and by the efficiency of the emission control equipment (dust abatement and specific techniques for capturing gaseous heavy metals).
The heavy metal content (expressed in terms of energy content of the fuel) for lead, copper and mercury is on average one order of magnitude higher in coal than in oil. Cadmium content of coal and oil are more
comparable (EEA/EMEP, 1996). Heavy metal content of natural gas is negligible.
Dioxins/furans are emitted from thermal processes involving organic material and chlorine-containing substances as a result of incomplete combustion or chemical reactions. Dioxins/furans are emitted for the larger part in the vapour phase, but also partly adsorbed onto dust particles. Approximately 80% of
dioxins/furans is emitted in the gaseous phase at temperatures above 300 oC, while 90% is adsorbed onto dust particles at temperatues below 70%.
Emissions of PAHs are the result of incomplete combustion of fossil fuels, waste materials and other fuels such as biomass, and the use of PAH-containing coal-tar products for wood preservation.
1.3.2.1 EU: base year 1990
Source categories used for this study are consistent with level 1 of the UN/ECE-source category classification (SNAP90; EEA, 1995; EEA/EMEP, 1996). Only the treatment of refineries is different from SNAP90; i.e. emissions for refineries have been fully accounted for in SNAP-sector 4 'production processes'. The following source categories have been distinguished in this study (with corresponding SNAP90 codes in parentheses and deviations from SNAP90 in italics):
• Public power, cogeneration and district heating (01) • Residential, Commercial and Institutional (RCO) combustion (02) • Industrial combustion (excl. combustion in petroleum industries) (03) • Production processes (incl. combustion in petroleum industries) (04) • Extraction and distribution of fossil fuels (05)
• Solvent use (06)
• Road transport (07)
• Other mobile sources and machinery (08)
• Waste treatment and disposal (09)
• Agriculture (10)
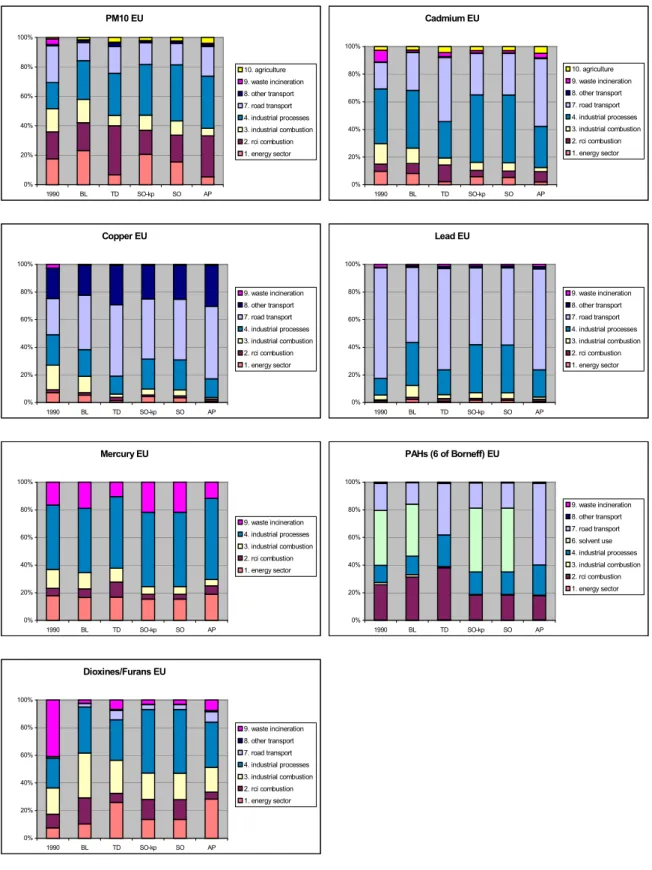
The contribution of various UN/ECE-source categories to total EU emissions in 1990 is illustrated in figure 1.2. and will be briefly discussed below for the various compounds.
• Particulate matter (<10 µµµµm)
PM10 emissions in EU countries are caused by different source categories, the most important sectors being combustion in the energy and industrial sectors (SNAP1/3 − 34% of EU-total), combustion in road transport (24%), combustion in households and services (SNAP2 − 18%) and industrial production processes (SNAP4 −18%).
Emissions from combustion in stationary sources is mainly due to coal (70%). Oil and other fuels (such as biomass) contribute 19% and 10%, respectively.
Emissions from industrial production processes are mainly due to the ferro and non-ferro industry (43%) and oil refineries (43%).
In interpreting the PM10 results of this study, it should be realised that available information on non-exhaust emissions by road transport is very scarce. The magnitude of non-exhaust PM10 emissions in this study forms only 5% of total road transport emissions (see Appendix D). Non-exhaust is specified here as tyre, brake and road wear. Some information is available for these sources, although very scarce. However, in this study, no account is taken of resuspension of dust due to the motion of vehicles along the road.
• Cadmium
Cadmium emissions in the EU are mainly (38%) due to industrial production processes (40%); other significant sources are combustion in the energy sector and industry (25%) and road transport (19%); minor sources are waste incineration (8%) and combustion in households and services (5%).
Emissions by combustion in stationary sources are caused by the combustion of oil (42%), coal (35%) and other fuels, such as biomass (23%). The relative high contribution of oil to total emissions compared to other heavy metals is caused by the relative high cadmium emission factors for oil combustion.
Emissions by industrial production processes are almost completely (95%) due to the ferrous and non-ferrous metal industry.
• Copper
About half the copper emissions come from mobile sources (48%) i.e. road transport (26%) and other transport (22%); other significant sources are combustion in the energy sector and industry (25%) and industrial production processes (26%).
Emissions from stationary combustion sources are mainly due to combustion of coal (68%). Oil and other fuels (such as biomass) contribute 17% and 15%, respectively.
Emissions from industrial production processes are almost entirely caused by the ferrous and non-ferrous metal production industry (98%).
• Lead
Lead emissions are largely (80%) caused by road transport i.e. lead in gasoline; industrial processes represent the other significant source (12%).
Emissions by industrial production processes are almost entirely caused by the ferrous and non-ferrous metal industry (90%).
• Mercury
Mercury emissions are mainly caused by industrial production processes in the non-ferrous metal (17%), cement (15%), chloro-alkali (11%) and iron and steel industries (3%). Other significant sources are combustion in the energy sector and industry (32%), and waste incineration (17%).
Emissions from stationary combustion sources are mainly due to combustion of coal (66%). Other fuels (such as biomass) and oil contribute 30% and 4%, respectively.
• Dioxins/Furans
Emissions of dioxins and furans (PCDD/Fs) are mainly caused by the waste incineration sector (41%). Other sources are combustion in the energy sector and industry (26%), industrial production processes (21%) and combustion in households and services (10%).
Emissions by stationary combustion sources are largely caused by the combustion of other fuels (such as biomass) (45%) and coal (38%). Emissions from oil are less important (17 %).
Emissions by industrial production processes arise mainly from the iron and steel industry (76%), non-ferro industry (12%) and other industrial processes (11%).
• Polycyclic Aromatic Hydrocarbons (PAHs)
Emissions of Polycyclic Aromatic Hydrocarbons (Borneff 6 PAHs) are due to solvent use (39%), combustion in households and services (26%), road transport (19%) and industrial production processes (12%).
Emissions due to solvent use are determined primarily by wood preservation with PAH-containing coal-tar products. Emissions may occur during the impregnation process as well as during storage, handling and use of the impregnated wood. The most widely used coal-tar products are carbolineum and creosote.
Emissions from stationary combustion sources are primarily caused by the combustion of other fuels such as wood (62%) and coal (37%). Emissions from oil are negligible (1%). Furthermore, emissions from stationary combustion
are mainly caused by combustion in households (84%). This is the result of using small firing installations in households that are less optimized than installations used in the energy sector and industry; this leads to more incomplete combustion and thus higher PAH emissions.
About half the emissions from industrial production processes are caused by non-ferrous metals production (52%), mainly in the aluminium industry. Other major industrial sources are the iron and steel industry (23%), primarily coke production, and asphalt road paving companies (26%).
• Polychlorinatedbiphenyls (PCBs)
Emissions of Polychlorinatedbiphenyls (PCBs) are mainly (about 80%) caused by the leaks and spills from closed electrical equipment such as transformers and capacitors. The other major source is re-emission from
contaminated water and soil. The formation of PCBs in high temperature processes (stationary combustion and waste incineration) is relative unimportant in the baseyear 1990.
• Pesticides
Pesticides atrazine and endosulfan are mainly used in the agricultural sector. Pentachlorophenol and lindane are also used by industry for various applications.
1.3.2.2 EU: Baseline scenario for 2010 (BL)
Scope
The Baseline scenario (BL) assesses future trends in emissions under current legislation. The BL is based on the business-as-usual socio-economic scenario (see Technical Report on Socio-Economic Trends, Macro-Economic Impacts and Cost Interface); assuming the continued implementation of existing and proposed EU and ECE policies as of August 1997. All measures or policies agreed upon after that date are not accounted for in the Baseline.
Emission targets have been established for selected heavy metals (HM) and persistent organic pollutants (POP) in the framework of the United Nations Convention on Long Range Transboundary Air Pollution). According to the UN/ECE-protocols on HM and POP (UNECE, 1998a,b) countries are obliged to reduce atmospheric emissions of lead, cadmium, mercury, dioxins/furans and polycyclic aromatic hydrocarbons below the levels in a reference year, most probably 1990 for the EU.
The BL presented does not incorporate spill-over effects from the continued post-199012 penetration of control options in the field of acidification, such as flue gas desulfurization (FGD) techniques on coal boilers in the energy sector and industry (effecting emissions of PM10, HM, POP) and the reduction of the sulfur content in heavy fuel oil to 1% (effecting PM10). Furthermore, the BL only reflects current emission standards laid down in EU directives and ECE protocols13; more stringent national policies for emissions control of particulates, HMs and POPs are not accounted for. This methodology was decided on because detailed national data on a sector basis were not always available. The sectors 'power generation', 'industrial combustion', 'industrial processes' and 'residential, commercial and institutional combustion' are estimated to have already complied with current
international standards in the base year 1990 (Berdowski et al., 1998). Consequently, no future improvement in the emission has been modelled for these categories under the BL. For other major sectors, i.e. 'road transport' and 'waste incineration', 1990 compliance with EU/ECE standards was estimated to be incomplete, making modelling of future reduction in emission factors under Baseline conditions necessary.
The chosen methodology of unchanged emission factors for stationary combustion sources and industrial processes should be considered to possibly lead to an overestimation of future emissions in specific countries with an advanced control strategy for particulates and hazardous substances. More stringent national, regional or local policies such as permitting requirements and national emission reduction agreements with sectors, may lead to reductions in emissions that go far beyond what may be expected based on EU/ECE requirements only.
Assessment and trends
Under current policies, substantial emission reductions are expected by 2010 (compared to 1990) for PM10 (-40%), lead (-60%), dioxins/furans (-31%), and to a lesser degree for mercury (-9%). In addition, emissions of PCBs, PCP
12 Spill-over effects effectuated in the year 1990 are already accounted for in the 1990 emission inventory. 13 Possible effects of the general EU-IPPC requirement to use BAT for major industrial activities have not been taken into account.
and lindane should be almost negligible in 2010 due to current EU regulations14. With such reductions, the EU is likely to meet emission stabilisation targets for these HMs and POPs, as established under the UN ECE CLRTAP Protocols. However, the achievement of emission stabilisation targets for cadmium (+5%), copper (+1%) and PAHs (+5%) is not ensured under baseline conditions15.
The projected downward trend in PM10 emissions results primarily from lower transport emissions and stationary combustion emissions due to respectively stricter emission standards16 and reduced coal use. The phasing out of leaded gasoline explains the substantial reduction in lead emissions expected in 2010. The marked improvement in emission levels of dioxins/furans is explained by the application of efficient flue-gas cleaning technologies in 2010. Reduced coal use and reduced emissions from the chloro-alkali industry, which has adopted an emission abatement programme for mercury emissions, are expected to bring about lower mercury emissions by 2010. Under the BL, small increases in the emissions of cadmium and PAHs are expected due to growth in road transport (for Cd) and higher use of wood fuel in households (for PAHs).
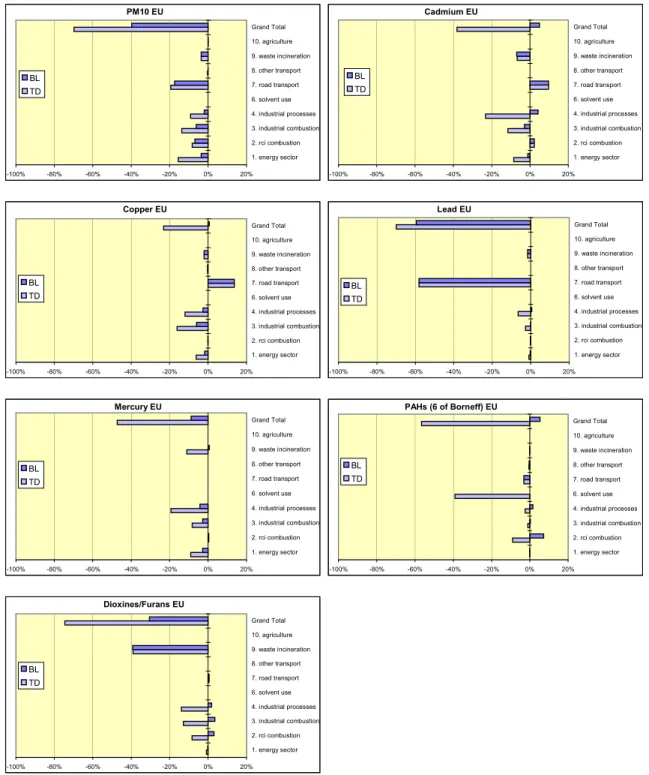
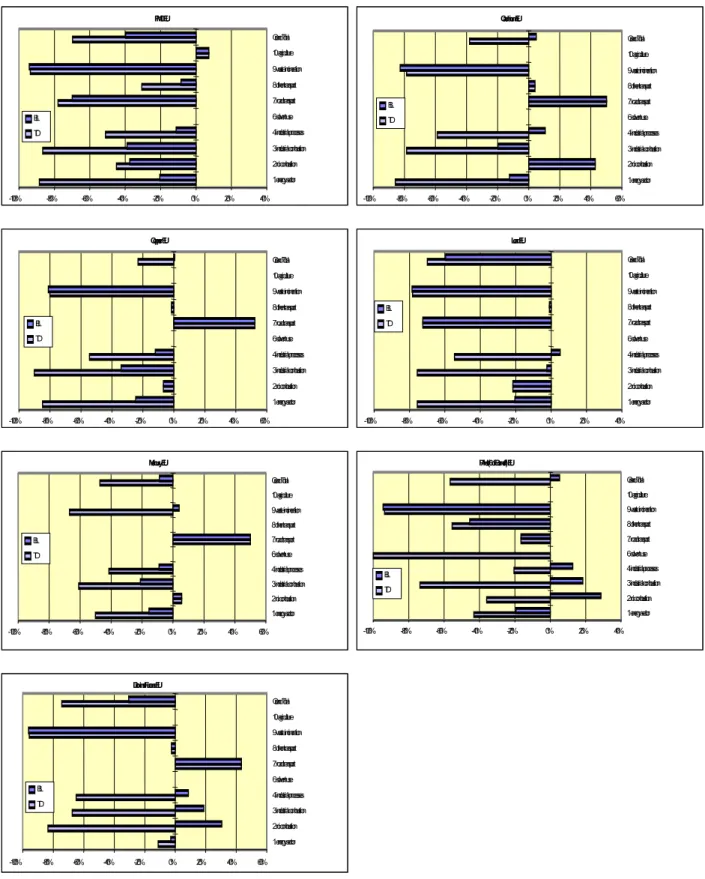
Below, emission changes under current legislation are analysed in more detail in terms of sectoral contributions, and for main sectoral trends in terms of underlying driving forces (i.e. socio-economic developments and control policies). The relevance of various sectors for overall EU-emission trends under baseline conditions is illustrated in Figure 1.3. The change in emissions per sector in the period 1990 to 2010 is presented in Figure 1.4. The
contribution of various sectors to total EU-emissions is illustrated in Figure 1.2. • Particulate matter (<10 um)
Emissions of PM10 are expected to decrease substantially by 2010 compared to 1990 (-40%). The downward trend is explained by lower emissions from road transport and stationary combustion sources (i.e. combustion in the energy sector and industry, and combustion in the 'residential, commercial and institutional' sector). Absolute emission reductions anticipated for both sectors are comparable.
Road transport emissions are anticipated to decrease by 70% by 2010 compared to 1990, in spite of the high increase in volume of passenger and freight transport (37% increase in road transport fuel use). This marked drop in emissions is a result of EU emissions standards for road vehicles being sharpened up.
For stationary combustion sources an emission reduction of 32% is expected; this is due to an anticipated sharp decrease in coal use (-40%). A downward trend in coal use is projected for all stationary combustion categories i.e. energy sector, industry, and households plus services. The use of natural gas (with almost negligible emissions) will increase, oil use will more-or-less stabilise. Although the contribution of other fuels (such as biomass with high emission factors for particulates and also HM and POPs) to total emissions is low, it should be considered that for the sector 'residential, commercial and institutional combustion' the effect of reduced coal use is partly
compensated by increased biomass use. • Cadmium
Cadmium emissions are anticipated to more or less stabilise in the period 1990 to 2010 (5%). The assessment of sectoral trends shows that the projected small increase in Cadmium emissions (5%) is explained by a large increase in emissions for road transport that is largely counterbalanced by a decline in emissions for waste incineration. Emissions from road transport are expected to increase by 50% in the 1990-2010 period due to the increase in the volume of transport. For waste incineration, a decline in the emissions of 83% is projected with the introduction of advanced flue-gas cleaning technologies needed for compliance with EU waste incineration directives.
It should be noted that emissions from road transport reported by TNO and used for this study are largely uncertain. According to the TNO-inventory, the contribution of road transport in total cadmium emissions greatly varies from country to country (from 3% for the UK to 65% for Denmark; 19% for the EU). Based on the UK-inventory, which is well-founded using a survey of cadmium content of various fuels, it can be doubted whether road transport really is a major source of cadmium. If UK-results would be extrapolated to all the other
14 Emissions of atrazine and endosulfan are expected to stabilise.
15 Due to new insights, baseline results in this study were revised for PM
10, Cd, Hg, Cu, PAHs and therefore differ from (EEA, 1999, see Appendix D)
16 New post-2005 EURO-4 emission standards for freight and passenger road transport have not been taken into account in the Baseline scenario; these standards were decided upon in 1998 and have been incorporated in the TD- and AP-scenarios.