International Masters of Science in Environmental Technology and Engineering
EU Erasmus+ Master course organized by
University of Chemistry and Technology, Prague, the Czech Republic IHE Delft Institute for Water Education, Delft, the Netherlands
Ghent University, Ghent, Belgium
Academic year 2018-2020
Effect of biochar on heavy metal
immobilization in contaminated soil
Ghent University
Audrey Lucrece Noumbissi Ngambia
ES-IMETE 20-15
Promotor: Professor Frederik Ronsse Tutor: Dilani Rathnayake
International Masters of Science in Environmental Technology and Engineering
partial fulfilment of the requirements for the joint degree of EU Erasmus+ Master course organized by
University of Chemistry and Technology, Prague, the Czech Republic IHE Delft Institute for Water Education, Delft, the Netherlands
Ghent University, Ghent, Belgium
Academic year 2018-2020
Effect of biochar on heavy metal
immobilization in contaminated soil
Ghent University
Audrey Lucrece Noumbissi Ngambia
ES-IMETE 20-15
Promotor: Prof. Dr. Ir. Frederik Ronsse Tutor: Dilani Rathnayake
Deze pagina is niet beschikbaar omdat ze persoonsgegevens bevat.
Universiteitsbibliotheek Gent, 2021.
This page is not available because it contains personal information.
Ghent University, Library, 2021.
III
Acknowledgment
I want to express my sincere gratitude to God Almighty for life and for protecting and guiding me throughout the two years master program and during the COVID 19 pandemic. I am immensely thankful to the European Commission for granting me the Erasmus + EM partner country scholarship and providing the financial and health care support which permitted me to successfully carry out this two-year IMETE program. I will like to thank the IMETE program organizing institutions for providing the intellectual and technical facilities required to complete this master program and thesis work.
I warmly express my appreciation and gratitude to my supervisor Prof. Frederik Ronsse and tutor Dilani Rathnayake for proposing this thesis topic, and for their guidance, support, advice,
and knowledge which were k.
Additionally, I want to thank Prof. Erik Meers and members of the EcoChem research team for granting me access to laboratory facilities.
Lastly, I will like to acknowledge the moral and spiritual support of my family and friends throughout this master thesis and to everyone who contributed to the success of this thesis.
IV
Abstract
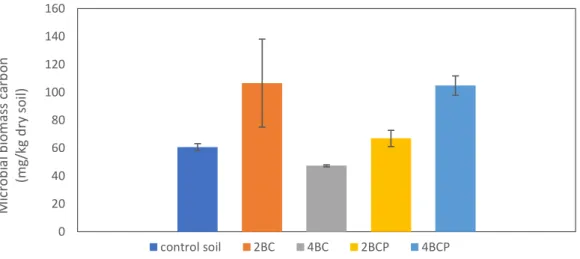
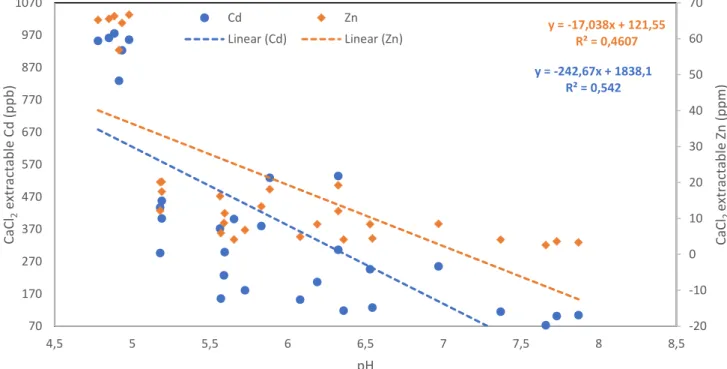
Soil contamination by potentially toxic metals is a serious environmental problem faced worldwide, hence sustainable and effective amendment methods are required. Biochar is a carbon material with a multitude of functionalities that have attracted wide research interest and application in soil amendment for toxic metal immobilization. In this study biochar produced at 550°C from spent growing media with and without 2.5% plastic grow bag (BCP and BC) were used in a 3month laboratory incubation study to assess their effect at two rates (2% and 4%w/w) on Cd and Zn bioavailability, dehydrogenase activity (DHA) and microbial biomass carbon (MBC) in contaminated soil. Both BC and BCP contained aromatic C, O-containing functional groups, mineral ash, organic compounds, and alkaline pH. BCP contained more surface functional groups, VM, FC, and 36% more organic compounds in abundance compared to BC. However, BC was highly aromatic (H/C=0.39) with a higher pH and ash content compared to BCP. Results revealed BC significantly increased soil pH and EC (p<0.01), especially at 4% application rate. Biochar applied at 4% had the greatest reduction in CaCl2 extractable Cd and Zn, with the highest reduction efficiency of 92.3% and 96% respectively obtained in 4BC amended soil. CaCl2 extractable Cd and Zn were significant and negatively correlated to pH (p<0.01). DHA was strongly inhibited in biochar amended soils by 82%-96% in the order 4 2 4BCP. MBC was enhanced by 84% and 82.2% in 2BC and 4BCP treated soils respectively, while 2BCP did not affect, and 4BC slightly reduced MBC in soil by 22%. Biochar surface O-containing functional groups, mineral content, and alkaline pH could have contributed to Cd and Zn immobilization by electrostatic attraction, surface complexation, and precipitation. The impact of biochar on heavy metal immobilization, enzyme activity, and microbial biomass carbon varied with biochar type and application rate. Biochar pH, organic matter, and surface functional groups are important parameters to evaluate when considering biochar for soil applications.
Keywords: Biochar, metal contaminated soil, Cd, Zn, immobilization, microbial biomass carbon, DHA
V
Table of Contents
Acknowledgment ... III Abstract ... IV List of Figures ... VII List of Tables ... VII List of Abbreviations ... VII
1. Introduction ... 1
2. Literature Review ... 3
2.1 Sources of PTE in soil ... 3
2.1.1 Natural sources... 3
2.1.2 Anthropogenic sources... 3
2.2 The fate of PTE in soil ... 4
2.2.1 Clay minerals and organic matter ... 4
2.2.2 Soil pH and metal oxides ... 5
2.2.3 Redox potential ... 5
2.3 Environmental impact of PTE soil contamination ... 5
2.4 Remediation of PTE contaminated soil ... 6
2.4.1 Biological remediation ... 7
2.4.2 Physical remediation ... 7
2.4.3 Chemical remediation ... 8
2.5 Biochar ... 9
2.5.1 Biochar feedstock... 9
2.5.2 Pyrolysis for biochar production ... 9
2.5.3 Biochar properties ... 9
2.6 Potential of biochar to remediate PTE contaminated soil ... 11
2.7 Mechanism of biochar immobilization of PTE in contaminated soil... 12
2.7.1 Direct mechanisms ... 12
2.7.2 Indirect mechanisms ... 14
2.8 Biochar-soil microbial interaction on PTE immobilization ... 15
2.9 Biochar effect on soil microbial organisms and enzymatic activity in PTE contaminated soil... 16
2.9.1 Biochar effect on soil enzymes ... 16
VI
3. Materials and Methods ... 20
3.1 Soil sampling and characterization ... 20
3.1.1 Total metal and nutrient content in soil ... 20
3.2 Biochar production and characterization... 20
3.2.1 pH and EC Analysis ... 20
3.2.2 Proximate Analysis ... 21
3.2.3 Elemental Composition ... 21
3.2.4 FTIR Analysis ... 21
3.2.5 Py GC/MS ... 21
3.2.6 Total metal and nutrient analysis of biochar ... 22
3.3 Laboratory soil incubation study and CaCl2 extraction ... 22
3.3.1 Periodical CaCl2 Extraction ... 23
3.3.2 Microbial Biomass Carbon (MBC) at the end of the incubation ... 23
3.3.3 Dehydrogenase Activity (DHA) at the end of the incubation ... 23
3.3.4 Data and Statistical Analysis ... 23
4. Results ... 24
4.1 Soil Characteristics ... 24
4.2 Biochar characteristics ... 24
4.2.1 Chemical properties and Proximate analysis ... 24
4.2.2 FTIR analysis ... 25
4.3 Py-GC/MS analysis ... 26
4.4 Soil incubation studies ... 27
4.4.1 Preliminary incubation study ... 27
4.4.2 Changes in soil pH ... 28
4.4.3 Periodic CaCl2 extraction of Cd/Zn ... 29
4.4.4 Dehydrogenase activity (DHA) ... 29
4.4.5 Soil microbial biomass carbon (MBC) ... 30
5. Discussion ... 31
5.1 Effect of plastic contamination in feedstock on biochar properties ... 31
5.2 Effect of biochar on available Cd/Zn in soil and soil pH ... 32
5.3 Effect of biochar on soil quality (microbiological properties) ... 34
6. Conclusion and Recommendations ... 36
6.1 Conclusion ... 36
6.2 Recommendations ... 36
VII
Appendices ... 50
List of Figures
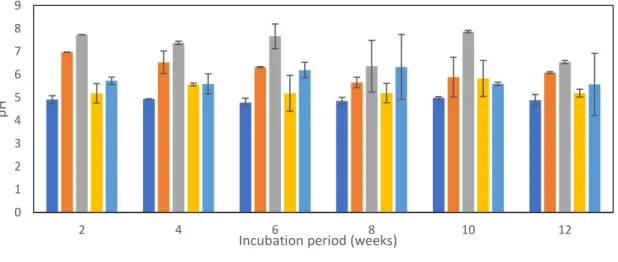
Figure 1 FTIR spectra of biochars a) BC and b) BCP ... 26 Figure 2 Pyrogram from Py GC/MS of A) BCP and B) BC ... 27 Figure 3 Trend in the relative peak area of a) PAHs, b) MAHs, c) nitrogen compounds, d) alkanes, e) alkenes & alkadienes and f) alcohols & acids, detected in BC and BCP ... 27 Figure 4 pH variation over 12week incubation study of a) control, and biochar amended soil with b) 2BC, c) 4BC, d) 2BCP and e) 4BCP. (n=3) ... 28 Figure 5 CaCl2 extractable A) Cd and B) Zn in; a) control, and biochar treated soil with; b) 2BC, c) 4BC, d) 2BCP and e) 4BCP during 3 months incubation study (n=3). ... 29 Figure 6 DHA activity in a) control soil and biochar amended soils with b) 2BC, c) 4BC, d) 2BCP and e) 4BCP. (n=3) ... 30 Figure 7 Relationship between pH and CaCl2 extractable Cd and Zn during the incubation period ... 33
List of Tables
Table 1 Soil Characteristics (mean ± standard deviation) n=3 ... 24 Table 2 Biochar characteristics (mean ± standard deviation) n=3 ... 25 Table 3 pH and EC (mean ± standard deviation) of biochar amended soil and control
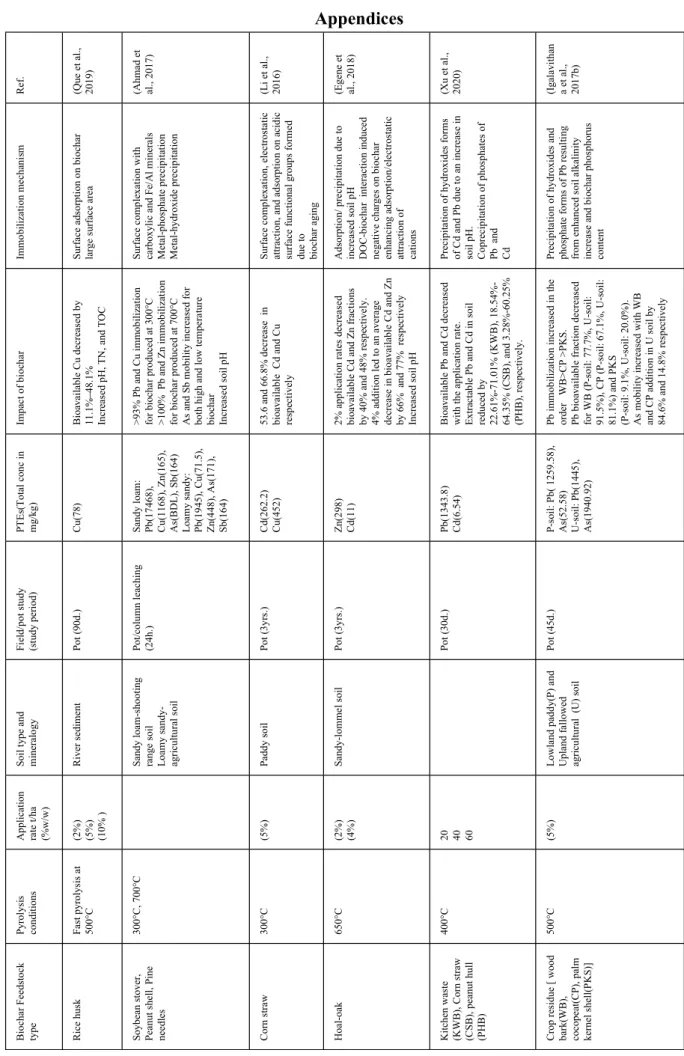
incubated for 24hr (n=3) ... 28 Table A 1 Summary of biochar application and mechanism involved in heavy metal
(im)mobilization ... 50 Table A 2 Summary of biochar application and mechanism involved in heavy metal
(im)mobili ... 51 Table A 3 Summary of biochar application mechanism involved in heavy metal
(im)mobilization and effect on soil microbial activity and microbial response ... 52 Table A 4 Products from Py GC/MS analysis of BC and BCP based on residence time (RT) and relative peak area (%) ... 55
List of Abbreviations
PTE: Potentially Toxic Elements MAHs: Monoaromatic Hydrocarbons PAHs: Polyaromatic Hydrocarbons CEC: Cation Exchange Capacity VOCs: Volatile Organic Compounds1
1. Introduction
Soil contamination refers to the accumulation of substances in soil at concentrations exceeding background levels that has noxious effects on any non-targeted organism (FAO and ITPS, 2015). Soil contamination by toxic heavy metals is a serious global environmental, agricultural, and health threat especially with the rise of industrialization and urbanization (Cachada et al., 2018). Heavy metals also called potentially toxic elements (PTEs) and addressed as PTEs throughout this document are metals and metalloids ( e.g. lead (Pb), cadmium (Cd), chromium (Cr), manganese (Mn), copper (Cu), iron (Fe), zinc (Zn), arsenic (As), mercury (Hg), molybdenum (Mo), etc. ) present in soil having both natural and anthropogenic sources. Globally, over 5 million PTE polluted sites originate from anthropogenic activities (e.g. agriculture, mining, urbanization, chemical processes) that can cover about 500 million ha of land worldwide (Li et al., 2019; Liu et al., 2018; Pan et al., 2018; Rodríguez-Eugenio et al., 2018). Several hazardous PTEs including; Pb, As, Cr, Cd, Hg, are listed in the top 20 most dangerous substances by US Environmental Protection Agency and the Agency for Toxic Substances and Disease Registry (ATSDR) (Rai et al., 2019). While some PTEs ( Zn, Cu, Fe), Cr(III), Mo) are vital for the proper functioning of essential metabolic processes in living organisms, they may at very low concentrations have potentially deleterious effects like other hazardous metals to plants and animals (Cachada et al., 2018; Chibuike and Obiora, 2014; Rai et al., 2019; Zwolak et al., 2019). Human exposure to toxic metals has numerous harmful health effects leading to cancer, gene mutation, organ malfunctioning, premature birth, organ malformation, and even death (Cachada et al., 2018; Wuana and Okieimen, 2011). The hazardous effect of PTEs in soil and the environment requires urgent attention necessitating the deployment of environmentally friendly and sustainable remediation techniques.
Biochar, a carbonaceous material generated from the pyrolysis of biomass in the absence of oxygen, has received extensive research attention as an environmentally friendly tool to amend to PTE contaminated soil (He et al., 2019; Yuan et al., 2019). It has equally gained popularity in; carbon sequestration, soil nutrient, and fertility enhancement (Yuan et al., 2019). Biochar produced from various biomass sources i.e. agricultural and industrial waste has proven efficient in immobilizing PTE in various contaminated soils. However, the efficacity of biochar in remediating to PTE contaminated soil is highly dependent on several factors including; type
2
of heavy metal, soil characteristics, and biochar properties (Bandara et al., 2019; Gong et al., 2018; Igalavithana et al., 2017b; Li et al., 2016).
Within this context, the main objectives of this study were;
1. A thorough review of existing literature related to biochar application on PTE immobilization in contaminated soils and understanding the mechanisms behind the mobility and bioavailability of PTE in contaminated soils after biochar application. 2. Investigate the potential of biochar produced from; spent growing media and the
co-pyrolysis of spent growing media and plastic grow bags; on the bioavailability of Cd and Zn and soil quality (microbial activity and microbial abundance) in contaminated soil.
3
2. Literature Review
A systematic literature search of published articles and book chapters was conducted using Google Scholar, ScienceDirect, and ACS publications. Published articles were searched
using biochar , AND contaminated soil biochar
potentially toxic elements heavy metals
articles within the years 2010-2020. Also, various pollutants, including Pb, Cd, Cu, Zn, and As were searched within the literature. To maximize the number of studies, both pot and field experiments were considered.
2.1 Sources of PTE in soil
Potentially toxic elements (PTEs) have both natural and anthropogenic origins in soil. However, PTEs of anthropogenic origin are prominent sources of soil contamination in most parts of the world (Rodríguez-Eugenio et al., 2018). In France and Slovakia for example, the metal industries contribute to over 20% of soil contamination (Van Liedekerke et al., 2014). In China, a survey reported agricultural and industrial activities accounted for over 19% of PTE soil contamination (Jia et al., 2020).
2.1.1 Natural sources
PTEs are natural constituents of soil minerals and rocks formed from paedogenesis processes like volcanic eruptions, weathering, or sedimentation (Palansooriya et al., 2020). Most soils rich in rocks including; shales, limestone, sedimentary ironstones, phosphorites, etc., in which PTEs constitute primary or secondary minerals, can be particularly enriched with higher concentrations of Cd, Ni, Zn, As, Mo, Mn, Pb, Cu, Ba, and certain rare earth metals (Alloway, 2013). Determining local bedrock composition through isotopic mapping techniques can help distinguish PTE pollution between lithogenic or anthropogenic sources
al., 2006).
2.1.2 Anthropogenic sources
Nowadays, most anthropogenic activities be they industrial, agricultural or domestic, use chemicals containing potentially toxic elements. Depending on the management and disposal methods of these toxic elements, soil contamination can be of a point or diffuse nature (Rodríguez-Eugenio et al., 2018). Among ubiquitous anthropogenic activities; mining, energy production, metal production and processing, chemical industries and chemical installations, waste management, agriculture, traffic emissions, metal smelting, tanning, and irrigation with wastewater accounts for a significant amount of PTE inputs in soil according to the European
4
Pollutant Emission Register (EPER) (García-Pérez et al., 2007; Palansooriya et al., 2020). The use of agrochemicals containing toxic elements (e.g. As, Cd, Pb) in agriculture to improve crop yield, is a serious global environmental challenge due to the risk of soil and food contamination (Cachada et al., 2018; Palansooriya et al., 2020; Rodríguez-Eugenio et al., 2018).
To sum, PTEs are naturally present and enters the soil through various channels. Natural processes like; volcanic eruption, weathering, sedimentation contribute to PTE accumulation in soil. Anthropogenic activities and changes in agricultural land practices contribute to the greatest worldwide spread and threat to PTE soil pollution.
2.2 The fate of PTE in soil
PTEs are present in various geochemical forms and distribute between different soil phases (i.e. in solid, liquid, and gaseous) (Cachada et al., 2018). Environmental factors and soil properties influence PTE geochemistry through several mechanisms (Cachada et al., 2018; Palansooriya et al., 2020).
PTEs in soil can be partitioned into non-residual and residual fractions. Non-residual fractions are; i) exchangeable readily mobile PTE ii) pH and redox potential mobility dependent carbonate- and oxide (Fe, Mn, Mg, and Al)-bound PTE and iii) organic-bound fractions from complexation and peptization with soil organic matter. Residual fractions are non-available and immobile forms constituting mainly soil primary and secondary minerals (Alloway, 2013; El-Naggar et al., 2018; Palansooriya et al., 2020; Rieuwerts et al., 1998).
Soil properties including; soil texture, pH, organic matter content, redox potential, and metals oxides presence greatly affects the rate at which heavy metal contaminants are retained or leached in soil through several mechanisms (e.g. adsorption, precipitation, complexation, oxidoreduction and ion exchange) (Palansooriya et al., 2020; Rieuwerts et al., 1998)
2.2.1 Clay minerals and organic matter
Clay minerals and soil organic matter are charged materials with large surface areas, cation exchange capacity (CEC), and surface functional groups, which are vividly involved in soil-PTE interactions, thus influencing the fate of metals in soil (Palansooriya et al., 2020). Soil organic matter has a high affinity for PTE enhancing immobilization by forming chelates through complexation linkages (Alloway, 2013). Cationic PTEs like Pb, Cd, Cu, and Zn in soil solution can be transferred to soil solid phase through cationic exchange with soil clay minerals.
5 2.2.2 Soil pH and metal oxides
Soil pH and metal oxides (Al, Fe, Mn), controls PTE dynamics by forming either stable or mobile species, depending on the chemical characteristics of the metal (Palansooriya et al., 2020).
The activity and mobility of most pH-dependent cationic metals in acidic soils, decrease with increasing soil pH. This is mainly due to the pH-dependent surface charge on soil particles and metal oxides of Al, Fe, Mn, Si (Bolan et al., 2014) favoring adsorption at higher pH. Immobilization could occur due to electrostatic attraction, co-precipitating as complex ions or precipitates of metal hydroxides especially for pH-dependent cationic PTEs like; Cd, Pb, Cu, and Zn (Bolan et al., 2014). Several cations (Pb, Ni) and oxy-anions (As, Cr), coprecipitates on ferric oxyhydroxides (Lu et al., 2011), ferric hydroxides (Alloway, 2013), and ferrihydrites (Violante et al., 2009). However, competitive adsorption with phosphates under alkaline pH conditions mobilizes most oxyanions like As and Se. Likewise, under acidic conditions competitive adsorption with H+/Al3+, acid-catalyzed dissolution of oxides, and deactivation of sorption sites from induced surface charges result in the desorption and mobilization of cationic PTEs. (Bolan et al., 2014; Palansooriya et al., 2020; Rieuwerts et al., 1998).
2.2.3 Redox potential
Changing soil redox conditions can affect PTE ionic form of metals like Hg, Cr, As, and Se, and influence their mobility in soil (Bolan et al., 2014; El-Naggar et al., 2019, 2018). The activity of chromium increases, while that of Arsenic decreases under high redox potentials in their oxidized form (Bachate et al., 2012; Choppala et al., 2015). Microbial activities under changing redox conditions can potentially affect metal and metalloid speciation and solubility in soil. Certain metals like Hg(II), Se(VI), and Se(IV) under both aerobic and anaerobic conditions can be reduced to residual fractions Hg(0) and Se(0) respectively, due to the activity of dissimilatory reducing bacteria like Shewanella oneidensis in soil (Li et al., 2014; Wiatrowski et al., 2006).
2.3 Environmental impact of PTE soil contamination
PTEs have deleterious effects on the environment and human health. PTE s toxic effect on the environment and living organisms depends on the bioavailability, concentration and type of PTE, complexity of contamination, the nature, and ecological complexity of the soil.
PTE s ecotoxicological effect and biomagnification in soil living organisms and food are commonly assessed using soil quality indicators (specifically on soil microbiological activities,
6
diversity, and abundance) (Khan et al., 2013). Microbial exposure to toxic metals can alter microbial morphology, growth, population diversity, and biochemical activities (Rathnayake et al., 2010).
Plants require specific metals as micronutrients for proper functioning. However, plant biochemical processes can be altered in PTE contaminated soil which could be influenced by; metal toxicity level, plant tolerance, and tissue accumulation capacities, symbiotic interactions with microbes in the rhizosphere, and adaptation to specific conditions in contaminated soils (Alloway, 2013).
Human exposure to PTEs notably; Cd, Pb, Cu, Zn, Hg, Cr, As; have deleterious effects on human health because they are human carcinogenic, mutagenic, neurotoxic, and toxic. (Khan et al., 2013; Rodríguez-Eugenio et al., 2018).
Cadmium (Cd) is a major compound utilized in the synthesis of phosphate fertilizers, alloys, batteries, and pigments. Exposure to cadmium mainly through ingestion of Cd contaminated food is a major threat to human health (Bolan et al., 2014). Cd contamination can cause among other diseases; cancer, severe pulmonary and gastrointestinal irritation, kidney failure, itai-itai, anemia, bone damage, and vomiting (Li et al., 2019; Sarwar et al., 2017).
Lead (Pb) can be released in the environment during fossil fuel burning, mining, manufacturing of lead-acid batteries, and from the use of Pb-containing agrochemicals, metal products, and paints. Pb exposure and poisoning can cause cancer, gene mutation, and malfunctioning of; central nervous system, kidney, endocrine system, reproductive system, and hematopoietic system (Tchounwou et al., 2012). Pb contamination can also cause decreased learning abilities in children, memory loss, and reduced intelligence (Sarwar et al., 2017).
Zinc (Zn) in low concentrations is essential for biological processes in living organisms. However, exposure to high levels of Zn from activities like; smelting of zinc-containing iron, galvanizing, welding, irrigation with Zn contaminated wastewater and sludge (Rodríguez-Eugenio et al., 2018); can result in abdominal pain, vomiting, diarrhea, anemia, birth defects, and disruption of the homeostasis of essential elements (Rodríguez-Eugenio et al., 2018).
2.4 Remediation of PTE contaminated soil
PTEs have properties that change in nature, rendering remediation of polluted soils quite challenging. Remediating strategies are usually aimed at reducing total PTE concentrations (Wuana and Okieimen, 2011). Remediation techniques could be physical, chemical, or
7
biological which could be implemented either ex-situ or in situ (Li et al., 2019) based on the ultimate remediation goal, type, and concentration of PTE contamination, and site characteristics (Wuana and Okieimen, 2011).
2.4.1 Biological remediation
Biological remediation also known as bioremediation, employs living organisms (plants, microorganisms, engineered microorganisms) which through their normal biological processes can transform, immobilize, or solubilize potentially toxic elements in soil, through enzymatic action, binding with intracellular and extracellular polymeric compounds (Gong et al., 2018). The effectiveness of bioremediation is dependent on several factors including; the nature of plant species/microorganisms, the level and complexity of the polluted environment, and prevailing environmental factors (Ojuederie and Babalola, 2017).
Bacteria and fungi are commonly used microorganisms in microbial bioremediation. More commonly a consortia of different bacteria strains or a mixture of bacteria and fungi are preferred to explore synergistic effects from their diverse characteristics (Li et al., 2019). Plants with special features called hyperaccumulators are increasingly used for phytoremediation of specific heavy metals in soil. Biological treatments are environmentally friendly, aesthetically favorable, and cost-effective remediation techniques (Liu et al., 2018) however, they are suitable only for low-level contaminations. The technique is time-consuming and requires a combination of appropriate plants, microorganisms with suitable environmental conditions.
2.4.2 Physical remediation
Physical remediation relies on the differences in physical parameters (electric charge, temperature, solubility, volatility, etc.) between PTE contaminant and soil matrix to separate pollutants from soil. Soil replacement, soil isolation, and vitrification are the most investigated physical techniques for managing and remediating PTE contaminated soil (Gong et al., 2018; Liu et al., 2018).
Soil replacement one of the oldest methods used in the past, aimed at diluting PTE to improve soil functionality by excavating contaminated soil and partly replaced with clean soil (Gong et al., 2018; Khalid et al., 2017).
Soil isolation is more of a management strategy to mitigate exposure and further contamination by isolating the polluted area with the aid of impermeable barriers like; steel, cement, bentonite, grout, clay and green coverings (Li et al., 2019) installed at appropriate soil locations (Khalid et al., 2017; Liu et al., 2018).
8
High-temperature treatment (HTT) (>1000°C) from sources like plasma, electric current, or thermal (Li et al., 2019) applied to polluted soils in-situ or ex-situ result destroys organics; entrap and immobilize melted inorganics in an impervious vitreous solid material in a process known as vitrification (Liu et al., 2018). New physical methods are constantly been investigated to remediate polluted sites.
In all, established physical remediation are among the oldest and effective methods employed to manage and remediate contaminated sites. So far, physical methods have proved to be very energy-intensive and costly, limiting their large scale application.
2.4.3 Chemical remediation
Chemical remediation involves the use of chemicals to reduce/oxidize, precipitate, immobilize, solubilize, or stabilize/solidify potentially toxic elements in soil. Chemical treatment includes; soil washing, immobilization, and solidification/stabilization (Gong et al., 2018; Liu et al., 2018).
In soil washing, toxic elements are leached from contaminated soil through the process of chelation, ion exchange, and desorption by altering soil acidity, redox potential, and solution ionic strength (Liu et al., 2018) with the aid of washing reagents and extractants. Chelating agents (EDTA, EDDS), organic and inorganic acids (phosphoric acid, citric acid, acetic acid, etc.) are among the most prevailing soil washing solutions used (Khalid et al., 2017).
In solidification/stabilization (S/S) PTEs are chemically stabilized and encased into an impermeable solid matrix. Cementitious or other binding agents (Li et al., 2019) such as bitumen, emulsified asphalt, polyethylene, pozzolan cement, and Portland cement with/without additives like magnesia, zeolites (Gong et al., 2018; Liu et al., 2018) are used to encase and immobilize PTEs into a non-leachable solid matrix.
Immobilization entails reducing the mobility and bioavailable pore water fractions of toxic metals with the aid of; liming agents, organic compounds, clay minerals, phosphates, metal oxides, and biochar; through adsorption, complexation, ion exchange, electrostatic attraction, and coprecipitation mechanisms (Khalid et al., 2017; Palansooriya et al., 2020). Biochar has gained enormous attention as a potential immobilization tool for PTE contaminated soil owing to its properties and functionality (Li et al., 2019).
Most chemical remediation methods require the use of chemicals, to immobilize toxic metals through a series of chemical and physical reactions, which may result in treated soil with
9
modified properties. However, chemical treatment using organic compounds like biochar has shown to be cost-effective in most environmental management applications, acting as soil amender and soil quality enhancer.
2.5 Biochar
2.5.1 Biochar feedstock
Biochar is a porous, carbon recalcitrant solid material, produced from the thermochemical conversion of organic materials in the absence or oxygen-limited environment (IBI, 2015). A wide range of organic biomass waste and other combustible waste sources have been used as feedstock to produce biochar as a sustainable waste management strategy. Waste biomass includes; agroforestry waste, animal manure, animal waste, food waste, sewage sludge, algae, and crop residues (shells, nuts, straw, hull, etc.) (Lee et al., 2018). Other wastes include; plastics, electronic waste, spent growing media, textiles, paper, and tires
2017).
2.5.2 Pyrolysis for biochar production
Pyrolysis is the thermochemical breakdown of biomass in the absence of oxygen at elevated temperatures (T >400°C), yielding valuable gaseous, liquid (bio-oil), and solid (biochar) products (Elkhalifa et al., 2019; Tripathi et al., 2016).
Pyrolysis leads to physical and chemical changes in feedstock, and result in products varying in their yields. Pyrolysis product yields are highly dependent on several factors mainly; feedstock type and pyrolysis process conditions (Elkhalifa et al., 2019; Ronsse et al., 2013; Tripathi et al., 2016). Pyrolysis processes can be categorized into fast or slow pyrolysis based on operating conditions (esp. heating rate and residence time). Slow pyrolysis conditions result in higher biochar yields while fast pyrolysis yields more liquid products (bio-oil).
Slow pyrolysis is the most conventional method employed for biochar production. It involves heating under slowly rising heating rates of 0.1-1°C/s for long periods to enhance cracking of the biomass to char formation (Tripathi et al., 2016). The process generally results in high biochar (30-50%) to bio-oil (25-30%) and gaseous (25-35%) product yields (Lehmann and Stephen, 2009; Tomczyk et al., 2020).
2.5.3 Biochar properties
Biochar physical, chemical, and structural properties differ among feedstock types and pyrolysis process parameters used (Lehmann and Joseph, 2015). High treatment temperature
10
(HTT), i.e. the highest temperature attained during pyrolysis, is regarded as the main process parameter to greatly influence biochar physical and chemical properties (Lehmann and Joseph, 2015). HTT affects the extent to which physical and chemical changes (volatilization) occur during processing (Lehmann and Joseph, 2015; Lua et al., 2004). Nevertheless, feedstock chemical composition and structural makeup undoubtedly influence final biochar properties and yield as well (Lehmann and Joseph, 2015; Tripathi et al., 2016).
2.5.3.1 Physical properties
Biochar physical characteristics (surface area, porosity, pore-volume, density, etc.) evolve as a result of changes in chemical and mechanical properties during feedstock pyrolysis. The extent to which changes in physical properties occur depends on feedstock type and pyrolysis temperature. Low HTT (350-550°C) generally results in biochar with smaller surface areas and lower porosities compared to high HTT (600-900°C) (Bandara et al., 2019). As volatile products from biomass are released with a rise in temperature, more pore pathways are formed which leads to an increase in surface area. Biochar surface area, porous structure, and pore volume are related to its adsorption and water holding capacity (Zhao et al., 2013).
2.5.3.2 Chemical properties
Pyrolysis of biomass results in the chemical restructuring of compounds in the original feedstock, ultimately leading in an accumulation of recalcitrant compounds (organic and inorganic) in the final biochar (Lehmann and Joseph, 2015). Biochar chemical properties; surface functionality, pH value, ash content, CEC are important indicators for various soil applications.
Biochar contains surface functional groups which are mostly oxygenated groups (carbonyl, carboxyl, hydroxyl, esters, ethers, phenolic, etc.) emanating as a result of thermochemical reactions and detachment of volatile compounds during pyrolysis (Kim et al., 2012; Kinney et al., 2012; Lehmann and Joseph, 2015). Biochar surface functional group decreases as HTT is raised and more hydrogen and oxygen are released resulting in an increase in aromaticity (low H/C ratios) with the highest aromaticity reached between 500-800°C (Weber and Quicker, 2018). Hence biochar produced at lower temperatures have more functional groups and higher H/C and O/C ratios. The carbon content, H/C, and O/C ratios of biochar are primary biochar properties indicative of stability, surface functionality, and suitability for applications in carbon sequestration, soil amendment, and as adsorbent (Pariyar et al., 2020). The type and amount of functional groups affect biochar alkalinity. Biochar containing nitrogenated compounds (basic
11
functional groups) and or with high aromaticity (deprotonated or fewer acidic functional groups) have higher alkalinity (Weber and Quicker, 2018). An increase in biochar aromaticity and alkalinity has been directly linked to an increase in biochar pH. Biochar ash consists notably of oxides of; Al, Si, Mg, Ca, K, and P; which increases in concentration with
temperature. B , and functional groups depends on
the properties of the parent biomass (Domingues et al., 2017; Lehmann and Joseph, 2015).
Biochar CEC resulting from negatively charged surface functional groups, is a measure of the number of exchangeable cations (Na+, Mg2+, Ca2+, NH
4+), hence an essential parameter used to determine its potential to improve soil fertility and to reduce PTE toxicity by ion exchange (Weber and Quicker, 2018). Biochar cation exchange capacity (CEC) also depends on biomass type, however, several views on the impact of process parameters have been reported. While some studies outlined a drop in CEC with a rise in HTT (Claoston et al., 2014; Gaskin et al., 2008; Pariyar et al., 2020), other studies reported lower HTT resulting in biochar with sufficient surface functional groups and surface area, had higher CEC than those produced at higher HTT (Liang et al., 2006; Weber and Quicker, 2018). Nutrient-rich feedstocks like manure, sludge, and digestate with high ash contents generally have higher CEC than plant-based biochar. Minerals in biochar act as CEC sites for PTE immobilization through ion exchange in soils (Pariyar et al., 2020). Hence, careful selection of initial feedstock type and pyrolysis conditions is required when considering the intended biochar end-of-use (Lehmann and Joseph, 2015; Novak et al., 2014).
2.6 Potential of biochar to remediate PTE contaminated soil
Biochar has multifarious properties which upon soil application, can interact with soil components and toxic elements. Biochar can alter soil physicochemical characteristics and PTE mobility and bioavailability in soil (He et al., 2019; Lehmann and Joseph, 2015). Biochar potential as an amender in contaminated soil differs due to several factors including; biochar properties, biochar application rate, soil characteristics (type and texture), pollutant concentration, characteristics, and other environmental factors (Palansooriya et al., 2020).
Biochar surface area and porous structures provide a myriad of active sorption sites capable of immobilizing PTEs in soil. Also, biochar can impact PTE mobility and bioavailability in soil by influencing soil pH, CEC, microbial activity, redox potential, soil texture, and soil organic carbon.
12
Rice straw derived biochar increased soil pH, organic carbon content, and decreased bioavailable Cd fractions in amended soils at different application rates: at 10 t/ha by 45 62% and at 20 t/ha by 66 89% compared to control (Zhang et al., 2017). Zhao et al., (2016) found biochar derived from chicken manure (CBC) and rape straw(RBC) at 15% application rate increased soil pH, CEC, and organic matter content while acid extractable Cd in acidic soil reduced by 16.3% and 11.64%, respectively. Soybean Stover biochar (S-BC700) reduced Pb mobility by 95% by increasing soil organic carbon up to 25 times in amended soils (Ahmad et al., 2016). Crop based derived biochar applied at 5% effectively immobilized Pb in contaminated paddy (P-soil) and upland(U-soil) soils (Igalavithana et al., 2017b). Extractable Pb fractions were reduced by 77.7% in P-soil and 91.5% in U-soil and by 67.1% in P-soil and 81.1% in U-soil in wood and cocopeat biochar amended soil respectively (Igalavithana et al., 2017b). Bamboo(BB) and pig (PB) derived biochar reduced Pb and Cd leaching in high and low organic carbon soils (Qin et al., 2018). PB was more effective and reduced Cd and Pb in high organic carbon soil by 38% and 71% for Pb in low organic carbon soils compared to BB, due to its larger surface area, alkalinity, pH, and mineral content (Qin et al., 2018).
Based on studies conducted on the biochar amendment of heavy metal contaminated soil, it can be deduced that the variability in biochar properties and soil properties, biochar application rate, PTE characteristics and concentration, impacts biochar potential as amender of PTE polluted soil (Yuan et al., 2019).
2.7 Mechanism of biochar immobilization of PTE in contaminated soil
The diversity in feedstock and pyrolysis conditions used to produce biochar results in biochar with differing properties which in turn affects their potential interaction with soil components and PTE in contaminated soil. Variabilities in biochar properties such as surface area, porous structure, pH, CEC, carbon, and ash content, as well as soil characteristics, affect biochar-soil and biochar-PTE interactions. Biochar effects on PTE mobility and bioavailability can be either through direct mechanistic interaction between biochar and PTEs or indirectly through its influence on soil characteristics. Table A1 and A2 (in Appendices) shows a summary of biochar application and proposed mechanisms involved in PTE (im)mobilization.
2.7.1 Direct mechanisms
Biochar physiochemical properties can influence heavy metal mobility and bioavailability in contaminated soil through mechanisms of adsorption (i.e. electrostatic attraction, physical adsorption), ion exchange, surface complexation, and precipitation.
13 2.7.1.1 Adsorption
Adsorption mechanisms could involve physical adsorption or electrostatic attraction between metals and biochar surfaces, which impacts heavy metal immobilization in contaminated soils. Physical adsorption entails the diffusion and entrapment of PTEs in biochar intraparticle /interstitial pore space. Higher pyrolysis temperatures (>400°C) results in biochar with large surface area and high pore volume (Uchimiya et al., 2010b). Molecular pore-diffusion controlled PTE immobilization by retaining Cd, Cu, and Zn in biochar pore networks (Choy and McKay, 2005).
Electrostatic attraction involves surface charge neutralization and weak coordination bonding between PTE and biochar (Gomez-Eyles et al., 2013). Biochar surface functional groups consisting mostly of oxygen-containing groups in the form of hydroxyls (-OH), carbonyl, and carboxyl (-COO-, -COH) (Li et al., 2017), make biochar have a pH-dependent charge. The amount of negative surface functional groups intensified as pH increases, impacts biochar electronegativity, as a result of deprotonation of acidic functional groups (He et al., 2019). Biochar with low zeta potential i.e. high electronegativity facilitates adsorption of positively charged metals by electrostatic attraction. Biochar alkalinity increased the surface charge of soil and biochar particles, which improved the adsorption of cationic PTEs by electrostatic attraction (Bashir et al., 2018; Egene et al., 2018; Tong et al., 2011). Electrostatic interactions formed by metal- bonding could also be established between delocalized lone pair- -electrons of aromatic C=C or C=O ligands in biochars and cationic metals (Harvey et al., 2011; Uchimiya et al., 2010a).
2.7.1.2 Ion exchange
Biochar surface functional groups and ash content have the capacity to part take in ion exchange processes with metals, and hence influence its mobility and bioavailability. Cation exchange between metals and protons (protonated or acidic functional groups like -COOH) and alkali earth metals (Na, K, Mg, Ca) on biochar surfaces, results in strong chemical bonding and stabilization of metals (Ho et al., 2017). Biochar produced at low temperatures as well as from animal manures, favored biochar with high cation exchange capacities (CEC) (He et al., 2019). Manure derived biochar had higher CEC and was more effective in PTE immobilization in contaminated soil compared to plant-based biochar (Wang et al., 2017). Though negative surface charges favor cationic metal immobilization by electrostatic attraction, oxyanions (Sb (antimony), and As (Arsenic)) could be increasingly desorbed and mobilized due to the accretion of organo-mineral layers (Ahmad et al., 2017).
14 2.7.1.3 Complexation
Biochar surface functional groups (-COOH, -OH,-C=O-,-NH2+,-C=N, etc.) serve as binding sites, forming stable organo-metallic complexes with PTEs through surface complexation (Lian and Xing, 2017; Ling et al., 2017). Stable metal complexes are formed through coordinate covalent bonding between metals and oxygen or amine functional groups on biochar (Bandara et al., 2019; Ling et al., 2017). Biochar contains inherent inorganics (Fe(II), CO32-, Mn(II), Si, Cl, S), which can form insoluble and stable inorganic metal complexes (Ahmad et al., 2014).
2.7.1.4 Precipitation
Biochar consists of an ash fraction composed mainly of minerals (Na, K, P, Mg, Ca) mostly in their oxidized forms has the potential to form insoluble precipitates with PTEs (Gomez-Eyles et al., 2013; Lehmann and Joseph, 2015). Insoluble coprecipitates of metal phosphate forms have been reported to govern Pb immobilization in contaminated soil with animal manure derived biochar (Qin et al., 2018). Most cationic heavy metals (Pb, Cd, Zn, Cu) form stable metal hydroxide precipitates at high pH (Ahmad et al., 2016). Biochar mineral content (CO32-, PO4, Al, SiO2) improves PTE immobilization by increasing soil pH, hence precipitating Pb and Cd in their hydroxyl, carbonate, and phosphate forms (Bandara et al., 2019; Gomez-Eyles et al., 2013).
2.7.2 Indirect mechanisms
Indirect mechanisms are the changes brought about on soil characteristics (biological, chemical, or physical) like; pH, soil organic carbon (SOC), cation exchange capacity, microbial biomass, and redox potential; as a result of biochar addition which can in turn impact PTE mobility and bioavailability in soil.
2.7.2.1 Effect on soil pH and PTE (im)mobility
Soil pH is a key factor that affects metal mobility and bioavailability in soil. Biochar is alkaline, thus could increase soil pH with increasing application rates especially in acidic soils (Lehmann and Joseph, 2015). When soil pH is increased, soil minerals and biochar surface charges assume more negative charges, increasing the ability of cationic PTEs to bind and be immobilized by electrostatic attraction (He et al., 2019; Lehmann and Joseph, 2015). While cationic PTEs are immobilized with an increase in pH, high mobility of oxy-anions (As and Sb), has been reported in several studies (Ahmad et al., 2016; Moreno-Jiménez et al., 2012). Biochar can act as buffers due to its alkalinity exhibiting a liming effect and increasing soil pH in acidic soils
15
by several units (Beesley et al., 2010). Soil pore water pH increased, enhancing metal hydrolysis and transformation to oxidized and residual forms after the biochar amendment.
2.7.2.2 Effect on soil organic matter/carbon and PTE (im)mobilization
Biochar applied to soil can increase organic matter and organic carbon especially soluble extractable fractions (Gomez-Eyles et al., 2013; Lehmann and Joseph, 2015). Dissolved organic carbon (DOC) concentration can either increase or decrease following biochar application to soil. Several metals form complexes with organic matter, thus adding biochar to soil, especially those low in organic matter such as arid or semi-arid soils, could result in the occurrence of organic-metallic complexes in soil (Lehmann and Joseph, 2015). Different effects on PTE mobility were observed following biochar application in soil. Cu and As pore water concentration and mobility increased in biochar amended soils due to an increase in soil DOC (Beesley et al., 2010).
2.7.2.3 Effect on soil redox potential
Biochar applied to soil can increase aggregate stability, porosity, and bulk density, which may change soil hydrological processes and redox conditions, especially in biochar micropores where anoxic conditions can prevail (Lehmann and Joseph, 2015). Reduced or anoxic conditions induced by biochar in soil can change the speciation and geochemistry of redox-sensitive metals like As and Cr (Lehmann and Joseph, 2015). Under reduced conditions, Arsenic (As) is reduced to its more mobile and toxic form, As(III) (Moreno-Jiménez et al., 2012) whereas, Cu(II) is reduced to less toxic Cu(I) (Borch et al., 2010). Biochar oxygenated surface functional groups, can act as electron sources and hence impact the oxidation of redox-sensitive metals (Gomez-Eyles et al., 2013). Cr(VI) was reduced to less toxic Cr(III) by surface functional groups on coconut-based biochar after been adsorbed on biochar surface (Choppala et al., 2012).
2.8 Biochar-soil microbial interaction on PTE immobilization
Soil contamination by PTEs may negatively impact microbial communities and soil biochemical reactions due to their toxic effect (Igalavithana et al., 2017a). Biochar addition to PTE contaminated soil can alter soil microbial activity and structure by changing soil physicochemical properties (Farrell et al., 2013). Microbial response to biochar varies as a result of the diversity in biochar properties, contaminant type, soil type, and native soil microorganisms (Bandara et al., 2019). Biochar addition could positively or negatively affect soil microbial communities and PTE immobilization.
16
Biochar can provide conducive conditions (nutrients and habitat) in PTE contaminated soil which can enhance the proliferation of soil microorganisms by adsorbing and reducing metal toxicity (Yuan et al., 2017). Microorganisms can -electron donors and metabolize volatile organic compounds (VOCs). Microorganisms can also utilize PTEs as electron donors or acceptors and change their oxidation state (Yuan et al., 2017). A reduction in bioavailable PTE upon biochar application decreased PTE toxicity pressure on soil and eventually resulted in improved soil health, soil microbial population, and soil microbial enzymatic activity. Biochar provides a large surface area, porous structure, carbon, and nutrient which are perfect conditions for soil microbial growth, thus improving soil microbial structure and abundance in soil (Zhu et al., 2017). Igalavithana et al., (2017a) found vegetable waste-derived biochar improved microbial community and enzyme activity, and reduced Pb bioavailability in Pb/As contaminated soil. From biochar-microbial interactions, it could be deduced that biochar firstly provides conducive environments for microbial growth by reducing PTE toxic effects. As a result of microbial proliferation, microorganisms can enhance PTE immobilization through processes of bioaccumulation or biotransformation (Abdu et al., 2017) by secreting certain enzymes or functional biofilms which can bind PTEs or change PTE to less toxic forms (Gadd et al., 2012; Jing and Kjellerup, 2018).
However, other studies outlined biochar could have adverse effects on soil microbial abundance and enzymatic activity (Huang et al., 2017). Biochar significantly inhibited microbial and enzymatic activity due to induced changes in soil pH and organic matter (Huang et al., 2017). Biochar enhanced PTE desorption (As, Cr, Se) which inhibited microbial growth and activity in contaminated soil due to an increase in soil pH (Bandara et al., 2019).
2.9 Biochar effect on soil microbial organisms and enzymatic activity in PTE
contaminated soil
2.9.1 Biochar effect on soil enzymes
Soil enzymes play crucial roles in nutrient turnover in soil, ultimately contributing to soil fertility which promotes plant growth. Enzymatic reactions, serve as soil quality indicators due to their sensitivity to changes in environmental conditions, hence their activity can be significantly influenced by biochar and contaminants in soil (Zhu et al., 2017).
Biochar can bring changes in soil properties which may affect microbial enzyme-catalyzed reactions through various possible mechanisms (Zhu et al., 2017). Biochar surface functional groups may bind substrate and inhibit enzyme-substrate reaction by blocking its active sites
17
(Bailey et al., 2011) or bind to enzymes and regulate enzyme specificity and substrate affinity (Paz-Ferreiro et al., 2015) and kinetic parameters (Gibson et al., 2016; Lammirato et al., 2011); ii) biochar may change soil pH and moisture content which can influence enzyme activity (Zimmerman et al., 2011); iii) biochar may release some molecules which can have allosteric effects, either enhancing or inhibiting enzyme-catalyzed reactions (Bailey et al., 2011).
Different types of enzymes are involved in soil nutrient mineralization. Oxidative (dehydrogenase, catalase) and h -glucosidase, N-acetylglucosaminidase, phosphatase, and invertase) enzymes are widely reported in the literature as soil quality indicators playing significant roles in soil processes.
2.9.1.1 Oxidative enzyme activity
Dehydrogenase activity (DHA) is considered an important enzymatic component of microorganisms, an indicator of soil redox status (Gascó et al., 2016), and a respiratory enzyme which measures the physiological efficiency of microbes in soil (Purakayastha et al., 2015). DHA responds differently following biochar addition to soil. Pig derived biochar (BPC300) and pig slurry increased DHA by 70% compared to control (Gascó et al., 2016). Torrefied biomass (V200, P200, and PV200) increased DHA in both soils compared to biochar produced at 500°C, and V200 was the most effective one (Igalavithana et al., 2017a). A 67-day incubation study reported among biochars, rice straw biochar showed the highest DHA, while maize stover had the lowest DHA in amended sandy loam soil (Purakayastha et al., 2015). Biochars from crop residues had little effect on DHA when added to lowland paddy and upland paddy agricultural soils (Igalavithana et al., 2017b). Biochar applied in contaminated soil (Cd, Cu, and Zn) inhibited all enzyme (d -glucosidase, invertase, urease, protease, acid phosphatase, alkaline phosphatase, and arylsulfatase) activities except for urease throughout the incubation period compared to control (Tang et al., 2020). DHA was highest during the third season of incubation, increasing by 742% and 652% for chicken manure (CMB) and oat hull(OHB) biochar amended soils respectively compared to control (Moore et al., 2018).
2.9.1.2 Hydrolytic enzyme activity
Hydrolytic enzymes, involved in the mineralization and recycling of nutrients (C, N, S, and P) have been used as soil quality indicators for nutrient acquisition and soil fertility. The activity of different enzymes such as; -glucosidase, N-acetylglucosaminidase, invertase, and protease have been extensively reported in the literature.
18
-Glucosidase is an extracellular enzyme involved in C mineralization that contributes to the -1,4 glucans to glucose (Sinsabaugh et al., 2008; Stott et al., 2010). Wheat straw-based biochar significantly inhibited -glucosidase and dehydrogenase in acid rice paddy soil compared to control (Zheng et al., 2016). After incubation with bamboo residue biochar, different enzymatic activity responses were reported. Both increased (phenol -glucosidase) and decreased (peroxidase, N-acetyl-glucosaminidase, and acid phosphatase) enzymatic activities were observed in biochar treated soils compared to control (Luo and Gu, 2016). Biochar with higher surface area (900 m2/g) adsorbed large quantities of -glucosidase activity compared to biochar with smaller surface areas (2.0 m2/g) (Lammirato et al., 2011).
Urease is an enzyme often taken as an indicator of organic N mineralization (Nannipieri et al., 2012) and soil fertility (NH4) (Moorhead et al., 2012). The activity of purified -N acetylglucosaminidase increased by 50-75% following biochar exposure, suggesting chemical enhancement of enzyme function. In some cases, biochar stimulates soil enzyme activities, to a much greater degree than soil assays would indicate, given that substrate reactivity can be impeded by biochar exposure (Bailey et al., 2011). Exposure and sorption of substrates on biochar had varying effects on different enzymes. The activity of -N-acetylglucosaminidase increased by 50-75%, after biochar application suggesting chemical enhancement of the enzyme (Bailey et al., 2011).
2.9.2 Biochar effect on soil microbial community
Biochar can trigger changes (positive, negative, or no impact) on soil microbial community and functioning which could be the result of the interactions between biochar, soil components, and soil microorganisms (Chen et al., 2013; Lehmann et al., 2011). Biochar is rich in carbon, nutrient, with porous structures and large specific surface area that can serve as carbon source, nutrient, and habitat for microorganisms respectively and hence could potentially alter soil microbial composition, growth, abundance, and enzymatic activity through several possible mechanisms (Ameloot et al., 2013; Lehmann et al., 2011; Lehmann and Joseph, 2015). Table immobilization and microbial functioning in soil.
Enhanced soil enzymatic activities were noticed at lower biochar application rates, while higher rates improved soil microbial abundance and diversity in PTE contaminated paddy soils amended with wine-less biochar (Xu et al., 2017). Chicken manure (CMB) and oat hull (OHB)
19
derived biochar improved soil microbial abundance i.e. fungi and bacterial communities, by 61% and 53% respectively compared to control in metal contaminated soils (Moore et al., 2018). Significant alterations in fungi communities and abundance (Ascomycota and Basidiomycota by 11% and 66% and increased the relative abundances of Zygomycota by 147% at 40 t/ha ) were observed in a four-year study in slightly acidic rice paddy amended with biochar at 20 and 40 t/ha (Zheng et al., 2016). Soil pH, SOC, and C/N were the main contributors to changes observed in shifts in soil microbial communities and abundance (Zheng et al., 2016).
20
3. Materials and Methods
3.1 Soil sampling and characterization
The soil for this study was collected from the top layer (0-25 cm) of a field in Lommel ( E), a region in Belgium with a long history of industrial Zn smelting activities. The region has a long history of Cd, Zn, and Pb pollution due to atmospheric deposition from the smelters. The field has a sandy soil texture and can be classified as an acidic Humic podzol according to FAO classification. Sampled soils were homogenized and debris (plant roots, leaves) removed before been passed through a 2 mm sieve mesh. Sieved soil samples were conserved in polyethylene (PE) plastic bottles.
3.1.1 Total metal and nutrient content in soil
Soil total metal and nutrient content were determined by Aqua regia digestion method (ISO 11466). 1g of soil was treated with 250 ml of 3:1 mixture of HCl:HNO3. The mixture was heated until reflux conditions were attained and maintained for 2h. The mixture was allowed to cool and the supernatant filtered. The filtrate was then analyzed for total metals and nutrients using ICP-OES (Varian Vista MPX, Varian Palo Alto, California, USA).
3.2 Biochar production and characterization
Biochars for this study were supplied by the UK Biochar Research Centre (UKBRC). Biochars were produced from spent strawberry growth substrate (95% Irish peat+5% clay granules) and a mixture of spent strawberry growth substrate and 2.5% plastic cover-grow bag.
Feedstocks were fed into a pilot-scale rotatory kiln pyrolyzer. The different biochars were produced at an HTT of 550 °C, and a heating rate of 80°C/min with 5 min residence time. The produced biochars were homogenized and stored in airtight containers before use. Biochar produced from spent growth substrate was denoted BC and, biochar produced from a mixture of 2.5% plastic grow bag and spent growth substrate was denoted BCP.
3.2.1 pH and EC Analysis
Soil and biochar pH and electrical conductivity (EC) were determined from 3 replicates. Soil pH was determined from 1:5 solution of soil to deionized water. 1:10 solution of biochar to deionized water was used for pH determination of biochar. 1g of soil was mixed with 5 mL of deionized water and 1g of biochar was mixed with 10 mL of deionized water. The solutions were shaken for 1.5 h on a mechanical shaker and allowed to equilibrate for 30 min. A pH electrode (Orion Virsa Star, Thermo Scientific, USA) was used to determine the pH of the
21
supernatant after equilibration. EC was determined from the suspension with the aid of an EC electrode (Orion Virsa Star, Thermo Scientific, USA).
3.2.2 Proximate Analysis
Biochar moisture content, volatile matter, and ash content were determined by the modified standard method (ASTM D1762-84). Briefly, 3 replicates of approximately 0.5 g of BC and 0.25 g of BCP were placed in a crucible of known mass and oven-dried at 105 °C for 18 h to determine the moisture content. The oven-dried samples, in closed crucibles, were later placed in a furnace at 950 °C for 10 min to determine the volatile matter content. The same samples were then further heated at 750 °C for 6 h in the furnace (open crucibles) to determine their ash contents. The fixed carbon was determined by subtracting the volatile and ash content from the oven-dried sample mass at 105 °C.
3.2.3 Elemental Composition
Biochar elemental composition (C H N ) was determined by weighing approximately 2 mg of biochar in tin cups. Weighed samples were loaded into an elemental analyzer Flash 2000 Elemental Analyzer (Thermo Fisher Scientific, Waltham, MA, USA). 2,5-bis(5-tert-butyl-benzoxazol-2-yl) thiophene (BBOT) was used as standard reference material during CHN analysis.
3.2.4 FTIR Analysis
Biochar surface functional groups were determined by FTIR analysis. IR spectra with an S/N ratio of 30000:1 were obtained from samples in a neat form with a quest ATR (Attenuated Total Reflectance) accessory with diamond crystal puck using a Shimadzu IRAFFINITY-1S Fourier Transform Infrared Spectrophotometer (FTIR).
3.2.5 Py GC/MS
Micro-pyrolysis experiments of biochar were performed using a micro-pyrolysis unit (Multi-shot pyrolyzer EGA/PY-3030D, Frontier Laboratories Ltd.) coupled to a gas chromatograph
22
(Thermo Fisher Scientific Trace GC) and mass spectrometer (Thermo ISQ MS). In brief, ca. 0.5 mg of finely ground and well-homogenized biochar sample was loaded into a sample cup, which afterward was dropped into a deactivated stainless-steel pyrolysis tube, preheated to
sample had been injected was as follows: (a) 3 minutes at a constant temperature of 40 °C, (b) heating to 280 °C at 5 °C/min, and (c) 1 minute at a constant temperature of 280 °C. The GC-separated compounds were identified by a single quadrupole MS with electron ionization with a transfer line temperature of 280 °C and an ion source temperature of 230 °C. The MS was operated with an electron impact ionization of 70 eV and a scan mode between mass-to-charge ratio (m/z) values between 44 300, with an acquisition rate of 5 spectra per second. Compounds were identified, based on their retention times and fragmentation patterns, by comparison to the NIST database. Each component concentration was expressed as the
3.2.6 Total metal and nutrient analysis of biochar
The modified dry ash method adapted from (Enders and Lehmann, 2012) was used for sample preparation. Air-dry biochars were ground with mortar and pestle and sieved to the desired particle size range. Samples in triplicates were weighed to 200.0 mg ± 5.0 mg in ashing vessels. Samples were then placed in a cool muffle furnace (Fisher Isotemp Model 126, Thermo Fisher Scientific, Waltham, Mass.). Samples were heated from ambient to 500 °C over 2h and held at 500 °C for 8 h. Samples were removed after the furnace internal temperature reached 30 °C. At this point, the respective biochar showed a whitish to greyish color. The ashed samples were digested, by adding 1.43 mL HNO3 and evaporated off at 120 °C in the digestion block. Following this, 5.0 mL HNO3 was added to each vessel and heated to dryness at 120 °C. Digested samples were left to cool before adding 1.0 mL HNO3 and 4.0 mL H2O2. Samples were once more brought to dryness at 120 °C, solubilized with distilled water, and later filtered. The concentration of metals and nutrients in the obtained filtrates were analyzed using ICP-OES (Varian Vista MPX, Varian Palo Alto, California, USA).
3.3 Laboratory soil incubation study and CaCl
2extraction
Incubation studies were conducted in triplicates for 12 weeks. 100 g of soil alone and biochar-soil mixtures were incubated to investigate Cd and Zn immobilization. Biochar at application dosages (2% and 4% w/w) were mixed with soil. Biochar applied at a certain dosage was denoted as; 2BC or 4BCP, where; 2 or 4 represents the application rate of the biochar type (BC or BCP). The water content of control soil and biochar-soil mixtures were adjusted to 70%
23
water holding capacity of soil. Incubated control soil and mixed soil-biochar samples were adjusted for moisture content and stirred weekly.
3.3.1 Periodical CaCl2 Extraction
Incubated soils under study were collected after every fortnight for CaCl2 extraction and pH determination. 1g of soil was used for extraction with 10 ml of 0.01M CaCl2. The mixture was shaken for 24h in a shaker and later centrifuged. The supernatant from centrifugation was filtered to removed solid particles. The concentration of extracted heavy metals in the filtrate was determined by ICP-OES (Varian Vista MPX, Varian Palo Alto, California, USA).
3.3.2 Microbial Biomass Carbon (MBC) at the end of the incubation
Microbial biomass carbon (MBC) was determined using the fumigation extraction method (Joergensen and Mueller, 1996) at the end of incubation. Incubated soil samples (in triplicates) fumigated with chloroform and non-fumigated samples (10 g fresh soil) were extracted with 30 ml 0.5 M K2SO4 and carbon contents of the extracts were determined with a TOC analyzer. A kEC value of 0.45 was assumed to convert from organic carbon in the extracts to microbial biomass carbon (MBC).
3.3.3 Dehydrogenase Activity (DHA) at the end of the incubation
Dehydrogenase activity (DHA) was determined following a procedure described in Moeskops et al., (2010). Five grams moist soil (in triplicates) was added to 2ml 3% solution of triphenyltetrazolium chloride and 2ml Tris buffer pH 7.8 in glass vials and incubated in the dark for 24h at 37 °C. After incubation, 18ml of methanol was added to each vial and shaken in the dark for 2h in a shaker. Filtrates were collected in 50ml volumetric flasks and made up to the mark with methanol. The color intensity of the filtrates was measured at 485 nm with a Hitachi 150-20 spectrophotometer.
3.3.4 Data and Statistical Analysis
A one way ANOVA analysis was used to assess the statistically significant differences between parameters using SPSS. Excel was also used to calculate the mean or average.
24
4. Results
4.1 Soil Characteristics
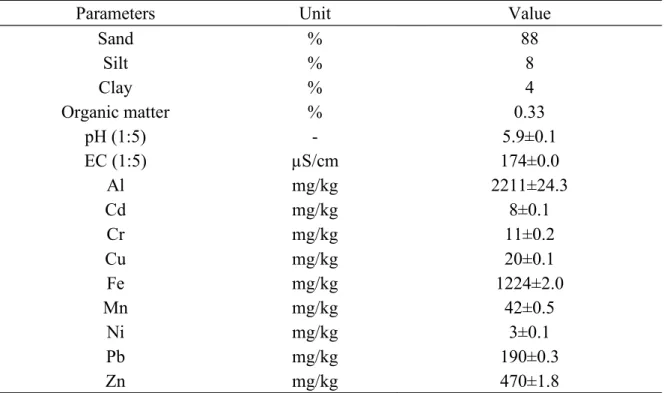
Soil used for this study was acidic (pH 5.9), low in organic matter with a sandy texture as shown in Table 1. The soil under study contained heavy metals in various amounts. Amongst metals, Zn, Pb, and Cd concentrations exceeded Belgian national permissible limits of 200, 100, and 2 mg/kg respectively, indicating soil contamination by these compounds (Eunomia et al., 2018).
Table 1 Soil Characteristics (mean ± standard deviation) n=3
Parameters Unit Value
Sand % 88 Silt % 8 Clay % 4 Organic matter % 0.33 pH (1:5) - 5.9±0.1 EC (1:5) µS/cm 174±0.0 Al mg/kg 2211±24.3 Cd mg/kg 8±0.1 Cr mg/kg 11±0.2 Cu mg/kg 20±0.1 Fe mg/kg 1224±2.0 Mn mg/kg 42±0.5 Ni mg/kg 3±0.1 Pb mg/kg 190±0.3 Zn mg/kg 470±1.8
4.2 Biochar characteristics
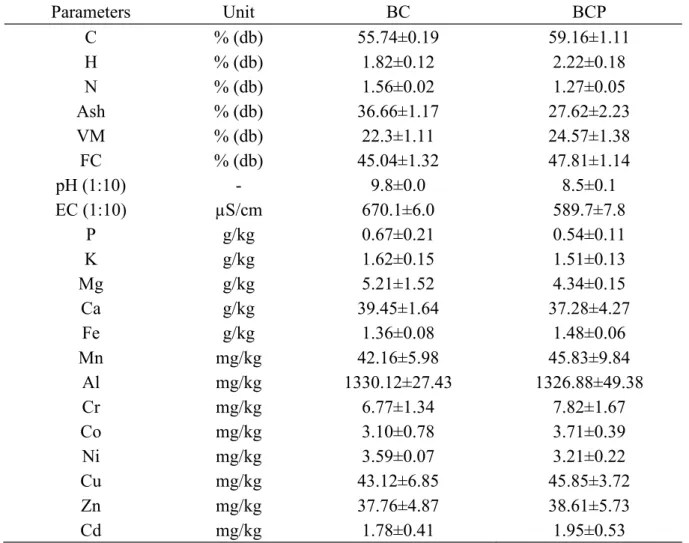
4.2.1 Chemical properties and Proximate analysis
The chemical properties and proximate analysis of BC and BCP are presented in Table 2. Both biochar types had slight differences in their elemental and proximate composition. BCP had slightly higher C, H, volatile matter and fixed carbon (FC) compared to BC. BC was slightly more aromatic with a lower H/C (0.39) compared to BCP ( H/C (0.45)). BC ash content, pH, and EC were greater than those of BCP. Both biochars were alkaline and saline, with BC been more alkaline and saline (pH 9.8, EC; 670.1µS/cm) than BCP (pH 8.5, EC; 589.7 µS/cm). They were no significant difference in alkali and alkali earth metals (Ca, Mg, K), phosphorus (P), and heavy metal (Cd, Cr, Zn, Cu, Ni) content between the two biochar types.
25
Table 2 Biochar characteristics (mean ± standard deviation) n=3
Parameters Unit BC BCP C % (db) 55.74±0.19 59.16±1.11 H % (db) 1.82±0.12 2.22±0.18 N % (db) 1.56±0.02 1.27±0.05 Ash % (db) 36.66±1.17 27.62±2.23 VM % (db) 22.3±1.11 24.57±1.38 FC % (db) 45.04±1.32 47.81±1.14 pH (1:10) - 9.8±0.0 8.5±0.1 EC (1:10) µS/cm 670.1±6.0 589.7±7.8 P g/kg 0.67±0.21 0.54±0.11 K g/kg 1.62±0.15 1.51±0.13 Mg g/kg 5.21±1.52 4.34±0.15 Ca g/kg 39.45±1.64 37.28±4.27 Fe g/kg 1.36±0.08 1.48±0.06 Mn mg/kg 42.16±5.98 45.83±9.84 Al mg/kg 1330.12±27.43 1326.88±49.38 Cr mg/kg 6.77±1.34 7.82±1.67 Co mg/kg 3.10±0.78 3.71±0.39 Ni mg/kg 3.59±0.07 3.21±0.22 Cu mg/kg 43.12±6.85 45.85±3.72 Zn mg/kg 37.76±4.87 38.61±5.73 Cd mg/kg 1.78±0.41 1.95±0.53 4.2.2 FTIR analysis
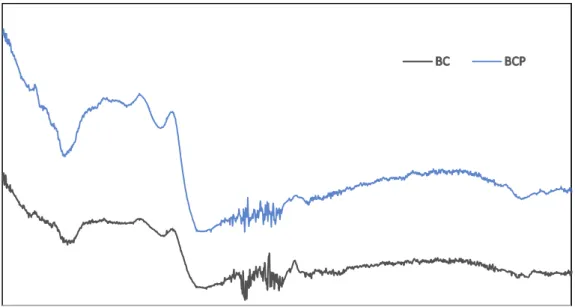
FTIR analysis was performed to understand the effect of the interactions between plastic grow bags and spent grow media on surface functional groups of biochar (BC). Figure 1 presents FTIR spectra of BC and BCP. IR spectra of BC and BCP were similar and revealed the presence of O-containing and other functional groups that could actively be involved in PTE immobilization. In BC and BCP, a broadband peak representing C=O stretching of carboxyl and ketones groups was detected at around 1720-1750 cm-1 (Yang et al., 2017). The peak at around 1480-1550 cm-1 in BC corresponding to C=O stretching vibrations of carbonyls and carboxylate groups or C=C stretching of aromatic components (Ali et al., 2020; Gao et al., 2016), was more pronounced and shifted to the left (1450-1550 cm-1) in BCP. OH bending of COOH groups which appeared at bands around 950 cm-1 in BC, was more intense, broader, and shifted to 930 cm-1 in BCP. New peaks at around 1200-1300 cm-1 ascribed to uncarbonized moieties arising from conjugated ketones (phenyl-carbonyl) and C-C stretching (Uchimiya et al., 2013) and at 3500-3700 cm-1 (indicating OH symmetric stretching of water molecules)
26
(Igalavithana et al., 2017b) were more apparent in BCP than in BC. In general, both biochars had similar IR spectra. However, band shifts and differences in peak intensities were observed between BC and BCP.
Figure 1 FTIR spectra of biochars a) BC and b) BCP
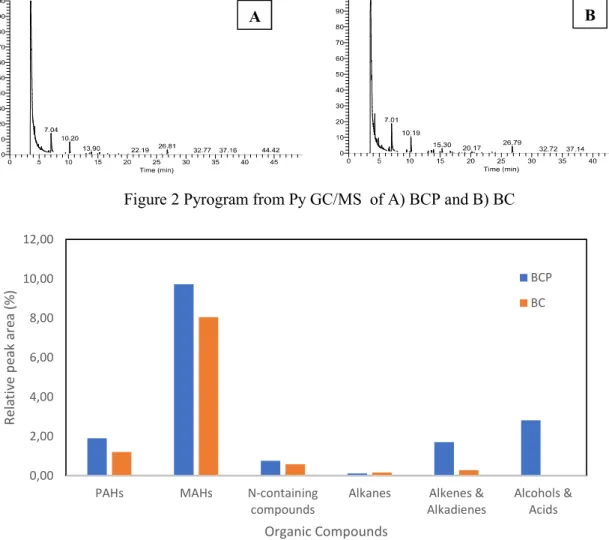
4.3 Py-GC/MS analysis
Py-GC/MS was used to investigate key (volatilizable) compounds present in BC and BCP. The Py-GC/MS pyrogram of BC and BCP presented in Figure 2 were very similar featuring several peaks. Key compounds based on peak intensity were identified and grouped into polycyclic aromatic hydrocarbons (PAHs), monoaromatic hydrocarbons (MAHs), nitrogen(N) compounds, and aliphatic hydrocarbons (alkanes, alcohols & acids, and alkene & alkadienes). A detailed list of compounds identified according to residence time and relative area (%) are presented in Table A4 (in Appendices). BC and BCP contained mostly MAHs (relative peak area of 8.05% in BC and 9.73% in BCP) as shown in Figure 3. The abundance of grouped compounds differed between biochar types. In BCP; MAHs>>aliphatic compounds(alkanes+alkenes+alcohols) >PAHs>N-compounds while, in BC; MAHs>>PAHs>N-compounds >Aliphatic compounds (alkanes+alkenes+alcohols). While PAHs, MAHs, alkanes, alkenes, and N-compounds were detected in both biochar types, alcohols & acids were only detected in BCP and as second most abundant compounds (relative peak area of 2.82%). Overall, BCP contained organic compounds by 39% more in abundance relative to those in BC.
550 750 950 1150 1350 1550 1750 1950 2150 2350 2550 2750 2950 3150 3350 3550 3750 3950
27
Figure 2 Pyrogram from Py GC/MS of A) BCP and B) BC
Figure 3 Trend in the relative peak area of a) PAHs, b) MAHs, c) nitrogen compounds, d) alkanes, e) alkenes & alkadienes and f) alcohols & acids, detected in BC and BCP
4.4 Soil incubation studies
4.4.1 Preliminary incubation study
After preliminary 1st day incubation, pH, and EC of biochar treated and control soils were determined as shown in Table 4. All soils amended with biochar (BC and BCP) had higher pH and EC compared to control. Soil pH and EC increased with an increase in biochar dose from 2% w/w to 4%w/w. BC generally had a greater influence on soil pH and EC compared to BCP. The pH of all biochar amended soils was in the neutral (pH 7.04 -7.77) range. However, higher biochar application rate (4% w/w) resulted in soils with EC slightly exceeding the permissible soil salinity limit (EC 0.4S/m) (Costantini, 2019). Hence, EC change from biochar addition at 4% w/w could impact soil biological functioning and plant growth.
0,00 2,00 4,00 6,00 8,00 10,00 12,00
PAHs MAHs N-containing
compounds Alkanes AlkadienesAlkenes & Alcohols &Acids
Re la tiv e pe ak a re a (% ) Organic Compounds BCP BC A B