Consumption of antimicrobial agents and
antimicrobial resistance among
medically important bacteria
in the Netherlands
NethMap 2015
Autoriteit Diergeneesmiddelen
AutoriteitDiergeneesmiddelen
Autoriteit Diergeneesmiddelen
Monitoring of Antimicrobial Resistance
and Antibiotic Usage in Animals
in the Netherlands in 2014
MARAN 2015
pg 1 - 116 Part 1: NethMap 2015
NethMap 2015
Consumption of antimicrobial agents and
antimicrobial resistance
among medically important bacteria
in The Netherlands
in 2014
2 NethMap 2015
Colophon
This report is published under the acronym NethMap by the SWAB, the Dutch Foundation of the Working Party on Antibiotic Policy, in collaboration with the Centre for Infectious disease control (CIb) of the RIVM, the National Institute for Public Health and the Environment of the Netherlands. SWAB is fully supported by a structural grant from CIb, on behalf of the Ministry of Health, Welfare and Sports of the Netherlands. The information presented in NethMap is based on data from ongoing surveillance systems on the use of antimicrobial agents in human medicine and on the prevalence of resistance to relevant antimicrobial agents among medically important bacteria isolated from healthy individuals and patients in the community and from hospitalized patients. The document was produced on behalf of the SWAB by the Studio of the RIVM.
NethMap can be ordered from the SWAB secretariat, c/o Secretariaat SWAB p/a Postbus 39, 5854 ZG Bergen (L) or by email to secretariaat@swab.nl.
NethMap 2014 and earlier versions are also available from the website of the SWAB: www.swab.nl. Contents may be reproduced in publications (book chapters, papers, reviews, and slide reviews etcetera) without permission with a maximum limit of four figures and/or tables per publication and full credit (reference) to the original publication.
Editors Dr Ir SC de Greeff Prof Dr JW Mouton Section Editors Dr T Leenstra Dr DC Melles Prof Dr DJ Mevius Dr S Natsch Board-members of SWAB Prof Dr JW Mouton (chair) Dr WJ Wiersinga (treasurer) Dr PD van der Linden (secretary) Dr MP Bauer Prof Dr AW Friedrich Prof Dr BJ Kullberg Dr DC Melles Dr S Natsch Dr JWPM Overdiek Prof Dr JM Prins Prof Dr AMGA de Smet Prof Dr DJ Touw Prof Dr A Verbon Dr CM Verduin Prof Dr ThJM Verheij Prof Dr JA Wagenaar Dr T Wolfs
Members of SWAB’s working group on surveillance of antimicrobial resistance Dr DC Melles (chair) Prof Dr JE Degener Dr Ir SC de Greeff Dr T Leenstra Prof Dr JW Mouton Dr C Schultsz Dr EE Stobberingh Dr CM Verduin
Members of CIb working on surveillance of antimicrobial resistance
Ing J Alblas
Dr Ir W Altorf-van der Kuil Dr D Frentz Dr Ir SC de Greeff Mrs A Haenen Mrs J Heereveld Mr R Hertroys Mrs M Kamst-van Agterveld Dr T Leenstra Dr A Meijer Dr NEL Meessen Drs J Monen Dr DW Notermans Dr LM Schouls
Prof Dr D van Soolingen Dr EE Stobberingh Ir SHS Woudt
Members of SWAB’s working group on surveillance of antimicrobial use Dr S Natsch (convener) Drs C Pellicaan Dr TBY Liem Dr PD van der Linden Drs MMB Roukens Dr AW van der Velden Dr EMW van de Garde Drs M Lourens
3 NethMap 2015
Acknowledgements
We thank the Foundation for Pharmaceutical Statistics SFK, The Hague, for providing data on
community usage of antimicrobial agents and all hospital pharmacists of the centres mentioned below for providing data on hospital usage.
We thank Prof. Dr MC Vos, Dr R Willems, Prof Dr MJM Bonten, all participants of ISIS-AR, SERIN, GRAS,
C. difficile surveillance, anaerobic pathogen surveillance, azole resistance surveillance, the Netherlands Reference laboratory for meningitis in Amsterdam, and the NIVEL for their important contributions; and the staff of the Publishing Department RIVM for preparing this report for printing.
Centres contributing to the surveillance of antibiotic consumption
Alkmaar, MC Alkmaar; Almelo/Hengelo, ziekenhuisgroep Twente; Almere, Flevoziekenhuis; Amersfoort, Meander MC; Amstelveen, ziekenhuis Amstelland ; Amsterdam, AMC; Amsterdam, BovenIJ ziekenhuis; Amsterdam, OLVG; Amsterdam, St.Lucas Andreas ziekenhuis; Amsterdam, VUMC; Apeldoorn, Gelre ziekenhuizen; Arnhem, Rijnstate; Assen, Wilhelmina ziekenhuis; Bergen op Zoom, Lievensberg; Boxmeer, Maasziekenhuis Pantein; Breda, Amphia ziekenhuis; Capelle a/d IJsel, IJselland ziekenhuis; Den Bosch, Jeroen Bosch ziekenhuis; Den Haag, Bronovo ziekenhuis; Den Haag, MC Haaglanden; Den Haag, HAGA ziekenhuizen; Den Helder, Gemini ziekenhuis; Deventer, Deventer ziekenhuis; Doetinchem, Slingerland ziekenhuis; Dordrecht, Albert Schweizer ziekenhuis; Ede, Gelderse vallei; Eindhoven, Catharina ziekenhuis; Emmen, Scheperziekenhuis; Gorinchem, Beatrix ziekenhuis; Gouda, Groene hart ziekenhuis; Groningen, UMCG; Haarlem, Kennemergasthuis; Haarlem, Spaarne ziekenhuis; Hardenberg, Ropcke Zweers; Harderwijk, St.Jansdal; Heerenveen, De Tjongerschans; Hoorn, Westfries gasthuis; Leiden, Diaconessenhuis; Leiden, LUMC; Leiderdorp, Rijnland ziekenhuis; Leeuwarden, Medisch centrum Leeuwarden; Lelystad, MC Zuiderzee; Maastricht, MUMC; Nieuwegein, St.Antonius ziekenhuis; Nijmegen, CWZ; Nijmegen, UMC St.Radboud; Purmerend, Waterland ziekenhuis; Roermond, Laurentius ziekenhuis; Roosendaal, Franciscus ziekenhuis; Rotterdam, Erasmus MC; Rotterdam, Maasstad
ziekenhuis; Rotterdam, St.Franciscus gasthuis; Rotterdam, Ikazia ziekenhuis; Rotterdam-Dirksland, van Weel Bethesda ziekenhuis; Schiedam, Vlietland ziekenhuis; Sittard, Orbis MC; Sneek, Antonius
ziekenhuis; Terneuzen, ZorgSaam; Tilburg, St. Elisabeth ziekenhuis; Tilburg, TweeSteden ziekenhuis; Tiel, Ziekenhuis Rivierenland; Utrecht, Diakonessenhuis; Utrecht, UMCU; Veghel, Ziekenhuis Bernhoven; Winterswijk, Streekziekenhuis Koningin Beatrix; Woerden, Zuwe Hofpoort; Zoetermeer, Lange Land ziekenhuis; Zutphen, Gelreziekenhuizen;
Centres contributing to the surveillance of resistance to antimicrobial agents (ISIS-AR)
Alkmaar, Medisch Centrum Alkmaar; Amsterdam, Slotervaartziekenhuis / Antoni van Leeuwenhoek; Apeldoorn, Gelre Ziekenhuizen; Bergen op Zoom, Lievensberg Ziekenhuis; Breda, Amphia Ziekenhuis; Delft, Microbiologisch laboratorium Reinier de Graaf Groep; Deventer, Deventer Ziekenhuis;
Doetinchem, Slingeland Ziekenhuis; Dordrecht, Regionaal Laboratorium Medische Microbiologie; Ede, Ziekenhuis Gelderse Vallei; Enschede, Laboratorium voor Medische Microbiologie Twente/Achterhoek; Goes, Admiraal De Ruyter Ziekenhuis; Groningen, Laboratorium voor Infectieziekten; Haarlem, Streeklaboratorium voor de Volksgezondheid; Heerlen, Atrium Medisch Centrum Parkstad; Hilversum, Centraal Bacteriologisch en Serologisch Laboratorium; Leeuwarden, Izore, Centrum Infectieziekten Friesland; Leiden, LUMC; Nieuwegein, St. Antonius Ziekenhuis; Nijmegen, UMC St. Radboud; Nijmegen, Canisius Wilhelmina Ziekenhuis; Roosendaal, St. Franciscus ziekenhuis; Schiedam, Vlietland Ziekenhuis;
4 NethMap 2015 ‘s-Gravenhage, MC Haaglanden Westeinde; ‘s-Gravenhage, HagaZiekenhuis; ‘s-Hertogenbosch, Jeroen Bosch Ziekenhuis; Sittard-Geleen, Orbis MC; Terneuzen, Ziekenhuis ZorgSaam Zeeuws-Vlaanderen; Tilburg, Streeklab. v.d. Volksgezondheid; Utrecht, UMC Utrecht; Utrecht, Saltro; Utrecht,
Diakonessenhuis; Veldhoven, Stichting PAMM; Velp, Ziekenhuis Rijnstate, loc. Velp; Woerden, Zuwe Hofpoort Ziekenhuis; Zwolle, Isala
5 NethMap 2015
Contents
Colophon 2 Acknowledgements 3 1 Introduction 7 2 Extensive summary 9 3 Use of Antimicrobials 17 Introduction 17 3.1 Primary care 17 3.2 Hospital care 203.3 Care in nursing homes 32
4 Surveillance of resistance 35
4.1 Methods and description of ISIS-AR data 35
4.1.1 Methods 35
4.1.2 Description of the ISIS-AR data 38
4.2 Primary care 45
4.2.1 ISIS-AR 45
4.2.2 SERIN, Surveillance of Extramural Resistance in The Netherlands. 51
4.3 Hospital departments 53
4.3.1 Outpatient departments 53
4.3.2 Inpatient hospital departments (excl. ICU) 58
4.3.3 Intensive Care Units 64
4.3.4 Blood isolates from inpatient departments (incl. intensive care units) 70
4.3.5 Urology services 75
4.3.6 Respiratory pathogens 80
4.4 Highly resistant microorganisms 82
4.4.1 Carbapenem-Resistant Enterobacteriaceae 82
4.4.2 Vancomycin Resistant Enterococci in Dutch hospitals 87
4.4.3 Methicillin resistant Staphylococcus aureus 89
4.4.4 Carbapenem-resistant Pseudomonas aeruginosa and other non-fermenters 91 4.4.5 Extended spectrum Beta-lactamase producing bacteria 94 4.4.6 Signaling Consultation of Hospital acquired Infections and AntiMicrobial
6 NethMap 2015
4.5 Resistance in specific pathogens 98
4.5.1 Neisseria meningitidis 98
4.5.2 Neisseria gonorrhoeae 100
4.5.3 Mycobacterium tuberculosis 103
4.5.4 Resistance to influenza antiviral drugs 105
4.5.5 Resistance among human anaerobic pathogens 108
4.5.6 Clostridium difficile 110
7 NethMap 2015
This is NethMap 2015, the SWAB/RIVM report on the use of antibiotics and trends in antimicrobial resistance in The Netherlands in 2014 and previous years. NethMap is a cooperative effort of the Dutch Working Group on Antibiotic Policy (SWAB; Stichting Werkgroep Antibiotica Beleid) and the Centre for Infectious Disease Control Netherlands (CIb) at the National Institute for Public Health and the Environment (RIVM). Nethmap is issued back-to-back together with MARAN, reporting on trends in animal husbandry.
In 1996, the SWAB was founded as an initiative of The Netherlands Society for Infectious Diseases, The Netherlands Society of Hospital Pharmacists and The Netherlands Society for Medical Microbiology. SWAB is fully funded by a structural grant from CIb, on behalf of the Ministry of Health, Welfare and Sports. The major aim of the SWAB is to contribute to the containment of the development of antimicrobial resistance and provide guidelines for optimal use of antibiotics, SWAB has initiated several major initiatives to achieve its goals. Among these are training programs on rational prescribing of antimicrobial drugs, development of evidence-based prescription guidelines, implementation of tailor-made hospital guides for antibiotic prophylaxis and therapy and a nationwide surveillance system for antibiotic use.
CIb monitors and informs the government about potential national health threats with regard to antimicrobial resistance. Based on the national AMR surveillance system (ISIS-AR), trends in antimicrobial resistance are monitored using routine antibiotic susceptibility testing data from microbiology laboratories in the Netherlands. Furthermore, the CIb subsidizes specific surveillance programs that focus on the monitoring of specific pathogens, or even specific resistance mechanisms. Together these form the basis of the surveillance of resistance trends reported in Nethmap.
NethMap 2015 extends and updates the information of the annual reports since 2003. Since the introduction of a more concise format last year, reflected in both a different format as well as more concise information – we have tried to further improve and highlight the most important trends. The reader is encouraged to visit www.isis-web.nl for tailored overviews of resistance development.
1
8 NethMap 2015 Lately, the appearance of highly resistant microorganisms (HRMO’s) has received significant attention and has become a significant public health issue. The epidemiological background of these micro-organisms is increasingly complex, as are the challenges to antimicrobial treatment. We therefore provide in a separate chapter a comprehensive overview covering the major trends in antimicrobial resistance, consequences for therapeutic choices and these may serve as a basis for public health policies.
NethMap parallels the monitoring system of antimicrobial resistance and antibiotic usage in animals in The Netherlands, entitled MARAN – Monitoring of Antimicrobial Resistance and Antibiotic Usage in Animals in The Netherlands. Jointly, NethMap and MARAN provide a comprehensive overview of antibiotic usage and resistance trends in The Netherlands in humans and in animal husbandry and therefore offer insight into the ecological pressure associated with emerging resistance.
We believe NethMap/Maran continues to contribute to our knowledge and awareness regarding the use of antibiotics and the resistance problems that are present and may arise in the future. We especially thank all those who are contributing to the surveillance efforts, and express our hope that they are willing to continue their important clinical and scientific support to NethMap/Maran and thereby contribute to the general benefit and health of the people.
The editors: Dr Ir SC de Greeff Prof Dr JW Mouton
9 NethMap 2015
In the Netherlands, several surveillance programs have been developed over the years to monitor antimicrobial resistance in important pathogens in different settings. In addition, a number of specific surveillance programs exist that focus on the monitoring of specific pathogens, or even specific resistance mechanisms. These programs often include susceptibility testing, including conformation of important resistance mechanisms and molecular typing. For instance, all MRSA isolates cultured in the Netherlands are submitted to a reference laboratory for further analysis. In table 2.1 an overview is provided of surveillance programs that are included in Nethmap 2015.
2.1 Most important trends in antimicrobial use
In GPs
• Antibiotic use declined for the third successive year from 11.37 DDD/1000 inhabitants per day in 2011 to 10.54 DDD/1000 inhabitants per day in 2014.
• The use of azithromycin increased whereas the use clarithromycin declined further.
• There was a 13% increase in use of ciprofloxacin which may be related to the decrease in the use of norfloxacin and levofloxacin; overall quinolone use increased 3%.
In nursing homes
• The mean use based on 34 nursing homes was 65 DDD/1000 residents/day but varied widely between 14 and 165 DDD/1000 residents/day.
• The most frequently used antibiotics are combinations of penicillins (mainly amoxicillin with clavulanic acid), with 18.9 DDD/1000 residents/day, nitrofurantoin derivates (13.7 DDD/1000 residents/day) and fluoroquinolones (7.9 DDD/1000 residents/day).
2
10 NethMap 2015
Table 2.1
Overview of Surveillance programs in the Netherlands.
Surveillance program
1
Origin of isolates
availability
Sources 2014
Central or decentral susceptibility testing
Method of susceptibility testing
Surveillance program aimed at resistance surveillance in major pathogens SERIN
GP
1996-42 GP practices from NIVEL
Central testing Microdilution ISIS-AR GP , Hospital, Nursing homes 2008-33 laboratories Decentral testing
Various methods used in routine susceptibility testing
Specific surveillance program aimed at resistance surveillance in specific pathogens Neisseria meningitidis
Hospital 1994-Nationwide Central testing E-test Neisseria gonorrhoeae STI centers
2006-89% (of STI center attendees)
Decentral testing E-test Mycobacterium tuberculosis General population 1993-Nationwide
Primarily central testing Agar dilution and BACTEC
-Mgit 960 (liquid breakpoint)
Influenza antiviral drugs
community
, GP
,
nursing home, hospital
2005-NIVEL GP sentinels, SNIV nursing home sentinels, hospital/ regional laboratories central testing (RIVM, NIC
-ErasmusMC, WHO- CC London) Neuraminidase enzym inhibition assay; for established molecular mark
ers
sequencing and/or single nucleotide polymorphism (SNP) PCR
Resistance among anaerobic pathogens
Hospital 2010-1 lab Central testing E-test Clostridium difficile
Hospital, nursing homes
2005-18 hospitals
(de)central testing
E-test and ribotyping
Azole resistance in Aspergillus fumigatus Hospital 2011-8 University hospitals Central testing EUCAST methodology 1
SERIN = Surveillance of Extramural Resistance in The Netherlands; ISIS-AR = Infectious D
isease Surveillance Information System on Antibiotic Reistance
GP = General practitioner; NIVEL = Netherlands institute for health services research; SNIV = National sentinel surveillance network for infectious diseases in nursing homes; STI = Sexually transmitted Infections; WHO-CC = W
11 NethMap 2015
In hospitals
• The in-patient use of antibiotics in 2013 increased from 71.3 DDD/100 patient days in 2012 to 74.7 DDD/100 patient days in 2013.
• Antibiotic use per 100 admissions was 307.8 DDD/100 admissions which is higher than in 2012 (295.7 DDD/100 admissions) but comparable to 2011 (306.4 DDD/100 admissions in 2011).
• After a peak in total use of 1.061 DDD/1000 inhabitants/day in 2010, this value decreased further in 2013 to 0.951 DDD/1000 inhabitants/day.
• Carbapenem use, especially meropenem, was again slightly increased, although, in a European context, it’s use is still low. University hospitals account for most of the meropenem use.
• The point prevalence study in 51 hospitals (twice as many as 2013) by the PREZIES network showed that 32% of all admitted patients (N=12,329 patients) received antibiotics, the same figure as last year and the year before. Most often used antibiotics were amoxicillin with clavulanic acid (18%),
ciprofloxacin (11%) and cefuroxim (8%).
2.2 Most important trends in antimicrobial resistance
In GPs
• For most antimicrobials, there are no significant shifts in resistance levels since 2010. The exceptions are nitrofurantoin, with slowly rising levels up to 3% in E. coli and trimethoprim and co-trimoxazol that show a decrease in resistance, although still between 20-30% for most species. There appears an increase in resistance to fosfomycin and amoxicillin with clavulanic acid in some species.
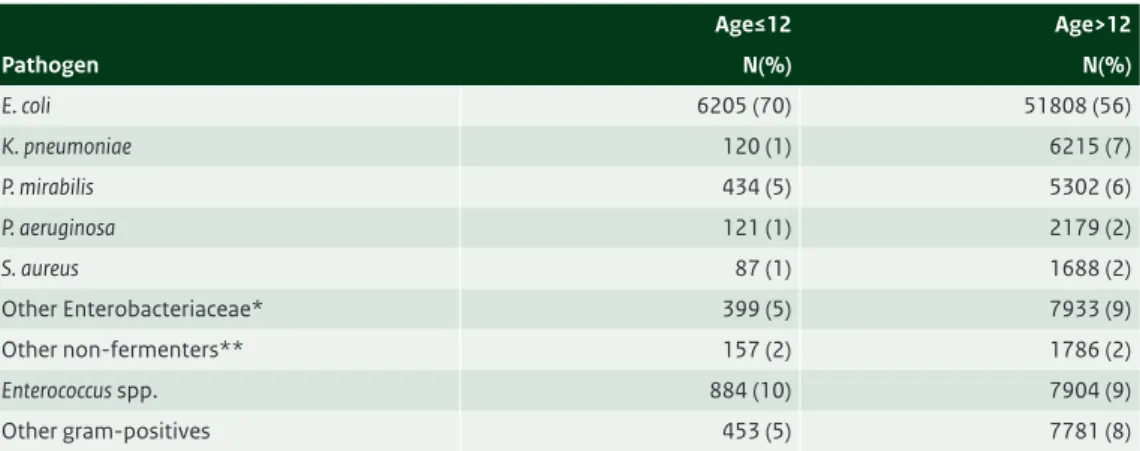
• A distinction was made for patients aged below and above 12 years of age. In general, resistance rates in the older age group were slightly higher than in the younger age group.
• The percentage of highly resistant microorganisms (HRMO) and multi-drug resistance remained relatively low (< 4%) in all Enterobacteriaceae.
• The Gonococcal Resistance to Antimicrobials Surveillance (GRAS) reported no resistance to ceftriaxone and spectinomycin found.
In hospitals
• Compared to 2010, overall resistance rates for many antimicrobials were similar or slightly lower. The major exception was nitrofurantoin, which is, similar to GP, slightly increasing and 4% in outpatient departments for E. coli. A similar trend is observed for fosfomycin and amoxicillin with clavulanic acid in some species.
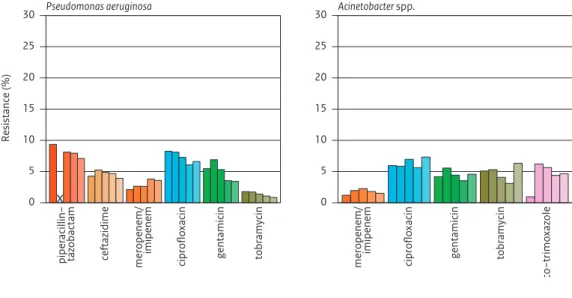
• The percentage of HRMO was highest among K. pneumoniae i.e. 8% (excl. ICU departments) and 11% (ICU) . • Carbapenem resistance in P. aeruginosa increased from 2% to 4% (excl ICU).
• CRE were a rare occurrence in the Netherlands; 0.01% of E. coli and 0.15% of K. pneumoniae were non-susceptible to carbapenems. OXA-48 was the most prevalent carbapenemase detected. • The prevalence of MRSA remains low.
• Resistance to vancomycin remained rare in enterococci (<0.5%).
• Resistance to penicillin (<0.5%) in pneumococci was still rare in the Netherlands. • Resistance to penicillin in N. meningitidis was not found in 2014.
• For C. difficile, the prevalence of ribotype 027 was stable at 3% and no indications for clinical relevant resistance to metronidazole, vancomycin, and fidaxomicin.
12 NethMap 2015
2.3 Antibiotic use and resistance in the veterinary sector
In 2014 the sales of antimicrobial veterinary medicinal products (207 tonnes) decreased by 4.4%, compared to 2013 (217 tonnes). The total sales decreased from 2009, the index year as defined by the Ministry of Economic Affairs, to 2014 by 58.1%. The policy objective for 2015, a 70% reduction compared to 2009, will therefore be a challenge. Compared to 2007, the year with highest sales (565 tonnes), the decrease in sales is 63%. In most livestock sectors reductions in antibiotic use levelled off in comparison with 2013, except for poultry and dairy cattle. In poultry antibiotic use increased again in 2014, probably as a result of changes in prescription patterns. In dairy cattle a substantial reduction in use was noted and a shift in antibiotic use from 3rd and 2nd choice to 1st choice antibiotics, particularly in dry cow treatment.
• Resistance levels in S. Typhimurium isolates from human samples have increased over the years until 2010 after which a constant tendency to decrease was observed until 2013. In 2014 resistance levels for almost all antimicrobials tested stabilized.
• In 2014 the resistance rates seem to have stabilized in C. jejuni from broilers and poultry meat. Ciprofloxacin resistance was at a high level and still rising in Campylobacter spp. causing infections in human patients ( >60%). However, resistance to erythromycin, macrolides being the first choice antibiotic in human infections, was still low. For Campylobacter from human patients, resistance levels were higher for travel related infections compared to domestically acquired campylobacteriosis. • Over the last decade, Shigella Toxin producing E. coli (STEC) isolates show a tendency of increasing
resistance to ampicillin, tetracycline, sulfamethoxazole and trimethoprim. Resistance to the quinolones (ciprofloxacin and nalidixic acid) decreased in 2014. As in the former four years, no ESBL-producing isolates were detected
• In most animal species the resistance levels of indicator E. coli from fecal samples stabilized in 2014. This may reflect the use patterns of antibiotics in the different livestock species. In isolates from broiler meat, beef and pork, resistance showed a tendency to decrease.
• The decrease in cefotaxime resistant E. coli from 2008 – 2013, has levelled off in 2014. The prevalence of livestock being positive for ESBL/AmpC producing E. coli in the faeces was 67% in broilers, 34% in laying hens, 18% in slaughter pigs, 23% in white veal calves, 14% in rosé veal calves and 9% in dairy cows. Poultry meat was most frequently contaminated (67%), which was slightly lower than found in former years (83% in 2013 and 73% in 2012).
• The dominant human ESBL-gene (blaCTX-M-15) was more frequently found in animals or their products. This is an unwanted development that warrants extra attention in the surveillance in food-animal sources. In 2014 in 1601 fecal samples from broilers, veal calves, slaughter pigs and dairy cows no carbapenemase-producing Enterobacteriaceae were detected.
These findings indicate that reductions in the total quantity of antibiotics used in the Netherlands and in 3rd and 4th generation cephalosporins are associated with a reduction of the general levels of antimicrobial resistance and the levels of ESBLs. These associations are indicative of a direct causal association between usage of antibiotics and antimicrobial resistance. This view is supported by the current levelling off in antibiotic use directly followed by a stabilization of resistance levels. This may warrant a re-evaluation of the current targets for antibiotic use in relation to targets for antimicrobial resistance in animals and food thereof.
13 NethMap 2015
2.4 Implications for therapy
Overall, with a few exceptions, no major shifts in resistance rates have occurred in The Netherlands over the last five years. The resistance rates in 2014 did not increase further for most antibiotics. Yet, there is a continuing concern. For some microorganisms where resistance rates are apparently similar over the last years, a MIC creep is observed since last year below the clinical breakpoint, indicating that resistance may appear in the coming years. Although resistance has not increased further, empiric (mono) therapy for some of these agents is now unjustified in the severely ill patient for many of the antibiotics that were long considered as first line of treatment. Routine culturing with antibiograms remains mandatory to tailor therapy to the individual patient. If broad spectrum therapy is initially chosen, antibiograms should be used to narrow down antimicrobial therapy to prevent even further emergence of resistance and culture repeated if indicated. It should be realized that the resistance rates reported are for one isolate per patient, and only the first one, and that resistance in the individual patient, especially those that stay longer in the hospital, is significantly higher than reported here. In the summary below, some of the most important implications for therapy are provided, based on the general trends of resistance. As implications differ by category of patient and indication of use, the summary is organized as such. It should be borne in mind that the majority of conclusions below are based on agents used as intravenous therapy, except for agents that are available as oral drugs only or have a specific indication such as UTI. Non-susceptible rates can be higher than resistance rates in some cases.
In GPs
Urinary tract infections
• Approximately 80% of Gram-negatives cultured were E. coli, K. pneumoniae and P. mirabilis. High levels of resistance to amoxicillin, trimethoprim and co-trimoxazole make these agents less suitable for empirical treatment in UTI both in children and adults. However, resistance to trimethoprim and co-trimoxazole has been decreasing for several years and is increasingly an option.
• The best suitable treatment options for uncomplicated UTI are still nitrofurantoin (3% resistance in E.
coli, and slowly increasing) and fosfomycin (1% resistance in E. coli, but >30% in K. pneumoniae). • Resistance to amoxicillin with clavulanic acid was > 10% in Enterobactereaceae indicating that care
should be taken with empirical treatment without further diagnostic work-up.
• The results indicate sampling for antimicrobial susceptibility testing becomes increasingly important in the treatment of UTI.
In hospitals
Outpatient departments
• Except for nitrofurantoin and fosfomycin, high levels of resistance preclude empirical treatment with oral agents for UTI; culture and tailored therapy are necessary.
• Resistance rates in the three major species are comparable to, or slightly higher than in GP patients, thus the treatment strategies will be largely similar for these species
• The species distribution in UTI in outpatient departments is significantly different from that of GP’s reflecting more complicated patients. The resistance rates differ significantly by species and cultures are required for tailored therapy.
14 NethMap 2015
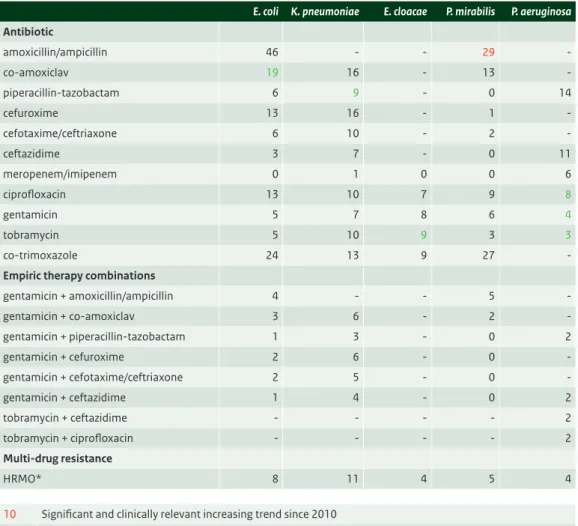
Unselected hospital patient departments
• High levels of resistance to amoxicillin, amoxicillin with clavulanic acid, cefuroxime, co-trimoxazole and ciprofloxacin, make these agents less suitable for empirical treatment in serious infections. The ciprofloxacin resistance rate of 17% in E.coli has further increased and is especially worrisome. • Piperacillin/tazobatam, cefotaxime/ceftriaxone, ceftazidime and aminoglycoside resistance rates are
all between 5 and 10% and in the range that is generally considered to be acceptable for patients not severely ill.
• Combination therapy of a beta-lactam with an aminoglycoside are still the best suitable options for empirical treatment in serious infections.
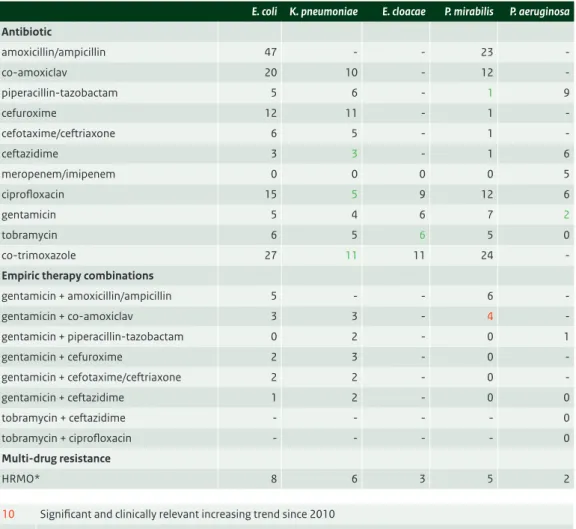
Intensive care patients
• There are no significantly important shifts in 2014. High levels of resistance to amoxicillin, amoxicillin with clavulanic acid, cefuroxime, co-trimoxazole and ciprofloxacin, make these agents less suitable for empirical treatment in serious infections. The ciprofloxacin resistance rate of 13% in E.coli is similar to 2013.
• There are significant differences in resistance rates between hospitals as well as over time. This clearly indicates that empiric therapy should be based on the local epidemiology of resistance. • Piperacillin/tazobactam, cefotaxime/ceftriaxone, ceftazidime and aminoglycoside resistance rates
are all between 5 and 10%. This is in a range that warrants combination therapy or at least close monitoring for the severely ill. However, resistance to combinations of a beta-lactam and an aminoglycoside is between 1 and 5%. It should be realized however, that resistance to combinations is based on the effect of the drug alone and does not take into account any synergistic effects that may be present.
2.5 Implications for public health and health policy
Antibiotic resistance is a serious threat to public health in Europe, leading to increased healthcare costs, prolonged hospital stays, treatment failures and sometimes death. At the European level there has been a significant increasing trend in the percentages of K. pneumoniae resistant to fluoroquinolones, third-generation cephalosporins and aminoglycosides, as well as combined resistance to all three antibiotic groups over the last years. During the same period, resistance to third-generation
cephalosporins increased significantly. The most worrying however, is the increase in the percentage of carbapenem resistance in K. pneumoniae which causes serious concern and a threat to patient safety in Europe.
In the Netherlands, with a few exceptions, no major shifts in resistance rates have occurred over the last five years. The resistance rates in 2014 did not increase further for most antibiotics. Yet, there is a continuing concern. For some microorganisms where resistance rates are apparently similar over the last years, an MIC creep is observed since last year below the clinical breakpoint, indicating that resistance may appear in the coming years.
The current measures to control the increase in antimicrobial resistance follow the perspective of human medicine: prudent antibiotic use, and screening and isolation of (hospitalised) patients at-risk.
15 NethMap 2015
However, introductions of resistant bacteria from abroad, from livestock, from the environment and from the general population play a role in the spread of resistance. Consequently, a much wider variety of control measures to reduce the population at risk is needed.
To take adequate interventions to control this spread, harmonized and integrated surveillance at regional, local and national level, in human healthcare as well as in the open population, the environment, food-producing animals and the food chain, is needed. To achieve this, intensive collaboration between professionals in the private and public domain in both human and veterinary health care will be necessary.
Conclusions
The data presented in NethMap 2015 demonstrate that the continuing shifts in patterns of antibiotic use and resistance require a rethinking of antimicrobial use and policy, including restricted use of some classes of antibiotics, in particular those that are employed as a last line of defense. To control the increase and spread of antibiotic resistance, trends in resistance and antibiotic use should be carefully monitored to allow intervention if necessary.
17 NethMap 2015
Introduction
In this chapter the use of antimicrobials over the past decade is reported. First, extramural antibiotic use from 2005 until 2014 is presented, including total antibiotic use, as well as use of subgroups and individual antibiotics. Second, antibiotic use in hospital care from 2004 until 2013 is reported using several measures: DDD/100 patient days, DDD/100 admissions, as well as in DDD/1000 inhabitant days (DID). Third, antibiotic use data from the point prevalence study of the PREZIES network are reported. Finally, we report data of antibiotic use in nursing homes in the Netherlands. For the first time, we present also point prevalence data on antibiotic use in nursing homes, collected by PREZIES.
3.1 Primary care
Methods
Dutch data of outpatient antibiotic use are annually obtained from the SFK (Foundation for
Pharmaceutical Statistics, the Hague) and are expressed in numbers of Defined Daily Doses (DDD) for each ATC-5 code. The SFK collects data from 90% of the Dutch community pharmacies (serving 91.5% of the Dutch population) and extrapolates the data to 100%. Data are presented as DDD per 1000 inhabitants per day (DID).
Results
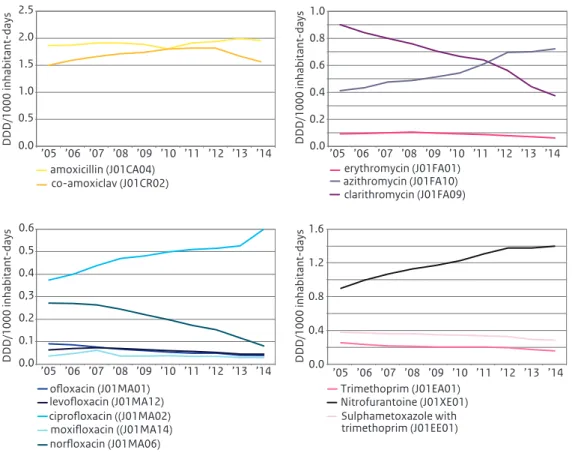
Compared to 2013, total community antibiotic use in 2014 showed a small decrease of 0.27 DID to 10.54 DID. After years of increases in antibiotic use from 10.51 in 2005 to 11.37 DID in 2011, total use declined for the third successive year (Table 3.1).
Broken down by groups of antibiotics, decreases were seen for the use of amoxicillin with clavulanic acid (8% to 1.55 DID), for macrolides (4% to 1.22 DID), for amoxicillin and for tetracyclines (mainly doxycycline). Of the macrolides, use of azithromycin increased to 0.73 DID, whereas the use of
3
18 NethMap 2015
Table 3.1 Ten years data on the use of antibiotics for systemic use (J01) in primary care (DDD/1000 inhabitant-days), 2005-2014 (Source: SFK).
ATC Group*
Therapeutic group 2005 2006 2007 2008 2009 2010 2011 2012 2013 2014
J01AA Tetracyclines 2.41 2.37 2.57 2.66 2.67 2.67 2.60 2.49 2.33 2.23 J01CA Penicillins with
extended spectrum 1.86 1.87 1.91 1.91 1.89 1.81 1.91 1.94 1.99 1.94 J01CE Beta-lactamase sensitive penicillins 0.44 0.50 0.46 0.42 0.39 0.37 0.35 0.33 0.31 0.30 J01CF Beta-lactamase resistant penicillins 0.29 0.31 0.32 0.36 0.38 0.38 0.39 0.41 0.41 0.44 J01CR Penicillins + beta-lactamase-inhibitors 1.50 1.59 1.66 1.71 1.74 1.80 1.82 1.82 1.67 1.55 J01D Cephalosporins 0.05 0.04 0.05 0.04 0.04 0.04 0.04 0.04 0.04 0.04 J01EA Trimethoprim and
derivatives 0.25 0.23 0.22 0.21 0.21 0.20 0.20 0.19 0.17 0.16 J01EC Intermediate-acting sulphonamides 0.00 0.00 0.00 0.00 0.00 0.00 0.00 0.00 0.00 0.00 J01EE Sulphonamides + trimethoprim 0.38 0.37 0.36 0.36 0.35 0.35 0.34 0.33 0.29 0.28 J01FA Macrolides 1.42 1.39 1.39 1.36 1.33 1.31 1.34 1.34 1.22 1.18 J01FF Lincosamides 0.08 0.09 0.10 0.11 0.12 0.14 0.15 0.16 0.17 0.18 J01GB Aminoglycosides 0.02 0.03 0.03 0.03 0.03 0.03 0.03 0.04 0.03 0.03 J01MA Fluoroquinolones 0.84 0.87 0.91 0.89 0.86 0.85 0.82 0.80 0.76 0.79 J01MB Other quinolones 0.02 0.02 0.02 0.02 0.01 0.01 0.01 0.01 0.01 0.00 J01XB Polymyxins 0.02 0.00 0.00 0.00 0.00 0.00 0.00 0.00 0.00 0.01 J01XE Nitrofuran derivatives 0.90 1.00 1.07 1.13 1.17 1.23 1.31 1.38 1.37 1.40 J01XX05 Methenamine 0.02 0.03 0.03 0.02 0.03 0.04 0.03 0.04 0.03 0.03
J01 Antibiotics for
systemic use (total)
10.51 10.73 11.10 11.24 11.21 11.23 11.37 11.34 10.81 10.54
* From the 2013 edition of the Anatomical Therapeutic Chemical (ATC) classification system
clarithromycin further declined to 0.38 DID. Use of ciprofloxacin increased by 13% compared to 2013. Use of nitrofurantoin is still increasing in the Netherlands.
Discussion
The positive news is that after years of increase in antibiotic use until 2011, now for the third year a slight decrease was seen in overall use of antibiotics in the Dutch community. Nevertheless, it has to be mentioned that use of three specific antibiotics increased: azithromycin, ciprofloxacin and
nitrofurantoin. For azithromycin, this is partly due to shifts in specific antibiotics used within the subgroup of macrolides, but the 13% increase in use of ciprofloxacin needs further assessment. Also of interest is the steadily increasing use of nitrofurantoin.
19 NethMap 2015
Figure 3.1 a-d Use of antibiotics for systemic use in primary health care, 2005-2014 (Source:SFK).
0.0 0.4 0.8 1.2 1.6 ’05 ’06 ’07 ’08 ’09 ’10 ’11 ’12 ’13 ’14 DDD/1000 inhabitant-days Trimethoprim (J01EA01) Sulphametoxazole with trimethoprim (J01EE01) Nitrofurantoine (J01XE01) 0.0 0.5 1.0 1.5 2.0 2.5 ’05 ’06 ’07 ’08 ’09 ’10 ’11 ’12 ’13 ’14 DDD/1000 inhabitant-days amoxicillin (J01CA04) co-amoxiclav (J01CR02) 0.0 0.2 0.4 0.6 0.8 1.0 ’05 ’06 ’07 ’08 ’09 ’10 ’11 ’12 ’13 ’14 DDD/1000 inhabitant-days erythromycin (J01FA01) clarithromycin (J01FA09) azithromycin (J01FA10) 0.0 0.1 0.2 0,3 0.4 0.5 0.6 ’05 ’06 ’07 ’08 ’09 ’10 ’11 ’12 ’13 ’14 DDD/1000 inhabitant-days ofloxacin (J01MA01) ciprofloxacin ((J01MA02) levofloxacin (J01MA12) moxifloxacin ((J01MA14) norfloxacin (J01MA06)
20 NethMap 2015
3.2 Hospital care
Methods
Data on the use of antibiotics in Dutch hospitals were collected by means of a questionnaire distributed to all Dutch hospital pharmacists. Data were received from 68 out of 91 hospitals, together with the annual number of bed-days and admissions. Data were entered in the ABC-calculator (www.escmid.org) for conversion into DDDs, using the ATC/DDD classification from the WHO1. Use of antibiotics is expressed as DDD/100 patient-days and in DDD/100 admissions. The number of patient-days is calculated by subtracting the number of admissions from the number of bed-days to compensate for the fact that in bed-days statistics both the day of admission and the day of discharge are counted as full days.
Hospital extrapolated data, expressed in DDD/1000 inhabitants per day, as used for the international antibiotic surveillance of the ECDC, are also reported. Hospital consumption data and corresponding hospital statistics were used to estimate total hospital consumption in the Netherlands. Methods are further described in Kwint et al 2.Data on annual number of inhabitants in the Netherlands were obtained from Statistics Netherlands (CBS).
Dutch hospitals furthermore collected detailed data on antibiotic usage (according to the methodology proposed by the ECDC), combined with the PREZIES prevalence study on healthcare associated infections. All patients admitted to the hospital had to be included, with the exception of patients on psychiatric wards and in the haemodialysis centre. Only systemic antibacterials (ATC-code J01) were included, with a maximum of three concomitant substances per patient.
Results
Compared to 2012, the in-patient use of antibiotics in 2013 increased from 71.3 DDD/100 patient-days to 74.7 DDD/100 patient-days (Table 3.2). From 2004 to 2009, there was a steady increase in total use from 52 to about 71 DDD/100 patient-days. Between 2009 and 2012, use remained about stable around 71 DDD/100 patient-days. Antibiotic use per 100 admissions also increased to 307.8 DDD/100 admissions, after years of declines to a minimum of 295.7 DDD/100 admissions in 2012.
Broken down by hospital category, university hospitals used the least antibiotics (72.5 DDD/100 patient-days), whereas large teaching hospitals the most (76.0 DDD/100 patient-days). General hospitals used 74.8 DDD/100 patient-days on average. With respect to the ATC-4 level figure 3.2 shows the distribution of use per antibiotic subgroup for these different types of hospitals in 2013. Notable is the large difference in the relative use of combinations of penicillins (mainly amoxicillin with clavulanic acid) between university hospitals (15.2%), large teaching hospitals (17.9%) and general hospitals (24.0%). Most carbapenems and glycopeptides were used in university hospitals and relatively more nitrofuran derivates in general hospitals. Large teaching hospitals were the highest users of cephalosporins.
The increase in antibiotic use in 2013 is mainly due to a substantial increase in the use of cephalosporins (Fig. 3.3 and 3.4), with an increase, compared with 2012, of 2.0% for first-generation (cefalexin, cefalotin and cefazolin were used). A higher increase was seen on second- and third-generation cephalosporins
21 NethMap 2015
Table 3.2 Ten years use of antibiotics for systemic use (J01) in hospitals, 2004-2013 (Source: SWAB).
ATC Group*
Therapeutic group 2004 2005 2006 2007 2008 2009 2010 2011 2012 2013
J01AA Tetracyclines 1.5 1.6 1.6 1.4 1.7 1.6 1.7 1.8 1.7 1.7 J01CA Penicillins with
extended spectrum 6.0 6.7 7.6 7.3 6.5 7.6 7.3 7.3 7.6 8.0 J01CE Beta-lactamase sensitive penicillins 1.4 1.4 1.4 1.2 1.3 1.6 1.5 1.5 1.7 1.9 J01CF Beta-lactamase resistant penicillins 5.7 5.8 5.9 5.7 6.4 6.6 6.8 6.7 7.1 8.1 J01CR Combinations of penicillins, incl. beta-lactamase-inhibitors 12.8 13.9 15.1 14.5 16.2 16.5 16.0 15.8 15.0 14.8 J01DB -DE Cephalosporins 7.0 7.4 8.4 8.4 8.8 10.1 10.2 11.1 12.1 13.4 J01DF Monobactams 0.0 0.0 0.0 0.0 0.0 0.0 0.0 0.0 0.0 0.0 J01DH Carbapenems 0.5 0.6 0.6 0.8 1.0 1.1 1.2 1.4 1.5 1.7 J01EA Trimethoprim and
derivatives 0.4 0.6 0.8 0.5 0.4 0.4 0.5 0.4 0.3 0.3 J01EC Intermediate-acting sulfonamides 0.1 0.0 0.0 0.1 0.1 0.0 0.0 0.0 0.1 0.0 J01EE Combinations of sulfonamides and trimethoprim, including derivatives 2.1 2.3 2.1 2.3 2.4 2.0 2.0 1.9 1.8 1.9 J01FA Macrolides 2.3 2.8 2.5 2.8 2.7 2.6 2.7 2.9 2.8 2.6 J01FF Lincosamides 1.8 1.9 2.0 2.1 2.1 2.4 2.3 2.3 2.2 2.3 J01GB Aminoglycosides 2.2 2.6 2.5 2.6 3.9 4.2 4.1 3.9 3.3 3.5 J01MA Fluoroquinolones 6.5 7.3 8.0 7.6 8.8 9.3 9.0 9.2 8.9 8.6 J01MB Other quinolones 0.1 0.1 0.1 0.0 0.1 0.1 0.0 0.0 0.0 0.0 J01XA Glycopeptides 0.6 0.8 0.7 1.0 1.1 1.3 1.3 1.3 1.4 1.5 J01XB Polymyxins 0.1 0.2 0.2 0.1 0.2 0.2 0.4 0.2 0.2 0.2 J01XC Steroid
antibac-terials (fusidic acid)
0.0 0.0 0.0 0.0 0.1 0.1 0.0 0.0 0.0 0.0 J01XD Imidazole derivatives 1.7 1.5 1.7 1.8 1.7 1.8 1.9 2.2 2.3 2.6 J01XE Nitrofuran derivatives 0.9 1.0 1.0 1.1 1.2 1.1 1.2 1.2 1.2 1.3 J01XX05 Methenamine 0.0 0.0 0.0 0.0 0.0 0.0 0.0 0.0 0.0 0.0 J01XX08 Linezolid 0.0 0.0 0.0 0.0 0.1 0.1 0.1 0.1 0.1 0.1 J01 Antibiotics for
systemic use (total)
53.7 58.5 62.2 61.6 66.8 70.9 70.2 71.3 71.3 74.7
expressed in DDD/100 patiënt days
J01 Antibiotics for
systemic use (total)
306.8 316.9 335.9 337.5 344.7 321.3 315.9 306.4 295.7 307.8
expressed in DDD/100 admissions
22 NethMap 2015 respectively 14.7% for second- and 15.3% for third-generation cephalosporins when measured in DDD/100 patient days. Use of second-generation cephalosporins consisted of: cefoxitin, cefuroxime, cefamandole and cefaclor, third-generation cephalosporins included use of: cefotaxime, ceftazidime,
Figure 3.2 Distribution (%) of the use of antibiotics for systemic use (J01) in hospitals, 2013 (Source:SWAB)
other antibacterials Nitrofuran derivatives Imidazole derivatives
Steroid antibacterials (fusidic acid) Polymyxins Glycopeptides Other quinolones Fluoroquinolones Aminoglycosides Lincosamides Macrolides
Combinations of sulfonamides and trimethoprim, including derivatives Intermediate-acting sulfonamides Trimethoprim and derivatives Carbapenems
Monobactams Cephalosporins
Combinations of penicillins, incl. beta-lactamase-inhibitors Beta-lactamase resistant penicillins Beta-lactamase sensitive penicillins Penicillins with extended spectrum Tetracyclines total N=68 universityhospitals N=8 large teaching hospitals N=18 general hospitals N=42 100% 90% 80% 70% 60% 50% 40% 30% 20% 10% 0%
23 NethMap 2015
ceftriaxone, cefixime and ceftibuten. University hospitals use much more third-generation cephalosporins than first- and second-generation ones, while in general hospitals, the use is evenly distributed among the three categories of cephalosporins (figure 3.5). However, in large teaching hospitals, use of second generation cephalosporins is increasing, while the first and third generation ones are decreasing.
Besides the cephalosporins there are some other antimicrobials with an increased use in 2013. Flucloxacillin shows a substantial increase to 7.9 DDD/100 patient-days. Meropenem use further
Figure 3.3 Use of beta-lactams in hospitals, expressed as DDD/100 patient-days (A) and DDD/100 admissions (B), 2004-2013 (Source:SWAB). 0 4 8 12 16 ’04 ’05 ’06 ’07 ’08 ’09 ’10 ’11 ’12 ’13 DDD/100 patient-days A
ampicillin (J01CA01 ) amoxicillin (J01CA04) benzylpenicillin (J01CE01) flucloxacillin (J01CF05) co-amoxiclav (J01CR02) piperacillin-tazobactam (J01CR05)
0 20 40 60 80 ’04 ’05 ’06 ’07 ’08 ’09 ’10 ’11 ’12 ’13 DDD/100 admissions B ’04 ’05 ’06 ’07 ’08 ’09 ’10 ’11 ’12 ’13 DDD/100 patient-days
First-generation cephalosporins (J01DB) Second-generation cephalosporins (J01DC) Third-generation cephalosporins (J01DD) Fourth-generation cephalosporins (J01DE)
0 5 10 15 20 25 ’04 ’05 ’06 ’07 ’08 ’09 ’10 ’11 ’12 ’13 ’04 ’05 ’06 ’07 ’08 ’09 ’10 ’11 ’12 ’13 ’04 ’05 ’06 ’07 ’08 ’09 ’10 ’11 ’12 ’13 DDD/100 admissions 0 0.2 0.4 0.6 0.8 1.0 1.2 1.4 1.6 DDD/100 patient-days
Meropenem (J01DH02) Ertrapenem (J01DH03) Doripenem (J01DH04) Imipenem/cilastatin (J01DH51) 0 1 2 3 4 5 6 7 0 1 2 3 4 5 6 DDD/100 admissions
24 NethMap 2015
Figure 3.4 Use of macrolides, aminoglycoside, fluoroquinolones and glycopeptides in hospitals, expressed as DDD/100 patient-days (A) and DDD/100 admissions (B), 2004-2013 (Source:SWAB).
0.0 0.4 0.8 1.2 1.6 ’04 ’05 ’06 ’07 ’08 ’09 ’10 ’11 ’12 ’13 ’04 ’05 ’06 ’07 ’08 ’09 ’10 ’11 ’12 ’13 ’04 ’05 ’06 ’07 ’08 ’09 ’10 ’11 ’12 ’13 ’04 ’05 ’06 ’07 ’08 ’09 ’10 ’11 ’12 ’13 ’04 ’05 ’06 ’07 ’08 ’09 ’10 ’11 ’12 ’13 ’04 ’05 ’06 ’07 ’08 ’09 ’10 ’11 ’12 ’13 ’04 ’05 ’06 ’07 ’08 ’09 ’10 ’11 ’12 ’13 ’04 ’05 ’06 ’07 ’08 ’09 ’10 ’11 ’12 ’13 DDD/100 patient-days A
Erythromycin (J01FA01) Roxithromycin (J01FA06) Clarithromycin (J01FA09) Azithromycin (J01FA10) 0.0 2.0 4.0 6.0 8.0 DDD/100 admissions B 0.0 0.4 0.8 1.2 1.6 2.0 DDD/100 patient-days A
Tobramycin (J01GB01) Gentamicin parenteral (J01GB03) Gentamicin local (J01GB03) Amikacin (J01GB06)
0.0 2.0 4.0 6.0 8.0 10.0 DDD/100 admissions B 0.0 2.0 4.0 6.0 8.0 DDD/100 patient-days A
Ofloxacin (J01MA01) Ciprofloxacin (J01MA02) Norfloxacin (J01MA06) Levofloxacin (J01MA12) Moxifloxacin (J01MA14)
0 10 20 30 40 DDD/100 admissions B 0.0 0.2 0.4 0.6 0.8 1.0 1.2 1.6 1.4 DDD/100 patient-days A
Vancomycin (J01XA01) Teicoplanin (J01XA02) 0.0 1.0 2.0 3.0 4.0 5.0 6.0 DDD/100 admissions B
25 NethMap 2015
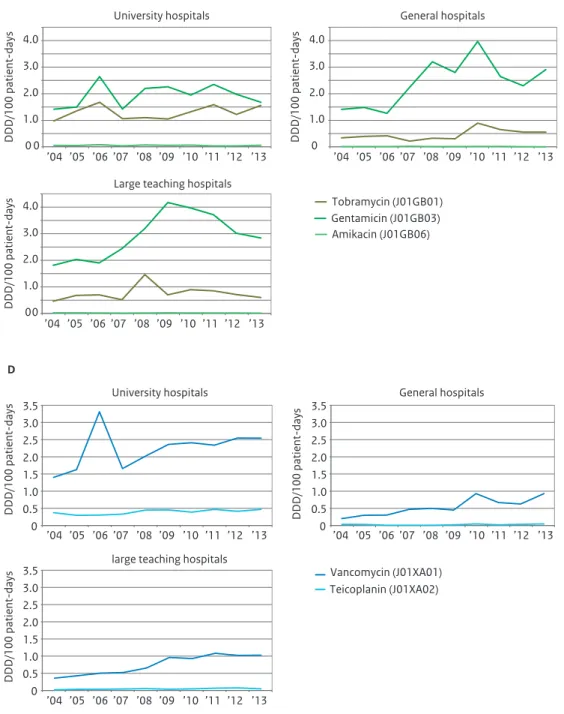
increased to 1.5 DDD/100 patient-days in 2013. University hospitals account for most of the meropenem use with 2.9 DDD/100 patient-days compared to 1.1 and 1.0 DDD/100 patient-days in large teaching and general hospitals respectively (figure 3.5). Finally use of aminoglycosides as well as glycopeptides overall showed a small increase in 2013. Large teaching and general hospitals show a higher use of gentamicin than university hospitals (figure 3.5), whereas glycopeptides were preferably used in university hospitals with 2.6 DDD/100 patient-days, compared to about 1 DDD/100 patient-days in large teaching and general hospitals.
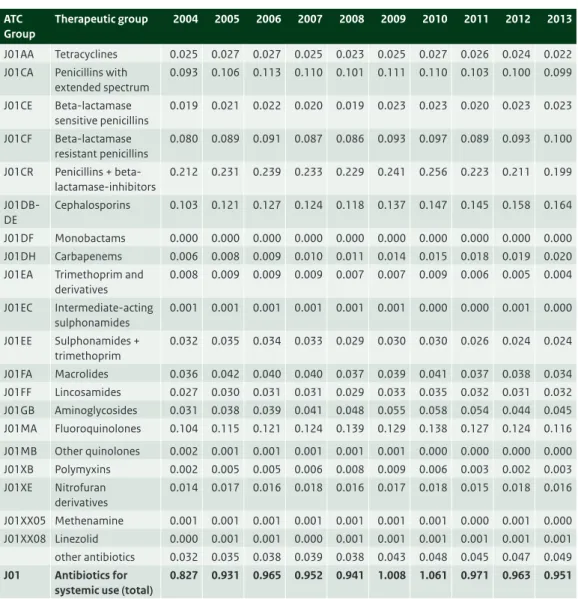
Table 3.3 Ten years data on the use of antibiotics for systemic use (J01) in hospital care (DDD/1000 inhabitant-days), 2004-2013 (Source: SWAB).
ATC Group
Therapeutic group 2004 2005 2006 2007 2008 2009 2010 2011 2012 2013
J01AA Tetracyclines 0.025 0.027 0.027 0.025 0.023 0.025 0.027 0.026 0.024 0.022 J01CA Penicillins with
extended spectrum 0.093 0.106 0.113 0.110 0.101 0.111 0.110 0.103 0.100 0.099 J01CE Beta-lactamase sensitive penicillins 0.019 0.021 0.022 0.020 0.019 0.023 0.023 0.020 0.023 0.023 J01CF Beta-lactamase resistant penicillins 0.080 0.089 0.091 0.087 0.086 0.093 0.097 0.089 0.093 0.100 J01CR Penicillins + beta-lactamase-inhibitors 0.212 0.231 0.239 0.233 0.229 0.241 0.256 0.223 0.211 0.199 J01DB-DE Cephalosporins 0.103 0.121 0.127 0.124 0.118 0.137 0.147 0.145 0.158 0.164 J01DF Monobactams 0.000 0.000 0.000 0.000 0.000 0.000 0.000 0.000 0.000 0.000 J01DH Carbapenems 0.006 0.008 0.009 0.010 0.011 0.014 0.015 0.018 0.019 0.020 J01EA Trimethoprim and
derivatives 0.008 0.009 0.009 0.009 0.007 0.007 0.009 0.006 0.005 0.004 J01EC Intermediate-acting sulphonamides 0.001 0.001 0.001 0.001 0.001 0.001 0.000 0.000 0.001 0.000 J01EE Sulphonamides + trimethoprim 0.032 0.035 0.034 0.033 0.029 0.030 0.030 0.026 0.024 0.024 J01FA Macrolides 0.036 0.042 0.040 0.040 0.037 0.039 0.041 0.037 0.038 0.034 J01FF Lincosamides 0.027 0.030 0.031 0.031 0.029 0.033 0.035 0.032 0.031 0.032 J01GB Aminoglycosides 0.031 0.038 0.039 0.041 0.048 0.055 0.058 0.054 0.044 0.045 J01MA Fluoroquinolones 0.104 0.115 0.121 0.124 0.139 0.129 0.138 0.127 0.124 0.116 J01MB Other quinolones 0.002 0.001 0.001 0.001 0.001 0.001 0.000 0.000 0.000 0.000 J01XB Polymyxins 0.002 0.005 0.005 0.006 0.008 0.009 0.006 0.003 0.002 0.003 J01XE Nitrofuran derivatives 0.014 0.017 0.016 0.018 0.016 0.017 0.018 0.015 0.018 0.016 J01XX05 Methenamine 0.001 0.001 0.001 0.001 0.001 0.001 0.001 0.000 0.001 0.000 J01XX08 Linezolid 0.000 0.001 0.001 0.000 0.001 0.001 0.001 0.001 0.001 0.001 other antibiotics 0.032 0.035 0.038 0.039 0.038 0.043 0.048 0.045 0.047 0.049 J01 Antibiotics for
systemic use (total)
26 NethMap 2015
Figure 3.5 Use of cephalosporins (A), carbapenems (B), aminoglycosides (C), glycopeptides (D) and fluoroquinolones (E) in hospitals broken down by type of hospital, expressed as DDD/100 patient-days, 2004-2013 (Source: SWAB)
0.0 1.0 2.0 3.0 4.0 5.0 6.0 7.0 ’04 ’05 ’06 ’07 ’08 ’09 ’10 ’11 ’12 ’13 ’04 ’05 ’06 ’07 ’08 ’09 ’10 ’11 ’12 ’13 ’04 ’05 ’06 ’07 ’08 ’09 ’10 ’11 ’12 ’13 DDD/100 patient-days 0.0 1.0 2.0 3.0 4.0 5.0 6.0 7.0 DDD/100 patient-days 0.0 1.0 2.0 3.0 4.0 5.0 6.0 7.0 DDD/100 patient-days University hospitals
Large teaching hospitals
Second-generation cephalosporins (J01DC) First-generation cephalosporins (J01DB)
General hospitals
Third-generation cephalosporins (J01DD) Fourth-generation cephalosporins (J01DE)
A 0 0.5 1.0 1.5 2.0 2.5 3.0 0 0.5 1.0 1.5 2.0 2.5 3.0 0 0.5 1.0 1.5 2.0 2.5 3.0 Meropenem (J01DH02) Ertrapenem (J01DH03) Doripenem (J01DH04) Imipenem/cilastatin (J01DH51) DDD/100 patient-days DDD/100 patient-days DDD/100 patient-days University hospitals
Large teaching hospitals
General hospitals
’04 ’05 ’06 ’07 ’08 ’09 ’10 ’11 ’12 ’13
’04 ’05 ’06 ’07 ’08 ’09 ’10 ’11 ’12 ’13
B
27 NethMap 2015
Figure 3.5 (continued) Use of cephalosporins (A), carbapenems (B), aminoglycosides (C), glycopeptides (D) and fluoroquinolones (E) in hospitals broken down by type of hospital, expressed as DDD/100 patient-days, 2004-2013 (Source: SWAB) 0 0 1.0 2.0 3.0 4.0 Tobramycin (J01GB01) Gentamicin (J01GB03) Amikacin (J01GB06) DDD/100 patient-days 0 1.0 2.0 3.0 4.0 DDD/100 patient-days 0 0 1.0 2.0 3.0 4.0 DDD/100 patient-days University hospitals
Large teaching hospitals
General hospitals ’04 ’05 ’06 ’07 ’08 ’09 ’10 ’11 ’12 ’13 ’04 ’05 ’06 ’07 ’08 ’09 ’10 ’11 ’12 ’13 ’04 ’05 ’06 ’07 ’08 ’09 ’10 ’11 ’12 ’13 C 0 0.5 1.0 1.5 2.0 2.5 3.0 3.5 0 0.5 1.0 1.5 2.0 2.5 3.0 3.5 0 0.5 1.0 1.5 2.0 2.5 3.0 3.5 Vancomycin (J01XA01) Teicoplanin (J01XA02) DDD/100 patient-days DDD/100 patient-days DDD/100 patient-days University hospitals
large teaching hospitals
General hospitals
’04 ’05 ’06 ’07 ’08 ’09 ’10 ’11 ’12 ’13
’04 ’05 ’06 ’07 ’08 ’09 ’10 ’11 ’12 ’13
’04 ’05 ’06 ’07 ’08 ’09 ’10 ’11 ’12 ’13
28 NethMap 2015 A decrease in use in 2013 is seen for ciprofloxacin use, which decreased further by 1.8% compared to 2012, as well as the use of amoxicillin with clavulanic acid which declines from 14.1 in 2012 to 13.8 DDD/100 patient-days in 2013.
Over 75% of the antimycotics (J02), antimycobacterials (J04) and antivirals (J05) for systemic use were used in university hospitals. In table 3.4 use of J02, J04 and J05 in university hospitals is presented from 2007 until 2013, expressed in DDD/100 patient-days. The use of antimycotics increased in 2013
compared to 2012, mainly because of an increased use of amfothericin B. Use of antimycobacterials increased to 2.88 DDD/100 patient-days, caused by an increased use of rifampicin. Use of antivirals remained stable at 5.47 DDD/100 patient-days in 2013.
In 2014 PREZIES data were received from fifty one hospitals (twice as much as in 2013), including 12329 patients of which 3988 received antibiotics, with a total of 5302 prescriptions (2760 for community acquired infections, 681 for nosocomial infections, 674 for medical prophylaxis, 503 for surgical prophylaxis and 547 for other or unknown indications). Antibiotic use for these indications is depicted in figure 3.6. Most often used antibiotics were amoxicillin with clavulanic acid (18%), ciprofloxacin (11%) and cefuroxim (8%). Cefazolin was used in 54% cases of surgical prophylaxis. Use for medical
prophylaxis was more diverse, ciprofloxacin was most often used (13%), followed by amoxicillin with clavulanic acid and trimethoprim/sulfamethoxazole.
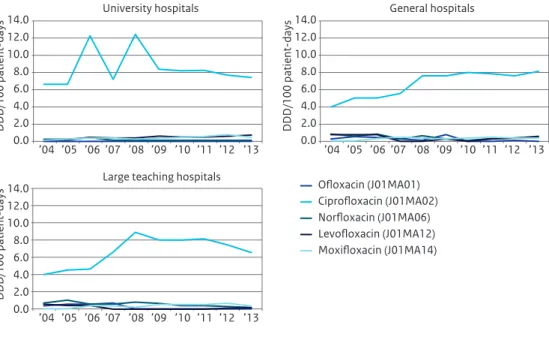
Figure 3.5 (continued) Use of cephalosporins (A), carbapenems (B), aminoglycosides (C), glycopeptides (D) and fluoroquinolones (E) in hospitals broken down by type of hospital, expressed as DDD/100 patient-days, 2004-2013 (Source: SWAB) 0.0 2.0 4.0 6.0 8.0 10.0 12.0 14.0 0.0 2.0 4.0 6.0 8.0 10.0 12.0 14.0 0.0 2.0 4.0 6.0 8.0 10.0 12.0 14.0 ’04 ’05 ’06 ’07 ’08 ’09 ’10 ’11 ’12 ’13 ’04 ’05 ’06 ’07 ’08 ’09 ’10 ’11 ’12 ’13 ’04 ’05 ’06 ’07 ’08 ’09 ’10 ’11 ’12 ’13 DDD/100 patient-days DDD/100 patient-days DDD/100 patient-days University hospitals
Large teaching hospitals
Ciprofloxacin (J01MA02) Ofloxacin (J01MA01) General hospitals Norfloxacin (J01MA06) Levofloxacin (J01MA12) Moxifloxacin (J01MA14) E
29 NethMap 2015
Discussion
Compared with 2012 we seen an intensification of antibiotic use in hospitals and in individual patients, as antibiotics use increased by almost 5% when measured in DDD/100 patient-days and 4% when expressed in DDD/100 admissions.
There are marked shifts between different subgroups of antibiotics. Increased use of 3rd-generation-cephalosporins and meropenem is of particular interest, even though, in a European context, it’s use is still low. As illustrated in the results there are marked differences between the three types of hospitals. Most remarkable is the difference in use of the cephalosporins. University hospitals have a higher use
Table 3.4 Use of antimycotics, antimycobacterials and antivirals for systemic use (J02, J04, J05) in university hospitals (DDD/100 patient-days), 2007-2013 (Source: SWAB).
ATC Group *
Therapeutic group 2007 2008 2009 2010 2011 2012 2013
J02AA01 Antibiotics (amphotericin B) 4.44 1.12 1.35 1.65 1.77 2.43 3.01 J02AB02 Imidazole derivatives (ketoconazole) 0.12 0.11 0.08 0.15 0.09 0.10 0.06 J02AC Triazole derivatives 5.18 6.36 6.72 6.31 5.83 6.25 6.29 J02AX Other antimycotics for systemic use 0.19 0.40 0.61 0.56 0.57 0.55 0.71
J02 Antimycotics for systemic use (total) 9.93 7.98 8.77 8.66 8.26 9.33 10.06
J04AA Aminosalicylic acid and derivatives 0.00 0.00 0.00 0.00 0.00 0.00 0.00 J04AB Antibiotics (mainly rifampicin) 1.44 1.34 1.27 1.41 1.56 1.24 1.43 J04AC Hydrazides (mainly isoniazide) 0.39 0.29 0.40 0.34 0.30 0.40 0.57 J04AD Thiocarbamide derivatives 0.00 0.00 0.00 0.00 0.01 0.00 0.00 J04AK Other drugs for treatment of tuberculosis
(pyrazinamide, ethambutol)
0.38 0.31 0.34 0.37 0.26 0.31 0.16 J04AM Combinations of drugs for tuberculosis 0.00 0.00 0.00 0.00 0.00 0.01 0.02 J04BA Drug for treatment of leprosy (dapson) 0.53 0.39 0.33 0.45 0.49 0.62 0.70
J04 Antimycobacterials for systemic use (total) 2.74 2.33 2.35 2.58 2.62 2.57 2.88
J05AB Nucleosides excl. Reverse transcriptase inhibitors (J05AB)
1.72 2.00 2.22 2.02 2.18 2.24 2.33 J05AD Phosphonic acid derivatives (J05AD) 0.06 0.11 0.13 0.10 0.10 0.15 0.12 J05AE Protease inhibitors (J05AE) 0.70 0.92 0.75 0.78 0.55 0.81 0.63 J05AF Nucleoside reverse transcriptase inhibitors
(J05AF)
0.83 0.74 0.64 0.67 0.63 0.69 0.54 J05AG Non-nucleoside reverse transcriptase
inhibitors (J05AG)
0.20 0.25 0.23 0.22 0.14 0.18 0.16 J05AH Neuraminidase inhibitors (J05AH) 0.02 0.05 n.a.# 0.21 0.42 0.19 0.49 J05AR Antivirals for the treatment of HIV,
combinations (J05AR)
0.33 0.52 0.55 0.76 0.69 0.91 0.89 J05AX Other antivirals (J05AX) 0.00 0.06 0.06 0.15 0.17 0.24 0.29
J05 Antivirals for systemic use (total) 3.86 4.65 4.59 4.91 4.89 5.41 5.47
* From the 2013 edition of the Anatomical Therapeutic Chemical (ATC) classification system # Total use not to be assesed because of alternative distribution during the pandemic
30 NethMap 2015
Figure 3.6 Distribution of the use of antibiotics for systemic use (J01) ; results of the point-prevalence studies 2014 (Source: PREZIES)
medical prophylaxis
surgical prophylaxis
treatment nosocominal infections
treatment community acquired infections
cefazolin 54% metronidazole 13% amoxicillin with clavulanic acid 11% cefuroxim 8% ciprofloxacin 3% ceftriaxon 3% flucloxacillin 2% clindamycin 1% amoxicillin1% other 4% amoxicillin with clavulanic acid 17% ciprofloxacin 11% cefuroxim 10% flucloxacillin 10% vancomycin 7% metronidazole 5% ceftriaxon 5% meropenem 5% piperacillin/ tazobactam 4% Other 26% amoxicillin with clavulanic acid 21% ciprofloxacin 13% cefuroxim 9% amoxicillin 8% ceftriaxon 7% flucloxacillin 6% metronidazole 5% clindamycin 4% trimethoprim/ sulfamethoxazole 3% other 24% ciprofloxacin 13% amoxicillin with clavulanic acid 12% trimethoprim/ sulfamethoxazole 12% selective darm decontamination 9% selective oral decontamination 7% ceftriaxon 5% cefotaxim 4% metronidazole 4% cefazolin 3% other 31%
31 NethMap 2015
of third-generation cephalosporins, whereas large teaching hospitals, use more second-generation cephalosporins. In general hospitals, use is evenly distributed between the three groups of
cephalosporins. The high use of third-generation cephalosporins can partly be explained by the use of cefotaxim for selective decontamination of the digestive tract, a procedure commonly used in the Netherlands on intensive care units.
The use of broad spectrum antibiotics deserves special attention. Meropenem use is still increasing, with much higher use in University hospitals compared to the other types of hospitals. The decrease in ciprofloxacin use is mainly caused by a decrease in large teaching hospitals. From a number of these hospitals, it is known that they initiated a campaign to limit quinolone use. Fluoroquinolone use now is highest in general hospitals, which is potentially worrisome.
Other remarkable changes are the increased use of metronidazol and rifampicine. The latter one probably for the treatment of bone and joint infections in combination with flucloxacillin. Metronidazol in combination with a second-generation cephalosporin is widely used as prophylactic regimen in large teaching hospitals.
32 NethMap 2015
3.3 Care in nursing homes
Methods
All hospital pharmacists participating in the surveillance of antibiotic use in hospitals were asked to provide the antibiotic consumption data from nursing homes their pharmacy is serving. Data from 34 nursing homes were received. The size of these homes varied from 15 to 821 residents per home, with a mean of 250 residents. In total, the antibiotic use of 8499 residents was included. For each nursing home the amount of DDD/1000 residents/day was calculated, and their weighed mean was calculated. In nursing homes a PREZIES prevalence study was performed according the same method as described in the intramural methods.
Results
This year we received data from 34 nursing homes, an increase compared with 25 in 2012. The use of antibiotics varied hugely for the different nursing homes with a minimum of 14 and a maximum of 131 DDD/1000 residents/day. The mean use was 65 DDD/1000 residents/day. Combinations of penicillins (mainly amoxicillin with clavulanic acid), with 18.9 DDD/1000 residents/day, nitrofurantoin derivates (13.7 DDD/1000 residents/day) and fluoroquinolones (7.9 DDD/1000 residents/day) were most frequently used (Table 3.5).
Figure 3.7 depicts antibiotics used in the PREZIES prevalence study in nursing homes. We received data from 45 nursing homes. A total of 5679 residents were participating, 1755 men and 4015 women of which 257 patients with an infection, with a total of 263 prescriptions. Prescriptions of an antibiotic used ten times or more are depicted in figure 3.7. Leader by far is nitrofurantoin (31% of the total antibiotic use), followed by amoxicillin with clavulanic acid and ciprofloxacin.
Discussion
Compared with previous years, more or less the same pattern of usage is seen. The most frequently used antibiotic is amoxicillin with clavulanic acid (29 %), followed by nitrofurantoin (21%) and fluoroquinolones (12%).
Notable is the relatively lower use of tetracyclines (11%) compared to the use in primary care. The high use of nitrofurantoin is not surprising, as urinary tract infections are common among elderly patients. With respect to broad spectrum antibiotics, the high use of fluoroquinolones is especially worrisome. The broad range of use suggests that there is considerable variation in antimicrobial use in nursing homes across the Netherlands. However, details about differences in characteristics of residents and care provided (rehabilitation, palliative care) are still lacking. Nursing homes provide a significant service and more information should be available in order to optimise antimicrobial use and limit the development of antimicrobial resistance.
PREZIES data on nursing homes are reported for the first time. The results of the point prevalence study show a somewhat different pattern of usage compared with the SWAB surveillance data, with
nitrofurantoin as most frequently prescribed antibiotic. PREZIES data are based on prescriptions on an index day, whereas overall use is based on DDD’s collected over 365 days.
33 NethMap 2015
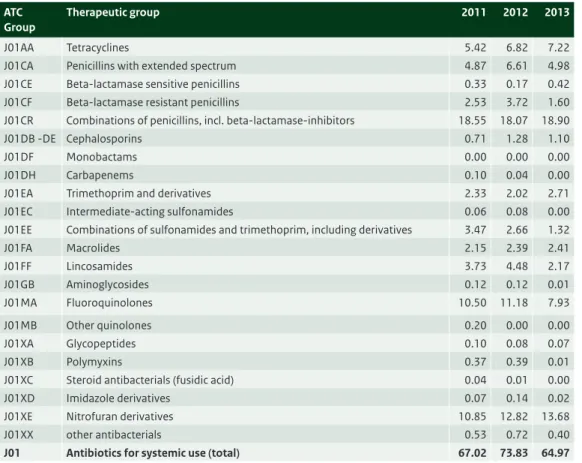
Table 3.5 Distribution of the use of antibiotics (J01) in nursing homes, expressed as DDD/1000 residents/day, 2011-2013 (Source: SWAB).
ATC Group
Therapeutic group 2011 2012 2013
J01AA Tetracyclines 5.42 6.82 7.22 J01CA Penicillins with extended spectrum 4.87 6.61 4.98 J01CE Beta-lactamase sensitive penicillins 0.33 0.17 0.42 J01CF Beta-lactamase resistant penicillins 2.53 3.72 1.60 J01CR Combinations of penicillins, incl. beta-lactamase-inhibitors 18.55 18.07 18.90 J01DB -DE Cephalosporins 0.71 1.28 1.10
J01DF Monobactams 0.00 0.00 0.00
J01DH Carbapenems 0.10 0.04 0.00
J01EA Trimethoprim and derivatives 2.33 2.02 2.71 J01EC Intermediate-acting sulfonamides 0.06 0.08 0.00 J01EE Combinations of sulfonamides and trimethoprim, including derivatives 3.47 2.66 1.32
J01FA Macrolides 2.15 2.39 2.41 J01FF Lincosamides 3.73 4.48 2.17 J01GB Aminoglycosides 0.12 0.12 0.01 J01MA Fluoroquinolones 10.50 11.18 7.93 J01MB Other quinolones 0.20 0.00 0.00 J01XA Glycopeptides 0.10 0.08 0.07 J01XB Polymyxins 0.37 0.39 0.01
J01XC Steroid antibacterials (fusidic acid) 0.04 0.01 0.00 J01XD Imidazole derivatives 0.07 0.14 0.02 J01XE Nitrofuran derivatives 10.85 12.82 13.68 J01XX other antibacterials 0.53 0.72 0.40
J01 Antibiotics for systemic use (total) 67.02 73.83 64.97
Figure 3.7 Distribution of the use of antibiotics for systemic use (J01) in nursing homes; results of the point- prevalence studies 2014 (Source: PREZIES)
nursing homes PREZIES 2014
nitrofurantoin 31% amoxicillin with clavulanic acid 15% ciprofloxacin 13% doxycycline 5% trimethoprim 5% other 31%
34 NethMap 2015
References
1 WHO Collaborating Centre for Drug Statistics Methodology, ATC index with DDDs 2011, WHO Collaborating Centre; Oslo, Norway, 2012
2 Kwint HM, Van der Linden PD. Roukens MMB et al, Intensification of antibiotic use within acute care hospitals in the Netherlands, J of antimicrob chemother 2012; 67: 2283-2288
Figure 3.8 Comparison of the distribution of antibiotic usage (J01) in primary care, hospital care and care in nursing homes in 2013.
other antibacterials
hospitals nursing homes primary care
Nitrofuran derivatives Imidazole derivatives
Steroid antibacterials (fusidic acid) Polymyxins Glycopeptides Other quinolones Fluoroquinolones Aminoglycosides Lincosamides Macrolides
Combinations of sulfonamides and trimethoprim, including derivatives Intermediate-acting sulfonamides Trimethoprim and derivatives other beta-lactam antibacterials Combinations of penicillins, incl. beta-lactamase-inhibitors Beta-lactamase resistant penicillins Beta-lactamase sensitive penicillins Penicillins with extended spectrum Tetracyclines 100% 90% 80% 70% 60% 50% 40% 30% 20% 10% 0%
35 NethMap 2015
4
Surveillance of resistance
4.1 Methods and description of ISIS-AR data
4.1.1 Methods
The Infectious Disease Surveillance Information System for Antibiotic Resistance (ISIS-AR)
Since 2008, routinely available antimicrobial susceptibility data of all isolates from Dutch medical laboratories, including underlying minimal inhibitory concentration (MIC) values and disk zone diameters, are collected in the Infectious Disease Surveillance Information System for Antibiotic Resistance (ISIS-AR). This surveillance system is a combined initiative of the Ministry of Health, Welfare and Sport and the Dutch Society of Medical Microbiology (NVMM), and is coordinated by the Centre for Infectious Disease Control at the National Institute for Public Health and the Environment (RIVM) in Bilthoven. In 2014, ISIS-AR received data from 33 laboratories of which 21 laboratories had complete data over the five most recent years (2010 to 2014) over which we calculated time trends for the current report. To avoid bias in time trends due to incomplete data we used data from these 21 laboratories only for all analyses in the current report. Three of these laboratories were serving university hospitals, 16 laboratories were serving non-university hospitals and general practitioners and one laboratory was only serving general practitioners. We calculated resistance percentages and linear time trends over the five most recent years (2010 to 2014) for the most prevalent pathogens in combination with their main antimicrobial treatment options.
Selection of isolates
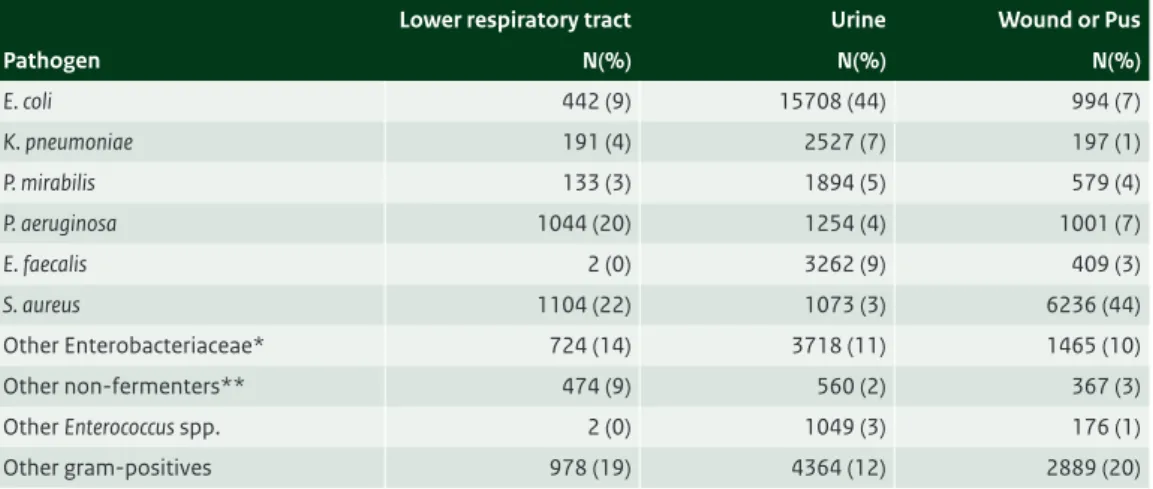
Resistance levels and time trends were calculated as the percentage resistant isolates by site; i.e. general practice (GP), outpatient departments (OPD), inpatient departments (excl. intensive care units), intensive care units, and urology departments. For GP (chapter 4.2) and urology departments (chapter 4.3.5) we selected only urinary isolates. For the OPD (chapter 4.3.1), inpatient departments (excl. intensive care units, chapter 4.3.2), and intensive care units (chapter 4.3.3), the selected isolates originated from blood, cerebrospinal fluid, urine, lower respiratory tract, and wound/pus. Additionally,