Contact: J. Slootweg
European Air Quality & Sustainability jaap.slootweg@mnp.nl
Collaborative report by:
EMEP – Meteorological Synthesizing Centre - East
wge
wge
of theof theWorking Group on Effects
Working Group on Effects
Convention on Long-range Transboundary Air Pollution
Convention on Long-range Transboundary Air Pollution
ICP M&M Coordination Center for Effects
J. Slootweg, J.-P. Hettelingh, M. Posch (eds.)
S. Dutchak, I. Ilyin (EMEP/MSC-E)
Working Group on Effects of the
Convention on Long-range Transboundary Air Pollution
wge
Report 259101015/2005
ISBN: 90-6960-119-2
Netherlands Environmental Assessment Agency (MNP associated with the RIVM), PO Box 303,
3720 AH Bilthoven, The Netherlands, telephone +31 30 2742745, website: www.mnp.nl
This investigation has been performed by order and for the account of the Directorate for Climate Change and Industry of the Dutch Ministry of Housing, Spatial Planning and the Environment within the framework of RIVM-project M259101, “UNECE-LRTAP”; and for the account of (the Working Group on Effects within) the trustfund for the partial funding of effect oriented activities under the Convention.
Contents
Acknowledgements... 4
Abstract... 5
Rapport in het kort ... 6
Preface ... 7
PART I. Status of Maps and Methods 1. Critical Loads of Cd, Pb and Hg in Europe - Executive Summary... 9
2. Summary of National Data... 17
3. The European Background Database for Heavy Metals ... 33
4. Deposition Modelling for Heavy Metals... 39
5. More on Exceedances of Critical Loads ... 61
PART II. National Focal Centre Reports... 67
AUSTRIA ... 68 BELARUS ... 71 BELGIUM ... 72 BULGARIA... 78 CYPRUS... 83 GERMANY ... 89 FINLAND... 94 FRANCE... 97 ITALY ... 101 NETHERLANDS ... 107 POLAND ... 113 RUSSIAN FEDERATION ... 117 SLOVAKIA ... 119 SWEDEN... 120 SWITZERLAND ... 124 UKRAINE ... 128 UNITED KINGDOM ... 129 APPENDICES A. Instructions for the Call for Data ... 134
B Ecosystem types and EUNIS codes ... 134
C
.
First Estimate of Cadmium and Lead Input by Fertilizers and Animal Manure to Agricultural Soils... 134Acknowledgements
The methods and resulting maps contained in this report are the product of collaboration within the Effects Programme of the UNECE Convention on Long-range Transboundary Air Pollution,
involving many institutions and individuals throughout Europe. National Focal Centres, whose reports regarding modelling and mapping activities appear in Part II are gratefully acknowledged for their contribution.
In addition the Coordination Center for Effects of the Netherlands Environmental Assessment Agency (MNP) at RIVM thanks the following:
•
The Directorate for Climate Change and Industry of the Dutch Ministry of Housing, Spatial Planning and the Environment and Mr. J. Sliggers in particular for their continued support;•
The UNECE Working Group on Effects, the Task Force of the International Co-operative Programme on the Modelling and Mapping of Critical Levels and Loads and Air Pollution Effects, Risks and Trends and its Expert Panel on Heavy Metal Groups for their collaboration and assistance;•
The EMEP Steering Body for its collaboration;•
The UNECE secretariat of the Convention on Long-range Transboundary Air Pollution for its valuable support, including the preparation of official documentations.Abstract
Critical Loads of Cadmium, Lead and Mercury in Europe
This progress report describes the critical loads of cadmium, lead and mercury derived for European ecosystems using human and environmental endpoints in the framework of activities of MNP-Coordination Center for Effects (CCE) under the Convention on Long-range Transboundary Air Pollution (LRTAP). Critical loads are compared to atmospheric deposition of these heavy metals in 1990 and 2000 to assess the risk to human health and the environment. Depositions of heavy metals are computed by the EMEP-Meteorological Synthesizing Centre East using national emissions recorded in official inventories. A tentative comparison is also made between critical loads and the input of cadmium and lead from agricultural practices. Finally, computed ambient concentrations of lead and cadmium in 2000 are viewed in the context of the first and fourth daughter directives of the European Commission Framework Directive 96/62/EC on ambient air quality assessment and management.
Seventeen Parties to the Convention on Long-range Transboundary Air Pollution of the United Nations Economic Commission for Europe participated in the computation and mapping of critical loads. Critical loads of cadmium, lead and mercury were computed by 16, 16 and 9 countries, respectively. Results showed exceedances to diminish between 1990 and 2000, especially for cadmium and lead. In 2000, the exceedance of critical loads of cadmium only occurs in a few European ecosystem areas. Depositions of lead, however, continue to exceed critical loads in many areas in most of the European countries. The distribution of the risk of mercury does not significantly change over time in the countries that submitted data. A preliminary assessment of fertilisation practices in Europe in 2000 suggests that the resulting lead-input will lead to a further exceedance of critical loads. Accumulation of the agricultural and atmospheric input of cadmium seems to increase the risk of cadmium in a few areas only. Finally, European guideline and limit values for yearly average ambient concentrations of lead and cadmium respectively, turn out not to be exceeded by computed ambient concentration in EMEP 50×50 km2 grid cells in Europe in 2000. Since atmospheric
ambient concentrations and deposition are related (with critical loads of lead and cadmium being exceeded in many areas of Europe), these results suggest that the European guideline and limit values may be less adequate than critical loads for the assessment of the risk of lead and cadmium in the context of long-range transboundary air pollution.
Keywords: air quality guidelines, atmospheric deposition, cadmium, critical loads, exceedances, lead, mercury.
Rapport in het kort
Kritische Waarden voor Cadmium, Lood en Kwik.
Dit rapport beschrijft de kritische waarden voor lood, cadmium en kwik voor ecosystemen in Europa, gebaseerd op menselijke en ecologische gezondheid. Kritische waarden zijn drempels voor
atmosferische deposities of concentraties waarboven mens of natuur bloot staat aan schaderisico. Hierbij worden limieten voor concentraties in grondwater en voedsel uit WHO en EU documenten, en bekende ecotoxicologische effecten gehanteerd. Deze kritische waarden worden vervolgens
vergeleken met de atmosferische depositie van de zware metalen in 1990 en 2000. Omdat depositie niet op zich staat worden ook de kritische waarden voor lood en cadmium tentatief vergeleken met de toevoer op landbouwgebieden van deze metalen door bemestingspraktijken in Europa. Tot slot is gekeken hoe de kritische waarden zich verhouden tot de door de Europese Commissie gehanteerde jaargemiddelde grenswaarden voor atmosferische concentraties.
Zeventien landen onder de Conventie voor grootschalige grensoverschrijdende luchtverontreiniging namen deel aan het onderzoek.
Overschrijdingen van kritische waarden van vooral lood en cadmium blijken sinds 1990 af te nemen. Toch is in 2000 de atmosferische depositie van cadmium op beperkte schaal in oost Europa nog te hoog, en blijft de depositie van lood te hoog in vele gebieden verspreid over de meeste Europese landen. Het risico van kwik blijft aanwezig in de 9 landen die hierover gegevens aanleverden. Bemestingspraktijken leiden tot overschrijdingen van kritische waarden voor lood, met name in Nederland. Voor cadmium neemt het risico door depositie toe door de toevoer van (kunst)mest in een enkele Oost-Europese regio.
Tenslotte wordt geconstateerd dat de door de Europese Commissie gehanteerde richtlijnen voor gemiddelde jaarlijkse atmosferische concentraties van lood en cadmium nergens in Europa worden overschreden door de voor 2000 berekende concentraties in EMEP 50×50 km2 gridcellen. Aangezien
atmosferische concentraties en deposities samenhangen moet op basis van de gegevens van het hier gerapporteerde onderzoek voorlopig worden geconstateerd dat de Europese richtlijnen voor met name lood niet voldoende zijn om risico’s van te hoge looddepositie in vele Europese regio, inclusief vrijwel geheel Nederland, te voorkomen.
Trefwoorden: atmosferische depositie, cadmium, kwik, lood, kritische drempels, luchtkwaliteit, overschrijdingen.
Preface
At its twenty-third session (Geneva, 1-3 September 2004), the Working Group on Effects requested the Coordination Center for Effects (CCE) of the International Co-operative Programme on the Modelling and Mapping of Critical Levels and Loads and Air Pollution Effects, Risks and Trends (ICP M&M) to issue a call for data on critical loads of Cadmium (Cd), Lead (Pb) and Mercury (Hg) (see EB.AIR/WG.1/2004/2). In response to this invitation the CCE issued a call for data on these critical loads in October 2004 requesting its 25 National Focal Centres (NFCs) to respond not later than 31 December 2004.
This report summarises results based on the response of 17 parties received by the CCE before the 15th CCE workshop (Berlin, 25-27 April 2005). Results received after the 21st meeting of the Task
Force of the ICP M&M (Berlin, 28-29 April 2005) have not been incorporated in this report. Critical loads of cadmium, lead and mercury were computed by 16, 16 and 9 countries respectively. The report is produced in collaboration with EMEP/MSC-E to enable the preliminary comparison of critical load maps to atmospheric deposition of lead, cadmium and mercury in 1990 and 2000. The work performed by NFCs used results from preparatory work conducted under the Convention since 1995. In 1998, two manuals were published, presenting guidelines for calculation methods, critical limits and input data for the calculation of critical loads of heavy metals for terrestrial and aquatic ecosystems. The development of those manuals started in 1994 and several drafts were discussed at CCE workshops in 1995, 1996 and 1997. The manuals and other background documents were also discussed at the “International Workshop on Critical Limits and Effect-based Approaches for Heavy Metals and POPs” in November 1997 in Bad Harzburg.
Since the publication of the manuals a “Workshop on Effects-based Approaches for Heavy Metals” was held in Schwerin, Germany, 12–15 October 1999, focusing on the use of methods and transfer functions and on critical limits to calculate critical loads. Furthermore, an “Ad-hoc International Expert Group Meeting on Effect-based Critical Limits for Heavy Metals” was held 11–13 October 2000 in Bratislava, Slovak Republic focussing specifically on the derivation of critical limits for heavy metals. A preliminary application of the methodology resulted in first European maps of critical loads, published by the CCE in 2002. Work was continued by the Expert Panel on Heavy Metals, which held a meeting on the methodology (Potsdam 4-5 March 2004). Finally, the methodology was documented in the Mapping Manual (chapter 5) of the ICP M&M which was made available to the NFCs as basis for their response to the call for data.
Chapter 1 serves as an executive summary including critical load and exceedance maps. Chapter 2 provides a detailed overview of the national submissions regarding ecosystems, and input data including an inter-country comparison of data statistics. Chapter 3 describes the CCE background database for calculating critical loads of cadmium and lead for forest soils in Europe. This database could be used to provide critical loads in countries that did not submit any data. Chapter 4 describes the methodology and data involved in the modelling of atmospheric dispersion of cadmium, lead and mercury, which have been used in this study to compute critical load exceedances. Chapter 5 assesses the risk caused by atmospheric deposition by identifying European areas where critical loads of cadmium, lead and mercury are exceeded. It also provides information resulting from a preliminary assessment of the additional risk of heavy metals in fertiliser applications to agricultural areas. Detailed NFC reports are provided in Part II. The report is completed with three appendices. Appendix A is a reprint of the “instructions” provided to the NFCs to assist in their response to the call for data. Appendix B lists the ecosystem types and their underlying EUNIS codes. Appendix C describes the methodology to derive tentative inputs of cadmium and lead from fertilisation practices in Europe.
Part I.
Status of Maps and Methods
1.
Critical Loads of Cd, Pb and Hg in Europe - Executive
Summary
Jean-Paul Hettelingh, Maximilian Posch, Jaap Slootweg, Sergey Dutchak*, Ilia Ilyin* *EMEP Meteorological Synthesizing Centre – East, Moscow.
1.1
Introduction
At its twenty-third session (Geneva, 1-3 September 2004), the Working Group on Effects under the Convention on Long-range Transboundary Air Pollution requested the Coordination Center for Effects (CCE) of the International Co-operative Programme on Modelling and Mapping to issue a call for data on critical loads of cadmium (Cd), lead (Pb) and mercury (Hg) (see EB.AIR/WG.1/2004/2). This call is a follow-up on preliminary results regarding critical loads of lead and cadmium which were obtained in 2002 (Hettelingh et al., 2002). Since then, significant progress has been made by many experts guided by the Expert Panel on Critical Loads of Heavy Metals under the ICP-M&M. A revised methodology for the modelling of critical loads of cadmium, lead and mercury has then been published in chapter 5.5 of the Mapping Manual, which is available (via www.icpmapping.org) to the National Focal Centres.
The call, which was sent out in October 2004 (with a deadline of 31 December 2004), requested National Focal Centres (NFCs) to provide data on the 50×50 km2 EMEP grid system (EMEP50 grid).
Parties received instructions on the format of the critical load database for submitting critical loads of cadmium, lead and mercury (see Appendix A): Respondents were encouraged to provide ecosystem information using the European Nature Information System (EUNIS; see
http://eunis.eea.eu.int/habitats.jsp) to enhance cross-border comparison of ecosystems (see also Hall 2001). Responses and adjustments of submissions were received by the CCE until the beginning of February.
Following recommendations from a joint meeting of the bureaux of the EMEP Steering Body and the Working Group on Effects, the collaboration between the EMEP/MSC-E and the CCE focused on establishing results of modelled depositions of cadmium, lead and mercury for 1990 and 2000 for the computation of exceedance maps (see also Chapter 4).
This chapter summarises the NFC response, resulting European critical load maps of cadmium, lead and mercury as well as their exceedances. The chapter uses material based on the response of 17 parties received by the CCE before the 15th CCE workshop (Berlin, 25-27 April 2005). Results
received after the 21st meeting of the Task Force of the ICP M&M (Berlin, 28-29 April 2005) could
not be incorporated anymore in this report.
1.2
Receptors for which critical loads are calculated
Critical loads of cadmium, lead and mercury are computed to establish maximum heavy metal depositions on different receptors at which eco-toxicological or human health effects do not occur. Critical limits for indicators of effects on the functioning of ecosystems and human health have been established for use in the computation of critical thresholds. Table 1-1 lists these indicators.
Table 1-1. Overview of indicators used in the computation of critical thresholds.(Adapted from UBA, 2004, Table 5.17). Receptor Ecosystem Endpoints Heavy metals of concern** Land cover types to be considered
Indicator/critical limit Effect number* used in Table 1-2 Cd, Pb, Hg All ecosystems Total concentration in soil water below the rooting zone(to protect ground water)
1
Cd, Pb, Hg Arable Content in food, fodder and crops
Human health effects
Cd, Pb, Hg Grassland Content in grass and animal products (cows, sheep) 2 Cd, Pb Arable land, grassland, non-agricultural
Free ion concentration in view of effects on soil micro-organisms, plants and invertebrates
Terrestrial
Ecosystem functions
Hg Forest soils Total concentration in humus layer in view of effects on soil micro organisms and invertebrates
3
Ecosystem functions
Cd, Pb, Hg Freshwaters Total concentration in view of effects on algae, crustacea, worms, fish, top predators
4
Aquatic
Human health
Hg Freshwaters Concentration in fish 5
* 1= human health effect (drinking water) via terrestrial ecosystem; 2= human health effect (food quality) via
terrestrial ecosystems; 3= Ecotoxicological effect on terrestrial ecosystems; 4= Ecotoxicological effect on aquatic ecosystems; 5= human health effect (food quality) via aquatic ecosystems.
**Metals in italics indicate that critical loads can be submitted on a voluntary basis
Table 1-1 shows that five effects are distinguished (last column). Critical limits were derived for human health effects of drinking water via terrestrial ecosystems (effect 1), for human health effects of food via terrestrial ecosystems (effect 2), for eco-toxicological effects via terrestrial ecosystems (effect 3) and via aquatic ecosystems (effect 4), and finally for human health of food via aquatic ecosystems (effect 5).
Internal metal cycling within an ecosystem is ignored, to keep the approach compatible with the steady-state mass balance method used for the computation of critical loads of nitrogen and acidity. Weathering inputs of metals are also neglected due to (i) low relevance of such inputs and (ii) high uncertainties of calculation methods. In consequence, critical loads were calculated as the sum of tolerable outputs from the considered systems (see chapter 5.5 in UBA, 2004).
1.3
Critical load results
Altogether, seventeen countries submitted critical loads of heavy metals. Critical loads of cadmium, lead and mercury were computed by 16, 16 and 9 countries, respectively. However not all countries addressed all effects, as is shown in Table 1-2.
Table 1-2. Overview of the country response on the call for critical loads of cadmium, lead and mercury and the 5 effects.
Effect number (see Table 1-1)
Cd Pb Hg Country Country code 1 2 3 4 1 3 4 1 3 5 Austria AT x x x x x x x Belarus BY x x Belgium BE x x x x x x x x x Bulgaria BG x x Cyprus CY x x x x x x Finland FI x France FR x x Germany DE x x x x x x x Italy IT x x Netherlands NL x x x x x Poland PL x x x Russia RU x x x x Slovakia SK x x x Sweden SE x x x x x Switzerland CH x x x x x Ukraine1 UA x United Kingdom GB x x Total 17 8 6 14 1 8 14 1 4 7 3
1Ukraine voluntarily submitted critical loads of lead for effect number 2.
Most National Focal Centres computed critical loads for terrestrial ecosystems of all metals
addressing eco-toxicological effects (effect 3) and health effects (effect 1). The European synthesis of the country submissions was done as follows. For each ecosystem in an EMEP50 grid cell the
minimum critical load of effects 1 to 4 was taken to identify the effect to which an ecosystem is most sensitive. Then for each EMEP50 grid cell the 5th percentile of the distribution of minimum critical
loads is calculated implying a critical load at which 95 percent of the ecosystems are protected in that grid cell against any of the four effects. Effect 5 is treated separately because it is not associated with a critical deposition but with a critical concentration in precipitation (CC). For this effect the 5th
percentile critical concentration is mapped in each EMEP50 grid cell, implying a value at which 95 percent of aquatic ecosystems will be protected from a health effect caused by the consumption of fish. The results of this procedure is shown in Figure 1-1, displaying the 5th percentile of the minimum
critical loads of cadmium (top left), lead (top right) and mercury (bottom left). Finally, the 5th
g ha-1a-1 < 1 1 - 2 2 - 3 3 - 4 > 4
CL(Cd) (5th percentile) Min. Eff 1-4
CCE/MNP g ha-1a-1 < 5 5 - 10 10 - 20 20 - 30 > 30
CL(Pb) (5th percentile) Min. Eff 1-4
CCE/MNP g ha-1a-1 < 0.05 0.05 - 0.10 0.10 - 0.20 0.20 - 0.30 > 0.30
CL(Hg) (5th percentile) Min. Eff 1-4
CCE/MNP ng L-1 < 0.5 0.5 - 1.0 1.0 - 2.0 2.0 - 3.0 > 3.0 CC(Hg) (5th percentile) Effect 5 CCE/MNP Figure 1-1. Critical loads (5th percentile) for cadmium (top left), lead (top right) and mercury (bottom left) to protect against effects 1 to 4, and the 5th percentile critical concentration of Hg for protecting against effect 5.
The areas which are most sensitive to atmospheric deposition of cadmium are in Belarus, eastern Bulgaria, Cyprus, the north-east of France, the north-east of Germany, the south-east of the United Kingdom, central Poland, Slovakia, and south-eastern Russia. With respect to lead the map of critical loads shows more sensitive areas to occur more in the east and north of Europe. Very low critical loads of mercury occur especially in Poland; and finally the lowest critical concentrations of mercury occur in the southern part of Sweden.
1.4
Preliminary exceedances
Exceedances are computed by comparing critical loads and levels with depositions and
concentrations. However, the robustness of the computed depositions and concentrations of Cd, Pb and Hg can not well be established due to the uncertainty of underlying reported emissions in 1990 and 2000 (see Chapter 4). Therefore, the results described in this section are to be considered as preliminary.
The meteorology of the year 2000 deviates significantly from the average, whereas 1990 is much closer. Therefore the depositions used to calculate the exceedances for 2000 are modelled using the 1990 meteorological data.
Accumulated Average Exceedances (AAE) have been computed to identify areas where atmospheric metal depositions are higher than critical loads. An AAE is the ecosystem area-weighted sum of the exceedances (deposition of a metal minus its critical load, with zero for non-exceedance) of all ecosystems in a grid cell. The AAE with respect to acidification and eutrophication was used in
support of the LRTAP protocol to “Abate Acidification, Eutrophication and Ground-level Ozone” (Gothenburg, 1999; see Posch et al. 2001) and the National Emission Ceiling Directive of the Economic Commission in 2001. Figure 1-2 shows the AAE of Cd (left) and Pb (right) for 1990 and 2000. As for nitrogen and sulphur, the CCE has also computed critical loads of Cd, Pb and Hg for forest ecosystems (effect 3) using the European background data base (see Chapter 3). These
background data could be used to ‘fill-in’ the European map with critical loads when national data are missing. However, the CCE did not apply the ‘fill-in’ procedure this time, since some countries expressed reservations about using the background data base for this purpose.
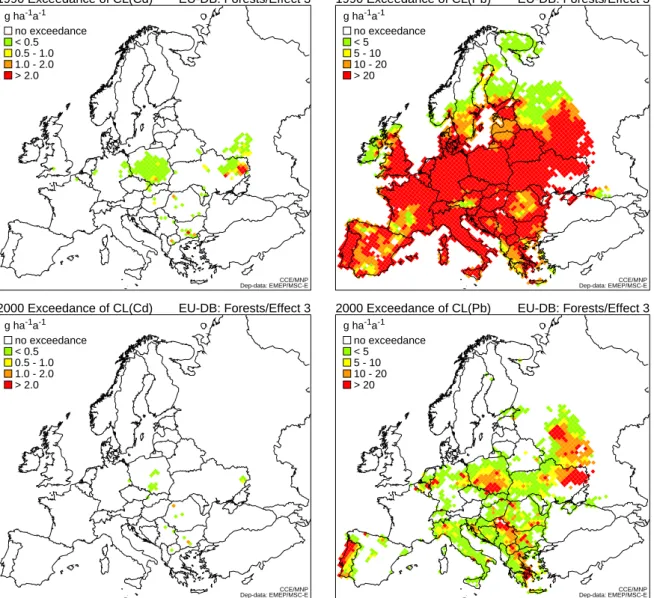
g ha-1a-1 no exceedance < 0.5 0.5 - 1.0 1.0 - 2.0 > 2.0 Exceedance of CL(Cd) 1990
Dep-data: EMEP/MSC-ECCE/MNP
g ha-1a-1 no exceedance < 5 5 - 10 10 - 20 > 20 Exceedance of CL(Pb) 1990
Dep-data: EMEP/MSC-ECCE/MNP
g ha-1a-1 no exceedance < 0.5 0.5 - 1.0 1.0 - 2.0 > 2.0 Exceedance of CL(Cd) 2000
Dep-data: EMEP/MSC-ECCE/MNP
g ha-1a-1 no exceedance < 5 5 - 10 10 - 20 > 20 Exceedance of CL(Pb) 2000
Dep-data: EMEP/MSC-ECCE/MNP
Figure 1-2. Average Accumulated Exceedances of critical loads of cadmium (left) and lead (right) in 1990 (top) and 2000 (bottom). White grid cells indicate non-exceedance, whereas white areas without grid indicate no data.
It is obvious from Figure 1-2 that exceedances of critical loads of both cadmium (left) and lead (right) have significantly decreased between 1990 (top) and 2000 (bottom). Areas which are exceeded by cadmium deposition in 2000 are found in eastern Germany, Poland and Slovakia. Lead exceedances in 2000 are more wide-spread but the magnitude has dramatically decreased since 1990.
Figure 1-3 shows Average Accumulated Exceedances (left; minimum of effects 1-4)) and Average Accumulated Concentration Exceedance (right; effect 5) of mercury from 1990 (top) to 2000 (bottom). The AAE time trend shows a decrease in Germany in 2000 in comparison to 1990. The Average Accumulated Concentration in 1990 is very similar (except for a few grid cells) to that in 2000. More can be found in chapter 5, where exceedances are discussed in relation to effects, fertilisation and deposition modelling.
g ha-1a-1 no exceedance < 0.05 0.05 - 0.10 0.10 - 0.20 > 0.20 Exceedance of CL(Hg) 1990 Dep-Data: EMEP/MSC-E CCE/MNP ng L-1 no exceedance < 2 2.0 - 4.0 4.0 - 6.0 > 6.0 Exceedance of CC(Hg) 1990 Conc-Data: EMEP/MSC-E CCE/MNP g ha-1a-1 no exceedance < 0.05 0.05 - 0.10 0.10 - 0.20 > 0.20 Exceedance of CL(Hg) 2000 Dep-Data: EMEP/MSC-E CCE/MNP ng L-1 no exceedance < 2 2.0 - 4.0 4.0 - 6.0 > 6.0 Exceedance of CC(Hg) 2000 Conc-Data: EMEP/MSC-E CCE/MNP
Figure 1-3. Average Accumulated Exceedances (left; minimum of effects 1-4)) and Average Accumulated Concentrations (right; effect 5) of mercury in 1990 (top) and 2000 (bottom). White grid cells indicate non-exceedance, whereas white areas without grid indicate no data.
1.5
Preliminary exceedances on agricultural areas including
fertilisation
Atmospheric deposition of cadmium and lead is not the only cause for exceedance of critical loads. Fertilisation of agricultural areas also causes cadmium and lead to enter soil systems. In collaboration with other RIVM specialists (see Appendix C) a preliminary estimate of the agricultural input of these metals in 2000 was made and added to the atmospheric input. Results are shown in Figure 1-4 for cadmium (left) and lead (right).
Figure 1-4 illustrates that the inclusion of fertilisation hardly leads to an exceedance of critical loads of cadmium in countries that submitted critical loads for agricultural areas (areas marked with grid cells). However, with respect to lead Figure 1-4 shows that inputs from agricultural practices
moderately change the magnitude and distribution of the AAE computed with atmospheric deposition alone (Figure 1-2). Our preliminary results on heavy metal inputs from agricultural practices suggest that fertilisation alone (excluding atmospheric deposition) causes critical loads of cadmium to be exceeded in a limited number of grid cells in countries that submitted critical loads for agricultural areas, whereas for lead exceedances occur more broadly (see Chapter 5, Figure 5-5).
g ha-1a-1 no exceedance < 0.5 0.5 - 1.0 1.0 - 2.0 > 2.0
Exceedance of CL(Cd) 2000 ave dep. + agri input
Dep-data: EMEP/MSC-E CCE/MNP g ha-1a-1 no exceedance < 5 5 - 10 10 - 20 > 20
Exceedance of CL(Pb) 2000 ave dep. + agri input
Dep-data: EMEP/MSC-E CCE/MNP
Figure 1-4. The Accumulated Average Exceedance of critical loads of cadmium (left) and lead (right) caused by the sum of atmospheric deposition and inputs from fertilisation practices on agricultural areas for which critical loads were submitted. White grid cells indicate non-exceedance, whereas white areas without grid indicate no data.
1.6
Exceedances in view of an EC limit value for Cd and an EC
guideline value for Pb
In 1996 the EC Environmental Council adopted Framework Directive 96/62/EC on ambient air quality assessment and management1. This directive also set a timetable for the development of
daughter directives on a range of pollutants including lead (first daughter directive) and cadmium (fourth daughter directive). These daughter directives include guideline and limit values for (average annual) ambient concentrations on urban and other areas, generally established on the basis of WHO recommendations. For lead the WHO recommended an annual average concentration of 0.5 μg m-3 as
guideline value. The WHO was unable to recommend a deposition guideline value (European
Commission, 1997, pp. 33). For cadmium, an average annual concentration of 5 ng m-3 is proposed as
limit value (European Commission, 2001).
These levels were compared to average ambient concentrations computed by MSC-E for 2000 in each of the EMEP50 grid cells. These comparisons reveal that limit (Cd) and guideline (Pb) values are not exceeded anywhere in Europe. However, an ambient concentration is associated with a deposition in each EMEP50 grid cell. And Figure 1-2 (bottom) shows the grid cells where limit and guideline values are not violated, whereas critical loads of cadmium (left) and lead (right) are exceeded (in the year 2000).
The position paper on mercury (European Commission 2001b) states that sufficient information lacks to relate mercury levels in the air to accumulated body burden. This prevents a similar analysis to be conducted for mercury.
1.7
Conclusions
Critical loads of cadmium, lead and mercury were successfully computed and mapped by 17 Parties of the LRTAP Convention. Critical loads of cadmium, lead and mercury were computed by 16, 16 and 9 countries, respectively.
The methodology that was recommended in the call for data was carefully reviewed and documented in the Mapping Manual of the ICP on Modelling and Mapping. The methodology enabled the assessment of ecosystem specific critical loads to protect human or environmental health.
These critical loads were compared to preliminary computations of ecosystem specific deposition of the respective metals in 1990 and 2000. The robustness of deposition results can not yet well be established due to the uncertainty of reported emissions. Bearing these uncertainties in mind, it is shown that atmospheric deposition of cadmium does not cause widespread risk in 2000, that the risk of lead deposition decreases since 1990 but is still widespread in 2000 and, finally, that the risk caused by mercury does not change much throughout the years in most of the countries that provided data on mercury.
In addition to an analysis of the risk of effects caused by atmospheric deposition, two additional analyses were conducted:
The first concerns the input of cadmium and lead from agricultural practices in addition to atmospheric deposition. This analysis revealed that fertilisation alone (excluding atmospheric deposition) causes critical loads of cadmium to be exceeded in a limited number of grid cells in countries that submitted critical loads for agricultural areas, whereas for lead exceedances are higher and occur more broadly. This should be taken into consideration when assessing the exceedance of critical loads of these heavy metals.
The second analysis compares European limit values for cadmium and guideline values for lead to computed annual average air concentrations. These limit and guideline values for cadmium and lead turn out to be not exceeded by annual average concentrations computed for 2000 in EMEP 50×50 km2
grid cells. This suggests that the European limit and guideline values are less adequate than critical loads for the assessment of the large-scale risk of lead and cadmium in the context of long-range transboundary air pollution.
References
European Commission (2001) Ambient air pollution by As, Cd and Ni compounds, Position Paper DG-Env, ISBN 92-894-2054-5
European Commission (2001b) Ambient air pollution by mercury, Position Paper, ISBN 92-894-4260-3. European Commission (1997) Position paper on lead, EC-General Directorate of Environmental Quality
(DG XI)
Hall J (2001) Harmonisation of Ecosystem Definitions. In: M Posch, PAM de Smet, J-P Hettelingh, RJ Downing (eds) Modelling and Mapping of Critical Thresholds in Europe. Status Report 2001, Coordination Center for Effects, pp. 67-71 (available at www.mnp.nl/cce)
Hettelingh J-P, Slootweg J, Posch M, Dutchak S, Ilyin I (2002) Preliminary modelling and mapping of critical loads for cadmium and lead in Europe. Collaborative WGE-EMEP report. RIVM Report 259101011, CCE/RIVM, Bilthoven, The Netherlands, 127 pp.
Posch M, Hettelingh J-P, De Smet PAM (2001) Characterization of critical load exceedances in Europe. Water, Air and Soil Pollution 130: 1139-1144
UBA (2004) Manual on methodologies and criteria for modelling and mapping of critical loads and levels and air pollution effects, risks and trends. Umweltbundesamt, Berlin; www.icpmapping.org
2.
Summary of National Data
Maarten van ’t Zelfde*, Jaap Slootweg
* Institute of Environmental Sciences (CML), Leiden University, the Netherlands
2.1
Introduction
The Working Groups on Effects (WGE) asked the Coordination Center for Effects (CCE) to issue a call for data for the heavy metals cadmium (Cd), lead (Pb) and mercury (Hg) in relation to the
forthcoming review of the 1998 Heavy Metals protocol. This call was issued in October 2004 with the deadline of 31 December 2004. All the data of the Parties (National Focal Centres) that responded to the call have been merged into a European dataset, and are displayed and discussed in this chapter. Prior to this reporting the countries received a preview of the European compilation of their data, to enable feedback in an early stage.
2.2
Requested variables
The underlying methodology for calculating critical loads of heavy metals has changed significantly since the preliminary call for critical loads data (cadmium and lead) in 2001 (see De Vries et al., 2005; Hettelingh et al., 2002).
This led to the following changes to the call:
New pollutants, effects-based methodologies for mercury (Hg) are available for:
− ecotoxicological effects in forest humus layers
− human health effects: indicator is Hg in fish (surface waters)
New endpoints: Inclusion of human health aspects of Pb, Cd, Hg:
− Cd in wheat − Hg in fish
− Pb, Cd, Hg in drinking water (protection of groundwater)
New critical limits (ecotoxicological) for Cd and Pb (application of the free ion approach for effects
of Cd and Pb on biota in terrestrial systems.
Only effects based approach. The so-called “stand still”, allowing no accumulation of the metals in
the soil, has no longer been applied.
A description of the methodology can be found in chapter 5.5 of the recent update of the Mapping Manual (UBA, 2004). The instructions for submitting data, including the requested data structure, variable names and units, as send to all National Focal Centres, can be found in Appendix A.
2.3
National responses
The CCE has requested the 25 National Focal Centres (NFCs) for (an update of) the critical load data of heavy metals. A total of 17 NFCs have responded to the request and delivered data for one or more metals and for one or more effects (see Table 1-1). An overview of the national submissions is given in Table 2-1.
Table 2-1. Overview of the number of ecosystems per country submitted for critical loads of cadmium, lead and mercury and the 5 endpoint.
Effect number (see Table 1-1)
Cadmium (Cd) Lead (Pb) Mercury (Hg)
Country (Country Code) 1 2 3 4 1 2 3 4 1 3 5 Austria(AT) 2,953 1,154 2,953 2,953 2,953 2,953 455 Belarus(BY) 9,503 9,503 Belgium(BE) 1,833 1,833 10 1,833 1,833 10 1,833 1,833 10 Bulgaria(BG) 84 84 Cyprus(CY) 31,893 8,274 31,893 31,893 31,893 31,893 Finland(FI) 820 France(FR) 3,840 3,840 Italy(IT) 881 881 Germany(DE) 290,003 144,211 290,003 290,003 290,003 290,003 99,866 Netherlands(NL) 12,627 10,180 30,484 12,627 30,484 Poland(PL) 88,383 88,383 88,383 Russia(RU) 6,616 22,828 9,992 20,206 Slovakia(SK) 320,891 320,891 320,891 Sweden(SE) 2450 2,070 2,070 5,396 2,977 Switzerland(CH) 57 220 56 221 277 Ukraine(UA) 46 46 United- Kingdom(GB) 234,654 234,654 Total 346,066 157,153 1,040,436 10 349,441 46 1,035,952 10 326,682 517,101 3,807
Figure 2-1 shows the percentage of the total country area for which critical loads have been submitted of cadmium, lead and mercury by ecosystem type and by effect (see Table 1-1). Mostly critical loads of cadmium and lead, and for ecotoxicological effects for terrestrial ecosystems (effect 3) have been submitted. Finland, Sweden and Belgium have submitted data for the human health effects for aquatic ecosystems (food quality, effect 5). Belgium has also submitted the ecotoxicological effects for aquatic ecosystems (effect 4). Forest is the dominant ecosystem considered in most of Europe for submitting critical loads. Critical loads for agricultural areas were submitted by 6 countries.
0 10 20 30 40 50 60 70 80 90 100 Cd Pb Hg Cd Cd Pb Hg Cd Pb Hg Cd Pb Hg Cd Pb Hg Cd Pb Cd Pb Cd Pb Cd Pb Hg Cd Pb Hg Cd Cd Pb Cd Pb Hg Cd Cd Pb Hg Hg Cd Pb Cd Pb Cd Pb Cd Pb Cd Cd Pb Cd Pb Hg Cd Pb Cd Pb Cd Cd Pb Hg Hg Cd Pb Hg Cd Pb 1 2 3 1 3 4 5 1 3 1 3 1 2 3 1 2 3 5 3 3 3 1 2 3 3 1 3 2 3 5 3 2 AT BE BG BY CH CY DE FI FR GB IT NL PL RU SE SK UA
Figure 2-1. National distribution of ecosystem types (% of total country area) by effect (see Table 1-1) for critical loads of cadmium, lead and mercury.
Other Water Wetlands Shrub Grassland Agriculture Forest Other Water Wetlands Shrub Grassland Agriculture Forest
All 17 submissions used the EUropean Nature Information System (EUNIS) to classify the ecosystem types, up to a very detailed level. These levels are truncated to a maximum of 2 characters.
Table 2-2 lists the areas (in km2) and the number of submitted ecosystems by heavy metal, indicating
the resolution each country uses for its calculations.
Table 2-2. Number of ecosystems and areas per national contribution.
Cd Pb Hg
Country Country
area (km2) EUNIS lev. 1
#ecosyst Area (km2) #ecosyst Area (km2) #ecosyst Area(km2) Forest 503 35,822 503 35,822 503 35,822 Agriculture 1,154 9,073 1,154 9,073 1,154 9,073 Grassland 1,296 16,491 1,296 16,491 1,296 16,491 Austria 83,858 total 2,953 61,386 2,953 61,386 2,953 61,386 Belarus 207,595 Forest 9,503 121,128 9,503 121,128 Forest 1,833 5,237 1,833 5,237 1,833 5,237 Water 10 9 10 9 10 9 Belgium 30,528 total 1,843 5,246 1,843 5,246 1,843 5,246 Bulgaria 110,994 Forest 84 48,330 84 48,330 Forest 7,438 1,860 7,438 1,860 7,438 1,860 Agriculture 13,869 3,467 13,869 3,467 13,869 3,467 Shrub 10,586 2,647 10,586 2,647 10,586 2,647 Cyprus 9,251 total 31,893 7,973 31,893 7,973 31,893 7,973 Finland 338,144 Water 820 16,856 France 543,965 Forest 3,840 170,657 3,840 170,657 Forest 101,306 101,306 101,306 101,306 101,306 101,306 Agriculture 144,211 144,211 144,211 144,211 144,211 144,211 Grassland 40,529 40,529 40,529 40,529 40,529 40,529 Shrub 3,205 3,205 3,205 3,205 3,205 3,205 Wetlands 659 659 659 659 659 93 Other 93 93 93 93 93 93 Germany 357,022 total 290,003 290,003 290,003 290,003 290,003 290,003 Forest 436 99,327 436 99,327 Agriculture 230 152,285 230 152,285 Grassland 215 26,551 215 26,551 Italy 301,336 total 881 278,163 881 278,163 Forest 17,857 2,900 17,857 2,907 Agriculture 12,627 19,522 12,627 19,522 Netherlands 41,526 total 30,484 22,422 30,484 22,429 Poland 312,685 Forest 88,383 88,383 88,383 88,383 88,383 88,383 Russia* 5,090,400 Forest 29,444 1,818,725 30,198 1,844,700 Slovakia 49,034 Forest 320,891 19,253 320,891 19,253 320,891 19,253 Forest 2,070 151,441 2,070 151,441 5,396 152,098 Agriculture 2,450 22,050 Water 2,977 293,749 Sweden 449,964 total 4,520 173,491 2,070 151,441 8,379 446,177 Switzerland 41,285 Forest 277 11,612 277 11,612 277 11,612 Ukraine 603,700 Agriculture 46 1,925 46 1,925 Forest 98,827 14,134 98,827 14,134 Grassland 73,816 14,637 73,816 14,637 Shrub 49,517 18,488 49,517 18,488 United Kingdom 243,307 Wetlands 12,494 3,892 12,494 3,892 total 234,654 51,151 234,654 51,151
All Countries 8,814,594 Grand Total 1,049,699 3,169,849 1,048,003 3,173,780 745,442 946,889
* European part.
All figures in this chapter show aggregated ecosystem types to EUNIS level 1, or grouped further into the main categories forest, (other semi-natural) vegetation, agriculture and water, as listed in Table 1 in Appendix B.
2.4
Critical loads
A critical load has been defined as a quantitative estimate of an exposure to one or more pollutants
below which significant harmful effects on specified sensitive elements of the environment do not occur according to present knowledge. In this call different endpoints, and pathways towards these
This section shows critical load maps and critical load distributions by country. Characteristic national features can often be explained by studying the national reports in Part II of this report.
Maps of the 5th percentile of the critical loads and critical concentrations are presented in Chapter 1
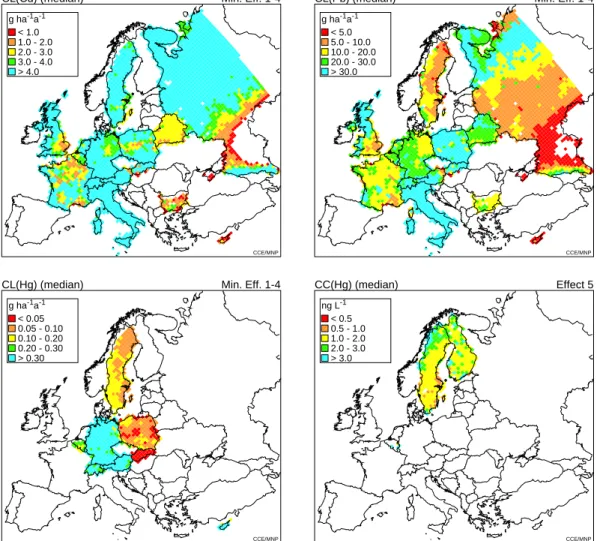
(Figure 1-1). Figure 2-2 shows median (50th percentile) values of these minimum critical loads for
countries that submitted data. Percentiles have been calculated as follows. For each ecosystem the minimum critical load of effects 1 to 4 was taken. Then for each EMEP50 grid cell the 5th and 50th
percentile of the distribution of minimum critical loads is calculated implying a critical load at which 95 and 50 percent of the ecosystems are protected respectively in that grid cell against any of the four effects. Effect 5 is treated separately because it is not associated with a critical deposition but with a critical concentration in precipitation (CC). For this effect the 50th percentile critical concentration is
mapped in each EMEP50 grid cell, implying a value at which 50 percent of aquatic ecosystems will be protected from a health effect caused by the consumption of fish.
g ha-1a-1 < 1.0 1.0 - 2.0 2.0 - 3.0 3.0 - 4.0 > 4.0
CL(Cd) (median) Min. Eff. 1-4
CCE/MNP g ha-1a-1 < 5.0 5.0 - 10.0 10.0 - 20.0 20.0 - 30.0 > 30.0
CL(Pb) (median) Min. Eff. 1-4
CCE/MNP g ha-1a-1 < 0.05 0.05 - 0.10 0.10 - 0.20 0.20 - 0.30 > 0.30
CL(Hg) (median) Min. Eff. 1-4
CCE/MNP ng L-1 < 0.5 0.5 - 1.0 1.0 - 2.0 2.0 - 3.0 > 3.0 CC(Hg) (median) Effect 5 CCE/MNP
Figure 2-2. Median values of the critical loads of Cd (top left) Pb (top right) and Hg (bottom left), and the critical concentration of Hg in precipitation(bottom right) of countries that submitted data.
Critical load maps
Cadmium
Figure 2-3 shows the 5th percentile values of the critical loads of cadmium for each effect separately
on the EMEP50 grid in countries that submitted data.
Most countries have submitted critical loads for effect 3 (ecotoxicological effects on terrestrial ecosystems). This map shows that the most sensitive areas are in Belarus, Cyprus, France, Poland, Slovakia and South-Russia. Comparison of the maps of the different effects shows that the effect with the lowest critical loads differs by country. For example, for the Netherlands effect 2 (human health
effects – food quality) is the most sensitive, whereas effect 1 (human health effect – drinking water) turns out to be the most sensitive for Germany.
g ha-1a-1 < 1 1 - 2 2 - 3 3 - 4 > 4 CL (Cd) (5th percentile) Effect 1 CCE/MNP g ha-1a-1 < 1 1 - 2 2 - 3 3 - 4 > 4 CL(Cd) (5th percentile) Effect 2 CCE/MNP g ha-1a-1 < 1 1 - 2 2 - 3 3 - 4 > 4 CL(Cd) (5th percentile) Effect 3 CCE/MNP g ha-1a-1 < 1 1 - 2 2 - 3 3 - 4 > 4 CL(Cd) (5th percentile) Effect 4 CCE/MNP
Figure 2-3. The 5th percentile EMEP50 grid values of the critical loads of cadmium for the different effects
(1: human health effects – drinking water; 2: human health effects – food quality; 3: ecotoxicological effects on terrestrial ecosystems; 4: ecotoxicological effects on aquatic ecosystems).
Lead
Figure 2-4 shows the 5th percentile values for the critical loads of lead for effect 1 and 3 on the
EMEP50 grid in countries that submitted data.
Ukraine has submitted critical loads for effect, which was mentioned in the Mapping Manual as a voluntary option. Belgium is the only country which also submitted critical loads for effect 4 (ecotoxicological effects on aquatic ecosystems). These two effects are not mapped here, since they show information for only three or four EMEP50 grid cells with 5th percentile values above
30 g ha-1 a-1. For effect 3 (ecotoxicological effects on terrestrial ecosystems) the majority of countries has submitted critical loads. According to Figure 2-4 that the most sensitive areas are in Cyprus, Slovakia, Sweden, Russia and the United Kingdom.
g ha-1a-1 < 5 5 - 10 10 - 20 20 - 30 > 30 CL(Pb) (5th percentile) Effect 1 CCE/MNP g ha-1a-1 < 5 5 - 10 10 - 20 20 - 30 > 30 CL(Pb) (5th percentile) Effect 3 CCE/MNP
Figure 2-4. The 5th percentile EMEP50 grid values of the critical loads of lead for effect 1 and 3 (1: human
health effects – drinking water; 3: ecotoxicological effects on terrestrial ecosystems). Mercury
Figure 2-5 shows the 5th percentile values for the critical loads of mercury for effect 1 and 3. For
effect 3 (ecotoxicological effects on terrestrial ecosystems) the most sensitive areas are in Poland, Slovakia and Sweden.
g ha-1a-1 < 0.05 0.05 - 0.10 0.10 - 0.20 0.20 - 0.30 > 0.30 CL(Hg) (5th percentile) Effect 1 CCE/MNP g ha-1a-1 < 0.05 0.05 - 0.10 0.10 - 0.20 0.20 - 0.30 > 0.30 CL(Hg) (5th percentile) Effect 3 CCE/MNP Figure 2-5. The 5th percentile EMEP50 grid values of the critical loads of mercury for effect 1 and 3 (1: human health effects – drinking water; 3: Ecotoxicological effects on terrestrial ecosystems).
Figure 2-6 shows the 5th percentile values for the critical concentration in rainfall of mercury for
effect 5 on the EMEP50 grid. For effect 5 (human health effects on aquatic ecosystems) Belgium (Walloon), Sweden and Finland have submitted data. The most sensitive area is in the southern part of Sweden.
ng L-1 < 0.5 0.5 - 1.0 1.0 - 2.0 2.0 - 3.0 > 3.0 CC(Hg) (5th percentile) Effect 5 CCE/MNP
Figure 2-6. The 5th percentile EMEP50 grid values of the critical rainfall concentration of mercury for effect 5 (human health effects on aquatic ecosystems).
Critical load distributions
This section describes the cumulative distribution function (CDFs) of critical loads for each country that submitted data. A CDF of critical loads gives information on the percent of the ecosystem area (on the Y-axis) which has a critical load below or equal to specific values (on the X-axis). For reasons of graphical layout, no scale has been marked on the Y-axis of the CDFs shown in this section. Two kinds of distributions are inspected. The first focuses (plots on the left) on the distribution of critical load values for each of 4 ecosystems and the European background database (EU-DB; thin black dotted line) which only contains information on forest soils (see Chapter 3). There are no data (yet) for Cyprus in the background database. The ecosystem types which have been distinguished in the plots reflect the aggregation of classes given in the first column of Table 1 in Appendix B. The second set of CDFs (plots on the right) looks distribution for each of the following 4 effects (except for Hg):
Drink Effect 1 Human health effects – drinking water;
Food Effect 2 Human health effects – food quality;
Eco-Terr Effect 3 Ecotoxicological effects on Terrestrial ecosystems;
Eco-Aqua Effect 4 Ecotoxicological effects on Aquatic ecosystems.
Cadmium
The CDFs of critical loads of cadmium are plotted in Figure 2-7. The submitted critical loads of cadmium are lower then those in the background database for the majority of the countries. The critical loads for agriculture ecosystems generally turn out to be lower than those for forests. Also note that 50th percentile critical loads of cadmium for forests (left plots) are between 4 and 6 g ha-1 yr-1
in France, the United Kingdom, Poland, Russia and Sweden, lower than 4 g ha-1 yr-1 in Belgium,
Bulgaria and Belarus, and higher than 6 g ha-1 yr-1 in Austria, Germany, Italy, the Netherlands,
Slovakia and Switzerland. Similarly we can see in the right-hand plots that the 50th percentile critical
loads for effect 3 (Eco-Terr; Ecotoxicological effects on Terrestrial ecosystems) are between 4 and 6 g ha-1 yr-1 in the same countries.
Lead
The distributions of the national critical loads of lead are plotted in Figure 2-8. The CDF of submitted critical loads of lead for forest ecosystems are approximately comparable to the CDF of critical loads computed with the background database in e.g. Bulgaria and Switzerland. The minimum critical load for agriculture ecosystems is generally lower than that for forests in e.g. Austria and the Netherlands . The critical loads for effect 3 (Eco-Terr) are generally lower than for effect 1 (Drink).
AT BE BG BY CH CY DE FI FR GB IT NL PL RU SE SK UA
CL(Cd)
g ha-1a-1 0 2 4 6 8 10Forest Agric. Veget. Water EU-DB
3462 2592 1006 3666 10 84 9503 277 21172 36012 14876 88972 432633 202612 3840 135827 98827 215 436 >10 230 35434 17857 88383 29444 2070 2450 320891 46 AT BE BG BY CH CY DE FI FR GB IT NL PL RU SE SK UA
CL(Cd) for effects
g ha-1a-1 0 2 4 6 8 10Drink Food Eco-Terr Eco-Aqua
2953 2953 1154 1833 1833 10 84 9503 220 57 31893 31893 8274 290003 290003 144211 3840 234654 881 12627 10180 30484 88383 22828 6616 2070 2450 320891 46 no data
Figure 2-7. The cumulative distribution functions (CDFs) of critical load of cadmium for the different ecosystems and for the European background database (‘EU-DB’) (left) and for the different effects (right). Mercury
The distributions of the national critical loads of mercury are plotted in Figure 2-9. The critical loads for Poland, Slovakia and Sweden are much lower than those for the other countries. The critical loads for effect 3 (Eco-Terr) are lower than for effect 1 (Drink).
AT BE BG BY CH CY DE FI FR GB IT NL PL RU SE SK UA
CL(Pb)
g ha-1a-1 0 10 20 30 40 50Forest Agric. Veget. Water EU-DB
2308 2592 1006 3666 10 84 9503 277 21172 27738 14876 88972 288422 202612 3840 98827 135827 215 >50 436 >50 230 25254 17857 88383 30198 2070 320891 46 AT BE BG BY CH CY DE FI FR GB IT NL PL RU SE SK UA
CL(Pb) for effects
g ha-1a-1 0 10 20 30 40 50Drink Food Eco-Terr Eco-Aqua
2953 2953 1833 1833 10 84 9503 221 56 31893 31893 290003 290003 3840 234654 881 12627 30484 88383 9992 20206 2070 320891 46 no data
Figure 2-8. The cumulative distribution functions (CDFs) of critical load of lead for the different ecosystems (left) and for the different effects (right).
Figure 2-10 shows the critical concentrations for mercury for effect 5 (human Health effects through aquatic ecosystems). The CDF contains the cumulative area of the critical concentration by chosen fish species indicator.
AT BE CH CY DE PL SE SK CL(Hg) 0 0.2 0.4 0.6 0.8 1.0 g ha-1a-1
Forest Agric. Veget.
>1.0 1154 958 >1.0 1296 3666 277 10586 13869 7438 44636 201022 144211 88382 5396 320891 AT BE CH CY DE PL SE SK CL(Hg) for effects 0 0.2 0.4 0.6 0.8 1.0 g ha-1a-1
Drink EcoTerr
>1.0 2953455 1833 1833 277 31893 99866 290003 88383 5396 320891
Figure 2-9. The cumulative distribution functions (CDFs) of critical load of mercury for the different ecosystems (left) and for the different effects (right).
BE FI SE CC(Hg) 0 1 2 3 4 5 ng L-1 pike trout 10 820 2977
Figure 2-10. The cumulative distribution functions of critical concentration of mercury in rainfall for the different fish species.
2.5
Input variables
The CCE requested also the input variables needed to calculate the critical loads. These variables depend on the effect and receptor considered. A selection of the CDFs of these variables is plotted in the next graphs, to enable a comparison of national submissions. Details on the national data can be found in the national reports in Part II.
Cadmium
Figure 2-11 shows for cadmium the CDFs of the net uptake (Cdu) the annual yield of biomass as dry
weight (Yha), the content of Cd in the harvested part of the plant ([Cd]ha), the critical leaching flux of
Cd from the topsoil (Cdle(crit) ), critical limit ([Cd]ss(crit)) and the flux of leaching water from the
Cdu
Forest Agric. Veget.Water EU-DB
AT BE BG BY CH CY DE FI FR GB IT NL PL RU SE SK UA 0 2 4 6 8 10 g ha -1a-1 3462 2592 1006 3666 10 84 9503 277 21172 36012 14876 88972 432633 202612 3840 135827 98827 215 436 230 35434 17857 88383 29444 2070 2450 320891 46 Yha(Cd)
Forest Agric. Veget. EU-DB
AT BE BG BY CH CY DE FI FR GB IT NL PL RU SE SK UA 0 2000 4000 6000 8000 10000 kg ha-1a-1(dw) 3462 2592 1006 3666 84 9503 277 21172 36012 14876 88972 432633 202612 3840 135827 98827 215 436 230 35434 17857 88383 29444 2070 2450 320891 46 [Cd]ha
Forest Agric. Veget.Water EU-DB
AT BE BG BY CH CY DE FI FR GB IT NL PL RU SE SK UA 0 0.2 0.4 0.6 0.8 1.0 mg kg-1(dw) 3462 2592 924 >1.0 10 3666 84 9503 277 21172 36012 14876 88972 432633 202612 3840 135827 98827 >1.0 215 >1.0 436 >1.0 230 35434 17857 88383 29444 2070 2450 320891 46 Cdle(crit)
Forest Agric. Veget.Water EU-DB
AT BE BG BY CH CY DE FI FR GB IT NL PL RU SE SK UA 0 2 4 6 8 10 g ha -1a-1 3462 2592 1006 3666 10 84 9503 277 21172 36012 14876 88972 432633 202612 3840 135827 98827 215 436 230 35434 17857 88383 29444 2070 2450 320891 46 [Cd]ss(crit)
Forest Agric. Veget.Water EU-DB
AT BE BG BY CH CY DE FI FR GB IT NL PL RU SE SK UA 0 2 4 6 8 10 mg m-3 3462 2592 1006 3666 10 84 9503 277 21172 36012 14876 88972 432633 202612 3840 135827 98827 215 436 230 35434 17857 88383 29444 2070 2450 320891 46 Qle (Cd)
Forest Agric. Veget.Water EU-DB
AT BE BG BY CH CY DE FI FR GB IT NL PL RU SE SK UA 0 0.2 0.4 0.6 0.8 1.0 m a-1 3462 2592 1006 3666 10 84 9503 277 21172 36012 14876 88972 432633 202612 3840 135827 98827 215 436 230 35434 17857 88383 29444 2070 2450 320891 46
Figure 2-11. CDFs of the net uptake of cadmium (Cdu), the annual yield of biomass, as dry weight (Yha), the
content of cadmium in the harvested part of the plant ([Cd]ha), the critical leaching flux of Cd from the topsoil
Italy, Belarus and the Netherlands (agriculture) have broader ranges of net uptake values for cadmium than the other countries.
National submissions of the annual yield of biomass cover a broader range than the values of the EU-background database.
The submitted values for the content of cadmium in the harvested part of the plant turn out to vary while the EU-database applies a standard value of 0.3 mg/kg. The submitted values for Italy are higher than those for the other countries.
Belarus has a fixed critical leaching concentration which is close to the minimum of the ranges used by many other countries. Bulgaria used the recommendation from the Mapping Manual for drinking water, 3 mg m3. Ranges depend on the effects addressed by NFCs
Agriculture ecosystems have lower critical leaching fluxes than forests.
Values for the flux of leaching water in forest soils are approximately similar to the values from the EU-background database in many of the countries.
Figure 2-12 shows for each country a scatter plot of submitted soil-pH (X-axis) versus submitted uptake (Y-axis) within the considered soil depth (Cdu) for forest, agriculture and vegetation. There
does not seem to be an apparent correlation between pH and metal uptake. Uptake quantities for Italy and the Netherlands are much higher than those of the other countries.
Figure 2-12. Soil-pH vs. metal uptake (Cdu) for different ecosystem types.
The correlation between metal leaching and pH has been explored as well (see Figure 2-13). In some countries a lower leaching flux turns out to occur with higher pH values. However, for most countries no such correlation seems straightforward.
Figure 2-13. Soil-pH vs. metal leaching (Cdle) for different ecosystem types.
Table 2-3 shows the used soil layer codes in the different countries. In the EU-database the critical loads have been calculated for the mineral layer. The submitted data shows that some of the NFCs have used different soil layers.
Table 2-3. The used layer codes (1 = humus layer only, 2 = mineral layer (A-horizon) only, 3 = humus layer + mineral layer, 4 = entire rooting depth).
Humus
layer Mineral layer (A-horizon) Humus + mineral layer Entire rooting zone Unknown
effect effect effect effect effect
Country code 1 3 1 2 3 1 3 1 2 3 2 4 AT 85 2,450 1,154 2,868 503 BE 1,833 1,833 10 BG 84 BY 9,503 CH 220 57 CY 8,274 24,455 7,438 31,893 DE 144,211 188,547 101,456 290,003 FR 3,840 GB 234,654 IT 881 NL 17,857 12,627 10,180 12,627 PL 88,383 RU 6,616 22,828 SE 2,070 2,450 SK 320,891 UA 46
Lead
The net uptake of lead (Pbu), the annual yield of biomass as dry weight (Yha), the content of Pb in the
harvested part of the plant ([Pb]ha), the critical leaching flux of Pb from the topsoil (Pble(crit)), and the
critical limit ([Pb]ss(crit) ) are displayed in CDFs of Figure 2-14.
Pbu
Forest Agric. Veget.Water EU-DB
AT BE BG BY CH CY DE FI FR GB IT NL PL RU SE SK UA 0 10 20 30 40 50 g ha -1a-1 2308 2592 1006 3666 10 84 9503 277 21172 27738 14876 88972 288422 202612 3840 98827 135827 215 436 230 25254 17857 88383 30198 2070 320891 46 Yha(Pb)
Forest Agric. Veget.Water EU-DB
AT BE BG BY CH CY DE FI FR GB IT NL PL RU SE SK UA 0 2000 4000 6000 8000 10000 kg ha-1a-1(dw) 2308 2592 1006 3666 10 84 9503 277 21172 27738 14876 88972 288422 202612 3840 98827 135827 215 436 230 25254 17857 88383 30198 2070 320891 46 [Pb]ha
Forest Agric. Veget.Water EU-DB
AT BE BG BY CH CY DE FI FR GB IT NL PL RU SE SK UA 0 2 4 6 8 10 mg kg-1(dw) 2308 2592 924 3666 >10 10 84 9503 277 21172 27738 14876 88972 288422 202612 3840 98827 135827 >10 215 >10 436 >10 230 25254 17857 88383 30198 2070 320891 46 Pble(crit)
Forest Agric. Veget.Water EU-DB
AT BE BG BY CH CY DE FI FR GB IT NL PL RU SE SK UA 0 10 20 30 40 50 g ha -1a-1 2308 2592 1006 3666 10 84 9503 277 21172 27738 14876 88972 288422 202612 3840 98827 135827 215 436 230 25254 17857 88383 30198 2070 320891 46 [Pb]ss(crit)
Forest Agric. Veget.Water EU-DB
AT BE BG BY CH CY DE FI FR GB IT NL PL RU SE SK UA 0 10 20 30 40 50 mg m-3 2308 2592 1006 3666 10 84 9503 277 21172 27738 14876 88972 288422 202612 3840 98827 135827 215 436 230 25254 17857 88383 30198 2070 320891 46
Figure 2-14. The CDFs of the net uptake of lead (Pbu) , the annual yield of biomass as dry weight (Yha), the
content of Pb in the harvested part of the plant ([Pb]ha) , the critical leaching flux of Pb from the topsoil
(Pble(crit)) and the critical limit ([Pb]ss(crit)).
Inspection of the plots in Figure 2-14 can lead to the following remarks:
The net uptake according to the background database is higher than the data submitted by NFCs. The net uptake for forests is generally lower than for other ecosystems.
The range of values for the annual yield is broader for the submitted data than in the background database.
Italy has very high values for the content of lead in the harvested part of the plant.
The range of values covering the critical leaching flux in the background database is similar to the range of data submitted by many countries. For Austria the CDF of critical leaching in
agricultural areas seems similar to the CDF in the background database between 5 and 25 g ha-1 a-1.
The CDF of the critical limit shows high values for Italy. The background database has lower values than the submitted data.
Mercury
Figure 2-15 shows the CDFs of the net uptake of mercury (Hgu), the critical leaching flow of Hg from
the topsoil (Hgle(crit)), the critical limit ([Hg]ss(crit) ), the annual yield of biomass, as dry weight (Yha),
the content of Hg in the harvested part of the plant ([Hg]ha) and the concentration of dissolved
organic matter in the soil solution ([DOM]).
Hgu
Forest Agric. Veget.
AT BE CH CY DE PL SE SK 0 0.2 0.4 0.6 0.8 1.0 g ha-1a-1 1154 958 1296 3666 277 10586 13869 7438 44636 201022 144211 88382 5396 320891 Yha (Hg)
Forest Agric. Veget.
AT BE CH CY DE PL SE SK 0 2000 4000 6000 8000 10000 kg ha-1a-1(dw) 1154 958 1296 3666 277 10586 13869 7438 44636 201022 144211 88382 5396 320891 [Hg]ha
Forest Agric. Veget.
AT BE CH CY DE PL SE SK 0 0.02 0.04 0.06 0.08 0.10 mg kg-1(dw) 1154 887 1296 3666 277 10586 13869 7438 44636 201022 144211 88382 5396 320891 Hgle(crit)
Forest Agric. Veget.
AT BE CH CY DE PL SE SK 0 0.2 0.4 0.6 0.8 1.0 g ha-1a-1 1154 958 1296 3666 277 10586 13869 7438 44636 201022 144211 88382 5396 320891 [Hg]ss(crit)
Forest Agric. Veget.
AT BE CH CY DE PL SE SK 0 0.2 0.4 0.6 0.8 1.0 mg m-3 1154 958 1296 3666 277 10586 13869 7438 44636 201022 144211 88382 5396 320891 [DOM]
Forest Agric. Veget. Water BE CH DE PL SE 0 20 40 60 80 100 g m-3 3562 10 277 44636 201022 144211 88382 5396
Figure 2-15. The CDFs of the net uptake of mercury (Hgu) , critical leaching flux of Hg from the topsoil
(Hgle(crit)), the critical limit ([Hg]ss(crit) ), the annual yield of biomass, as dry weight (Yha), the content of Hg in
the harvested part of the plant ([Hg]ha) and concentration of dissolved organic matter in the soil solution
([DOM]).
From Figure 2-15 we can mention:
The net uptake by forests is lower than for other ecosystems.
The critical leaching flux of mercury from the topsoil for Poland, Sweden and Slovakia are lower than for the other countries.
The CDF of the critical limit shows that some countries have a fixed value for the forest ecosystems and other countries have a broader range of values.
The annual yield of biomass in Cyprus for forests and vegetation is much lower than for agriculture. In general the values for this variable for forests are lower than for other ecosystems. The content of mercury in the harvested part of the plant has fixed values for some countries, although other counties have a broader range.
Figure 2-16 shows for aquatic ecosystems the total organic carbon concentration in the water ([TOC]), the concentration of total phosphorus in the surface water ([TP]), the site specific transfer function
(TFHgSite) and the deviation from a standard fish (TFHgBio). The concentration of total phosphorus in the
water in Belgium is higher than in Sweden and Finland. Belgium uses the transfer function for trout while Sweden and Finland use pike.
BE FI SE [TOC] 0 2 4 6 8 10 mg L-1 Water 10 820 2977 BE FI SE [TP] 0 2 4 6 8 10 ug L-1 Water 10 820 2977 BE FI SE TFHgSite 0 1 -pike trout 2977 no data no data BE FI SE TFHgBio 0 1 2 -pike trout 10 2977 no data
Figure 2-16. The CDFs of the total organic carbon in the water ([TOC]), the concentration of total phosphorus in the surface water ([TP]), the site specific transfer function (TFHgSite) and the deviation from a standard fish
(TFHgBio).
2.6
Conclusions
Following the 2004 call for data, 17 National Focus Centres have submitted (updated) critical loads of heavy metals. Most countries have submitted data for cadmium and lead. Nine countries have
submitted data for mercury. Most countries have submitted data for effects on terrestrial ecosystems (mainly ecotoxicological effects, effect 3). Sweden, Finland and Belgium have also submitted data for aquatic ecosystems.
The magnitude of the effects for the metals differs between the effects. The ecotoxicological effect on terrestrial ecosystems is the most sensitive effect for most of the countries which submitted more than one effect. A preliminary visual comparison of the submitted data with the calculated data in the EU-database shows that these datasets are more similar for lead than for cadmium.
Finally, the necessity to analyze different effects has emphasized the requirements of NFCs to use appropriate site identifications. The identification through site-IDs made it possible to correctly determine a minimum critical load over different effects for the same site.
References
De Vries W, Schütze G, Lofts S, Tipping E, Meili M, Römkens PFAM, Groenenberg JE (2005). Calculation of critical loads for cadmium, lead and mercury. Background document to a mapping manual on critical loads of cadmium, lead and mercury. Alterra-rapport 1104, Wageningen, 143 pp
Hettelingh J-P, Slootweg J, Posch M, Dutchak S, Ilyin I (2002) Preliminary modelling and mapping of critical loads for cadmium and lead in Europe. Coordination Center for Effects, RIVM report 259191911, Bilthoven, 127 pp
UBA (2004) Manual on methodologies and criteria for modelling and mapping of critical loads and levels and air pollution effects, risks and trends. Umweltbundesamt, Berlin; www.icpmapping.org
3.
The European Background Database for Heavy Metals
Maximilian Posch, Gert Jan Reinds*
*Alterra, Wageningen University and Research Centre (WUR), Netherlands
3.1
Introduction
A main task of the Coordination Center for Effects (CCE) is to collect and collate national data on critical loads and to provide European maps and other databases to the relevant bodies under the LRTAP Convention to assist in the review and possible revision of protocols. Ideally all those data are based on national data submissions, provided by National Focal Centres (NFCs) upon a call for data. In addition, the CCE maintains a so-called European background database (EU-DB), which could be used to fill potential gaps on the European map.
The most recent version of the European background database used for calculating critical loads and dynamic modelling of S and N has been described in the 2003 CCE Status Report (Posch et al., 2003). Only forests (forest soils) are considered in the European background database. Individual tree species are not identified, but a distinction is made between coniferous, broad-leaved (deciduous) and mixed forests. When variables were not found in existing databases, the recommendations and transfer functions in the Mapping Manual (UBA, 2004) were followed as closely as possible. Here we describe the variables in EU-DB needed for calculating critical loads of cadmium (Cd) and lead (Pb) related to ecotoxicological effects in forests (‘effect 3’ in Table 1-1 in Chapter 1).
3.2
Map Overlays
Input data for critical load calculations vary as a function of location and receptor (the combination of forest type and soil type). Thus an overlay of the following base maps was constructed:
(a) A map with soil types at scale 1:1,000,000 for all European countries (Eurosoil, 1999); except for Russia, Belarus, Ukraine and Moldova, for which the FAO 1:5,000,000 soil map (FAO, 1981) was used.
(b) A map of forest types, distinguishing coniferous, broad-leaved and mixed forests, taken from the harmonised European land cover map (Slootweg et al., 2005). This map is derived from the Corine and SEI (Stockholm Environmental Institute) land cover maps.
(c) A map with climate zones for Europe, derived from EC/UNECE (1996).
(d) A global map of detailed elevation data (on a 30"×30" grid) from NOAA/NGDC (Hastings and Dunbar, 1998).
(e) A map with EMEP 50×50 grid cells, in which deposition data are provided.
Overlaying these maps, merging polygons within every EMEP50 grid cell differing only in altitude, and discarding units smaller than 0.1 km2 results in about 90,000 different forest-soil combinations.
The soil maps are composed of so-called soil associations, each polygon on the map representing one association. Every association, in turn, consists of several soil typological units (soil types) that each covers a known percentage of the soil association. The soil typological units on the maps are
classified into more than 200 soil types (Eurosoil 1999).
For every soil typological unit information is available, of which soil texture classes are used here to derive other input data. Texture classes are defined in Table 6-2 of the Mapping Manual (UBA, 2004).
3.3
Input data for critical loads of Cd and Pb
Precipitation surplus and soil water content
To compute the concentration and leaching of compounds in the soil, the annual water flux through the soil has to be known. It was derived from meteorological data available on a 0.5°×0.5° grid descri-bed by Leemans and Cramer (1991), who interpolated selected records of monthly meteorological data from 1678 European meteorological stations for the period 1931–1960.


![Figure 2-15 shows the CDFs of the net uptake of mercury (Hg u ), the critical leaching flow of Hg from the topsoil (Hg le(crit) ), the critical limit ([Hg] ss(crit) ), the annual yield of biomass, as dry weight (Y ha ), the content of Hg in the harves](https://thumb-eu.123doks.com/thumbv2/5doknet/3263842.20991/31.892.158.800.427.874/figure-mercury-critical-leaching-topsoil-critical-biomass-content.webp)