Netherlands Environmental Assessment Agency, December 2009
Policy Studies
The Netherlands is able to cope with sea level rise for centuriesFor the Netherlands, being a country with one of the most densely populated deltas, one of the threats of climate change is sea level rise. Future sea level rise is surrounded with large uncertainties, but analysis reveals that the Netherlands will be able to cope with sea level rise for many centuries to come, even in a worst-case scenario of 1.5 metres sea level rise per century. The main challenge is not the long-term development of the coastal defences, but rather the long-term protection of the densely populated areas in the lower reaches of the Rhine, where sea level rise will interact with river discharges. Large-scale transitions, such as the transfer of investments to high-lying areas of the Netherlands or the development of a new extensive coastal zone, from the viewpoint of flood protection are unnecessary. Instead, a strategy that focuses on a further differentiation of protection levels in combination with the construction of ‘floodable’ dykes will significantly reduce the risks of economic losses and human casualties. When combined with spatial planning in the river areas, including the south-western Zeeland delta and the IJsselmeer, this strategy will also ensure flexibility and room for water management changes that may become necessary in the future. In addition, such an approach will offer important opportunities for creating synergy with the protection and development of internationally important landscapes and nature values.
Flood protection in
the Netherlands:
framing long-term
challenges and
options for a
climate-resilient
delta
Flood protection in the Netherlands:
framing long-term challenges and
options for a climate-resilient delta
Flood protection in the Netherlands: framing long-term challenges and options for a climate-resilient delta
© Netherlands Environmental Assessment Agency (PBL), December 2009 PBL publication number 500078004
Corresponding Author: W. Ligtvoet; willem.ligtvoet@pbl.nl
Parts of this publication may be reproduced, providing the source is stated, in the form: Netherlands Environmental Assessment Agency: Flood protection in the Netherlands: framing long-term challenges and options for a climate-resilient delta, 2009.
This publication can be downloaded from our website: www.pbl.nl/en. A hard copy may be ordered from: reports@pbl.nl, citing the PBL publication number.
The Netherlands Environmental Assessment Agency (PBL) is the national institute for strategic policy analysis in the field of environment, nature and spatial planning. We contribute to improving the quality of political and administrative decision-making by conducting outlook studies, analyses and evaluations in which an integrated approach is considered paramount. Policy relevance is the prime concern in all our studies. We conduct solicited and unsolicited research that is both independent and always scientifically sound.
Office Bilthoven PO Box 303 3720 AH Bilthoven The Netherlands Telephone: +31 (0) 30 274 274 5 Fax: +31 (0) 30 274 44 79 Office The Hague PO Box 30314 2500 GH The Hague The Netherlands Telephone: +31 (0) 70 328 8700 Fax: +31 (0) 70 328 8799 E-mail: info@pbl.nl Website: www.pbl.nl/en
Samenvatting 5
Zoals vele delta’s in de wereld is Nederland kwetsbaar voor zeespiegelstijging. Circa 60-70% van de bevolking en van de economische waarde is geconcentreerd in gebieden die gevoelig zijn voor overstromingen vanuit zee en/of rivieren. In voorliggend artikel zijn de onzekerheden rond klimaatver-andering- en zeespiegelstijgingscenario’s beschouwd, zijn de mogelijke gevolgen voor Nederland in kaart gebracht en is verkend wat de bijdrage zou kunnen zijn van verschillende ruimtelijke adaptatiestrategieën aan het vergroten van de klimaatbestendigheid van Nederland. De analyse laat zien dat Nederland nog eeuwen bestand is tegen zeespiegelstijging, ook in geval van een worst-case zeespiegelstijging van circa 1,5 meter per eeuw. Gegeven de onzekerheden zijn groot-schalige transities zoals het verschuiven van investeringen naar hoog Nederland of het ontwikkelen van een omvangrijke nieuwe kustzone vanuit veiligheid tegen overstroming niet nodig. Een strategie gericht op een verdere differentiatie van veiligheidsnormen in combinatie met het creëren van overstroombare dijken en het vergroten van de veerkracht in het rivierengebied, inclusief de Zeeuwse delta en het IJssel-meergebied, vermindert substantieel de schade- en slacht-offerrisico’s en behoudt ruimte voor eventueel benodigde waterhuishoudkundige aanpassingen in de (verre) toekomst. Deze strategie biedt ook belangrijke mogelijkheden voor mee-koppeling met het behouden/ontwikkelen van internationaal belangrijke natuurwaarden en landschappen.
Trefwoorden: overstroming, klimaatverandering, zeespiegel-stijging, delta, adaptatiestrategie, ruimtelijke ontwikkeling
Contents 7
Contents
Samenvatting 5 Summary 9 1 Introduction 11 2 Climate change: what can the Netherlands expect? 13
3 What are the possible consequences of long-term sea level rise 17
4 Spatial developments up to 2040: marked increase in potential damage 19
5 Adaptation to climate change: an exploration of possible strategies 21
6 Sustainable spatial development: relationship with other policy fields 27
Literature 32
Summary 9
The Netherlands is vulnerable to a rising sea level, as are many delta regions all over the world. About 60 to 70% of the country’s population and economic value is concentrated in areas that are at risk from flooding from the sea and/or rivers. This article examines the uncertainties surrounding climate change and sea level rise scenarios, identifies their possible effects on the Netherlands and investigates the possible contributions to be made by various spatial adaptation strategies for increasing the climate resilience of the Netherlands. The analysis shows that the Netherlands will be able to cope with rises in sea level for many centuries to come, even in a worst-case scenario. Large-scale transitions, such as the transfer of investment to higher-lying areas of the Netherlands (the high Netherlands) or the development of a new, extensive coastal zone are, therefore, from a flood protection point of view, not necessary. A strategy that focuses on the further differentiation of protection levels and increased flood resilience of the area surrounding the major rivers (the river areas), including the Zeeland delta and Ijsselmeer areas, would significantly reduce the risk of economic damage and casualties and ensure flexibility and room for any water management changes that may become necessary in the future. This strategy also offers important opportunities for creating synergy with the protection or development of internationally important natural values and landscapes.
Introduction 11
Global climate change could have a dramatic impact on the Netherlands, due to a multiplicity of effects in the areas of health, agriculture, tourism, transport, energy, nature and water management (MNP, 2005). In his film An inconvenient
truth, Al Gore showed the Netherlands becoming almost completely submerged in no more than six seconds. Partly as a result of this film, much discussion took place in the media, towards the end of 2006, concerning the possible rises in sea level to be faced by the Netherlands, and whether or not the country would be able to defend itself against them.
In Nederland Later (The Netherlands in the Future), the Second Sustainability Report of the Netherlands Environmental Assessment Agency (MNP, 2007), much attention is given to the long-term sustainability of the Netherlands and the possible effects climate change and rising sea levels will have on flood protection and spatial development. The issue of climate change is surrounded by uncertainty, both in terms of its possible extent and the time frame in which these changes are expected to take place (Figure 1.1). However, the direction of the change is now generally accepted (IPCC, 2007a,b). Climate change may have a more serious impact elsewhere in Europe and the world, than in the Netherlands. The areas most vulnerable to rising sea levels are the coastal zones and deltas of North America, India, Bangladesh and China, and
large areas of Southern Europe, Africa and Asia are especially vulnerable to increasing drought and a reduction in food production (IPCC, 2007a).
The climate resilient development of the Netherlands is now high on the political agenda, as shown by the focus in the Dutch policy programme, in the cabinet’s National Adaptation Strategy and in the appointment of the Delta Committee in 2007, which has the remit to identify and define the issues concerning climate change and the long-term protection of the Netherlands. In the report TheNetherlands in the Future (MNP, 2007), the Netherlands Environmental Assessment Agency examined the long-term issues surrounding climate change and flood protection, based on the following questions:
what can the Netherlands expect? what are the possible consequences?
what can the country cope with, and what options are available in response?
what is the relationship with other policy measures?
Introduction
1
Expected increase in temperature due to climate change shows a broad bandwidth. To limit the global increase in temperature to 2 °C (EU target), by 2050 a reduction of circa 50% of the global emissions is required. Figure 1.1 2000 2020 2040 2060 2080 2100 0 2 4 68 Change compared to pre-industrial (°C) Per scenario Overall uncertainty in all scenarios Global mean temperature change
Climate change: what can the Netherlands expect? 13
As far as the water environment is concerned, climate change in the Netherlands (MNP, 2005; KNMI, 2006) will result in: a rise in sea level, and, in the winter months, an increase in
peak drainage flows from rivers;
increased seepage pressure and salinisation; flooding in rural and urban areas;
aridity in rural areas and low river flows in the summer months;
a reduction in water quality, due to a combination of the expected increase in water temperature (resulting in a higher risk of blue-green algae) and water shortages. It is expected that climate change will result in an increase in both average rainfall and peak rainfall intensity in the summer, as well as in the winter months. Only in the scenarios in which a change in airflow pattern over northwest Europe is assumed, is it expected that average rainfall will significantly decrease in the summer and that it will be much dryer than in the current situation (KNMI, 2006). In the Netherlands, therefore, the climate will become both wetter (in the winter) and dryer (in the summer) and, due to the expected increase in peak rainfall intensity, more uncertain, with larger regional and local differences (KNMI, 2006). As a result, there is an increased risk of both flooding and drought. Current water policy in the Netherlands already takes into account the possible effects of climate change, in general with a time horizon of about 50 years, and, for coastal defences, a century. The most disruptive processes, as far as the Netherlands is concerned, are flooding from the sea and rivers. In the long term, rising sea levels and the possibly corresponding reduction in free water flow in rivers will determine the sustainability of the Netherlands.
Future sea level rises: large margins
The sea level rose along the Dutch coast by about 20 centimetres over the last century. Recently published scenarios from the Royal Netherlands Meteorological Institute (KNMI, 2006) predicted a sea level rise in the 21st century of between 35 and 85 centimetres (Figure 2.1). The large variation is due to the many factors that involve a large measure of uncertainty. These uncertainties concern both uncertainty in the sensitivity of the climate system as a whole, uncertainties concerning the way in which the Greenland and West Antarctic Ice Sheets will melt, and uncertainty in future greenhouse gas emissions.
Geological findings indicate that, in the past, an increase in temperature of over about 2 to 2.5 ºC in the Northern Hemisphere, was accompanied by sea level rises totalling about 4 to 6 metres, and that there have been periods when sea levels rose at a rate of 1.5 metres a century. Based on climate scenarios, an increase in temperature of 2 to 2.5 ºC in the Northern Hemisphere, could be reached by 2050. Recent scientific articles report that the Greenland and West Antarctic Ice Sheets could be melting faster than current models assume. The rate at which the Greenland Ice Sheet is melting seems to have increased, in recent years, and satellite observations show that the rate of sea level rise has increased since 1993.
Based on the currently available information, the Netherlands Environmental Assessment Agency assumes the following: The KNMI estimate of 35 to 85 centimetres/century is
the most likely range of expected sea level rise for the Netherlands, this century. This estimate, contrary to that of the IPCC, takes into account a limited increase in the rate of melting of the ice caps and a relatively strong increase in temperature in the Northern Hemisphere. Given the large uncertainties and the small chance of a
rapid increase in the melting and disintegration of the Greenland and Antarctic Ice Sheets in the next century, a sea level rise to a maximum of 1.5 metres, over the next 100 years, is considered the worst-case scenario. It is still very uncertain whether the global emission
reduction of 50 to 60% required to stabilise the increase in temperature at 2 oC, will be achieved in the foreseeable
future. Should this global emission reduction not be achieved, the possible sea level rise is more likely to be at the higher end of the KNMI range than the lower. In the recently published advise of the Delta Committee (2008) a ‘high-end’ range of sea level rise estimates is given of 65 to 130 centimetres, for the period up to 2100. Given the uncertainties, the upper limit of 130 centimetres is of the same order of magnitude as the assumed worst case of 150 centimetres by 2100 (Figure 2.1).
Gravitational effect
As early as 1887, Hergsell claimed that the melting of the Greenland and Antarctic Ice Sheets would result in a redistribution of sea levels, because of the reduced
Climate change: what can
14 Flood protection in the Netherlands: framing long-term challenges and options for a climate-resilient delta
gravitational effect of this melting ice (Hergsell, 1887). In 2001, Mitrovica et al. incorporated gravitational effects into sea level rise calculations. Their study showed that, should the Greenland Ice Sheet melt completely, the sea level along the Dutch coast would rise by two metres, rather than the expected six metres. The gravitational effect of Antarctica on increasing sea levels is much smaller as this continent is so far away. For the Netherlands, this amounts to a small amplifying effect with a factor of between 1.0 and 1.1 (Mitrovica et al., 2001). It would appear that, so far, this has been a blind spot in climate change and sea level rise research. The IPCC has not yet addressed this subject, either: reference is made to the Mitrovica article in the Fourth Assessment Report (AR4: IPCC, 2007b) but there is no further discussion on the possible far-reaching consequences for western Europe and the Netherlands.
If Figure 2.2 were modified to take into account the
gravitational effect, the maximum in the year 3000 would be about eight, rather than ten metres. KNMI is still working on a recalculation of sea level rise over the next 100 to 300 years, but it is expected that, over this relatively short period, the change will be limited.
Storm surges: changes due to climate change still unclear
Next to a gradual rise in sea level, the development of storms in the North Sea is also an important factor in flood protection. Wind speeds and the destructive power of storms increase with each degree increase in temperature (IPCC, 2007b). The current protection level is based on a storm surge with a return period of 1 in 10,000 years and a sea level of 5 metres above NAP (Amsterdam Ordnance Datum). A similar storm surge at higher temperatures could result in a higher
KNMI scenarios show an rise in sea level along the Dutch coast of a maximum of 85 centimetres by 2100. There is an unknown but small chance that the rate of sea level rise will increase even further, in the second half of the century, should the rate of disintegration or melting of large amounts of the Greenland and Antarctic Ice Sheets increase. Figure 2.1 1900 1950 2000 2050 2100 -0.4 0.0 0.4 0.8 1.2 1.6
2.0 Increase compared with 1990 (metres) Sea level rise up to 2100
Range KNMI 2006 scenarios
Measurements
Estimate maximum effect thermal expansion and melting Greenland and West Antarctica
An indication of the range in the long-term rise in sea level along the Dutch coast, depending on thermal expan-sion and the melting behaviour of Greenland and West Antarctic ice and uncorrected for gravitational effects (see below). Based on KNMI scenarios, a sea level rise of 1 to 2.5 metres is expected by 2300 (KNMI, 2006). Figure 2.2 2000 2200 2400 2600 2800 3000 0 4 8 12
16 Increase compared with 2000 (metres) Sea level rise up to 3000
Estimate bandwidth melting Greenland and West Antarctica
KNMI scenarios to 2300 bandwidth Maximum historical rate
Climate change: what can the Netherlands expect? 15
water level than what is currently taken into account. As with the issue of the increased melting rate of the ice sheets, there are large uncertainties in the expected change in both the frequency of storms and the force and direction of the wind. The number of storms in the North Sea has decreased over the last forty years, but it is not clear to what extent this corresponds to the rise in temperature. Further research into the possible consequences for coastal defence and protection is, therefore, required (see also KNMI, 2006).
What are the possible consequences and what are the major challenges? 17 Flooding from the sea
The expected sea level rise, based on the KNMI scenarios, will not necessarily result in large amounts of flooding from the sea (WL | Delft Hydraulics, 2007a). Using current techniques, the dykes (hard flood defences) and coastal defences (soft flood defences) can be sufficiently maintained, even in the case of a sea level rise of 1 to 1.5 metres a century. If, however, the rise in sea level were to increase to 1.5 metres a century (as a result of an increase in the melting rate of the ice sheets), then continued maintenance of the dykes and dunes would require considerably more effort. According to the Adviescommissie Financiering Waterkeringen (Advisory Committee for Primary Dyke Financing, 2006), this could mean a doubling in the annual cost for maintenance of the dykes. Flood protection currently costs each inhabitant of the Netherlands about 40 to 45 euros per year, equivalent to about 0.15% of the GNP. Therefore, even if these costs were to double, the effect on Dutch expenditure could remain limited.
River flow management
As sea levels rise, the natural drainage capability of regional water systems and rivers due to gravity is reduced, water levels rise in tidal rivers and estuaries, and the influence of tides and salt water is seen further inland. In the Netherlands, a two-metre increase in sea level would mean that the tidal influence would move upriver as far as Tiel; in the case of a six metre increase, as far as Nijmegen. The salt water influence of the sea may be seen far inland, particularly in the summer months. Current plans for the government programme ‘Room for the River’ (Ruimte voor de Rivier) account for a sea level rise of about 60 centimetres, but a further rise in sea level and reduction in natural downhill flow will require higher dykes to be built in an increasingly larger area of the south-western Netherlands, the river area and the Ijsselmeer area. In the area surrounding the lower reaches of the Rhine and Meuse rivers, these dykes will increasingly take the character of sea dykes rather than river dykes (WL Delft | Hydraulics, 2007a). Rotterdam and Dordrecht will be especially vulnerable areas should sea levels continue to rise. An approach such as Room for the River is not a long-term solution and it is possible that other solutions will need to be found for normal and peak flows in the Rhine. Important factors that limit the available
solutions are the space available for water storage in the river areas as a whole, the possibilities for diverting river flow to the Zeeland delta and/or the River Ijssel and the Ijsselmeer, and possible water storage options in these areas.
Increasing seepage pressure
Higher sea levels will result in a greater upward pressure on groundwater. In many places in the west of the Netherlands and the river areas, the earth’s upper layers are thick enough to resist the upward pressure of the groundwater. If these layers were not there, the surface could burst open, or seepage and even spontaneous upwelling of water could occur. In the lowest-lying areas of the Netherlands, the reclaimed areas, this is already happening. In the Haarlemmermeer area, for example, the surface was so badly damaged when ditches were dug for new residential areas that upwelling was the result. WL Delft | Hydraulics, TNO and Geodelft carried out further research for the report
TheNetherlands in the Future, into whether this increasing seepage pressure would constitute a major problem. The study showed that it is improbable that the ground in the deep reclaimed areas will burst open, even in the case of a sea level rise of up to six metres, and that the most important seepage problems will take place immediately behind the dunes and behind the dykes along the rivers and in the Ijsselmeer polders. WL Delft | Hydraulics et al (2007b) note, however, that this is primarily a localised phenomenon and that current models are not yet capable of simulating this in sufficient detail.
What are the possible
consequences of
Spatial developments up to 2040: marked increase in potential damage 19
The Netherlands Environmental Assessment Agency produced a trend scenario for 2040 for TheNetherlands in
the Future study based on two variants: one with moderate economic growth (1.7%) and moderate population growth (to over 17 million by 2040), and one with higher economic growth (2.1%) and a population of almost 20 million by 2040. In the trend scenario, the majority of new urban development
takes place in the urban areas of the western Netherlands (the Randstad) and in those parts of the Netherlands most sensitive to flooding (Figure 4.1). This continues the trend of recent decades and means that, in the period up to 2040, the vulnerability of the Netherlands as a whole to flooding will continue to increase, in terms of the percentage of the population and economic value considered ‘at risk’. The
Spatial developments
up to 2040: marked
increase in potential
damage
4
A large proportion of new development in the period up to 2040 will take place in flood-sensitive areas of the Netherlands, in particular the cities of the western Netherlands Figure 4.1 Built-up areas in flood-sensitive areasBuilt-up areas 2000
New development according to trend scenario 2010
2040
20 Flood protection in the Netherlands: framing long-term challenges and options for a climate-resilient delta
potential economic damage due to flooding will increase in the period up to 2040 by a factor of between two and three, depending on economic growth and population growth. About 20 to 30% of this is due to new development (Figure 4.2).
The trend scenario assumes that the protection level of the primary dyke system is maintained in the period up to 2040, according to the standards defined in the Flood Defence Act. The most recent assessment of the dyke system showed that 46% of the dykes meet these standards, 19% do not, and that there is as yet insufficient information available to be able to assess the other 35% (Ministry for Transport, Public Works and Water Management, 2006). A number of measures are to be taken in the period up to 2020 to ensure than the dyke system as a whole meets the legal minimum requirements. Examples are the Room for the River project, the strengthening of ‘weak links’ in coastal defences and the strengthening of the embankments of the Meuse and the Zeeland dykes. This means that the trend scenario assumes that the dyke system will only fully meet the required standards from 2020 onwards. In the trend scenario, economic growth and new development means that potential economic damage in the flood-sensitive areas of the Netherlands shows a marked increase in the period up to 2040. Figure 4.2 1960 2000 Trend scenario High spatial pressure scenario 0 100 200
300 Index (economic value 2000=100) Economic value built-up areas New development after 2000 Built-up areas 2000 Built-up areas 1960 Potential economic damage in flood-sensitive areas
Adaptation to climate change: an exploration of possible strategies 21
The spatial developments included in the trend scenario do not take climate change into account. However, the effects of developments in town and country planning and infrastructure extend over a long time and affect several generations. Choices made in the coming decades therefore also partly determine future options as far as adaptation to climate change is concerned. The safety and long-term sustainability of the Netherlands can be managed primarily by:
1. maintaining or increasing the protection level using technical measures, such as coastal and dyke reinforcement;
2. reducing the effects of flooding through changes in construction methods, compartmentalisation, awareness campaigns and information and evacuation procedures; 3. managing spatial development, with a focus on limiting
the consequences, in terms of potential damage and casualties.
Increasing the protection level, as suggested by the
Adviescommissie Financiering Primaire Waterkeringen (Advisory Committee for Primary Dyke Financing, 2006), or limiting the consequences of flooding through changes in construction methods and compartmentalisation, are expected to result in the same spatial development as in the trend scenario. This is because these strategies do not place any limits on spatial development and because the locations chosen for new development are not dependent on current or future flooding risk. Changes in construction methods (for example building on stilts or on mounds) could, with no additional increase in protection level, offset about 20 to 30% of the potential damage in 2040 (compare with Figure 4.2).
Spatial strategies
To understand the possible physical consequences of choices which are, to a lesser or greater extent, controlled by expected climate change, three scenarios will be considered that closely reflect current discussion on the subject. The question is whether investment should continue to be made in lower-lying areas of the Netherlands (the low Netherlands), whether a large-scale and fundamentally different form of
coastal defence is required, and whether the flood resilience of the river areas should be increased.
The scenarios analysed here are characterised as follows: 1. differentiation in protection levels and increased resilience
of the river areas;
2. reduced vulnerability: shift investment to the higher parts of the country;
3. coastal expansion: proactive investment in long-term protection of the low-lying Netherlands.
The spatial developments involved in each of the options and their effects on flood protection are compared with the trend scenario, in which both the current protection level and trend in spatial development are maintained (MNP, 2007).
Scenario 1: Differentiation in protection levels and increased resilience of river areas
In the Differentiation in protection levels scenario, coastal defences are considered to be manageable, and a large-scale shift to the high Netherlands is considered unnecessary. Other than in the trend scenario, the choice is made to introduce more resilience in the river areas by ensuring that the order in which dyked areas flood is better tailored to expected damage levels, and by compartmentalising of a number of dyked areas. Spatial development will be tailored to match this, in other words no major new development will take place in dyked areas with a relatively high flood risk. ‘Floodable dykes’ will also be constructed, to increase the predictability and controllability of floods as much as possible and, most importantly, to reduce the risk of casualties. The development that takes place under the Differentiation
in protection levels scenario (Figure 5.1) differs from the trend scenario in that less new development takes place in dyked areas with a relatively low protection level:
less development takes place in the upper river areas and new development shifts to the hilly part of the province of Utrecht (the Utrechtse Heuvelrug);
in the western Netherlands, much of the new development shifts from the less protected to the most protected dyked areas (Central Holland, referred to as the Dyke Ring 14);
Adaptation to climate
change: an exploration
22 Flood protection in the Netherlands: framing long-term challenges and options for a climate-resilient delta
in the South of the Flevoland polders, new development is concentrated, around Almere.
Such developments would mean reduced pressure on river areas, but increased pressure on the landscapes of the Utrechtse Heuvelrug, Veluwe and Twente.
Scenario 2: Shift investment to the high Netherlands
In the High Netherlands scenario there is a reversal in the spatial development trend, with a focus on reducing the vulnerability of the Netherlands. From 2010 onwards, no new residential and business areas will be developed in flood-sensitive areas. This will reduce the vulnerability of the
Differentiation in protection levels: comparison of development for residential and commercial purposes with the trend scenario in 2040, assuming the protection level matches the economic value to be protected, and flood predictability is increased by sequencing the dyked areas to be flooded and the construction of floodable dykes.1)
1) The Delta Committee uses the term ‘Delta dykes’ (Delta Committee, 2008).
Figure 5.1 Development housing 2010-2040, according to the Differentiation in protection levels scenario
<Extra tekst 3> Built-up areas 2010
New development 2040
Trend scenario and Differentiation in protection levels scenario Trend scenario only Differentiation in protection levels scenario only Flood-sensitive areas
Trend scenario
2020 - 2040 Differentiatedstandards 2040
Relative chance of flooding (per year)
High Low No data
Adaptation to climate change: an exploration of possible strategies 23
Netherlands and means that those areas not developed are available for any future water management measures (the river areas, the River IJssel, the IJsselmeer area and the south-west Netherlands).
In the High Netherlands scenario new development will primarily take place on the Utrechtse Heuvelrug, along the edges of the Veluwe National Park and around towns in the provinces of Brabant, Twente and South Limburg (Figure 5.2). Shifting homes and businesses to the high Netherlands would also help to reverse the decline and increased unemployment levels experienced in some of these areas.
Because a large proportion of services and employment remains in the Randstad, the shift to the high Netherlands will result in increased mobility. On the other hand, the pressure on valuable landscapes in the western Netherlands will be reduced, and the scenario also allows scope for strengthening internationally important natural areas in the low-lying Netherlands (for example, peat areas and river areas).
Scenario 3: Coastal expansion – proactive investment in the protection of low-lying Netherlands
In the Expanded coast scenario, a coastal zone is developed to provide maximum protection against future flooding from
High Netherlands: comparison of spatial development for residential and commercial purposes with the trend scenario in 2040, assuming investment in new residential and commercial areas does not take place in flood-sensitive areas.
Figure 5.2 Development housing 2010-2040 according to the High Netherlands scenario
Built-up areas 2010 New development 2040
Trend scenario and High Netherlands scenario Trend scenario only
High Netherlands scenario Flood-sensitive areas
24 Flood protection in the Netherlands: framing long-term challenges and options for a climate-resilient delta
the sea. The size of the new coastal zone is not yet finalised and will depend on requirements and available finances. Various forms are possible, varying from a series of islands along the coast to an unbroken coastal zone extending from the current coastline. An unbroken expansion of the coastal zone was chosen in the report TheNetherlands in the
Future, to be constructed at five metres above NAP and, therefore, be resilient to continuing future sea level rise. Such coastal expansion is relatively easy to realise and also offers opportunities in terms of important functions, such as for housing and recreation. Being able to realise these functions will also make an important contribution towards offsetting the cost of the project.
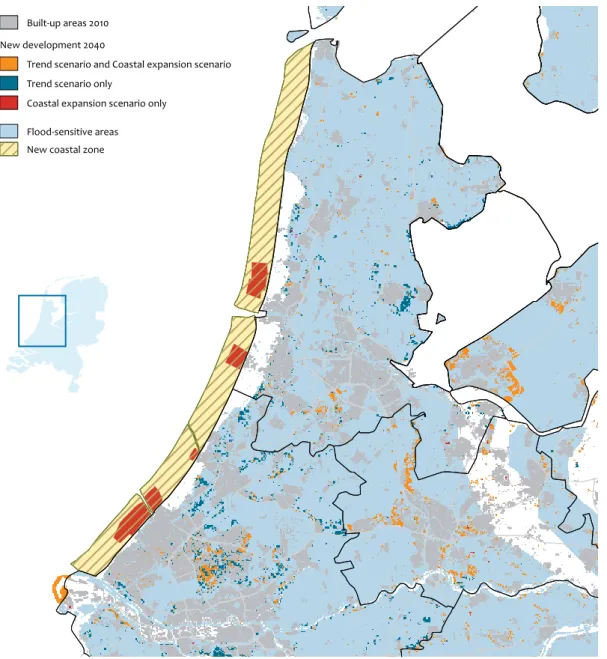
The coastal expansion scenario will, in the western Netherlands, result in a significant change compared with the trend scenario (Figure 5.3). By ensuring that 50% of the required residential development in the provinces of South Holland and North Holland takes place in the new coastal zone, the pressure on natural areas in the western Netherlands will decrease, and opportunities will present themselves for strengthening internationally important natural areas in the low-lying Netherlands, including the peat areas. There are also increased opportunities for the development of attractive residential areas in the Randstad area and for improving the accessibility of recreation and nature functions. It can be expected that the attractiveness of the area as a business location will be positively influenced. However, given the size of such a project and the necessity
Coastal expansion: new development between 2010 to 2040, compared with the trend scenario for 2040, should 50% of the residential development required in the provinces North Holland and South Holland be realised in the newly developed coastal zone
Figure 5.3 Development 2010-2040 according to the Coastal expansion scenario
Built-up areas 2010 New development 2040
Trend scenario and Coastal expansion scenario Trend scenario only
Coastal expansion scenario only Flood-sensitive areas New coastal zone
Adaptation to climate change: an exploration of possible strategies 25
of increasing the development of new residential areas already in the coming decades, it will be difficult to achieve this synergy within such a time frame. Whether or not it will be achievable will strongly depend on the ability to plan and execute this project in phases.
Effect of the scenarios on flood protection
By ensuring that the dykes meet the required standards, a process that is expected to be completed by 2020, the casualty risk will decrease in the trend scenario in the period between 2020 and 2040, by a factor of three, compared with 2000 (Figure 5.4). The risk of economic damage will decrease by a factor of 1.7. Of the three scenarios analysed, only the differentiated protection level and floodable dykes scenario results in a significantly lower damage and casualty risk. In both the other scenarios, protection levels are maintained at the legally required level and only a small amount of the developed area is new and, therefore, controllable (see Figure 5), so that there is little effect on the risk of damage and casualties, in comparison with the trend scenario. Based on a maximum sea level rise of 85 cm/century, it seems that the low-lying Netherlands and the Randstad will be resistant to climate change and rising sea levels, for many centuries to come, although continued and considerable effort will be required to maintain the current protection level. By continuing the current method of coastal reinforcement and sand suppletion, it is possible to keep pace with changes in sea level. As a result, there does not seem to be much urgency for further investment over the next century in the Randstad. Responses, such as shifting investment to the high Netherlands (retreat) or the development of an extensive new coastal zone are, therefore, from a flood protection point of view, unnecessary. Assuming that river flow management is the biggest long-term challenge (see Section 3), a strategy that focuses on increasing the resilience of the river area would seem the most appropriate. Not only does this provide flexibility and space for additional measures in the future, but this strategy
also contributes the most to reducing the risk of economic damage and, especially, casualties in the Netherlands (Figure 9). Linked to the strategy for a more resilient river area, keeping options open for river flow distribution changes in the Rhine and Ijssel may be important for the long-term robustness of the Dutch water system. Further research into the possibilities and potential costs and benefits is still required. The economic damage and casualty risk is particularly lower in the ‘differentiated protection level’ scenario compared with the trend scenario (expected economic damage 80 million euros/year). Figure 5.4 2005 Trend scenario Differentiated protection High Netherlands Coastal expansion 0 20 40 60 80 100
120 Index (2005=100) Casualty risk Damage risk Damage and casualty risk in case of flooding
Sustainable spatial development: relationship with other policy measures 27
In the Netherlands, room for living, working and mobility must be found within a small area, whilst at the same time maintaining the quality of the living environment and green spaces. To make the most efficient use possible of the available space, these functions and qualities must be considered simultaneously and in relation to one another, and together with the measures necessitated through climate change. The report TheNetherlands in the Future showed how optimisation of the spatial distribution of functions can produce the most sustainable Netherlands possible. As far as the sustainability of the Netherlands is concerned, the following themes are considered, in addition to climate change and safety (MNP, 2007):
maintaining biodiversity: relationship with the National Ecological Network and Natura 2000 areas;
traffic and transport: accessibility of the cities, road congestion and the uneven distribution of environmental costs among population groups;
attractive residential areas: rural housing and green areas in and around towns;
making locations attractive to international companies: available business parks, high-quality office locations, international hubs and attractive residential areas; maintaining existing landscape quality and avoiding
countryside clutter.
Based on an analysis of the relationships between the spatial measures involved in the themes named above, an integrated, future map of the Netherlands has been produced in which, on the one hand, the risk of (further) decline in the various qualities is minimised and, on the other hand, the opportunities for improvements in quality are maximised. The criteria related to the various themes are shown in Figure 6.1. The strategy, in terms of climate change and flood protection, of a more resilient river system is recognisable, as is the focus on retaining scope for possible future interventions in the Zeeland delta, the river areas, the River Ijssel and the Ijsselmeer area. Important opportunities for creating synergy with long-term biodiversity targets (Natura 2000 areas and
waters) can also be seen, with the clustering and intensifying of urban development and the safeguarding of nationally and internationally important landscapes. The criteria map is used as the basis for the creation of the integrated land-use map in the ‘Combination Scenario’ (Figure 6.2).
It is important that, in order to make more focused and integrated spatial development possible in the long term, more cohesion is introduced into the conception and implementation of the various sectoral policy dossiers (MNP, 2007). However, the development of such a strategic and cohesive long-term vision is not straightforward under current governmental structure and culture. Continuing globalisation and individualisation and the associated fragmentation of interests and resources mean that the core of the social decision process has, on average, shifted from the national to the regional level. Choices and decisions are increasingly made in a decentralised, interactive environment with consideration for the area-specific distribution of interests and resources. In this changing administrative landscape, the role of government is also changing, as can be seen in the Spatial Policy Document, in which much attention is given to area-specific policy processes concerning the future development of the Netherlands. At the same time, sectoral policies, as well as national and European environmental policies, also apply, and this can sometimes seriously complicate the integrated development on regional scales. These different issues, therefore, also form a significant challenge in the development of a long-term, robust policy.
Sustainable spatial
development:
relationship with
other policy fields
28 Flood protection in the Netherlands: framing long-term challenges and options for a climate-resilient delta
Water (incl. floodplains and areas outside the dykes) Built-up areas 2010
Restructuring task large cities Schiphol / Lelystad
Reserving water buffer Reclaimed land Peat areas Coastal areas Natura 2000 land Natura 2000 large bodies of water
Catchment areas and National Landscapes Expansion Natura 2000 National Ecological Network (NEN) and existing nature
Buffer zone
Preferred urbanisation zone
Set preconditions Provisional preconditions
Sustainable spatial development: relationship with other policy measures 29
Conditions for the long-term sustainable spatial development of the Netherlands, based on the integration of climate change and flood protection measures, maintaining biodiversity and landscapes, the clustering of urban areas, optimal accessibility and attractive housing. Source: MNP (2007).
30 Flood protection in the Netherlands: framing long-term challenges and options for a climate-resilient delta Built-up areas Recreation Employment Nature Other agriculture Cattle farming Greenhouse horticulture Intensive livestock farming Infrastructure
Water
Agriculture with environmental and/or landscape management
Livestock farming with environmental and/or landscape management
Sustainable spatial development: relationship with other policy measures 31
The Netherlands in 2040, according to the combination scenario, based on the conditions map shown in Figure 6.1. Source: MNP (2007).
32 Flood protection in the Netherlands: framing long-term challenges and options for a climate-resilient delta
Adviescommissie Financiering Primaire Waterkeringen (2006). Tussensprint naar 2015. Klimaatcentrum VU, Amsterdam.
Delta Committee (2008). Samenwerken met Water. Bevindingen van de Deltacommissie 2008.
Hergsell, H. (1887). Über die änderungen der gleichgewichtsflächen der Erde durch die bildung polarer eismassen dadurch erursachten schwankungen des meeresniveaus. Beitr. Geophys., Abh. Geogr. Sem. Univ. Strasbourg, i, 59-114.
IPCC (2007a). Climate change 2007: Climate Change Impacts, Adaptation and Vulnerability, Working group II, contribution to the Intergovernmental Panel on Climate Change, Cambridge University Press, UK.
IPCC (2007b). Climate Change 2007: The Physical Science Base, Working Group I, contribution to the Intergovernmental Panel on Climate Change, Cambridge University Press, UK.
KNMI (2006). Klimaat in de 21e eeuw – vier scenario’s voor Nederland.
KNMI, De Bilt.
Ministry of Transport, Public Works and Water Management (V&W) (2006). Primaire waterkering getoetst. Landelijke Rapportage Toetsingen 2006. Ministerie V&W, Den Haag, Nederland.
Mitrovica, Jerry X., Tamisiea, Mark E., Davis, James L., and Milne, Glenn A., (2001).
Recent mass balance of polar ice sheets inferred from patterns of global sea-level change. Nature, 22 February 2001.
MNP (2005). The effects of climate change in the Nederlands. MNP-Rapportnr. 773001037. Milieu- en Natuurplanbureau, Bilthoven. MNP (2007). Nederland Later. Tweede Duurzaamheidsverkenning, deel
Fysieke leefomgeving Nederland. Rapportnr. 500127001. Milieu- en Natuurplanbureau, Bilthoven.
WL Delft | Hydraulics (2007a). Huidige en toekomstige
overstromingsscenario’s in Nederland in een veranderend klimaat. WL Delft | Hydraulics, Delft.
WL Delft | Hydraulics, TNO & GeoDelft (2007b). Effecten van extreme zeespiegelstijging op de Nederlandse waterhuishouding.WL Delft | Hydraulics, Delft.
Literature 33
Colophon
Responsibility
Netherlands Environmental Assessment Agency
Project team
W. Ligtvoet, J. Knoop, B. Strengers, A. Bouwman
Editing
A. Righart
Graphics
M.J.L.C. Abels-van Overveld, F.S de Blois, J.F. de Ruiter
Lay out
Studio RIVM
Contact
Netherlands Environmental Assessment Agency, December 2009
Policy Studies
The Netherlands is able to cope with sea level rise for centuriesFor the Netherlands, being a country with one of the most densely populated deltas, one of the threats of climate change is sea level rise. Future sea level rise is surrounded with large uncertainties, but analysis reveals that the Netherlands will be able to cope with sea level rise for many centuries to come, even in a worst-case scenario of 1.5 metres sea level rise per century. The main challenge is not the long-term development of the coastal defences, but rather the long-term protection of the densely populated areas in the lower reaches of the Rhine, where sea level rise will interact with river discharges. Large-scale transitions, such as the transfer of investments to high-lying areas of the Netherlands or the development of a new extensive coastal zone, from the viewpoint of flood protection are unnecessary. Instead, a strategy that focuses on a further differentiation of protection levels in combination with the construction of ‘floodable’ dykes will significantly reduce the risks of economic losses and human casualties. When combined with spatial planning in the river areas, including the south-western Zeeland delta and the IJsselmeer, this strategy will also ensure flexibility and room for water management changes that may become necessary in the future. In addition, such an approach will offer important opportunities for creating synergy with the protection and development of internationally important landscapes and nature values.