Energy security, air pollution, and climate change:
an integrated cost-benefit approach
Johannes Bollen
With selective contributions and supportive analysis by S. Hers and B. van der Zwaan (ECN)
2
© Milieu- en Natuurplanbureau (MNP), Bilthoven, 2008 MNP-publicatienummer 500116004
Contact
Johannes Bollen, jc.bollen@mnp.nl
U kunt de publicatie downloaden van de website www.mnp.nl of bestellen via reports@mnp.nl onder vermelding van het MNP-publicatienummer.
Delen uit deze publicatie mogen worden overgenomen op voorwaarde van bronvermelding: ‘Milieu- en Natuurplanbureau, de titel van de publicatie en het jaartal.’
Het Milieu- en Natuurplanbureau (MNP) voorziet de Nederlandse regering van onafhankelijke evaluaties en verkenningen over de kwaliteit van de fysieke leefomgeving en de invloed daarvan op mens, plant en dier. Het MNP vormt hiermee de brug tussen wetenschap en beleid.
Milieu- en Natuurplanbureau Postbus 303 3720 AH Bilthoven T: 030 274 274 5 F: 030 274 4479 E: info@mnp.nl www.mnp.nl
Abstract
3
Abstract
Energy security, air pollution, and climate change: an integrated cost-benefit approach
This report presents the findings of an integrated cost-benefit analysis of options to increase energy security, reduce local air pollution, and mitigate global climate change. Although energy security is commonly recognised as an important issue, it is less clear how damaging a lack of energy security is to the economy. Moreover, it is unclear how to successfully improve on energy security in a world with scarce resources. The analysis aims to stimulate the process of the development of clear, policy targets for energy security in relation to other policy objectives to avoid air pollution and impacts of climate change.
This report explores the consequences of introducing an analytical supply-of-security expres-sion in the integrated energy-economy model MERGE. First the abstract notion of energy secu-rity is quantified, followed by the implementation of the quantified energy secusecu-rity function in MERGE. A set of simulations is then conducted to explore the impact of the application of this function. These simulations tentatively indicate that concerns for energy security cause a delay in the global demand for oil, in scenarios without explicit climate change and air pollution policy. Even so, in this case oil resources will eventually be completely depleted. With addi-tional climate change policy, the oil resources will not be depleted, and when complemented by air pollution policy, reserves of oil will ultimately remain larger. In these environmental policy scenarios, energy security policy is shown to reduce the cumulative demand (over the next 150 years) of oil in by 20%, compared to the baseline without any policies. Between 2020-2030, substantial CO2 emission reductions will be achieved in Europe. This is induced by
energy exporters, expanding on the combustion of their own abundant (and cheaper) gas and oil resources. In turn, this implies that energy importing regions will increase their CO2 emission
reductions, thus minimizing the damages, caused by climate change.
Rapport in het kort
5
Rapport in het kort
Integrale kosten-baten analyse klimaat,
energievoorzieningszekerheid en luchtkwaliteit
Dit rapport presenteert de analyse van een mondiale geïntegreerde kosten-baten analyse van opties om de energievoorzieningszekerheid te verhogen, en de nadelige gevolgen van luchtver-vuiling en klimaatverandering tegen te gaan. Weliswaar wordt het probleem van een beperkte energievoorzieningszekerheid in het algemeen erkend, maar het is onduidelijk wat de schade hiervan is aan de economie. De analyse probeert de ontwikkeling van het definiëren van heldere doelen voor de energievoorzieningszekerheid een stap verder te brengen, en deze te plaatsen in de bredere afweging van doelen voor beleid om klimaatverandering en luchtvervuiling tegen te gaan. Dit rapport onderzoekt de gevolgen van een introductie van een analytische functie voor ener-gievoorzieningszekerheid in het geïntegreerde energie-economie model genaamd MERGE. Eerst wordt the begrip voorzieningszekerheid gekwantificeerd, gevolgd door een mathematische formulering over dit onderwerp zoals te gebruiken in MERGE. Modelsimulaties worden gepre-senteerd die rekening houden met de modelvergelijkingen over voorzieningszekerheid. Deze modelexperimenten laten zien dat wanneer er geen milieubeleid wordt gevoerd, de schade door een verminderde energievoorzieningszekerheid verlaagd kan worden door de vraag naar olie en gas uit te stellen naar de toekomst. De reden is dat in de toekomst de energie-intensiteit lager zal zijn dan nu, en daarom zullen economieën minder gevoelig zijn voor prijsschommelingen van energie of een te lage voorzieningszekerheid. In de varianten zonder milieubeleid maar met beleid om de voorzieningszekerheid van energie te verhogen, zullen de voorraden van gas en olie dus uiteindelijk toch uitgeput worden. Maar in varianten met klimaatbeleid zullen de bekende olievoorraden niet volledig aangesproken worden, zeker wanneer er ook nog beleid gevoerd gaat worden om de luchtvervuiling tegen te gaan. In een toekomst met beleid tegen klimaatverandering en luchtvervuiling en voor een hogere voorzieningszekerheid zal de vraag naar olie, gecumuleerd over een periode tot aan 2150, met 20% lager uitvallen (ten opzichte van het basispad waarin geen beleid wordt gevoerd). In dat geval zullen er tussen 2020 en 2030 in Europa substantiële CO2 emissiereducties doorgevoerd worden. De modelsimulaties
laten zien dat dit mogelijk lijkt en aannemelijk, omdat de energie-exporteurs hun goedkopere energievoorraden zullen gebruiken (en daardoor hun CO2 emissies vergroten). Daardoor zullen
energie-importeurs (zoals Europa) hun CO2 emissies verder moeten verlagen om de schade door
klimaatverandering te beperken.
Trefwoorden: luchtvervuiling, klimaatverandering, schadekosten, kosten-baten analyse, energievoorziening
Contents
7
Contents
Uitgebreide samenvatting 9
1 Energy Security and Integrated Energy Policies 15 2 MERGE 17
2.1 Cost-benefit mode 17
2.2 Energy technologies in MERGE 19 3 A Security of Supply Function 21
3.1 Review of the literature on Security of Supply 21 3.2 Implementation of SOS Considerations in MERGE 25 3.3 Calibration 28
3.4 The dynamics of the penalty function 32 4 Simulation Results 37
4.1 Regional Impacts: OECD Europe 38 4.2 Global Impacts: The World 43 5 Sensitivity analysis 47
10 Conclusions 53 Acknowledgements 55 References 57
Appendix I Properties of the penalty function 59 Appendix II Overview of the BAU scenario 61
Uitgebreide samenvatting
9
Uitgebreide samenvatting
Integrale analyse klimaat, energievoorzieningszekerheid en luchtkwaliteit
Fossiele energie is de brandstof voor onze economie. Er is behoefte aan energie voor burgers en bedrijven, maar er is ook schaarste aan fossiele energiedragers. De risico’s van een te lage voorzieningszekerheid (VZZ) van bijvoorbeeld olie en gas kan veroorzaakt worden door een niet goed werkende markt, wanneer aanbieders en vragers van energie niet reageren op de prijzen. Bovendien leidt de huidige toename van het fossiele energiegebruik tot een beslag op de kwali-teit van de publieke ruimte. De verbranding van fossiele brandstoffen leidt tot de uitstoot van broeikasgassen welk weer op zijn beurt klimaatverandering tot gevolg heeft, en op de lange termijn grote schadelijke gevolgen heeft voor de wereld als geheel, en voor specifieke regio’s mogelijk zelfs desastreuze gevolgen. Maar in het heden en de nabije toekomst zal op lokaal niveau de verbranding van fossiele energie ook nog eens leiden tot de vervuiling van de lucht met gevolgen voor de gezondheid van de mens.De EU heeft een ambitieus klimaatplan neergelegd, heeft een aanpak opgesteld voor de verbe-tering van de luchtkwaliteit, en heeft ook ambitie om de voorzieningszekerheid van energie te vergroten. Maar een integrale visie is moeilijk te realiseren, omdat de problemen apart worden behandeld, en concrete doelen als in het geval van voorzieningszekerheid ontbreken. Bovendien heeft beleid op de verschillende terreinen ook verschillende effecten. Het MNP heeft een tentatieve mondiale analyse uitgevoerd die deze problemen op een noemer brengt door middel van een maat-schappelijke kosten-baten analyse. De analyse leidt tot scenario’s voor de economie, energie en bestrijdingstechnieken tegen luchtvervuiling voor Europa en andere grote regio’s. Deze scenario’s zijn geïntegreerde schetsen voor aanpassingen van de energie-infrastructuur, die de genoemde problemen tegelijkertijd aanpakken tegen de laagst mogelijke kosten en de welvaart maximeren.
Wat zijn de belangrijkste veronderstellingen
m.b.t. energie voorzieningszekerheid?
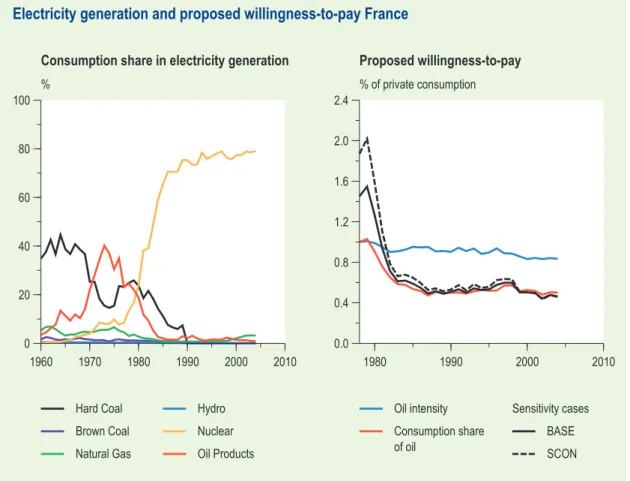
In de gestileerde modelanalyses is verondersteld is dat regio’s bereid zijn om de energievoorzie-ningszekerheid te verhogen door voor gas de importafhankelijkheid te verlagen, en het aandeel van olie en gas in het energiesysteem (diversificatie), en het verbruik per eenheid toegevoegde waarde te verlagen. Er zijn niet veel eenduidige voorbeelden in het verleden te vinden waarbij grootschalige programma’s zijn gestart om de energievoorzieningszekerheid te verhogen. Een voorbeeld is de ombouw van het Franse elektriciteitspark, in het begin van de zeventiger jaren vooral gestoeld op olie, waterkracht en kolen en 15 jaar later voornamelijk draaiend op nucle-aire energie. De directe kosten van deze expansie zijn als vuistregel en aanname gebruikt om de bereidwilligheid van regio’s te ijken naar het Franse voorbeeld. De maatschappelijke kosten van aanpassingen in het energiesysteem bedroegen in het Franse voorbeeld ruwweg 0,5% van particuliere consumptie. 1) Per regio verschillen de maatschappelijke kosten door de
heterogeni-teit van het energiesysteem.
1) Het BNP is gelijk aan particuliere consumptie plus investeringen plus overdrachten naar het buitenland. In Europa zal in de komende 50 jaar het niveau van particuliere consumptie 75-80% van het BNP bedragen.
10
De gevolgen voor Europa in 2030
Tabel S1 is een illustratie van de gevolgen voor Europa in 2030 van drie varianten: [1] optimaal klimaatbeleid zonder rekening te houden met de energievoorzieningszekerheid en luchtvervui-ling, [2] optimaal beleid ter verhoging van de energievoorzieningszekerheid en verlaging van de luchtvervuiling, en nadelige gevolgen van klimaatverandering tegen te gaan. Echter, de CO2
emissiereducties van Europa zijn gelijk aan het niveau van variant 1, en [3] volledig optimaal beleid, dus net als variant 2, maar dan zonder de beperking op CO2 emissiereducties in Europa.
Het streven naar gelijktijdig realiseren van verschillende doelen (derde variant) kan de uitworp van CO2 in 2030 met 33% verlagen ten opzichte van het niveau van 1990. Ook de fijn stof
emissies zullen substantieel dalen (0,41 mton PM10 is ongeveer 50%) Als er alleen klimaat- en
luchtbeleid gevoerd zou worden dan zal de emissiereductie lager uitvallen (-5% ten opzichte van 1990). Het combineren van beleid om de milieukwaliteit te verbeteren en de voorzienings-zekerheid te verhogen levert meer emissiereducties op voor CO2 en PM10 dan varianten waar
alleen klimaat -en luchtbeleid of alleen maar VZZ beleid wordt gevoerd (in het laatste geval is er zelfs een stijging van de CO2 emissies door een stijging van het gebruik van kolen). De tweede
variant - met een beperking op de CO2 emissiereductie gelijk aan de klimaatvariant – leidt via de
elektriciteitssector tot luchtkwaliteitsverbeteringen en een verhoogde VZZ door een stijging van nieuwe duurder kolencentrales (wel CO2 emissies maar geen fijn stof) die het mogelijk maken
om de vraag naar olie te verdringen buiten de elektriciteitssector.
Kosten van energiebeleid in de EU kleiner dan de baten
De kosten van beleid (verlies van consumptie ten opzichte van het basispad zonder beleid) zullen in Europa kleiner zijn dan de baten (=verminderde schade door beleid). De welvaart in 2030 kan 0,6-0,8% hoger uitkomen, mits er rekening gehouden wordt met het internaliseren van de externe schade door klimaatverandering, luchtvervuiling en een lage energievoorzieningszekerheid in de energieprijzen van Europa. De extra kosten van CO2 emissiereductie van de tweede ten opzicht
van de derde variant zijn klein (0,9% versus 0,7%), omdat de kostprijsstijgingen van deze verd-ergaande emissiereductie worden gecompenseerd door de dalende energiekosten en de langere termijn klimaatbaten (beperkt zich niet tot alleen Europa maar de hele wereld). De lagere kosten
Tabel S1: OECD-Europa in 2030 van variant Milieu + VZZ ten opzichte van het basispad 1,2)
Klimaatbeleid Klimaatbeperking +
luchtbeleid + VZZ Klimaat- en lucht-beleid + VZZ
CO2 emissies (Gton C) -0.22 (-5% t.o.v. 1990) -0.22 (-5% t.o.v. 1990) -0.49 (-33% t.o.v. 1990) PM10 emissies (mton PM10) -0,04 -0,24 -0,41
Vroegtijdige sterfte (%) -6 -34 -60
Gas Importafhankelijkheid (%, import / totale vraag) -79 -98 -100 Aandeel (%, aandeel van totaal primair energiegebruik) -16 -39 -35
Intensiteit (%, EJ/2000$) -20 -38 -40
Olie Aandeel (%, aandeel van vraag naar warmte) -10 -21 -40
Intensiteit (%, EJ/2000$) -13 -23 -45
Totale Baten (%, aandeel in particuliere consumptie) 1,0 1,3 1,5 Baten voorzieningszekerheid (%, aandeel in part. consumptie) 1,0 1,1 1,2 Baten lucht (%, aandeel in particuliere consumptie) 0,0 0,2 0,3
Particuliere Consumptie (%) -0,2 -0,7 -0,9
Welvaart = particulier consumptie + totale baten (%) 0,8 0,6 0,6 1) In 2030 is er nog geen verschil in klimaatschade tussen varianten (allemaal 0,1%); deze liggen verder in de toekomst. 2) Discontovoet 4% in 2020, 2% in 2100
Uitgebreide samenvatting
11 in Europa worden geïnitieerd doordat de afstoting van minder competitieve energie-intensieve activiteiten wordt toegestaan (deze producten worden dan geïmporteerd) en er geen beperking is op de CO2 emissiereductie die leidt tot lagere bestrijdingskosten van de luchtvervuiling.
De plannen voor een Europese gasrotonde lijken niet strijdig met een hogere energievoorzieningszekerheid
De welvaart wordt in 2030 vooral verhoogd door de voorzieningszekerheid te verbeteren (bijdrage 1,0-1,2% aan particuliere consumptie). De meeste baten worden al gehaald door de CO2 emissiereductie van de variant die zich beperkt door klimaatbeleid (-5% ten opzichte van
het niveau in 1990). De importafhankelijkheid van gas wordt verlaagd (tot 0%) door gascentrales merendeels te sluiten en te vervangen door duurdere niet-fossiele alternatieven. Daardoor wordt de schade door gasgebruik teruggebracht naar nul, en zijn argumenten als het aandeel van gas in de energievoorziening op Europees schaalniveau geen probleem meer. De daling van gas voor elektriciteitsopwekking is zelfs zo groot dat in de niet-elektriciteitssector een kleine gas expansie kan worden doorgevoerd. Dit lijkt niet strijdig te hoeven zijn met de plannen om een Europese gasrotonde (met Nederland in het centrum) te realiseren om drie redenen. Ten eerste is de daling van de gasintensiteit gemeten ten opzichte van het niveau van het basispad in 2030 zonder beleid en gelijk aan een stijging van de vraag naar gas met +15% ten opzichte van het jaar 2000. Ten tweede, de handel in gas tussen landen van Europa is ook niet uitgesloten (dit is één regio in de analyse). En ten derde, de import hoeft in de realiteit niet naar nul te dalen, omdat dit in deze analyse veroorzaakt wordt door de aanname dat de gasmarkt perfect georganiseerd is. De analyse houdt weliswaar rekening met huidige verstoringen op de markt en veronderstelt dat deze niet anders zullen zijn in de toekomst. Veranderingen in de investeringen van specifieke energietech-nieken zijn dus voornamelijk bepaald worden door de kostenverschillen tussen die techenergietech-nieken. Dat de import van gas naar nul gaat en Europa zijn gasvoorraad versneld opmaakt – immers de vraag naar gas stijgt ten opzichte van 2000 – moet dus vooral als een indicatie (en zeker niet een realisatie) worden beschouwd van de marktconforme oplossing van het EU-energiesysteem. Het aandeel van olie (als percentage van de totale warmtevraag) en de olie-intensiteit (oliever-bruik gedeeld door het BBP) dalen met 35-40% in de derde variant. Als de voorzieningszeker-heid niet als een probleem wordt gezien (eerste variant) of de CO2 emissiereductie maar beperkt
blijft (tweede variant staat in beperkte mate kolencentrales toe), dan zal het aandeel van olie en de olie-intensiteit ten opzichte van het basispad minder dalen vergeleken met de derde variant. Tevens moet opgemerkt worden dat de import van olie (in tegenstelling tot de import van gas) niet een factor is die bijdraagt aan de schade van de welvaart ten gevolge van een te lage VZZ. De reden hiervoor is dat de literatuur uitwijst dat de oliemarkt een geïntegreerde competitieve markt is met een min of meer homogene olieprijs.
De welvaart wordt ook verhoogd, omdat er extra luchtbaten zijn door een afname van de primaire fijn stof emissies (meer dan 0.41 mton PM10). Deze wordt gedreven door een daling
van de vraag naar kolen (zowel in de elektriciteit- en niet-elektriciteitssector) en dieselolie in de niet-electriciteitssector (voornamelijk voor transport). De luchtbaten zijn in Europa lager dan in de rest van de wereld, omdat in Europa al scherpere doelen zijn gesteld (de in de EU overeenge-komen nationale doelen voor SOx, NOX, NH3, en VOS).
In 2030 zullen er nog weinig welvaartsbaten zijn door een minder grote klimaatverandering van het tot dan gevoerde mondiale klimaatbeleid. Deze baten groeien over de tijd en liggen vooral in de verdere toekomst (zie ook OECD, 2008). Toch zijn de lange-termijn baten een argument om al
12
eerder de CO2 uitstoot te beperken als bedacht wordt dat investeren in duurdere
energietechnie-ken via innovatie deze op termijn goedkoper zullen maenergietechnie-ken.
De gevolgen voor de wereld
De belangrijkste uitkomsten van de analyse staan samengevat in drie varianten in tabel S2: optimaal klimaat -en luchtbeleid zonder rekening te houden met de energievoorzieningszek-1.
erheid (aangeduid met klimaat -en luchtbeleid)
optimaal beleid ter verhoging van de energievoorzieningszekerheid (aangeduid met
2. VZZ)
Klimaat -en luchtbeleid +
3. VZZ (zie ook tabel S1). De resultaten in deze tabel zijn
geaggre-geerd voor de wereld en de cijfers hebben betrekking op de periode 2000-2150.
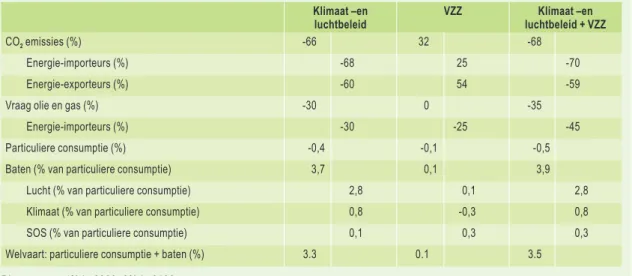
Tabel S2 laat het verschil zien tussen een variant met beleid en zonder milieu -en VZZ-beleid.
Geïntegreerde aanpak van de energievoorziening kan de welvaart verhogen
Het streven naar gelijktijdig realiseren van verschillende doelen werkt – net als voor Europa -welvaartsverhogend voor de wereld. Bedenk dat alle regio’s beleid voeren tegen luchtvervuiling (een lokaal belang), klimaatverandering (een mondiaal belang), en voor verhoging van de ener-gievoorzieningszekerheid (een lokaal belang dat natuurlijk niet van toepassing is op de energie-exporterende landen). Het VZZ beleid verschilt per regio, en is afhankelijk van de regiospecifieke relatie tussen economische groei en kostenontwikkeling van energietechnologieën. De externe welvaartsschade door een beperkte VZZ is toegepast voor de OESO regio, maar ook de energie-exporterende landen buiten de OESO. De derde kolom laat zien dat het combineren van VZZ en milieubeleid een gunstiger effect heeft op de welvaart, dan je beperken tot de één van de twee, of de som van de twee aparte strategieën. Het verschil tussen de gecombineerde variant en de som der delen is 0.1% (3.5-0.1-3.3), dit lijkt klein, maar is wel van belang. Er zijn twee redenen. Ten eerste, moet gerealiseerd worden dat regionale verschillen groter zijn dan het mondiale uitgemid-delde getal (zie ook het grotere resultaat in 2030 voor Europa). Ten tweede, de welvaartswinst is een getal dat geldt voor voor-nu-en-altijd (de veranderingen in de toekomst wegen minder zwaar dan de effecten in het heden, hetgeen bepaald wordt door de hoogte van de discontovoet).
Tabel S2: Mondiale effecten over de periode 2000-2150 van drie varianten t.o.v. het basispad Klimaat –en
luchtbeleid VZZ luchtbeleid + VZZKlimaat –en
CO2 emissies (%) -66 32 -68
Energie-importeurs (%) -68 25 -70
Energie-exporteurs (%) -60 54 -59
Vraag olie en gas (%) -30 0 -35
Energie-importeurs (%) -30 -25 -45
Particuliere consumptie (%) -0,4 -0,1 -0,5 Baten (% van particuliere consumptie) 3,7 0,1 3,9
Lucht (% van particuliere consumptie) 2,8 0,1 2,8 Klimaat (% van particuliere consumptie) 0,8 -0,3 0,8 SOS (% van particuliere consumptie) 0,1 0,3 0,3 Welvaart: particuliere consumptie + baten (%) 3.3 0.1 3.5 Discontovoet 4% in 2020, 2% in 2100
Uitgebreide samenvatting
13 De rangorde van de baten van de gecombineerde variant zijn de luchtbaten, gevolgd door klimaatvoordelen, en dan pas VZZ. De luchtbaten zijn het grootst, omdat de problemen nu al en de nabije toekomst een belangrijke rol spelen. Dit betekent dat beleidsreacties om het probleem tegen te gaan ook op korte termijn gerealiseerd worden, en daarom zwaar meewegen in de besluiten die producenten en consumenten kunnen nemen om de schade te verminderen. De klimaatbaten zijn kleiner dan de luchtbaten, maar groter dan die van VZZ. Weliswaar is het effect pas goed zichtbaar na 2100, maar is wel grootschalig. Dus mitigatiebeleid laat ook grotere verbeteringen zien die ook nu nog meewegen in de besluitvorming. Tot slot, de VZZ baten zijn relatief laag, omdat deze weliswaar nu groot zijn, maar alleen relevant tot aan 2050. Na 2050 is, volgens deze MNP-analyse, het probleem van VZZ significant lager, omdat aangenomen is dat de energie-intensiteit dan inmiddels zo laag zal zijn (groei van energie blijft achter bij die van het BBP) dat de economieën geen gevolgen zullen ondervinden van bijvoorbeeld de fluctuaties in de prijs van olie, of zelfs een uitval van aanbod van een energiedrager.
De CO2 emissies zijn gemeten als procentuele verschillen van een variant ten op zichte van het
basispad van de cumulatieve som van de emissies over de periode 2000-2150. De milieuvariant (klimaat –en luchtbeleid) laat zien dat de mondiale emissies over de hele periode van 2000-2150 met 66% omlaag gaan. Als er geen milieubeleid wordt gevoerd en wel wereldwijd beleid gericht wordt op een verbetering van de energievoorzieningszekerheid (VZZ), dan zullen de CO2
emis-sies stijgen door een expansie van kolencentrales (ten koste van gascentrales) voor elektriciteit en extra kolen voor warmtevraag ten behoeve van warmte (ten koste van gas en een beetje olie dat gebruikt wordt voor elektrisch gedreven warmtebronnen). De energie-exporteurs zullen hun goedkope fossiele bronnen zelf aanwenden voor gebruik, en hun emissies zullen om die reden stijgen. De inrichting van de mondiale energiehuishouding is dus totaal verschillend in de milieu-variant van de VZZ milieu-variant, en kunnen om die reden dus ook niet bij elkaar opgeteld worden zodat de derde variant wordt geleverd. De VZZ variant pakt dus slecht uit voor het klimaat, maar is wel gunstig voor de luchtkwaliteit, omdat olie in de transport sector wordt weggedrukt. De derde combinatievariant laat de extra CO2 emissiereducties (68%-66%=2%) zien van de
geïntegreerde variant door aanpassingen van het energiesysteem middels duurdere innovatieve niet-fossiele energietechnieken, die baten genereert door vermindering van de externe schade door een te lage VZZ en door een verlaging van de luchtvervuiling. De combinatie VZZ -en milieubeleid versterken elkaar op mondiale schaal. De CO2 emissiereductie van de olie –en
gasexporterende landen neemt af ten opzichte van de milieuvariant. Dit duidt op een weglekef-fect van CO2 emissiereducties door energie-importerende landen naar de exporterende landen.
De energie-exporteurs zijn verantwoordelijk voor ongeveer 25% van de mondiale emissies, en omdat de zijn hun goedkopere energievoorraden zullen gebruiken zullen de CO2 emissies daar
stijgen. De energie-importeurs (zoals OESO-Europa) verlagen hun CO2 emissies om de schade
door klimaatverandering te beperken en tegelijkertijd een synergie-effect te realiseren met lagere bestrijdingskosten om luchtvervuiling tegen te gaan.
Tot slot, als meerdere energie-importerende regio’s beleid gaan voeren om de voorzieningszeker-heid te verhogen (VZZ), dan zal in combinatie met klimaat -en luchtbeleid de mondiaal beschik-bare reserves dus niet volledig worden gebruikt. De mondiale gecumuleerde vraag naar olie en gas voor de komende 150 jaar zal met 30-35% lager zijn. Echter wanneer er geen milieubeleid gevoerd gaat worden, dan zullen de reserves van olie en gas toch uitgeput worden. De energie-importeurs zullen weliswaar de vraag naar olie en gas verminderen, maar deze uitval wordt deels teniet gedaan door extra vraag door de energie-exporterende landen en deels door extra vraag op de langere termijn door energie-importerende regio’s (VZZ-beleid is dan minder urgent door een lagere energie-intensiteit).
Energy Security and Integrated Energy Policies 1
15
Energy Security and Integrated Energy Policies
1
Recently, energy security has reappeared at the forefront of important national energy policy themes (IEA, 2007), and it also dominates the political agenda, see EU’s Green Paper (2006). An increasing part of the EU’s energy needs will have to be matched by imports. Particularly, for the supply of oil and natural gas, the EU is becoming more dependent on a small number of countries, some of which are threatened by political instability (see also Bollen et al, 2004). At the same time, the world energy demand is expected to boost from high economic growth in developing countries like China and India. Therefore, there will be more competing claims on the energy resources which are available in the world. Two major interrelated environmental policy problems of today, each with transboundary aspects, are global climate change (GCC) and local air pollution (LAP). Both are extensively discussed in the international political arena; the first in the United Nations Framework Convention on Climate Change (UNFCCC) and the second in, for instance, the United Nations Economic Commission for Europe’s task-force on Long-Range Transboundary Air Pollution (UNECE-LRTAP).
Options to mitigate climate change consist of a number of things, such as structural shifts of economies in favour of energy-extensive services, energy conservation, switches from carbon-intensive to carbon-extensive energy technologies and carbon storage. Options to reduce air pollution consist mainly of end-of-pipe technologies, many climate mitigation options, and so-called clean coal power stations in electricity markets. There are several options to secure energy needs: reduction of demand, diversification of demand over types of energy, diversifica-tion of sources and routes of supply of imported energy, streamlining of internal energy markets, and using better equipment to cope with emergencies.
All these options are typically chosen to address each problem, exclusively. There are strategies that change the energy system, based on either a reduction of damages from GCC, or LAP, or on a low energy related Security of Supply (SOS). This report searches for integrated approaches to tackle all problems at the same time. With this purpose in mind, the MERGE model (Manne and Richels, 2004) is applied. The model has a top-down character, designed for carrying out an integrated assessment of energy-economy-environment interactions and, in particular, for performing an economic cost-benefit analysis of climate change policies. Recently, the model was expanded to also carry out a simulation and cost-benefit analysis of the environmental and economic impacts of LAP (Bollen et al., 2007). This report describes how MERGE is further expanded to include issues of securing the energy supply, through the implementation of a rudi-mentary SOS function. The issue of energy related SOS is restricted to energy savings and diversi-fication of energy systems, which are an integral part of the original MERGE model.
Despite the simplifying assumptions that are used in this report to integrate the global long-term problem of GCC, as well as the more immediate medium-term problems, such as lack of energy related SOS and LAP, this study is believed to contribute to the ongoing debate. A framework is provided that enables deriving economically optimal decisions in energy markets, under varying parameter values and modelling assumptions. This is done on the basis of a trade-off between costs associated with mitigation efforts and benefits obtained from avoiding medium-term air pollution, long-term climate change damages, and improving on energy related SOS. Chapter 2 gives a qualitative overview of the extended version of MERGE. Chapter 3 presents an overview of the literature of energy related SOS (section 3.1). It also designs a mathematical expression of
16
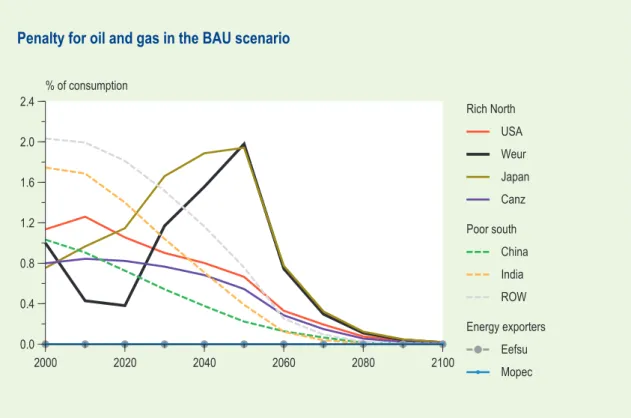
a penalty function, reflecting the societal damage that is associated with a lack in SOS, as relevant to the structure of MERGE (section 3.2). Additionally, chapter 3 calibrates the proposed penalty function on the basis of a few historical examples (section 3.3), and it concludes with the dynamics of the penalty function in the business-as-usual (BAU) scenario (section 3.4). Chapter 4 highlights the main findings of the simulations that were carried out with the modified MERGE model. The report focuses on developments in Europe, but also sketches impacts on a global scale. Chapter 5 presents an uncertainty analysis, while chapter 6 describes the main conclu-sions and recommendations.
MERGE 2
17
2 MERGE
The MERGE model allows for estimating global and regional effects of greenhouse gas emis-sions, as well as the costs of their reductions (Manne and Richels, 2004). Each region’s domes-tic economy is represented by a Ramsey-Solow model of optimal long-term economic growth, in which inter-temporal choices are made on the basis of a utility discount rate. Response behav-iour to price changes is introduced through an overall economy-wide production function, and output of the generic consumption good depends, like in other top-down models, on the inputs of capital, labour and energy. CO2 emissions are linked to energy production in a bottom-up
perspective, and separate technologies are defined for each main electric and non-electric energy option. The amount of CO2 emitted in each simulation period is translated into an addition to
the global CO2 concentration and a matching global temperature increment. For this report, the
MERGE model is used in its cost-benefit mode, in which an emissions time path is calculated that maximises the discounted utility of consumption. There are nine geopolitical regions, in which production and consumption opportunities are negatively affected by damages (or disutility), generated by GCC, LAP and energy related SOS. The cases that were analysed by MERGE and the obtained solutions assume Pareto-efficiency. Therefore, the only countries which are considered are those in which no region becomes better off while making another region worse off. Abate-ment can be optimally allocated with respect to the dimensions time (when), space (where) and pollutants (what).
The original MERGE model was modified, as described in Bollen et al. (2007), and for the purpose of this paper, a link was added between energy related SOS and energy production. This way, a model is obtained that can simulate the costs and benefits of GCC and LAP policies, as well as SOS control policies, all in a dynamic and multi-regional context.
Cost-benefit mode
2.1
All scenarios that are analysed in this paper are run in the cost-benefit (CB) mode of the model. Here we highlight the equations that are most relevant for the CB-mode. In each year and region an allocation of resources include those assigned to end-of-pipe Particulate Matter (PM) abate-ment costs: t,r t,r t,r t,r t,r t,r t,r C I J K D X Y = + + + + +
(1)
(2)
(3)
(4)
(5)
(6)
(7)
(8)
(9)
(10)
(11)
(12)
(13)
(14)
(15)
(
)
∑
∑
t t,r t,r t,r t,r t,r r rC
S
F
E
u
n
log
h cat T T E=(1−(Δ /Δ )2) ⎜ ⎜ ⎝ ⎛ ⎜ ⎜ ⎝ ⎛ − = ,weur ,weur t,r t,r t,r t,r t,r Y P P Y C N . F 2000 2000 06 1 1∑
∈−
=
} , { ,, ,1
gas oil f f tr r tIMP
S
∑
−
=
ip
ip
iI
(
)
ln
∑
−
=
ic
ip
ip
iI
(
)
ln
⎜ ⎜ ⎝ ⎛ ⎜ ⎜ ⎝ ⎛ ⎜ ⎜ ⎝ ⎛ ⎜ ⎜ ⎝ ⎛ ⎜ ⎜ ⎝ ⎛ ⎜ ⎜ ⎝ ⎛ 0 ) 0 : ( ; ) 0 : ( , , , , 0 , , 0 , , 0 , , , , > = tr tr tr < = r r t r r t r r t r r t r t r t i i A ii cc EE IMP i i IMP γ β α ⎜ ⎜ ⎝ ⎛ ⎜ ⎜ ⎝ ⎛ + = r t r t r t r t Y P . Y PPP , , , , / 1 125 ⎜ ⎜ ⎝ ⎛ ⎜ ⎜ ⎝ ⎛ + = r t r t r t r t Y P . Y PPP , , , , / 1 125 0 ) 0 : ( ; ) 0 : ( , , , , 0 , , 0 , , 0 , , , , ⎜⎜ < = ⎝ ⎛ ⎜ ⎜ ⎝ ⎛ ⎜ ⎜ ⎝ ⎛ ⎜ ⎜ ⎝ ⎛ ⎜ ⎜ ⎝ ⎛ ⎜ ⎜ ⎝ ⎛ = > tr tr tr r r t r r t r r t r r t r t r t E IMP i i E c c i i A i i IMP γ β α 0 ) 0 : ( ; / / ) 0 : ( , , , , 0 , 0 , , , , , ⎜⎜ < = ⎝ ⎛ ⎜ ⎜ ⎝ ⎛ = > tr tr tr r r r t r t r r t r t rt oil import GDP IMP i i
GDP import oil A i i IMP α 0 ) 0 : ( ; / / ) 0 : ( , , , , 0 , , 0 , 0 , , , , , ⎜⎜ < = ⎝ ⎛ ⎜ ⎜ ⎝ ⎛ ⎜ ⎜ ⎝ ⎛ ⎜ ⎜ ⎝ ⎛ = > tr tr tr r r t r r r t r t r r t r t r t E IMP i i E cons energy import oil cons energy import oil A i i IMP γ α 0 ) 0 : ( ; / / ) 0 : ( , , , , 0 , 0 , , , 0 , , , , ⎟⎟ < = ⎠ ⎞ ⎟ ⎟ ⎠ ⎞ ⎜ ⎜ ⎝ ⎛ ⎜ ⎜ ⎝ ⎛ = > tr tr tr r r r t r t r r t r r t r t r
t oilcons GDP IMP i i
GDP cons oil i i A i i IMP β α
( ) ( ) ( )
(
) (
α) (
β α) (
γ β)
γ γ β α γ β α γ β α − − − − − − = ⎟ ⎟ ⎠ ⎞ ⎜ ⎜ ⎝ ⎛ ⎟ ⎟ ⎠ ⎞ ⎜ ⎜ ⎝ ⎛ ⎟ ⎟ ⎠ ⎞ ⎜ ⎜ ⎝ ⎛ = = r t r t r t r t r t r t r t r t r t r t r r r r r t r t r t r t GDP cons energy cons oil import oil GDP cons energy cons energy cons oil cons oil import oil E c i E c i A E c i IMP , , , , , , , , , , , 0 , 0 , 0 , , , , ) ( ) ( ) ( ) , , ( (1) with Y representing output or Gross Domestic Product (GDP) aggregated in a single good ornuméraire, C consumption of this good, I the production reserved for new capital investments,
J the costs of energy, K the PM abatement costs as added with respect to the original MERGE formulation, D the output required to compensate for GCC-related damages, and X the net-exports of the numéraire good. The subscripts t and r refer to time and region, respectively. Solving the cost-benefit problem implies a control system that leads to lower temperature increases, avoided premature deaths, and increased energy related SOS.
18
Together they minimise the discounted present value of the sum of abatement and damage costs. 2) There is disutility associated with the damages from GCC, LAP, and low values of energy
related SOS. This is shown by the following relation expressing the objective function (maxi-mand) of the total problem, being the Negishi-weighted discounted sum of utility:
t,r t,r t,r t,r t,r t,r t,r C I J K D X Y = + + + + +
(1)
(2)
(3)
(4)
(5)
(6)
(7)
(8)
(9)
(10)
(11)
(12)
(13)
(14)
(15)
(
)
∑
∑
t t,r t,r t,r t,r t,r r rC
S
F
E
u
n
log
h cat T T E=(1−(Δ /Δ )2) ⎜ ⎜ ⎝ ⎛ ⎜ ⎜ ⎝ ⎛ − = ,weur ,weur t,r t,r t,r t,r t,r Y P P Y C N . F 2000 2000 06 1 1∑
∈−
=
} , { ,, ,1
gas oil f f tr r tIMP
S
∑
−
=
ip
ip
iI
(
)
ln
∑
−
=
ic
ip
ip
iI
(
)
ln
⎜ ⎜ ⎝ ⎛ ⎜ ⎜ ⎝ ⎛ ⎜ ⎜ ⎝ ⎛ ⎜ ⎜ ⎝ ⎛ ⎜ ⎜ ⎝ ⎛ ⎜ ⎜ ⎝ ⎛ 0 ) 0 : ( ; ) 0 : ( , , , , 0 , , 0 , , 0 , , , , > = tr tr tr < = r r t r r t r r t r r t r t r t E IMP i i E c c i i A i i IMP γ β α ⎜ ⎜ ⎝ ⎛ ⎜ ⎜ ⎝ ⎛ + = r t r t r t r t Y P . Y PPP , , , , / 1 125 ⎜ ⎜ ⎝ ⎛ ⎜ ⎜ ⎝ ⎛ + = r t r t r t r t Y P . Y PPP , , , , / 1 125 0 ) 0 : ( ; ) 0 : ( , , , , 0 , , 0 , , 0 , , , , ⎜⎜ < = ⎝ ⎛ ⎜ ⎜ ⎝ ⎛ ⎜ ⎜ ⎝ ⎛ ⎜ ⎜ ⎝ ⎛ ⎜ ⎜ ⎝ ⎛ ⎜ ⎜ ⎝ ⎛ = > tr tr tr r r t r r t r r t r r t r t r t E IMP i i E c c i i A i i IMP γ β α 0 ) 0 : ( ; / / ) 0 : ( , , , , 0 , 0 , , , , , ⎜⎜ < = ⎝ ⎛ ⎜ ⎜ ⎝ ⎛ = > tr tr tr r r r t r t r r t r t rt oil import GDP IMP i i
GDP import oil A i i IMP α 0 ) 0 : ( ; / / ) 0 : ( , , , , 0 , , 0 , 0 , , , , , ⎜⎜ < = ⎝ ⎛ ⎜ ⎜ ⎝ ⎛ ⎜ ⎜ ⎝ ⎛ ⎜ ⎜ ⎝ ⎛ = > tr tr tr r r t r r r t r t r r t r t r t E IMP i i E cons energy import oil cons energy import oil A i i IMP γ α 0 ) 0 : ( ; / / ) 0 : ( , , , , 0 , 0 , , , 0 , , , , ⎟⎟ < = ⎠ ⎞ ⎟ ⎟ ⎠ ⎞ ⎜ ⎜ ⎝ ⎛ ⎜ ⎜ ⎝ ⎛ = > tr tr tr r r r t r t r r t r r t r t r
t oilcons GDP IMP i i
GDP cons oil i i A i i IMP β α
( ) ( ) ( )
(
) (
α) (
β α) (
γ β)
γ γ β α γ β α γ β α − − − − − − = ⎟ ⎟ ⎠ ⎞ ⎜ ⎜ ⎝ ⎛ ⎟ ⎟ ⎠ ⎞ ⎜ ⎜ ⎝ ⎛ ⎟ ⎟ ⎠ ⎞ ⎜ ⎜ ⎝ ⎛ = = r t r t r t r t r t r t r t r t r t r t r r r r r t r t r t r t GDP cons energy cons oil import oil GDP cons energy cons energy cons oil cons oil import oil E c i E c i A E c i IMP , , , , , , , , , , , 0 , 0 , 0 , , , , ) ( ) ( ) ( ) , , ( (2) with n representing the Negishi weights, u the utility discount factor, E the disutility factor asso-ciated with GCC, F the disutility factor assoasso-ciated with LAP, and S the disutility factor assoasso-ciated with damages from a low SOS. The loss factor E is:t,r t,r t,r t,r t,r t,r t,r C I J K D X Y = + + + + +
(1)
(2)
(3)
(4)
(5)
(6)
(7)
(8)
(9)
(10)
(11)
(12)
(13)
(14)
(15)
(
)
∑
∑
t t,r t,r t,r t,r t,r r rC
S
F
E
u
n
log
h cat T T E=(1−(Δ /Δ )2) ⎜ ⎜ ⎝ ⎛ ⎜ ⎜ ⎝ ⎛ − = ,weur ,weur t,r t,r t,r t,r t,r Y P P Y C N . F 2000 2000 06 1 1∑
∈−
=
} , { ,, ,1
gas oil f f tr r tIMP
S
∑
−
=
ip
ip
iI
(
)
ln
∑
−
=
ic
ip
ip
iI
(
)
ln
⎜ ⎜ ⎝ ⎛ ⎜ ⎜ ⎝ ⎛ ⎜ ⎜ ⎝ ⎛ ⎜ ⎜ ⎝ ⎛ ⎜ ⎜ ⎝ ⎛ ⎜ ⎜ ⎝ ⎛ 0 ) 0 : ( ; ) 0 : ( , , , , 0 , , 0 , , 0 , , , , > = tr tr tr < = r r t r r t r r t r r t r t r t i i A ii cc EE IMP i i IMP γ β α ⎜ ⎜ ⎝ ⎛ ⎜ ⎜ ⎝ ⎛ + = r t r t r t r t Y P . Y PPP , , , , / 1 125 ⎜ ⎜ ⎝ ⎛ ⎜ ⎜ ⎝ ⎛ + = r t r t r t r t Y P . Y PPP , , , , / 1 125 0 ) 0 : ( ; ) 0 : ( , , , , 0 , , 0 , , 0 , , , , ⎜⎜ < = ⎝ ⎛ ⎜ ⎜ ⎝ ⎛ ⎜ ⎜ ⎝ ⎛ ⎜ ⎜ ⎝ ⎛ ⎜ ⎜ ⎝ ⎛ ⎜ ⎜ ⎝ ⎛ = > tr tr tr r r t r r t r r t r r t r t r t E IMP i i E c c i i A i i IMP γ β α 0 ) 0 : ( ; / / ) 0 : ( , , , , 0 , 0 , , , , , ⎜⎜ < = ⎝ ⎛ ⎜ ⎜ ⎝ ⎛ = > tr tr tr r r r t r t r r t r t rt oil import GDP IMP i i
GDP import oil A i i IMP α 0 ) 0 : ( ; / / ) 0 : ( , , , , 0 , , 0 , 0 , , , , , ⎜⎜ < = ⎝ ⎛ ⎜ ⎜ ⎝ ⎛ ⎜ ⎜ ⎝ ⎛ ⎜ ⎜ ⎝ ⎛ = > tr tr tr r r t r r r t r t r r t r t r t E IMP i i E cons energy import oil cons energy import oil A i i IMP γ α 0 ) 0 : ( ; / / ) 0 : ( , , , , 0 , 0 , , , 0 , , , , ⎟⎟ < = ⎠ ⎞ ⎟ ⎟ ⎠ ⎞ ⎜ ⎜ ⎝ ⎛ ⎜ ⎜ ⎝ ⎛ = > tr tr tr r r r t r t r r t r r t r t r
t oilcons GDP IMP i i
GDP cons oil i i A i i IMP β α
( ) ( ) ( )
(
) (
α) (
β α) (
γ β)
γ γ β α γ β α γ β α − − − − − − = ⎟ ⎟ ⎠ ⎞ ⎜ ⎜ ⎝ ⎛ ⎟ ⎟ ⎠ ⎞ ⎜ ⎜ ⎝ ⎛ ⎟ ⎟ ⎠ ⎞ ⎜ ⎜ ⎝ ⎛ = = r t r t r t r t r t r t r t r t r t r t r r r r r t r t r t r t GDP cons energy cons oil import oil GDP cons energy cons energy cons oil cons oil import oil E c i E c i A E c i IMP , , , , , , , , , , , 0 , 0 , 0 , , , , ) ( ) ( ) ( ) , , ( (3) in which ΔT is the temperature rise of its 2000 level, and ΔTcat the catastrophic temperature atwhich the entire economic production would be wiped out. The t-dependence is thus reflected in the temperature increase reached at a particular point in time, while the r-dependence is covered by the ‘hockey stick’ parameter h, which is assumed to be 1 for high-income regions, and takes values below unity for low-income regions. The GCC part of MERGE is kept unchanged in its original form, but for the part of this theory section below the focus is on the expanded MERGE model to account for (A) the chain of PM emissions increasing their ambient concentrations, (B) the increase of PM concentrations provoking premature deaths, and (C) the meaning of these deaths in terms of their monetary valuation. The following equation for the disutility F associ-ated with monetised damages from LAP:
t,r t,r t,r t,r t,r t,r t,r C I J K D X Y = + + + + +
(1)
(2)
(3)
(4)
(5)
(6)
(7)
(8)
(9)
(10)
(11)
(12)
(13)
(14)
(15)
(
)
∑
∑
t t,r t,r t,r t,r t,r r rC
S
F
E
u
n
log
h cat T T E=(1−(Δ /Δ )2) ⎜ ⎜ ⎝ ⎛ ⎜ ⎜ ⎝ ⎛ − = ,weur ,weur t,r t,r t,r t,r t,r Y P P Y C N . F 2000 2000 06 1 1∑
∈−
=
} , { ,, ,1
gas oil f f tr r tIMP
S
∑
−
=
ip
ip
iI
(
)
ln
∑
−
=
ic
ip
ip
iI
(
)
ln
⎜ ⎜ ⎝ ⎛ ⎜ ⎜ ⎝ ⎛ ⎜ ⎜ ⎝ ⎛ ⎜ ⎜ ⎝ ⎛ ⎜ ⎜ ⎝ ⎛ ⎜ ⎜ ⎝ ⎛ 0 ) 0 : ( ; ) 0 : ( , , , , 0 , , 0 , , 0 , , , , > = tr tr tr < = r r t r r t r r t r r t r t r t E IMP i i E c c i i A i i IMP γ β α ⎜ ⎜ ⎝ ⎛ ⎜ ⎜ ⎝ ⎛ + = r t r t r t r t Y P . Y PPP , , , , / 1 125 ⎜ ⎜ ⎝ ⎛ ⎜ ⎜ ⎝ ⎛ + = r t r t r t r t Y P . Y PPP , , , , / 1 125 0 ) 0 : ( ; ) 0 : ( , , , , 0 , , 0 , , 0 , , , , ⎜⎜ < = ⎝ ⎛ ⎜ ⎜ ⎝ ⎛ ⎜ ⎜ ⎝ ⎛ ⎜ ⎜ ⎝ ⎛ ⎜ ⎜ ⎝ ⎛ ⎜ ⎜ ⎝ ⎛ = > tr tr tr r r t r r t r r t r r t r t r t E IMP i i E c c i i A i i IMP γ β α 0 ) 0 : ( ; / / ) 0 : ( , , , , 0 , 0 , , , , , ⎜⎜ < = ⎝ ⎛ ⎜ ⎜ ⎝ ⎛ = > tr tr tr r r r t r t r r t r t rt oil import GDP IMP i i
GDP import oil A i i IMP α 0 ) 0 : ( ; / / ) 0 : ( , , , , 0 , , 0 , 0 , , , , , ⎜⎜ < = ⎝ ⎛ ⎜ ⎜ ⎝ ⎛ ⎜ ⎜ ⎝ ⎛ ⎜ ⎜ ⎝ ⎛ = > tr tr tr r r t r r r t r t r r t r t r t E IMP i i E cons energy import oil cons energy import oil A i i IMP γ α 0 ) 0 : ( ; / / ) 0 : ( , , , , 0 , 0 , , , 0 , , , , ⎟⎟ < = ⎠ ⎞ ⎟ ⎟ ⎠ ⎞ ⎜ ⎜ ⎝ ⎛ ⎜ ⎜ ⎝ ⎛ = > tr tr tr r r r t r t r r t r r t r t r
t oilcons GDP IMP i i
GDP cons oil i i A i i IMP β α
( ) ( ) ( )
(
) (
α) (
β α) (
γ β)
γ γ β α γ β α γ β α − − − − − − = ⎟ ⎟ ⎠ ⎞ ⎜ ⎜ ⎝ ⎛ ⎟ ⎟ ⎠ ⎞ ⎜ ⎜ ⎝ ⎛ ⎟ ⎟ ⎠ ⎞ ⎜ ⎜ ⎝ ⎛ = = r t r t r t r t r t r t r t r t r t r t r r r r r t r t r t r t GDP cons energy cons oil import oil GDP cons energy cons energy cons oil cons oil import oil E c i E c i A E c i IMP , , , , , , , , , , , 0 , 0 , 0 , , , , ) ( ) ( ) ( ) , , ( (4)in which N is the number of premature deaths from chronic exposure to PM, and P the exog-enous number of people in a given population. For non-European regions, Value of Statistical Life (VSL) is determined by multiplying VSL of OECD Europe (WEUR) with the ratio of GDP per capita, of these respective regions. For future years, VSL is assumed to rise according to the growth rate of GDP per capita. For further reading on the modelling of N, is referred to Bollen
et al. (2007). Finally, the argument S is added to account for disutility, associated with a low
energy related SOS:
t,r t,r t,r t,r t,r t,r t,r C I J K D X Y = + + + + +
(1)
(2)
(3)
(4)
(5)
(6)
(7)
(8)
(9)
(10)
(11)
(12)
(13)
(14)
(15)
(
)
∑
∑
t t,r t,r t,r t,r t,r r rC
S
F
E
u
n
log
h cat T T E=(1−(Δ /Δ )2) ⎜ ⎜ ⎝ ⎛ ⎜ ⎜ ⎝ ⎛ − = ,weur ,weur t,r t,r t,r t,r t,r Y P P Y C N . F 2000 2000 06 1 1∑
∈−
=
} , { ,, ,1
gas oil f f tr r tIMP
S
∑
−
=
ip
ip
iI
(
)
ln
∑
−
=
ic
ip
ip
iI
(
)
ln
⎜ ⎜ ⎝ ⎛ ⎜ ⎜ ⎝ ⎛ ⎜ ⎜ ⎝ ⎛ ⎜ ⎜ ⎝ ⎛ ⎜ ⎜ ⎝ ⎛ ⎜ ⎜ ⎝ ⎛ 0 ) 0 : ( ; ) 0 : ( , , , , 0 , , 0 , , 0 , , , , > = tr tr tr < = r r t r r t r r t r r t r t r t E IMP i i E c c i i A i i IMP γ β α ⎜ ⎜ ⎝ ⎛ ⎜ ⎜ ⎝ ⎛ + = r t r t r t r t Y P . Y PPP , , , , / 1 125 ⎜ ⎜ ⎝ ⎛ ⎜ ⎜ ⎝ ⎛ + = r t r t r t r t Y P . Y PPP , , , , / 1 125 0 ) 0 : ( ; ) 0 : ( , , , , 0 , , 0 , , 0 , , , , ⎜⎜ < = ⎝ ⎛ ⎜ ⎜ ⎝ ⎛ ⎜ ⎜ ⎝ ⎛ ⎜ ⎜ ⎝ ⎛ ⎜ ⎜ ⎝ ⎛ ⎜ ⎜ ⎝ ⎛ = > tr tr tr r r t r r t r r t r r t r t r t E IMP i i E c c i i A i i IMP γ β α 0 ) 0 : ( ; / / ) 0 : ( , , , , 0 , 0 , , , , , ⎜⎜ < = ⎝ ⎛ ⎜ ⎜ ⎝ ⎛ = > tr tr tr r r r t r t r r t r t rt oil import GDP IMP i i
GDP import oil A i i IMP α 0 ) 0 : ( ; / / ) 0 : ( , , , , 0 , , 0 , 0 , , , , , ⎜⎜ < = ⎝ ⎛ ⎜ ⎜ ⎝ ⎛ ⎜ ⎜ ⎝ ⎛ ⎜ ⎜ ⎝ ⎛ = > tr tr tr r r t r r r t r t r r t r t r t E IMP i i E cons energy import oil cons energy import oil A i i IMP γ α 0 ) 0 : ( ; / / ) 0 : ( , , , , 0 , 0 , , , 0 , , , , ⎟⎟ < = ⎠ ⎞ ⎟ ⎟ ⎠ ⎞ ⎜ ⎜ ⎝ ⎛ ⎜ ⎜ ⎝ ⎛ = > tr tr tr r r r t r t r r t r r t r t r
t oilcons GDP IMP i i
GDP cons oil i i A i i IMP β α
( ) ( ) ( )
(
) (
α) (
β α) (
γ β)
γ γ β α γ β α γ β α − − − − − − = ⎟ ⎟ ⎠ ⎞ ⎜ ⎜ ⎝ ⎛ ⎟ ⎟ ⎠ ⎞ ⎜ ⎜ ⎝ ⎛ ⎟ ⎟ ⎠ ⎞ ⎜ ⎜ ⎝ ⎛ = = r t r t r t r t r t r t r t r t r t r t r r r r r t r t r t r t GDP cons energy cons oil import oil GDP cons energy cons energy cons oil cons oil import oil E c i E c i A E c i IMP , , , , , , , , , , , 0 , 0 , 0 , , , , ) ( ) ( ) ( ) , , ( (5)in which IMP is the penalty function for oil and gas, resembling the willingness-to-pay in order to avoid a lack in SOS (% consumption) related to one of these types of energy. Chapter 3 will provide more details on the penalty function. Here it suffices to state that a low value for oil and gas security translates into high values for IMP and lower values for S.
2) Y is ‘fixed’. It is equal to the sum of a production function of a new vintage and a fixed old vintage. With respect to the new vintage, there is a putty-clay CES formulation of substitution between new capital, labour, electric and non-electric energy in the production of the com-posite output good . With respect to the old vintage, it is assumed that there is no substitution between inputs. New capital is a distributed lag function of the investments of a certain year and a previous time step. K is equal to the costs of end-of-pipe abatement, and just one of the claimants of production, and therefore if K increases, then C reduces (which itself is part of the maximand).
MERGE 2
19
Energy technologies in MERGE
2.2
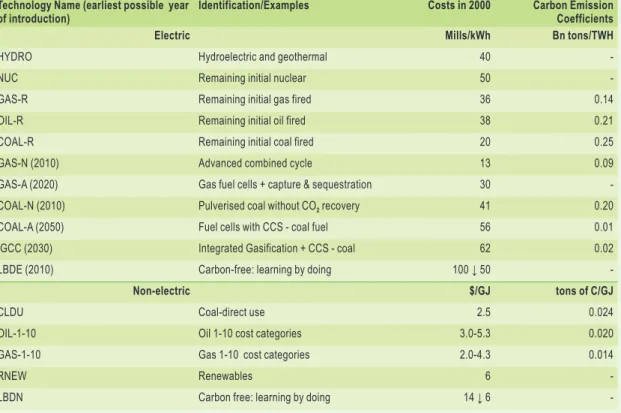
Many technological options, modelled in MERGE, may generate more efficient and clean energy systems that emit less CO2 per unit of energy. Table 2.1 provides an overview of the relevant
options for the future. The current technologies can be found in Manne and Richels (2002). For each technology, Table 2.1 shows the introduction date, the costs in 2000, the floor costs (only relevant for those technologies with a learning-by-doing process), and the carbon coef-ficient. The electric, non fossil fuel option (LBDE) has a learning-by-doing component, and is a container of wind, solar, nuclear, and biomass options. The LBDE option can be applied from 2010 onwards, at a high cost per GJ. On the fossil fuel side are a few cheaper options: GAS-N, GAS-A, COAL-N, COAL-A, Integrated Gasification (coal-based), and Carbon Captures and storage (IGCC). All technologies are assumed to show autonomous technological progress.
A few technologies are distinguished for non-electric energy. There are two types of non-fossil fuels: ReNEWable energy (RNEW) and a more abstract technology labeled Learning-By-Doing Non-electric energy (LBDN). RNEW represents low-cost renewables, such as ethanol (available in limited supply). LBDN is available throughout the world, with an unlimited resource. In the base year, LBDN is available at a high cost price, which may decrease because of the learning-by-doing process. The remaining fossil fuel options are described in Manne and Richels (2002).
Table 2.1 Characterisation and costs of technologies in MERGE Technology Name (earliest possible year
of introduction) Identification/Examples Costs in 2000 Carbon Emission Coefficients
Electric Mills/kWh Bn tons/TWH
HYDRO Hydroelectric and geothermal 40
-NUC Remaining initial nuclear 50
-GAS-R Remaining initial gas fired 36 0.14
OIL-R Remaining initial oil fired 38 0.21
COAL-R Remaining initial coal fired 20 0.25
GAS-N (2010) Advanced combined cycle 13 0.09
GAS-A (2020) Gas fuel cells + capture & sequestration 30 -COAL-N (2010) Pulverised coal without CO2 recovery 41 0.20 COAL-A (2050) Fuel cells with CCS - coal fuel 56 0.01 IGCC (2030) Integrated Gasification + CCS - coal 62 0.02 LBDE (2010) Carbon-free: learning by doing 100 ↓ 50
-Non-electric $/GJ tons of C/GJ
CLDU Coal-direct use 2.5 0.024
OIL-1-10 Oil 1-10 cost categories 3.0-5.3 0.020 GAS-1-10 Gas 1-10 cost categories 2.0-4.3 0.014
RNEW Renewables 6
A Security of Supply Function 3
21
A Security of Supply Function
3
An overview of the literature of energy related SOS, enables to design a mathematical expres-sion of a penalty function, reflecting the societal damage that is associated with a lack in SOS, and that could be relevant to the structure of MERGE. In a few historical examples, this chapter illustrates how the penalty functions are calibrated, and they are used to illustrate some of the dynamics of the behaviour of the penalty function in the business-as-usual (BAU) scenario.
Review of the literature on Security of Supply
3.1
Several projects focusing on the theme of Security of Supply, have been carried out at the Energy research Centre of the Netherlands (ECN), over the past years. These studies gener-ally target aspects of SOS, that are related to a subset of the energy carriers available in modern society (see e.g. Scheepers et al., 2004; van Oostvoorn, 2003; van Werven et al., 2005). Two recent ECN reports frame SOS in the broader context of national energy systems of industrial-ised countries, and attempt to develop indicators for SOS: Jansen et al. (2004) and Scheepers et al. (2006). One of these two reports focuses on the SOS of primary energy resources, while the other mostly reviews security aspects of integral energy supply chains. Thus, the first merely addresses the supply aspects of energy systems and the long-term SOS issues, while the second presents an analysis of both supply and demand issues, and focuses on the short-term, including a more elaborate inspection of how to address and mitigate SOS concerns. Both studies attempt to quantify SOS through a bottom-up approach, in which the supply system risks are identified and impacts of supply system failures are valued. The first two sections below specify the ings of these two studies, in more detail. The third section summarises some of the major find-ings of two other studies by Leiby et al. (1997) and Leiby et al. (2007), which both analyse the macroeconomic costs and benefits of the USA dependency on foreign oil.
Designing Indicators of Long-Term Energy Supply Security 3.1.1
The study by Jansen et al. (2004) identifies the feasibility of designing a macro-indicator for the long-term security of energy supply, and proposes possible methodologies for the development of such a term SOS macro-indicator. In addition, it evaluates the case of possible long-term disruptions in the supply of natural gas to the European Union. This study primarily deals with measuring to which extent a particular region can ensure meeting its expected demand for energy services, at affordable prices and over long time frames, typically up to 2040. The macro-indicator focuses on long-term threats to the energy supply and delivery system of a region, notably as a result of fuel supply disruptions. Therefore, it implies the use of long-running hedging approaches. Short supply disruptions that do not pose a long-term challenge to a region’s energy system, are disregarded.
An essential feature of ensuring long-term security for the energy supply is to determine an ‘efficient portfolio’ of primary energy sources. ‘Efficiency’ in this context, for a given portfo-lio, refers to the optimal trade-off between limiting serious threats to the sustained provision of energy services, and keeping the cost per average unit of primary energy supply as low as possi-ble. The study recognises that incertitude plays a fundamental role in determining the efficiency of a given portfolio. Three basic states of incertitude can be identified:
22
Risk
• , as a quantifiable incertitude,
Uncertainty
• , as a known but unquantifiable incertitude,
Ignorance
• , as an unknown, unquantifiable incertitude.
In the context of this terminology, risks allow for the application of traditional probabilistic and statistical methods. Alternatively, uncertainty may be addressed by Bayesian and scenario-based approaches, or Delphi-like methods in which expert opinions are compiled and weighted. Especially in a state of ignorance, the maintenance or creation of diversity can provide resilience to systems exposed to incertitude. Yet, the creation of diversity carries costs, since obvious and certain cost reductions, resulting from, for example, economies-of-scale or standardisation, could be forgone.
In order to design optimum diversity strategies, in the face of conditions of ignorance, the concept diversity needs to be characterised. Diversity can be used as an overarching concept, with three subordinate properties:
Variety
• , referring to the number of categories into which a quantity can be partitioned. For example, the categories may denote primary energy sources or, in a more refined analysis, major energy conversion technologies. Variety is a positive integer and, all else being equal, the greater the variety of a system, the greater the diversity.
Balance
• , referring to the pattern in the apportionment or spread of that quantity across the relevant categories, for example, expressed in terms of EJ when the categories considered are primary energy sources. Independent of the total number of categories, the more even the spread between them, the greater the diversity.
Disparity
• , referring to the nature and degree to which the categories are mutually divergent. For example, the categories ‘oil’ and ‘natural gas’ are less disparate than ‘oil’ and ‘renewa-bles’, not in the least given the heterogeneity of the latter. However, disparity is an intrinsic qualitative aspect of diversity.
The first two aspects of diversity are explicitly quantifiable, whereas the third is context-depend-ent and allows for subjective manoeuvring. The Shannon-Wiener index is an approach used to express diversity, reflecting both variety and balance. On the other hand, integrated
multi-crite-ria analysis is a method designed to reflect all three aspects of diversity: variety, balance and
disparity.
Given the time horizons involved with issues of long-term security of supply, ignorance in this context is considered to be a relevant phenomenon. Therefore, diversity is an important notion for the development of a security of supply indicator, and diversification should be a key element of any strategy mitigating security of supply risks. The Shannon-Wiener index and the
integrated multi-criteria analysis both express the level of diversity and may, thus, be useful
means to measure the level of security of energy supply.
In addition to recollecting this rudimentary taxonomy of incertitude, the study of Jansen et al. (2004) lists a variety of quantitative approaches by which risk, the first form of incertitude, can be expressed and/or reduced:
Risk pooling (as with insurances), •
Value at Risk (as in banking), •
Portfolio Theory (as by Markowitz), •
Shannon-Wiener index (as by Stirling), •
Integrated multi-criteria analysis (as by Stirling). •
![Tabel S1 is een illustratie van de gevolgen voor Europa in 2030 van drie varianten: [1] optimaal klimaatbeleid zonder rekening te houden met de energievoorzieningszekerheid en luchtvervui-ling, [2] optimaal beleid ter verhoging van de energievoorzienings](https://thumb-eu.123doks.com/thumbv2/5doknet/3255355.20690/10.892.134.776.129.417/illustratie-gevolgen-varianten-klimaatbeleid-energievoorzieningszekerheid-luchtvervui-verhoging-energievoorzienings.webp)