Netherlands Environmental Assessment Agency, November 2009
Policy Studies
News in Climate Science and Exploring Boundaries.The IPCC Fourth Assessment Report of 2007 (AR4), today, still offers a solid scientific base for climate policy-making. However, there are risks that climate change may happen faster - or may have more severe impacts – than expected. Therefore, it is recommended to increase climate moni-toring efforts, and investigate policy response options addressing these risks.
News in Climate
Science and
Exploring
Boundaries
A Policy brief on
developments
since the IPCC AR4
report in 2007
News in Climate Science and
Exploring Boundaries
A Policy brief on developments since
the IPCC AR4 report in 2007
This report has been prepared by
Netherlands Environmental Assessment Agency PBL Royal Netherlands Meteorological Institute KNMI Wageningen University and Research Centre WUR With contributions from:
Energy research Centre of the Netherlands ECN ECOFYS
Utrecht University UU
Free University of Amsterdam VU
The report is made possible with a financial contribution of the Netherlands Research Programme on Scientific Assessment and Policy Analysis for Climate Change (WAB) to the sub- projects ‘News in climate science since IPCC AR4 - the Climate System’ and ‘Exploring the boundaries of climate change’.
A list of authors and acknowledgements is represented in Annex 1. Second print
The following changes have been made:
Figure 2.7. The original title ‘Greenhouse gas emissions, IPCC scenarios and historic trend’ has been changed to Energy-related CO2 emissions, IPCC scenarios and historic trend
News in Climate Science and Exploring Boundaries
© Netherlands Environmental Assessment Agency (PBL), Bilthoven, November 2009 PBL publication number 500114013
Corresponding Author: Leo Meyer; leo.meyer@pbl.nl
Parts of this publication may be reproduced, providing the source is stated, in the form: Netherlands Environmental Assessment Agency, Adapting EU governance for a more sustainable future.
This publication can be downloaded from our website: www.pbl.nl/en. A hard copy may be ordered from: reports@pbl.nl, citing the PBL publication number.
The Netherlands Environmental Assessment Agency (PBL) is the national institute for strategic policy analysis in the field of environment, nature and spatial planning. We contribute to improving the quality of political and administrative decision-making by conducting outlook studies, analyses and evaluations in which an integrated approach is considered paramount. Policy relevance is the prime concern in all our studies. We conduct solicited and unsolicited research that is both independent and always scientifically sound.
Office Bilthoven PO Box 303 3720 AH Bilthoven The Netherlands Telephone: +31 (0) 30 274 274 5 Fax: +31 (0) 30 274 44 79 Office The Hague PO Box 30314 2500 GH The Hague The Netherlands Telephone: +31 (0) 70 328 8700 Fax: +31 (0) 70 328 8799 E-mail: info@pbl.nl Website: www.pbl.nl/en
Contents 5
Contents
Summary 7 Samenvatting 9 1 Introduction 11 2 News in climate science since the IPCC Fourth Assessment Report 2007 13 2.1 The global climate system 13
2.2 Impacts and vulnerability to climate change 19 2.3 Mitigation and stabilisation 20
3 Exploring the boundaries of climate change 23
4 Policy options to respond to rapid climate change 27
Summary 7 The IPCC Fourth Assessment Report (2007) assessed
worldwide scientific literature on all aspects of climate change, of the period from 2000 to 2006. The report is intensively used for underpinning international climate policy-making. Since 2006, a large and increasing amount of new literature has appeared, raising the question of whether the IPCC knowledge, based on literature until 2006, is still adequate for the UNFCCC Copenhagen Climate summit in 2009. Our report offers an assessment of scientific peer-reviewed literature, over the period of 2006 to 2009 on a selection of topics from IPCC AR4. The authors have concluded that the IPCC report of 2007 still provides a valid scientific base for climate policy in 2009. Although there are indications that, in some cases, climate change may have more severe impacts, or may occur faster than projected by the IPCC, there are no grounds for doubting the validity of the main conclusions of the IPCC, with regard to the climate system, impacts, vulnerability, adaptation and mitigation.
Findings from science
Global warming continues. Eight of the ten warmest years in recorded history have occurred since 2000, although the rate at which global average temperature increases has slowed down significantly over the last decade, compared to the average increase between 1975 and 2008. Recent publications show that this is due to natural variations that are well understood. Claims that global warming has stopped since 1998 are at odds with long-term observations, which show comparable variations on similar timescales. It is expected that, in the longer term, warming will continue. According to several solar physicists, the sun may enter a stage of very low activity. Global temperature increase due to human influence might be tempered by 0.2 °C in the coming decades, but long-term projections of global warming in IPCC 2007 remain unchanged.
IPCC concluded in 2007 that global warming, since the middle of the 20th century, has very likely been due to human influence on the global climate. This statement is still robust, even when taking into account peer-reviewed scientific literature expressing doubts on this relation.
Greenland and Antarctica tend to lose more ice than was presented in the IPCC AR4 report. Observations in the period from 2002 to 2009 show that the mass loss of both ice sheets has accelerated over time, implying that the ice sheets contributions to sea level rise also becomes larger over time. For 2100, the high-end projection for global mean sea level rise is higher (0.55 -1.1 metres) than global estimates, as reported by the IPCC AR4 (0.25-0.76 metres), compared to 1990 levels. This implies a rise along the Dutch coast of 0.40 to 1.05 metres, by 2100.
Sea ice retreat and thinning in the Arctic are continuing much faster than was reported in the IPCC AR4.
The uptake of CO2 by land and sea is relatively decreasing;
compared to the 1990s, on a global level, biosphere and ocean sinks of CO2 have remained more or less stable
during the period from 2000 to 2007, but CO2 emissions
from fossil fuels have grown strongly and, therefore, the fraction of emissions being sequestered by the biosphere and the oceans is declining.
Large-scale ecosystem changes due to climate change are becoming more apparent, but lack of data and monitoring limit systematic assessment.
Coral Reefs are severely threatened by ocean acidification by CO2 and increasing temperatures.
The growth in global greenhouse gas emissions increased steeply from 2000 to 2004, compared to the 1990s, but slowed down considerably after 2004. This is partly due to mitigation measures. The economic crisis is expected to cause a decrease in global CO2 emission of 3 %, in 2009,
compared to 2008.
This study reaffirms the IPCC 2007 conclusion that global mitigation potentials could offset the expected growth in emissions, or even to reduce emissions below current levels, in the coming decades. Reductions of 20 to 50% below baselines are possible, at costs of less than 100 USD/ tonne avoided CO2, by 2030.
The 2 oC target requires that peaking of global greenhouse
gas emissions happens no later than around 2020. New low-stabilisation scenarios, together, have shifted the range of the peaking years for global greenhouse gas emissions from between 2000 and 2015, as indicated in the IPCC AR4 report, to between 2010 and 2020.
Summary
The IPCC Fourth Assessment Report of 2007 (AR4), today, still offers a solid scientific base for climate policy-making. However, there are risks that climate change may happen faster - or may have more severe impacts – than expected. Therefore, it is recommended to increase climate monitoring efforts, and investigate policy response options addressing these risks.
Risk of overestimation or underestimation of future
climate change
A doubling of the CO2 concentration since the pre-industrial
era is most likely to lead to an average global increase of 3
oC. There is a chance that this number will be lower, and that
future human induced global warming will happen slower than anticipated by the IPCC. In that case, negative impacts will be smaller than is generally assumed for policy responses. However, the odds that the increase will higher than 3 oC, are
greater, due to several mechanisms in the climate system that may accelerate global warming. Therefore, the chance of underestimation of the future increase in global temperature is larger than of overestimation.
Exploring policy responses to accelerated climate change
Further analysis shows that there are indeed risks ofaccelerated climate change that were not fully elaborated by the IPCC AR4, and more attention in the literature is given to potentially irreversible processes. The literature mentions ‘tipping points’ – in this report referred to as ‘eventualities’, such as rapid release of methane from the sea bed, and the collapse of the West Antarctic Ice Sheet and the Amazon rain forest. These processes, even if they are less likely to happen, may have very large impacts and, therefore, pose a considerable risk – both globally and regionally. In general, current climate policy responses as implemented and/or proposed under UNFCCC and national programmes, do not take these risks explicitly into account. This study explores the possible policy responses portfolio that might deal with rapid climate change: accelerated mitigation, geoengineering, and enhanced adaptation.
The thinking about policy responses to address these risks is generally still in its infancy. Accelerated mitigation will reach its limits, with regard to social acceptability and time needed to replace capital goods and change infrastructures. Some geoengineering options, such as solar radiation management by injecting aerosols into the stratosphere on a massive scale, may be perceived as a cheap ‘emergency cooling’ while simultaneously posing new and unknown risks to the global climate system. Emergency adaptation is the last way out, but this also has its limitations that today are still largely unknown.
Recommendations
Building on the initial explorations and findings in this report, the authors recommend:
To find early warning signals of climate tipping points and to develop or improve climate monitoring systems needed for detecting these signals;
To further investigate policy options to respond to the risks of accelerated climate change, including aspects of timeliness, effectiveness and governance, on national and international scales. Such an analysis should include possible strategies for dealing with geoengineering; Specifically for the Netherlands, the risks of extreme sea
level rise and river flooding have already been adequately
taken into account in national adaptation policy, but it is recommended to investigate impacts on public health, agriculture, and ecosystems, and their policy response options in case of accelerated or extreme climate change.
Samenvatting 9 Het Vierde Assessment Report van het IPCC van 2007 heeft de
wereldwijde wetenschappelijke literatuur over alle aspecten van klimaatverandering van 2000 tot in 2006 geëvalueerd. Het rapport wordt intensief gebruikt voor onderbouwing van internationaal klimaatbeleid. Sinds 2006 is een grote en toenemende hoeveelheid nieuwe literatuur verschenen, die de vraag heeft opgeroepen of de IPCC kennis, die gebaseerd is op de literatuur tot in 2006, nog wel toereikend is voor de UNFCCC klimaattop in 2009. Dit rapport geeft een evaluatie van wetenschappelijke ‘peer-reviewed’ literatuur verschenen in de periode 2006-2009 over een selectie van onderwerpen uit het IPCC AR4 rapport. De auteurs concluderen dat het IPCC rapport van 2007 nog steeds een geldige basis levert voor klimaatbeleid in 2009.
Hoewel er aanwijzingen zijn dat in sommige gevallen klimaatverandering ernstiger gevolgen zou kunnen hebben, of sneller zouden kunnen plaatsvinden dan voorzien door het IPCC, zijn er geen gronden om te twijfelen aan de hoofdconclusies van het IPCC met betrekking tot het klimaatsysteem, gevolgen, kwetsbaarheid, en het tegengaan van en aanpassing aan klimaatverandering.
Bevindingen uit de wetenschap
De opwarming van de aarde gaat verder. Sinds 2000 zijn acht van de tien warmste jaren uit de geregistreerde geschiedenis van de temperatuur voorgekomen, hoewel de snelheid van de temperatuurstijging het laatste decennium aanzienlijk is afgenomen vergeleken met de gemiddelde stijging tussen 1975 en 2008. Recente publicaties laten zien dat dit komt door goed begrepen natuurlijke variaties.
De claim dat de wereldwijde opwarming is gestopt sinds 1998 is in tegenspraak met de lange termijn – observaties, die vergelijkbare schommelingen laten zien op overeenkomstige tijdschalen. Voor de lange termijn wordt verwacht dat de opwarming verder doorzet.
Volgens sommige zonne-fysici zou de zon een stadium van heel lage activiteit in kunnen gaan. De wereldwijde opwarming zou hierdoor de komende tientallen jaren met 0.2 °C kunnen worden afgeremd, maar de lange-termijn projecties van opwarming van IPCC 2007 blijven ongewijzigd.
IPCC heeft in 2007 vastgesteld dat het opwarmen van de aarde sinds het midden van de 20e eeuw zeer
waarschijnlijk veroorzaakt is door de invloed van de mens op het wereldwijde klimaat. Deze conclusie is nog steeds robuust, ook met in achtneming van de ‘peer reviewed’ wetenschappelijke literatuur die deze relatie in twijfel trekt.
Groenland en Antarctica neigen meer ijs te verliezen dan het IPCC AR4 aangeeft. Waarnemingen in de periode van 2002 tot 2009 laten zien dat het afname van ijsmassa’s op beide continenten versnellen. Dit betekent dat de bijdrage van landijs aan de zeespiegelstijging aan het toenemen is. De hoogste schatting voor de zeespiegelstijging in 2100
ten opzichte van 1990 is hoger (0.55-1.1 meter) dan het IPCC AR4 vermeldt (0.25-0.76 meter) .Voor Nederland betekent dit een stijging van 0.40 - 1.05 meter in 2100. Het zee-ijs in het Noordpoolgebied trekt zich veel sneller
terug en wordt veel dunner dan aangegeven in het IPCC AR4.
De opname van CO2 door land en zee neemt relatief af;
vergeleken met 1990 zijn de ‘sinks’ (opnamereservoirs) van de biosfeer en oceanen min of meer stabiel gebleven in de periode 2000-2007, maar de CO2 uitstoot van fossiele
brandstoffen is sterk toegenomen. Daarom neemt het relatieve aandeel van deze emissies dat door de biosfeer en oceanen wordt opgenomen af.
Veranderingen in grootschalige ecosystemen ten gevolge van klimaatverandering worden steeds zichtbaarder, maar gebrek aan gegevens en monitoring beperken een systematische evaluatie.
Koraalriffen worden ernstig bedreigd door verzuring van de oceanen en de toename van de temperatuur. De wereldwijde groei van broeikasgas-emissies nam
sterk toe tussen 2000 en 2004 vergeleken met de jaren
Samenvatting
Het Vierde Assessment Report van het IPCC van 2007 (AR4) biedt thans nog steeds een stevige wetenschappelijke basis voor het maken van klimaatbeleid. Er zijn echter risico’s dat
klimaatverandering sneller kan verlopen – of ernstiger gevolgen kan hebben – dan verwacht. Daarom wordt aanbevolen om meer inspanningen te plegen op het gebied van klimaatmonitoring en te beleidsopties te onderzoeken hoe met deze risico’s om te gaan.
negentig, maar liet daarna een opmerkelijke daling zien. Dit komt voor een deel door mitigatie-maatregelen. De economische crisis zal naar verwachting leiden tot een afname van de CO2 emissies van 3 %, in 2009 ten opzichte
van 2008.
Deze studie herbevestigt de conclusies van IPCC 2007 dat de wereldwijde mitigatie-potentiëlen voldoende zijn om de verwachte groei in emissies de komende tientallen jaren te kunnen compenseren, of de emissies zelfs terug te dringen tot onder de huidige niveaus. In 2030 zijn reducties van 20 tot 50 % mogelijk met maatregelen tegen kosten tot100 dollar per vermeden ton CO2 ten opzichte van een situatie
zonder die maatregelen.
Het 2 oC doel vereist dat de piek van de wereldwijde
broeikasgas-emissies niet later optreedt dan rond 2020. In het IPCC AR4 rapport, werd geschat dat deze piek tussen 2000 en 2015 zou moeten optreden. Nieuwe lage-stabilisatie scenario’s komen uit op een periode tussen 2010 en 2020.
Het risico van overschatting of onderschatting van
toekomstige klimaatverandering
Het is het meest waarschijnlijk dat een verdubbeling van de CO2 concentratie sinds het pre-industriële tijdperk zal leiden
tot een wereldgemiddelde toename in de temperatuur van 3
oC.
De kans bestaat dat dit cijfer lager uitvalt en dat de toekomstige, door de mens veroorzaakte opwarming langzamer zal plaatsvinden dan voorzien door het IPCC. In dat geval zullen de negatieve gevolgen kleiner zijn dan waar de beleidsreacties van uit gaan.
De kans is echter groter dat dit cijfer hoger zal uitvallen dan 3 oC omdat er verschillende mechanismen zijn die
opwarming van de aarde kunnen versnellen. De kans op een onderschatting van de toekomstige opwarming is dus groter dan die van een overschatting.
Verkenning van beleidsreacties op versnelde
klimaatverandering
Verdere analyse toont aan dat er inderdaad risico’s van versnelde klimaatverandering zijn die niet volledig in beschouwing zijn genomen door het IPCC AR4, en dat er nu meer aandacht in de literatuur wordt gegeven aan mogelijk onomkeerbare processen. De literatuur noemt ‘tipping points’(kantelpunten) - in dit rapport omschreven als ‘eventualiteiten’ - zoals het snel ontsnappen van methaan van de zeebodem, en de afbraak van de West-Antarctische ijskap en het Amazone regenwoud. Deze processen kunnen zeer grote gevolgen hebben en houden een aanzienlijk risico in, zowel wereldwijd als plaatselijk, zelfs als het minder waarschijnlijk is dat zij zullen optreden. In het algemeen houden de beleidsmaatregelen zoals ingevoerd en/of voorgesteld onder het VN-Klimaatverdrag, of in nationale programma’s, niet expliciet rekening met deze risico’s. De studie verkent beleidsmaatregelen die een mogelijk antwoord zouden kunnen geven op snelle klimaatverandering:
versnelde vermindering van de broeikasgas-uitstoot (mitigatie), ‘geo-engineering’, en intensievere adaptatie. Het denken over beleidsmaatregelen om ons tegen deze risico’s in te dekken staat in het algemeen nog in de kinderschoenen. Versnelde mitigatie heeft zijn grenzen wat betreft de sociale aanvaardbaarheid, en ook wat betreft de tijd die nodig is om kapitaalgoederen te vervangen en infrastructurele veranderingen aan te brengen. Sommige ‘geo-engineering’ opties, zoals tegenhouden van de zonnestraling door aërosolen (kleine deeltjes) in de stratosfeer te injecteren op groter schaal, zouden kunnen worden gezien als een goedkope ‘noodkoeling’ terwijl er gelijktijdig nieuwe en onbekende risico’s in het klimaatsysteem van de aarde worden geïntroduceerd. Nood-adaptatie maatregelen zijn de laatste oplossing maar ook deze hebben beperkingen die vandaag nog grotendeels onbekend zijn.
Aanbevelingen
Op grond van deze eerste verkenningen en bevindingen in dit rapport bevelen de auteurs het volgende aan:
Signalen proberen op te sporen die vroegtijdig kunnen waarschuwen voor ‘tipping points’, en ontwikkelen en verbeteren van monitoring systemen die nodig zijn om die signalen vast te kunnen stellen.
Verder uitzoeken van beleidsopties voor het omgaan met de risico’s van versnelde klimaatverandering, daarbij inbegrepen de aspecten van tijdigheid, effectiviteit, en bestuur op nationale en internationale schaal. Een dergelijke analyse moet ook ingaan op de mogelijke strategieën met betrekking tot ‘geo-engineering’.
Nederland is met het nationale adaptatiebeleid voldoende ingedekt tegen de risico’s van extreme zeespiegelstijging en overstromingen door rivieren, maar het wordt
aanbevolen om ook de gevolgen voor de volksgezondheid, landbouw en natuur te onderzoeken en de mogelijkheden van beleidsmaatregelen in geval van versnelde of extreme klimaatverandering.
Introduction 11 After the publication of the Fourth Assessment Report
(AR4) of the IPCC in 2007, a large number of new scientific publications on climate science have appeared. Several publications mention a possible acceleration of the melting of sea ice, a faster increase in CO2 emissions, compared to
the most extreme IPCC scenarios, and ‘tipping points’ in the climate system leading to globally or regionally irreversible changes. However, other publications claim that global warming is slowing down, and suggest a possible global cooling in the future. Some of these publications have had a lot of attention, either from the scientific community or in the media. Scientists and NGOs have raised the question of whether the Fourth Assessment Report of the IPCC is still up to date, which has raised concerns under policymakers who have to take decisions at the upcoming UN Climate Summit in Copenhagen, in December of this year. The European Union requested that the IPCC (Bali 2007) would prepare an update for the Copenhagen summit, but the IPCC declined, because the time span was too short. The next assessment reports of the IPCC will appear in 2013 and 2014, while crucial decisions have to be taken much earlier, at the Copenhagen meeting. These concerns also surfaced in the Dutch Parliament, in 2008. Questions were asked of the Dutch Environment Minister, Mrs Jacqueline Cramer, of how to deal with extreme climate change that might go beyond the careful conclusions of the IPCC AR4 report 2007. In response, Mrs Cramer requested the Netherlands Environmental Assessment Agency (PBL) to evaluate new scientific insights regarding the IPCC conclusions of 2007, to provide views on possible
acceleration of climate change, and analyse policy response options. To this end, PBL formed a consortium of scientific institutions. This consortium evaluated a selection of scientific news on selected topics in the areas of the climate system, impacts and vulnerability, and mitigation. The topics were selected on the basis of either being key to the development of climate science and/or receiving broad societal and media attention.
This report is, by no means, intended as a comprehensive assessment of all areas covered by the IPCC (Chapter 2) and has several limitations: it was not able address the huge flow of literature on mitigation, adaptation, finance and technology (peer-reviewed and grey literature) that has become available in the lead-up to the Copenhagen climate summit, because of constraints on time and resources. It does address key messages from the IPCC AR4 report on emissions, emission reduction potentials and costs, and low stabilisation scenarios.
In addition to the scientific assessment part in Chapter 2, developments are discussed that may cause – or be perceived as – extreme climate change. Aspects, such as impacts, timing, likelihood, and the ‘level of scientific understanding’ are discussed in Chapter 3.
Building on the previous chapters, the policy implications of extreme climate change scenarios are explored, including ‘crash’ emission reductions, emergency adaptation, and geoengineering options (Chapter 4).
Introduction
1
Annex 1 contains a list of authors and acknowledgements. Annex 2 contains a full list of literature references, grouped according to the chapters and sections to this report. A version of the report without this very lengthy annex is also available from the Internet.
This study is largely based on background documents covering an evaluation of over a 1000 scientific articles (most of them peer reviewed). These background reports, which have under-gone external review by selected experts, are available from the following websites:
http://www.knmi.nl/samenw/cop15/News_in_climate_ science_physical_basis.pdf (background to section 2.1) http://www.knmi.nl/samenw/cop15/Exploring_the_ boundaries_of_climate_change.pdf (background to chapter 3) http://www.ess.wur.nl/UK/newsagenda/news/policy_ options_to_respond_to_rapid_climate_change (background to chapter 4)
News in climate science since the IPCC Fourth Assessment Report 2007 13
2.1 The global climate system
2.1.1 Introduction
This chapter has been based on peer-reviewed literature, between 2006 and September 2009. In addition, peer-reviewed scientific literature has been assessed in which doubts are expressed on the importance of human influence on global warming. No reasons were found to deviate from the finding of the IPCC in 2007, that global warming since the middle of the 20th century is very likely to be due to human influence on the global climate1. The selected topics are:
decadal variability: past and future (Section 2.1.2); sea level rise, ice sheets, glaciers, and sea ice (Section 2.1.3); climate changes due to solar variability (Section 2.1.4); the carbon cycle (Section 2.1.5); and climate sensitivity and feedbacks (Section 2.1.6).
2.1.2 Decadal variability: past and future
Claims that global warming has stopped since 1998, are at odds with long-term observations.
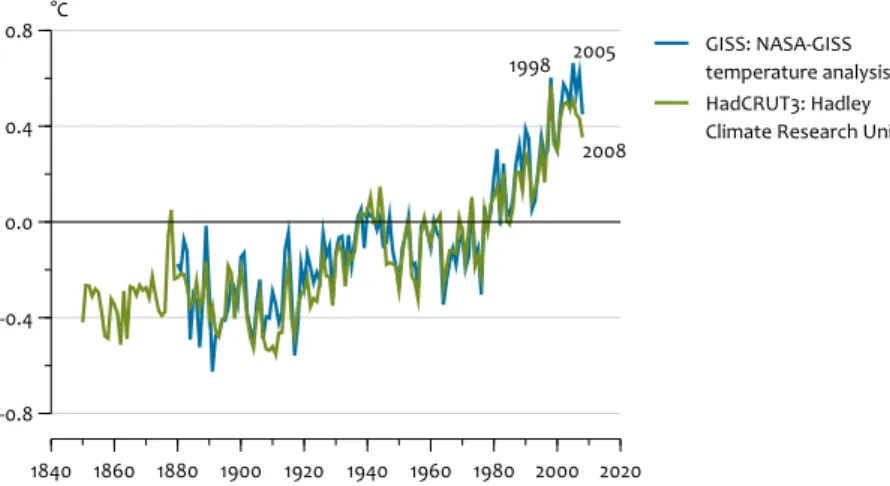
Eight of the ten warmest years in recorded history have occurred since 2000. The observed global mean temperature trend in the period from 1975 to 2008 was 0.17±0.03 °C per decade, or 0.20±0.04 °C per decade, depending on the data set used. The calculated trends for the 1998-2008 period range from -0.02±0.09/decade (based on CRU-data, see Figure 2.1) to 0.12±0.12 °C per decade (based on data from NASA, see Figure 2.1). The recent trend is significantly lower than the long-term trend over the last three decades, for several reasons. This period starts with a strong El Niño in 1998, increasing global temperature with approximately 0.25 °C, and ended with a significant La Niña in 2008, lowering temperature with approximately 0.15°C. Moreover, the land 1 ‘There is very high confidence that the net effect of human activities since
1750 has been one of warming. Most of the observed increase in global average
temperatures since the mid 20th century is very likely due to the observed increase in anthropogenic GHG concentrations. It is likely that there has been significant anthropogenic warming over the past 50 years, averaged over each continent (except Antarctica)’, IPCC Fourth Assessment Synthesis Report 2007.
temperature trend continued unabatedly upwards, while the reconstructed ocean surface temperatures showed a slowdown – for example, in the Southern Ocean, a region with downward trends over the last 11 years. The CRU data have incomplete coverage, with large gaps in the Arctic. The NASA data provides a more complete representation of the Arctic, by taking spatial correlation into account through extrapolating and interpolating in space. The NASA representation suggests the greatest increases in temperature in the Arctic, in the last decade. This difference between CRU and NASA data is the main cause for the difference in trend of the last ten years.
The observed temperature trend in Western Europe, over the last decades, appears about two times higher than the global average. It is suggested that both regional feedbacks and decreased aerosol loading of the atmosphere have played a role.
Since the IPCC AR4, the scientific community has put much effort into investigating the underlying causes of regional climate change, which are of the utmost importance for regional projections. Apart from the relation with global average climate change, the search has been for regional feedbacks amplifying or attenuating the change. In Western Europe, the observed temperature trend over the last decades appears much higher than the global average, by about a factor of two. In winter and spring, higher temperatures are caused by changes in atmospheric circulation, tending to more westerlies in the observations than was calculated by the models. In spring and summer, there is an increase in the amount of solar radiation that reaches the ground, partly due to lower aerosol concentrations. This is underrepresented by state-of-the-art GCMs.
The relatively fast near-surface warming of the Arctic, the ‘Arctic amplification’, due to the well-known surface-albedo feedback, might also be reinforced by changes in atmospheric heat transport into the Arctic surface.
The near-surface warming of the Arctic was almost twice as high as the global average, over the past decades. A recent study examined the vertical structure of temperature change
News in climate science
since the IPCC Fourth
in the Arctic during the late twentieth century, using reanalysis data, and found evidence for temperature amplification well above the surface. Therefore, it was concluded that part of the Arctic temperature amplification cannot be linked to the surface-albedo feedback mechanism, and that changes in atmospheric heat transport into the Arctic surface, in the summer half-year, may be an important cause.
In contrast to the conclusion of the IPCC AR4 that Antarctica was the only continent where no evident global warming had been observed, a recent study concluded that the trend in average surface temperature in both West and East Antarctica were positive for 1957 to 2006.
Also, the average warming of the Antarctic continent is comparable to that in the Southern Hemisphere as a whole. However, the sparseness and short time span of the observations hamper the conclusion of this study. In particular, the extent to which circulation changes in the Southern Hemisphere play a role in temperature trends over Antarctica is still a matter of scientific debate.
Although, since the IPCC AR4, the first steps have been taken in making model-based decadal predictions of forced and natural climate change, this development is still in its infancy. To produce decadal predictions it is essential that climate models are initialised with the best estimates of the current observed state of the atmosphere, oceans, cryosphere, and land surface. Extended hindcast experiments show the feasibility of decadal predictions. However, future prospects of decadal predictability depend crucially on improved models and data, such as the ARGO network: a network of 3000 drifting buoys, observing the ocean in three dimensions.
For the next few years, expectations with respect to the average global temperature increase have not changed much. The year 2009 is expected to be warmer than 2008. If the sun is entering a stage of very low activity, global temperature increase due to anthropogenic greenhouse gas emissions might be tempered by probably 0.2 °C, within two or three decades.
This coming winter is predicted to see the re-emergence of El Niño, thus, one would expect 2009 to be warmer than 2008. For the coming decades, projected rising levels of greenhouse gases, as well as the behavior of solar activity, are important. The best estimate of the effect of anthropogenic influence is 0.2 °C per decade (IPCC, 2007). If predictions by some solar physicists that the sun is entering a stage of very low activity, for a period of two to seven decades, become reality, global temperature increases might be tempered by about 0.2 °C, within two or three decades ( see also Section 2.1.4). However, after recovery of solar activity, the temperature increase will be accelerated, as anthropogenic and solar forcing will both point in the direction of global warming. In case of a ‘normal’ solar behavior, the global temperature rise will be influenced by an approximate 11-year fluctuation of the order of 0.05 °C. These projections may alter due to natural internal factors, such as volcanic eruptions and El Niño events. 2.1.3 Sea level rise, ice sheets, glaciers, and sea ice
Since the IPCC AR4, many studies have been published concerning the various contributions to sea level rise, as an important aspect of climate change, in terms of impact on society.
For the 1961-2003 period, the global sea level rise budget due to melting land ice is still not closed; in the IPCC AR4 it is stated that the explained (attributed) sea level rise is 0.7 mm/ yr less than the observed sea level rise.
Temperature anomalies compared to 1961 to 1990 average, according to the Hadley Centre (Met Office)/Climate Research Unit (HadCRUT3) and NASA Goddard Institute for Space Studies (GISS). The CRUT3 data on land have incomplete coverage, with large gaps in the Arctic. The NASA data provides a more complete representation of the Arctic, which has warmed rapidly, especially over the last decade. This largely explains the significant differences between the data sets of the past 10 years.
Figure 2.1 1840 1860 1880 1900 1920 1940 1960 1980 2000 2020 -0.8 -0.4 0.0 0.4 0.8 °C GISS: NASA-GISS temperature analysis HadCRUT3: Hadley Climate Research Unit
Global temperature anomalies compared to 1961-1990 average
1998 2005
News in climate science since the IPCC Fourth Assessment Report 2007 15
There is a tendency towards a larger Greenland and Antarctic loss of ice mass than presented in the IPCC AR4 report. The emerging picture is that we have moved from a more or less steady ice mass, towards conditions of significant retreat, for both the Greenland and Antarctic ice sheets.
Current mass changes in Antarctica are dominated by the retreat of specific basins in West Antarctica. The rapid retreat along the south-eastern side of Greenland, reported in the IPCC AR4 report, has stopped; nevertheless, the total mass loss in Greenland has increased. The lubrication effect (i.e. meltwater increasing the ice flow velocity) is more widespread than previously assumed, but probably not important for the contribution to sea level rise from the Greenland ice sheet. Current estimates of the contributions from both Greenland and Antarctica are 0.5 mm/yr each and, according to observations in the period 2002 to 2009, are accelerating over time. These contributions are much higher than presented in the IPCC AR4 report, which estimated a sea level drop, in future scenarios, due to changes in Antarctica. There is no convincing evidence to adjust estimates of the contributions of small glaciers to global sea level rise. Data of ocean heat content have been updated and reanalysed: the heat content has increased in the 1969-2003 period, and reached a plateau in 2004 to 2008, rather than displaying an earlier reported period of cooling.
The heat content in the upper 700m has increased over the period from 1969 to 2003, by 0.24 to 0.41 x 10²² J/year. The earlier reported cooling in the 2004-2008 period has been assigned to two systematic biases in the ocean temperature data used. There is no convincing evidence to adjust
estimates on the contribution of thermal expansion to global sea level rise.
For 2100, a plausible and physically-based high-end projection for average global sea level rise is higher than the global estimates reported by the IPCC AR4, being 0.25 to 0.76 metres (for the A1FI scenario), relative to 1990 levels, versus 0.55 to 1.1 metres, implying a rise along the Dutch coast of 0.40 to 1.05 metres.
These estimates are higher than those reported by the IPCC AR4, but lower than estimates on the rate of sea level rise during the Last Interglacial stage, of up to 1.4 to 1.9 metres per century. From the paleo climatological evidence, it is known that the rate of sea level rise can be much more than a metre per century, during periods with similar amounts of ice on Earth and temperatures around what might be expected for the near future. However, it is unclear to which extent this can be attributed to enhanced solar radiation in the Northern Hemisphere summers and to higher temperatures, both in combination with changed heat transports.
Sea ice retreat and thinning in the Arctic continue much faster than reported in the IPCC AR4.
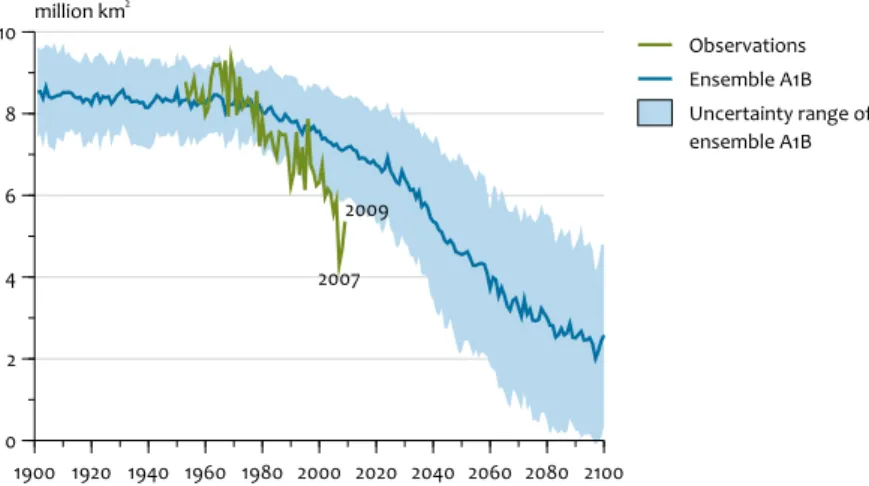
Arctic ice coverage in the summer of 2007 reached a record minimum, with the ice surface area extent declining by 42%, compared to the average of the 1979-2000 period (see Figure 2.2). In 2008, the ice extent was slightly larger than in 2007, but still 34% below this average. In 2009, the ice extent was 690,000 square kilometres larger than the second-lowest extent in 2008, but still 1.68 million square kilometres below the 1979-2000 September average (in September the ice extent is at its minimum). Since 1979, the Arctic sea ice extent has been declining at a rate of 11 per cent, per decade. Not only did the ice extent reduce but so did the average thickness of the sea ice, which decreased strongly, increasing the vulnerability for further changes. The oldest ice has essentially disappeared, and 58% of the Multi-Year Ice (MYI) now consists of relatively young two- and three-year-old ice, compared to 35% in the middle of the 1980s. In addition, submarine sonar measurements (covering the central ~38% of the Arctic Ocean), showed an overall average winter ice thickness of 1.9 metres, in 2008, compared to 3.6 metres in 1980. Changes in
Minimum Arctic Sea Ice extent. Observations (green) vs. the average according to models using an ‘average’ SRES scenario (A1B) and their uncertainty ranges, as reported in the IPCC AR4. Sea ice retreat and thinning in the Arctic continue much faster than in the IPCC range.
Figure 2.2 1900 1920 1940 1960 1980 2000 2020 2040 2060 2080 2100 0 2 4 6 8 10 million km 2 Observations Ensemble A1B Uncertainty range of ensemble A1B
Minimum arctic ice extent
2007 2009
atmospheric and ocean circulation increased the vulnerability of the sea ice, over the last ten years. Changing atmospheric patterns, such as the NAO circulation, would probably affect the sea ice in the Arctic, implying the possibility of a partial recovery over the next years, although this might be negated by the effect of increasing temperatures.
2.1.4 Climate changes due to solar variability
Recent studies either confirm or do not convincingly reject the conclusion (as stated in the IPCC AR4 report) that for the period from 1950 to 2005, it is very unlikely that solar radiation has had a significant warming effect.
Claims that heat radiated from the sun could account for more than 50% of the increase in the Earth’s average temperatures, since 1950, are at odds with observations. The 11-year solar activity cycle is poorly correlated with temperatures, and plays a minor role, of the order of a few hundredth of a degree.
There are many ambiguities still to be resolved regarding the mechanism of cosmic rays - cloud cover variations due to solar (magnetic) activity.
Firstly, observations do not show clear connections between changes in cosmic rays and cloud amounts. For instance, there is no 11-year cycle in cloud amount, as seen in satellite measurements. Several studies focused on observations of clouds after sudden decreases in cosmic rays. Conclusions from these studies are quite diverse, ranging from no significant effects, to a 7% change in cloud liquid water about a week after the strongest events. Secondly, the transition between the ultra fine particles provided by cosmic rays and actual cloud condensation nuclei (CCN), is still a missing link. From a recent model perspective, the conclusion is that the hypothesised cosmic ray effect on CCN is too small to play a significant role in current climate change. Also, there is scientific debate about the altitude at which cosmic rays are potentially most effective in producing CCN. This is important with respect to the effects on the radiation balance: increasing low cloud formation acts as a cooling
factor of climate, whereas increasing high cloud formation has the opposite effect. In some recent studies, model simulations of aerosol nucleation under various atmospheric conditions point to the potential role of electrical charge for aerosol nucleation. The upper tropical troposphere is found to be a favored region for the production of CCN. This would make the total solar effect over the 11-year sunspot cycle weaker, or even at odds with the observations, in case of a very strong effect on high clouds. A few studies hypothesised the aa-index, a measure of the Earth’s magnetic field, or derivatives to be potentially important for variations in global average temperature, but the physical explanations for this influence remain unclear. Moreover, the correlations found in the studies considered are either questionable, or based on erroneous assumptions.
The present solar minimum is characterised as very deep. In case of a quiet sun for decades (such as the Maunder Minimum or Dalton Minimum) this might be important to the temperature projections for the coming decades, that is, a solar induced cooling of the order of 0.2 ºC, within two to three decades.
The total solar irradiance (TSI) value of 1365.3 Wm-2 in the recent solar minimum (2008) has dropped 0.25 Wm-2 below the solar minimum of 1996, and 0.3 Wm-2 below the minimum of 1986 (i.e. both of the order of 0.02%), indicating that we are experiencing a very deep solar minimum (see Figure 2.3). This decrease in TSI is four times smaller than the change between solar maximum and solar minimum conditions. However, a long lasting period of solar inactivity, comparable to the Maunder Minimum, may result in a tempering of the projected warming, that is, a solar induced cooling of the order of 0.20 °C (and 0.4 °C as a maximum estimate) within two to three decades on top of the warming of 0.20 °C per decade induced by human influence. After recovery of solar activity, the temperature increase will be accelerated, as anthropogenic and solar forcing will both point in the direction of global warming.
Total Solar Irradiance (TSI) from 1979 to 2009. We are experiencing a very deep solar minimum. This may result in a solar induced cooling of 0.2 °C (max. 0.4 °C) within 20 to 30 years.
Figure 2.3 1978 1982 1986 1990 1994 1998 2002 2006 2010 1364 1365 1366 1367 1368 W/m 2
News in climate science since the IPCC Fourth Assessment Report 2007 17
2.1.5 The Carbon Cycle
Since the IPCC AR4, there is a better understanding of the current land and ocean carbon budgets. The regional top down and bottom up estimates of the budgets are showing improved closure.
Often contradictory results were found when comparing estimates of biospheric uptake from measurements in forests and grasslands on a regional scale, with estimates inferred from atmospheric CO2, the latter being known as the ‘inverse’
approach. The two approaches are closer together, indicating improved ability to verify the real input of GHG into the atmosphere.
Although old growth and tropical forests seem to take up more carbon than previously thought, there are indications that the airborne fraction of CO2 emissions is increasing,
which could indicate a declining sink strength of the ocean and/or the land.
Tropical ecosystems and old growth forests in both the tropics and the Northern Hemisphere may currently be strong sinks for CO2, but the net terrestrial uptake in the Northern
Hemisphere appears to play a smaller role than previously thought. Also, a drop in carbon uptake of the Southern Ocean and the Atlantic has been observed, but this could be due to long-term variability. Human-induced climate change may play a role in the Southern Ocean, where the poleward displacement and intensification of westerly winds, has enhanced the ventilation of carbon-rich waters, normally, isolated from the atmosphere, at least since 1980. Compared to the 1990s, on a global level, natural land and ocean CO2 sinks and land-use change emissions have
remained more or less stable during the 2000-2007 period (see Table 2.1). However, emissions of fossil fuels have grown strongly and, therefore, the fraction of emissions being sequestered by the biosphere and the ocean is declining. With respect to the future, model results show a cumulative net land carbon uptake over the 21st century, but the uncertainty range remains large.
After a decade of no growth in methane (CH4) concentration, in 2007 and 2008, the concentration increased again. This is probably due to increased emissions from Northern Hemispheric sources, such as wetlands. It has been suggested that a large unknown source exists of methane from dry plants, but this has been disproved.
Large-scale fires and droughts, for instance, in Amazonia, but also at northern latitudes, can lead to significant decreases in carbon uptake.
On land, a number of major droughts and fires in middle-latitude regions, between 2002 and 2005, appear to have contributed to a decrease in the terrestrial carbon sinks in these regions, over that period. The strong non-linear relation between droughts and fires and carbon emissions and deforestation, highlights a climate-carbon feedback that may lead to higher CO2 concentrations if droughts become more
frequent in the future.
There is growing evidence that increased nitrogen availability may be responsible for part of the current terrestrial sink. Since the industrialisation, N deposition has increased, particularly in the eastern United States, Europe, and in South and East Asia. There is growing evidence that this increase may also be responsible for maintaining at least part of the current terrestrial sink. However, recent modelling studies of coupled C and N cycles suggest that the likelihood of greatly enhanced global CO2 sequestration resulting from future
changes in N deposition, is low. Even if N emissions were to follow the more pessimistic IPCC emission scenarios, these models show a decline in the terrestrial sink, compared to models that have no N cycle.
The amount of carbon stored in permafrost areas might be up to two times larger than previously thought.
A recent study shows that accounting for C stored deep in the permafrost, more than doubles previous high-latitude inventory estimates of carbon stocks, and puts the permafrost carbon stock at an equivalent of twice the atmospheric C pool. Also, it is shown that the losses over several decades negate increased plant carbon uptake at rates that could make permafrost a large biospheric carbon source in a warmer world, at an amount of around 1 Pg C/year.
The global carbon budget
1980s 1990s 2000-2005 2000-2007 Atmosphere 3.3 ± 0.1 3.2 ± 0.1 4.1 ± 0.1 4.2 ± 0.04 Fossil Fuels 5.4 ± 0.3 6.4 ± 0.4 7.2 ± 0.3 7.5 ± 0.4 Ocean -1.8 ± 0.8 -2.2 ± 0.4 -2.2 ± 0.5 -2.3 ± 0.4 Biosphere -0.3 ± 0.9 -1.0 ± 0.6 -0.9 ± 0.6 -1.1 ± 0.7 Sum 0 0 0 -0.1 Partitioning Biosphere: Land Use 1.4 (0.4 to 2.3) (0.5 to 2.7)1.6 N/A 1.5 ± 0.5 Land Sink -1.7 (-3.4 to 0.2) (-4.3 to -0.9)-2.6 N/A -2.6 ± 0.7 Uptake 65% 75% N/A 65%
The global C-budget in the IPCC AR4 (Columns 1980s, 1990s and 2000-2005) and according to the Global Carbon Project (last column). Unit is Gt C. The last row indicates the relative uptake by the land and the ocean, compared to fossil fuel emissions. (N/A = not available.)
Preservation of existing marine ecosystems could require a CO2 stabilisation of as low as 450 ppmv.
Recent studies review available databases on regions, ecosystems, groups of organisms, and physiological processes believed to be most vulnerable to ocean acidification. They have concluded that ocean acidification (also see Chapter 3) and the synergistic impacts of other anthropogenic stressors provide great potential for widespread changes to marine ecosystems, and preservation of existing marine ecosystems could require a CO2 stabilisation level that is lower than what
might be chosen based on climate considerations alone. 2.1.6 Climate sensitivity
Recent studies that use information in a relatively complete manner, generally, confirm the likely range (66%) of the climate sensitivity to be between 2 and 4.5 °C, given by the IPCC AR4.
Since the IPCC AR4, the discussion concerning climate sensitivity has been focused on how to merge the constraints of various observations and how to deal with the uncertainty in total radiative forcing, mainly due to aerosol and solar forcing. With respect to combining different lines of evidence, the dependency of methods used is crucial for the determination of the likely range of climate sensitivity. Also, climate sensitivity may be time-dependent or state-dependent due to the fact that (some) feedbacks do not linearly scale with temperature. For example, in a much warmer world with little snow and ice, the ice surface albedo feedback would be different from that of today.
While a climate sensitivity below 1.5 °C is physically extremely unlikely, high values exceeding 6 °C cannot be excluded by the comparison of models with observations.
Due to the essentially skewed distribution, the probability that climate sensitivity is underestimated, compared to the
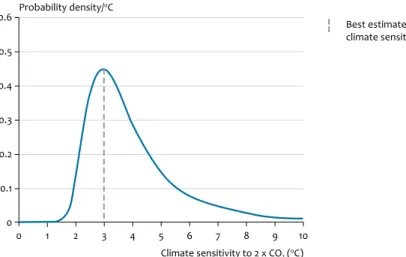
best estimate of 3 °C, is larger than that the sensitivity is overestimated (see Figure 2.4). In general, an upper bound of climate sensitivity is difficult to assess, but studies rarely assign a high probability to values in excess of 10 °C, and they generally point to a maximum likelihood value of well within the consensus range of IPCC AR4. Studies that suggest very low climate sensitivity values, use erroneous forcing assumptions, neglect internal climate variability, use overly simplified assumptions, neglect uncertainties, or have other errors in the analysis or dataset, or a combination of these. Slow feedbacks may be insufficiently incorporated in climate models. Paleo data suggest that, by including these feedbacks, the climate system may be twice as sensitive as our present ‘best estimate’ at the very long term, that is, the millennium timescale and beyond.
Paleo data (i.e. data covering the past millions of years) suggest that equilibrium sensitivity, including slower feedbacks, such as ice albedo, vegetation migration and the release of greenhouse gases from soils, tundra or ocean sediments, is ~6 °C for doubled CO2, for the range of climate
states between glacial conditions and an ice-free Antarctica. However, the determination of climate sensitivity from these data is based on the assumption that all additional changes in temperature are linearly related to CO2 changes,
implying constant feedback factors independent of the climate state (for example, the amount of ice on Earth). It is also hypothesised that the strengths of fast feedbacks, such as atmospheric water vapour content, lapse rate (i.e the temperature decrease with the altitude in the lower part of the atmosphere), and clouds decreased during the last glacial maximum, compared to present conditions. In addition, it is known from ice core data that the dust (aerosol) amount is higher in glacial conditions, creating an additional cooling. Uncertainty in this cooling effect hampers accurate estimates of the climate sensitivity. Either a large aerosol
Stylised probable distribution of climate sensitivity, based on the analysis of Roe and Baker (Why is climate sensitiv-ity so unpredictable?, Science, 318, 629–632, 2007). The best estimate of climate sensitivsensitiv-ity in this analysis is a rise of 3 oC due to a doubling of the CO2 concentration, compared tot the pre-industrial level. As the graph shows, the area to the left of the dotted line is smaller than the area on the right. In other words, the probability that the climate sensitivity is underestimated, compared to the best estimate of 3 °C, is larger than that the sensitivity is overestimated, due to the skewed form of the distribution.
Figure 2.4 Climate sensitivity
0 1 2 3 4 5 6 7 8 9 10
Climate sensitivity to 2 x CO2 (oC) 0 0.1 0.2 0.3 0.4 0.5 0.6 Probability density/ oC Best estimate of climate sensitivity
News in climate science since the IPCC Fourth Assessment Report 2007 19 forcing or weaker fast feedbacks would imply a reduction in
climate sensitivity, that is, less than twice the best estimate in the IPCC AR4. Understanding the role of aerosols either as a forcing or as a feedback factor is crucial in reducing the uncertainty in climate sensitivity derived from observations.
2.2 Impacts and vulnerability to climate change
The IPCC Fourth Assessment Report for Working Group II on Climate Change Impacts, Vulnerability and Adaptation addressed three main topics: (a) observed impacts (today), (b) anticipated (future) impacts and (c) adaptation options in response to climate change. Most of the observations used for the assessment were on terrestrial ecosystems, much less on fresh water, oceans and other vulnerable ecosystems. Also, the geographic distribution is skewed, as the largest body of evidence is collected in the Northern Hemisphere and industrialised countries in Europe and North America. Without any significant exception, new findings published from 2007 onwards, after the publication of the IPCC Fourth Assessment Report confirm or reinforce the main findings of the AR4’s 2nd Working Group on impacts and urgency of the problem. A selection of important developments since 2007, in the area of climate change impacts, vulnerability and adaptation, are as follows:Large-scale ecosystem changes are becoming more apparent, but lack of data and monitoring limit full systematic
assessment.
Scientists express growing concerns on changes in species, ecosystems and human and ecosystem health. Range shifts have been identified for European species, that is, birds, butterflies and lichens. In the Netherlands, range shifts have been observed in all species groups. With more studies appearing and data sets analysed, the signal of large-scale ecological changes in ecosystems is becoming more apparent. However, the identification of specific vulnerabilities across regions and, particularly, across EU27 and in the Netherlands, is mostly based on evidence from case studies. This
evidence is rarely substantiated by long-term data from field observations. The lack of systematic monitoring of impacts of climate change and the difficulties in attributing effects to climate change slightly limits scientific and systematic assessment of impacts and changes in vulnerability, ands their attribution to climate change. The body of evidence on the vulnerability of natural systems, however, has increased, and scientists now debate whether the objective to limit global warming to two degrees is sufficient to limit changes in ecosystems and avoid irreversible changes in the functioning of ecosystems and services that they provide.
The carbon storage capacity of forests and soils may decrease, in the future, due to changes in temperature, water availability and albedo.
Model analyses show a cumulative net land carbon uptake over the last century, and predict a net carbon uptake to continue during the 21st century. Meanwhile, the evidence is increasing that the carbon stores of boreal and forested ecosystems are more sensitive to climate change and changes in temperature and precipitation than considered in the AR4. This feedback may render more soil carbon to
enter the atmosphere. This would be the consequence of climate changes interacting with changes in snow cover and albedo (reflection of sun light). This effect is different from and adds to the sensitivity of carbon stores in forests and peat ecosystems to deforestation and excavation of peat. Despite these vulnerabilities, many publications still consider most forest soils to be a significant and robust carbon sinks, for decades to come. Protection and enhancing carbon sequestration in forests and other ecosystems remain effective means of sustaining the carbon stores in the organic peat soils and forests of the world.
Agriculture and food production is vulnerable due to many interacting factors.
New findings confirm the AR4 conclusion that potential crop production, in general, would be negatively affected across different regions of the world, as warming would increase beyond two degrees, and could be as negative as -30 to more than -80% for the Eastern United States. However, also without additional policies, farmers will adapt, as is indeed generally assumed in baseline scenarios. Researchers still debate on whether the residual negative impacts of climate change will remain problematic, or whether proper and timely application of new technology would allow for effective adaptation of agricultural production – at least in developed countries.
For developing countries, adaptation may be more
problematic. The recent food crisis illustrates the vulnerability of the food production system, in general, due to the combined and interacting effects of food shortages, climate influences, poorly aligned global policies, high energy prices, all aggravated by the economic crises and the emerging demand for bio-energy.
Coral Reefs are severely threatened by ocean acidification and increasing temperatures.
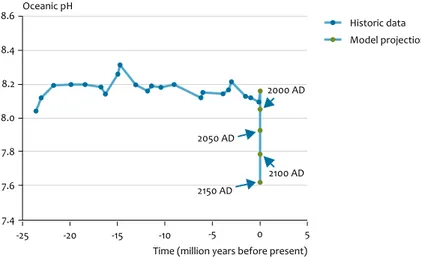
Ocean acidity has increased by 30% since the beginning of the Industrial Revolution. This rate of change is 100 times faster than any change in acidity as experienced before, on a timescale of a million years. This acidification is likely to impact ecosystem functioning through a reduced availability of dissolved calcium carbonates (i.e. Aragonite and Calcite) and changes in physiology of marine organisms. This limits carbon storage in oceans through changes in biological activities. These impacts have now been detected in several regions around the world. If the concentration of atmospheric CO2 continuous to increase at the current rate, the oceans
will acidify further. Scientists expect that, within decades, the chemistry of the tropical oceans will not sustain coral reef growth, while large parts of the polar oceans will become corrosive to calcareous marine organisms (see
Figure 2.5). Additionally, increasing temperatures of surface waters will lead to extensive coral bleaching and mortality. These far-reaching changes will impact food webs, biodiversity and fisheries.
2.3 Mitigation and stabilisation
2.3.1 Growth in global greenhouse gas emissions levels off after steep increase between 2000 and 2004. The Fourth Assessment Report shows greenhouse gas emission trends up to and including 2004. Global emissions increased with 70% in 2004, compared to 1970. The emission growth rate accelerated sharply from an average of 1.2% per year, between 1970 and 2000, to 3.2% per year, from 2000 to 2004. This has been attributed to causes including the increase of coal-fired power stations in China. This acceleration slowed down after 2004, to an average of 2.3% per year, until 2007. In 2008, the increase slowed down even further to 0.4% (Figure 2.6). For 2009, the IEA even expects a 3% decrease in global CO2 emissions. The very high oil prices
until the summer of 2008, together with the worldwide financial crisis that started to affect economic activities in the second half of 2008, have caused a halving of the annual increase in global emissions of carbon dioxide (CO2) from
fossil-fuel use and from cement production. In addition to high oil prices and the financial crisis, the increased use of new renewable energy sources, such as biofuels (0.3%) and wind energy for power generation, caused a noticeable mitigating impact on CO2 emissions. Moreover, if 2008 would
not have been a leap year with an extra day, emissions would have been even 0.3 to 0.4% lower.
For the first time in history, the share of global CO2 emissions
from developing countries, excluding deforestation, is slightly
On a geological timescale, ocean pH has been relatively stable. Recently, oceans have been acidifying fast. and are projected to be unprecedented since millions of years. The ‘pH’ is a measure of acidity – the lower the number the more acidification. Figure 2.5 Ocean acidification 8.6 8.4 8.2 8.0 7.8 7.6 7.4 -25 -20 -15 -10 -5 0 5 Oceanic pH
Time (million years before present) Source: Earth System Science Partnership, 2009.
2000 AD 2050 AD 2150 AD 2100 AD Historic data Model projections
The growth in global greenhouse gas emissions tends to slow down after the acceleration observed between 2000 and 2004. The CO2 emissions from developing countries (middle purple bands) are now larger than those from developed countries (lower blue and green bands).
Figure 2.6 1990 1994 1998 2002 2006 2010 0 10 20 30 40
50 Gt CO2 eq CO2 forest and peat fires
CO2 from postburn decay F-gases (HFCs, PFCs, SF6) N2O
CH4
CO2 International transport CO2 developing countries
Other non-Annex I Other large developing countries
China
CO2 developed countries Other Annex I-Economies In Transition Russian Federation Other Annex II Japan EU-15 USA
News in climate science since the IPCC Fourth Assessment Report 2007 21 higher (50.3%), than from industrialised countries (46.6%) and
international transport (3.2%), together.
2.3.2 CO2 emissions stay within the range of IPCC scenarios The sharp acceleration in global GHG emissions in the 2000-2004 period, has led to claims that global CO2 emissions are in
fact increasing faster than the ‘highest’ IPCC scenario used for IPCC 2007 (SRES A1FI scenario), due to increased coal use in large developing countries. However, more detailed analysis shows that global CO2 emissions are still within the range of
the IPCC SRES scenarios that have been used for the IPCC 2007 Report. Short-term trends historically have fluctuated around the long-term trends. Examples include the slow improvement in energy intensity in the period from 1960 to 1970 in Western Europe and the United States, and the slow emission increase by the end of the 1990s. Currently, the financial crisis again leads to a decrease in emissions (Figure 2.7).
2.3.3 Mitigation potentials in 2030 could at least offset growth in emissions
An important conclusion from AR4 is that there is enough economic GHG emission reduction potential to offset the projected emission growth, or even to reduce emissions below current levels, in the coming decades. More recent studies have confirmed this conclusion (Figure 2.8). On a sectoral scale, however, recent studies indicate that the AR4 has been conservative, with respect to the power and transport sectors, and optimistic for the building sector. The power and transport sectors in the AR4 did not include all reduction options. The estimate for the ‘energy supply’ sector in the AR4 did not include heat demand and supply, upstream emissions or reductions, and were slightly conservative in terms of reduction potentials. The emission reduction
estimate for the transport sector, in the AR4, did not include reductions in marine transport and medium and heavy-duty vehicles. In Figure 2.8, the results for the agriculture, forestry and waste sector are not shown separately, but are included in the total.
2.3.4 The 2 0C target requires a peaking of global
greenhouse gas emissions around 2020
Since the AR4, a large number of studies have been published, discussing scenarios that lead to low GHG concentration levels. Such levels are required to have a high probability of limiting the average global temperature increase to less than 2 °C above the pre-industrial level. The AR4 could only assess six scenarios from three publications that correspond to reaching the 2 °C target with more than a 50% probability. Today, there are 27 published scenarios available. The IMAGE and MESSAGE integrated assessment models looked into the technical possibilities of limiting atmospheric concentrations of all greenhouse gases combined to 450 ppm CO2 equivalent, by the end of the century. In the longer term, these scenarios aim for a concentration of 400 ppm CO2 equivalent. The MESSAGE scenarios reach a peak in global emissions between 2020 and 2030. These scenarios include bio-energy in combination with carbon capture and storage (CCS). This technology combination leads to net negative emissions (by first absorbing CO2 during biomass growth, and
next storing this underground), which would give some extra time for curbing global emissions. The IMAGE scenarios show more-or-less stable peak emissions in the 2015-2020 period. Also, other sources (ADAM, EMF-22) have strongly enriched the available information on low-mitigation scenarios since the AR4 scenarios have shifted the average peaking year for GHG emissions, for very low concentration scenarios, from between 2000 and 2015, as indicated in the AR4 report, to
Comparison between historic trends in CO2 emissions (CDIAC 2008) and the IPCC-SRES scenarios (van Vuuren en Riahi, 2008).. The coloured lines refer to four frequently used SRES scenarios. The blue area indicates the full range covered by all SRES scenarios.
Figure 2.7 1970 1990 2010 2030 2050 0 20 40 60 80 100 120 Gt CO2 Historic trend Uncertainty range from literature A1FI A1b B1 B2 Long term
Energy-related CO2 emissions, IPCC scenarios and historic trend
1990 1995 2000 2005 2010 2015 0 10 20 30 40 50 Gt CO2 Short term
generally between 2010 and 2020. The data are shown in Figure 2.9. For reaching a 2 °C target, the emissions would need to be more-or-less stable in the period between 2015 and 2020 and decline thereafter.
Emission reductions in percentage points, relative to the baseline, on a sectoral scale, at a marginal cost of 100 USD/ tonne (except for the McKinsey study that included costs of up to 60 euros/tonne) by 2030. The purple horizontal lines indicate the estimations from the IPCC AR4 report. The estimates for the sectors of agriculture, forestry and waste, are not shown, but are included in the total.
Figure 2.8
Power sector Building Industry Transport Total 0 20 40 60 80 100 % McKinsey ETP - ACT (2050) WS MESSAGE E3MG E3MGX AIM IMAGE ENV-Linkage BU - L BU - H
Emission reduction relative to baseline per sector, 2030
IPCC AR4
Emissions in the lowest IPCC category. The blue area depicts 15-85th interval of 27 scenarios that are published in the lowest IPCC category. ‘BECS’ refers to including Bio-energy and Carbon dioxide Capture and Storage. The numbers 2.6, 2.9 and 3.0 refer to the radiative forcing (W/m2) target for 2100.
Figure 2.9
Average 15-85th
interval of 27 scenarios that are published in lowest IPCC category
IMAGE 450 ppm CO2 eq (BECS) IMAGE 400 ppm CO2 eq (BECS) IMAGE 2.9 W/m2
MESSAGE 3.0 W/m2 (BECS) MESSAGE 2.6 W/m2 (BECS)
CO2 emissions from energy
Global emissions in lowest IPCC category
Total greenhouse gas emissions
2000 2020 2040 2060 2080 2100 -20 0 20 40 60 Gt CO2 2000 2020 2040 2060 2080 2100 -20 0 20 40 60 Gt CO2 eq
Exploring the boundaries of climate change 23 In the public debate on climate change and current literature,
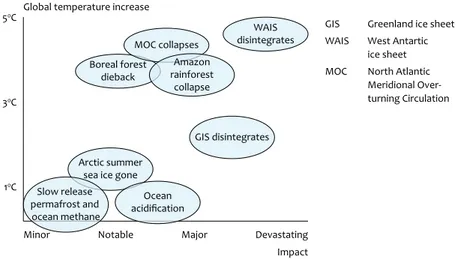
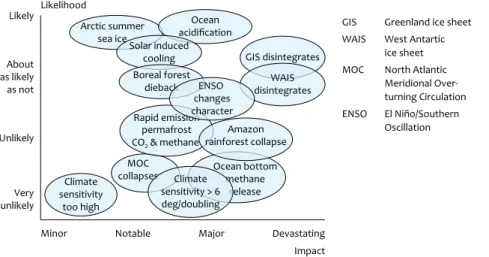
a number of possible climate events or developments are discussed that may cause – or be perceived to be – extreme climate change. Most of these climate eventualities – often referred to as ‘tipping points’ – have in common that there is limited knowledge on the physical mechanisms involved, as well as a lack of observational data. For this reason, these events are not or only briefly documented in the IPCC assessment reports: there is no scientific consensus. In this chapter, a review of scientific literature on a selection of thirteen of these climate eventualities is given, including an overview of their characteristics and possible impact. Aspects such as timing, likelihood and the ‘level of scientific understanding’ are discussed. A summary of the characteristics of each of the eventualities is given in Table 3.1. In Figure 3.1, the eventualities are presented according to the onset of background global warming, versus its impact. The
impact scale has subjective qualifications (‘minor’, ‘notable’, ‘major’ and ‘devastating’), which were assigned on the basis of the geographical scale (from ‘regional’ to ‘continental’ and ‘global’) and the character of the damages (‘light’, ‘moderate’, ‘heavy’ or ‘extreme’). It should be noted that the level of scientific understanding, as well as the understanding of possible impacts for most of these events is low, and the estimated numbers and qualifications, therefore, have large uncertainties that are not reflected in the figure.
At a temperature increase of above 2 °C, the Greenland Ice Sheet may melt, resulting in a sea level rise of 7 metres in 300 to 1000 years.
Figure 3.1 illustrates the notion that some of the
consequences of climate warming could be avoided, if global warming would be kept below 2 °C above pre-industrial levels. It is unclear whether, and how rapid, the Greenland Ice Sheet would disintegrate in a climate that is 2 °C warmer. Disappearance of GIS would probably result in a global
Exploring the
boundaries of
climate change
3
Temperature increase at which the various events could occur and an estimate of their impact. The shapes and sizes of the ovals do NOT represent uncertainties in impact and temperature onset of eventualities. These uncer-tainties may be significant.
Figure 3.1 Estimated global warming at which the onset of the events could occur versus impact
Minor Notable Major Devastating
Impact 1oC
3oC
5oC Global temperature increase
WAIS disintegrates MOC collapses Amazon rainforest collapse GIS disintegrates Arctic summer
sea ice gone Ocean acidification Slow release permafrost and ocean methane Boreal forest dieback
GIS Greenland ice sheet WAIS West Antartic
ice sheet MOC North Atlantic
Meridional Over-turning Circulation