Education
Education
Under embargo
until 12 September 2017 at 11.00 CEST
Education at a Glance 2017
OECD INDICATORS
Education at a Glance
2017
The statistical data for Israel are supplied by and under the responsibility of the relevant Israeli authorities. The use of such data by the OECD is without prejudice to the status of the Golan Heights, East Jerusalem and Israeli settlements in the West Bank under the terms of international law.
Photo credits:
© Christopher Futcher / iStock © Marc Romanelli / Gettyimages © michaeljung / Shutterstock © Pressmaster / Shutterstock
Corrigenda to OECD publications may be found on line at: www.oecd.org/about/publishing/corrigenda.htm. © OECD 2017
You can copy, download or print OECD content for your own use, and you can include excerpts from OECD publications, databases and multimedia products in your own documents, presentations, blogs, websites and teaching materials, provided that suitable acknowledgment of the source and copyright owner is given. All requests for public or commercial use and translation rights should be submitted to rights@oecd.org. Requests for permission to photocopy portions of this material for public or commercial use shall be addressed directly to the Copyright Clearance Center (CCC) at info@copyright.com or the Centre français d’exploitation du droit de copie (CFC) at contact@cfcopies.com.
This document, as well as any data and any map included herein, are without prejudice to the status of or sovereignty over any territory, to the delimitation of international frontiers and boundaries and to the name of any territory, city or area.
Please cite this publication as:
OECD (2017), Education at a Glance 2017: OECD Indicators, OECD Publishing, Paris.
http://dx.doi.org/10.1787/eag-2017-en
ISBN (print) 978-92-64-27976-6 ISBN (PDF) 978-92-64-27983-4
Education at a Glance 2017: OECD Indicators © OECD 2017
3
Governments are increasingly looking to international comparisons of education opportunities and outcomes as they develop policies to enhance individuals’ social and economic prospects, provide incentives for greater efficiency in schooling, and help to mobilise resources to meet rising demands. The OECD Directorate for Education and Skills contributes to these efforts by developing and analysing the quantitative, internationally comparable indicators that it publishes annually in Education at a Glance. Together with OECD country policy reviews, these indicators can be used to assist governments in building more effective and equitable education systems.Education at a Glance addresses the needs of a range of users, from governments seeking to learn policy lessons to academics requiring data for further analysis to the general public wanting to monitor how its country’s schools are progressing in producing world-class students. The publication examines the quality of learning outcomes, the policy levers and contextual factors that shape these outcomes, and the broader private and social returns that accrue to investments in education.
Education at a Glance is the product of a long-standing, collaborative effort between OECD governments, the experts and institutions working within the framework of the OECD Indicators of Education Systems (INES) programme and the OECD Secretariat. The publication was prepared by the staff of the Innovation and Measuring Progress Division of the OECD Directorate for Education and Skills, under the responsibility of Dirk Van Damme and Marie-Hélène Doumet and in co-operation with Étienne Albiser, Manon Costinot, Corinne Heckmann, Michael Jacobs, Karinne Logez, Camila de Moraes, Simon Normandeau, Joris Ranchin, Gara Rojas González, Martha Rozsi, Daniel Sánchez Serra, Markus Schwabe and Giovanni Maria Semeraro. Administrative support was provided by Laetitia Dehelle, and additional advice and analytical support were provided by Anithasree Athiyaman, Fatine Guedira, Michaela Horvathova, Sandrine Kergroach, Axelle Magnier, Gabriele Marconi, Nicolas Miranda, Junyeong Park and Roland Tusz. Marilyn Achiron, Cassandra Davis and Sophie Limoges provided valuable support in the editorial and production process. The development of the publication was steered by member countries through the INES Working Party and facilitated by the INES Networks. The members of the various bodies as well as the individual experts who have contributed to this publication and to OECD INES more generally are listed at the end of the book.
While much progress has been accomplished in recent years, member countries and the OECD continue to strive to strengthen the link between policy needs and the best available internationally comparable data. This presents various challenges and trade-offs. First, the indicators need to respond to education issues that are high on national policy agendas, and where the international comparative perspective can offer added value to what can be accomplished through national analysis and evaluation. Second, while the indicators should be as comparable as possible, they also need to be as country-specific as is necessary to allow for historical, systemic and cultural differences between countries. Third, the indicators need to be presented in as straightforward a manner as possible, while remaining sufficiently complex to reflect multi-faceted realities. Fourth, there is a general desire to keep the indicator set as small as possible, but it needs to be large enough to be useful to policy makers across countries that face different challenges in education.
The OECD will continue not only to address these challenges vigorously and develop indicators in areas where it is feasible and promising to develop data, but also to advance in areas where a considerable investment still needs to be made in conceptual work. The OECD Programme for International Student Assessment (PISA) and its extension through the OECD Programme for the International Assessment of Adult Competencies (Survey of Adult Skills [PIAAC]), as well as the OECD Teaching and Learning International Survey (TALIS), are major efforts to this end.
Education at a Glance 2017: OECD Indicators © OECD 2017
5
Name of the indicator in the 2016 editionTABLE OF CONTENTS
A1 A2 A3 A4 A5Editorial: Building for the future...11
Introduction:The indicators and their framework ...13
Reader’s guide ...17
Executive summary ...23
The education sustainable development goal ...27
CHAPTER A THE OUTPUT OF EDUCATIONAL INSTITUTIONS AND THE IMPACT OF LEARNING...41
Indicator A1 To what level have adults studied? ...42
Table A1.1. Educational attainment of 25-64 year-olds (2016) ...50
Table A1.2. Trends in educational attainment of 25-34 year-olds (2000, 2005, 2010, 2015 and 2016) ...51
Table A1.3. Field of study among tertiary-educated 25-64 year-olds (2016) ...52
Indicator A2 Who is expected to graduate from upper secondary education? ...54
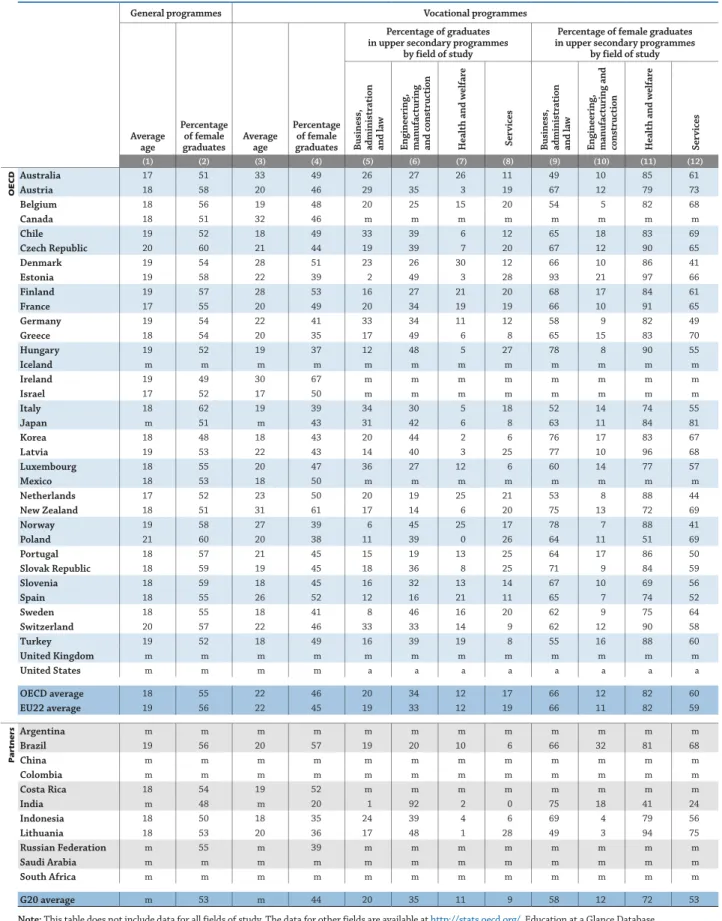
Table A2.1. Profile of upper secondary graduates from general and vocational programmes (2015) ...61
Table A2.2. Upper secondary and post-secondary non-tertiary graduation rates (2015) ...62
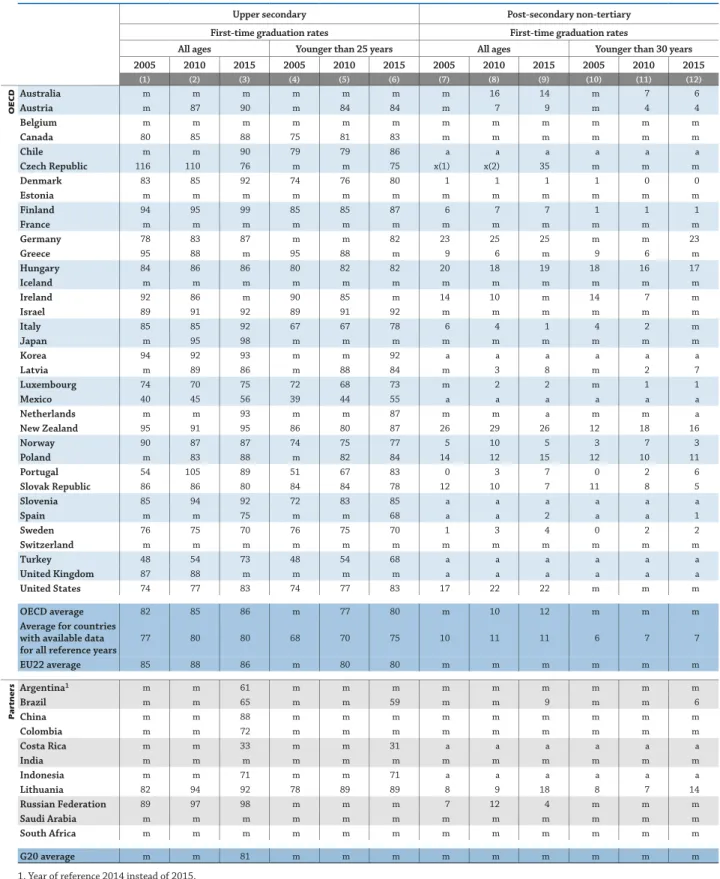
Table A2.3. Trends in upper secondary and post-secondary non-tertiary first-time graduation rates (2005, 2010 and 2015) ...63
Indicator A3 Who is expected to graduate from tertiary education? ...64
Table A3.1. Distribution of tertiary graduates, by field of study (2015) ...72
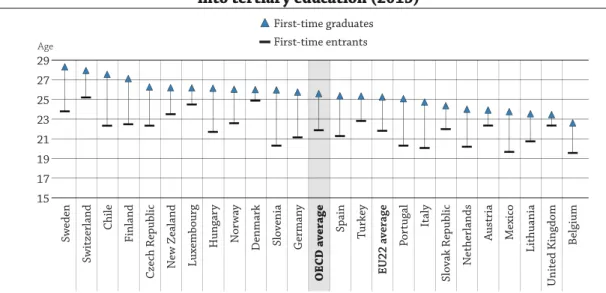
Table A3.2. Profile of a first-time tertiary graduate (2015) ...73
Table A3.3. First-time graduation rates, by tertiary level (2015) ...74
Indicator A4 To what extent does parents’ education influence their children’s educational attainment? ...76
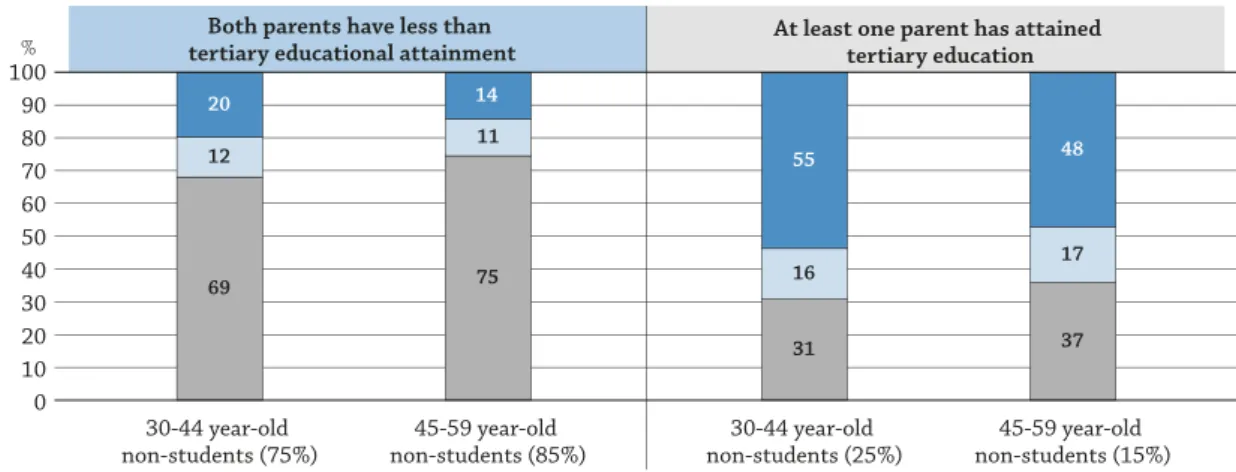
Table A4.1. Tertiary attainment among adults whose parents both have less than tertiary educational attainment, by type of programme and age group (2012 or 2015)...85
Table A4.2. Tertiary attainment among adults who have at least one parent who attained tertiary education, by type of programme and age group (2012 or 2015) ...86
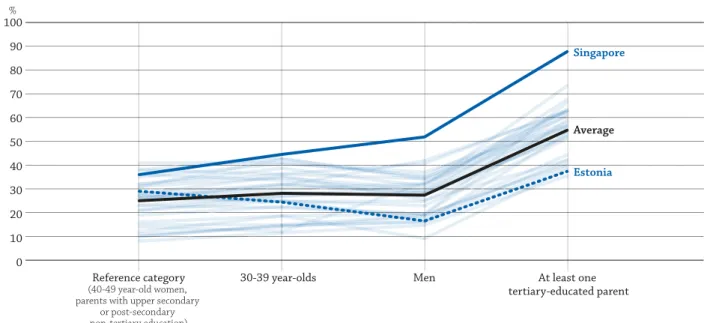
Table A4.3. Changes in the likelihood of having a tertiary-type A or an advanced research programme degree, by gender, age group and parents’ educational attainment (2012 or 2015) ...87
Indicator A5 How does educational attainment affect participation in the labour market? ...88
Table A5.1. Employment rates of 25-64 year-olds, by educational attainment (2016)...100
Table A5.2. Trends in employment rates of 25-34 year-olds, by educational attainment (2000, 2005, 2010, 2015 and 2016) ...101
Table A5.3. Employment rates of tertiary-educated 25-64 year-olds, by field of study (2016) ...102
Table A5.4. Employment, unemployment and inactivity rates of 25-34 year-olds, by educational attainment (2016) ...103
Name of the indicator in the 2016 edition A6 A7 A8 B1 B2
Indicator A6 What are the earnings advantages from education? ...104
Table A6.1. Relative earnings of workers, by educational attainment (2015) ...114
Table A6.2. Level of earnings relative to median earnings, by educational attainment (2015) ...115
Table A6.3. Differences in earnings between female and male workers, by educational attainment and age group (2015)...116
Indicator A7 What are the financial incentives to invest in education? ...118
Table A7.1a. Private costs and benefits for a man attaining tertiary education (2013) ...129
Table A7.1b. Private costs and benefits for a woman attaining tertiary education (2013) ...130
Table A7.2a. Public costs and benefits for a man attaining tertiary education (2013) ...131
Table A7.2b. Public costs and benefits for a woman attaining tertiary education (2013) ...132
Table A7.3a. Private/public costs and benefits for a man attaining tertiary education, by level of tertiary education (2013) ...133
Table A7.3b. Private/public costs and benefits for a woman attaining tertiary education, by level of tertiary education (2013) ...134
Indicator A8 How are social outcomes related to education? ...136
Table A8.1. Percentage of adults who report having depression, by gender, age group and educational attainment (2014) ...147
Table A8.2. Percentage of adults who report having depression, by labour-force status and educational attainment (2014) ...148
Table A8.3. Changes in the likelihood of reporting having depression, by educational attainment and labour force status (2014) ...149
Indicator A9 How many students complete upper secondary education? ...152
Table A9.1. Completion rate of upper secondary education, by programme orientation and gender (2015) ...162
Table A9.2. Distribution of entrants to upper secondary education, by programme orientation and outcomes after theoretical duration and after the theoretical duration plus two years (2015) ...163
CHAPTER B FINANCIAL AND HUMAN RESOURCES INVESTED IN EDUCATION ...165
Indicator B1 How much is spent per student? ...168
Table B1.1. Annual expenditure per student by educational institutions for all services (2014) ...177
Table B1.2. Annual expenditure per student by educational institutions for core educational services, ancillary services and R&D (2014) ...178
Table B1.3. Change in expenditure per student by educational institutions for all services, relative to different factors by levels of education (2008, 2011, 2014) ...179
Indicator B2 What proportion of national wealth is spent on educational institutions? ...180
Table B2.1. Expenditure on educational institutions as a percentage of GDP, by level of education (2014) ...187
Table B2.2. Trends in expenditure on educational institutions as a percentage of GDP, by level of education (2005, 2010 to 2014) ...188
Table B2.3. Expenditure on educational institutions as a percentage of GDP, by source of funding and level of education (2014) ...189
Table of Contents
Education at a Glance 2017: OECD Indicators © OECD 2017
7
Name of the indicator in the 2016 edition B3 B4 B6 B5 B7 C1 Indicator B3 How much public and private investment on educational institutionsis there? ...190
Table B3.1a. Relative proportions of public and private expenditure on educational institutions, by level of education (2014) ...197
Table B3.1b. Relative proportions of disaggregated public and private expenditure on educational institutions, by level of education (2014) ...198
Table B3.2a. Trends in the relative proportion of public expenditure on educational institutions and index of change in public and private expenditure, at primary, secondary, post-secondary non-tertiary level (2005, 2008, 2011 to 2014) ...199
Table B3.2b. Trends in the relative proportion of public expenditure on tertiary educational institutions and index of change in public and private expenditure (2005, 2008, 2011 to 2014) ...200
Indicator B4 What is the total public spending on education? ...202
Table B4.1. Total public expenditure on education (2014)...209
Table B4.2. Trends in total public expenditure on primary to tertiary education (2005, 2008, 2010 to 2014) ...210
Table B4.3. Share of sources of public funds by level of government (2014)...211
Indicator B5 How much do tertiary students pay and what public support do they receive? ...212
Table B5.1. Estimated annual average tuition fees charged by tertiary educational institutions (2015/16) ...220
Table B5.3. Average tuition fees charged by tertiary public and private institutions, by field of study (2015/16) ...222
Table B5.4. Distribution of financial support to students (2015/16) ...223
Indicator B6 On what resources and services is education funding spent? ...224
Table B6.1. Share of current and capital expenditure by education level (2014) ...230
Table B6.2. Current expenditure by resource category (2014) ...231
Table B6.3. Share of current expenditure by resource category and type of institution (2014) ...232
Indicator B7 Which factors influence the level of expenditure on education? ...234
Table B7.1. Salary cost of teachers per student, by level of education (2010 and 2015) ...244
Table B7.2. Contribution of various factors to salary cost of teachers per student in primary education (2015) ...245
Table B7.3. Contribution of various factors to salary cost of teachers per student in lower secondary education (2015) ...246
CHAPTER C ACCESS TO EDUCATION, PARTICIPATION AND PROGRESSION ...247
Indicator C1 Who participates in education? ...248
Table C1.1. Enrolment rates by age group (2005 and 2015) ...256
Table C1.2. Students enrolled as a percentage of the population between the ages of 15 and 20 (2005 and 2015) ...257
Table C1.3. Enrolment in upper secondary education, by programme orientation and age group (2015) ...258
Name of the indicator in the 2016 edition C2 C3 C4 C5 C6 D1 D2
Indicator C2 How do early childhood education systems differ around the world? ...260
Table C2.1. Enrolment rates in early childhood and primary education, by age (2005 and 2015) ...269
Table C2.2. Characteristics of early childhood educational development programmes and pre-primary education (2015) ...270
Table C2.3. Expenditure on early childhood educational institutions (2014) ...271
Indicator C3 Who is expected to enter tertiary education? ...272
Table C3.1. Share of new entrants to tertiary education, by field of study and gender (2015) ...282
Table C3.2. Profile of first-time entrants into tertiary education (2015) ...283
Table C3.3. First-time entry rates, by tertiary level (2015) ...284
Indicator C4 What is the profile of internationally mobile students? ...286
Table C4.1. International student mobility and foreign students in tertiary education (2015) ...300
Table C4.2. Share of tertiary students enrolled in broad fields of study, by mobility status (2015)...301
Table C4.3. Mobility patterns of foreign and international students (2015) ...302
Indicator C5 Transition from school to work: where are the 15-29 year-olds? ...304
Table C5.1. Percentage of 18-24 year-olds in education/not in study, by work status (2016)...312
Table C5.2. Trends in the percentage of young adults in education/not in education, employed or not, by age (2000, 2005, 2010, 2015 and 2016) ...313
Indicator C6 How many adults participate in education and learning? ...316
Table C6.1a. Participation in formal and/or non-formal education (2012 or 2015) ...327
Table C6.1b. Willingness to participate in formal and/or non-formal education and barriers to participation (2012 or 2015) ...328
Table C6.2a. Participation in formal and/or non-formal education, by age group and whether there are young children in the household (2012 or 2015) ...329
Table C6.2b. Participation in formal and/or non-formal education, by gender and whether there are young children in the household (2012 or 2015) ...330
Table C6.3a. Participation in formal and/or non-formal education, by labour-force status and participation in volunteering activities (2012 or 2015) ...331
Table C6.3b. Participation in formal and/or non-formal education, by age group and participation in volunteering activities (2012 or 2015) ...332
CHAPTER D THE LEARNING ENVIRONMENT AND ORGANISATION OF SCHOOLS ...333
Indicator D1 How much time do students spend in the classroom? ...334
Table D1.1. Instruction time in compulsory general education (2017) ...345
Table D1.2. Organisation of compulsory general education (2017)...347
Table D1.3a. Instruction time per subject in primary education (2017) ...348
Table D1.3b. Instruction time per subject in general lower secondary education (2017) ...349
Indicator D2 What is the student-teacher ratio and how big are classes? ...350
Table of Contents
Education at a Glance 2017: OECD Indicators © OECD 2017
9
Name of the indicator in the 2016 edition D3 D5 D4Table D2.2. Ratio of students to teaching staff in educational institutions (2015) ...358
Table D2.3. Ratio of students to teaching staff, by type of institution (2015) ...359
Indicator D3 How much are teachers paid? ...360
Table D3.1a. Teachers’ statutory salaries, based on typical qualifications, at different points in teachers’ careers (2015) ...374
Table D3.2a. Teachers’ actual salaries relative to wages of tertiary-educated workers (2015) ...375
Table D3.4. Average actual teachers’ salaries, by age group and by gender (2015) ...376
Indicator D4 How much time do teachers spend teaching? ...378
Table D4.1. Organisation of teachers’ working time (2015) ...388
Table D4.2. Number of teaching hours per year (2000, 2005 to 2015) ...389
Table D4.3. Tasks and responsibilities of teachers, by level of education (2015) ...390
Indicator D5 Who are the teachers? ...392
Table D5.1. Age distribution of teachers (2005 and 2015) ...399
Table D5.2. Gender distribution of teachers (2015) ...400
Table D5.3. Gender distribution of teachers (2005 and 2015) ...401
Indicator D6 What are the national criteria for students to apply to and enter into tertiary education? ...402
Table D6.1. Organisation of the admission system to first-degree tertiary programmes (2017) ...411
Table D6.3. Minimum qualification and academic performance requirements for entry into tertiary education (government perspective) (2017) ...413
Table D6.4. Application process for entry into first-degree tertiary programmes (2017) ...414
Table D6.5. Use of examinations/tests to determine entry/admission into first-degree tertiary programmes (2017) ...415
ANNEX 1 CHARACTERISTICS OF EDUCATION SYSTEMS ...417
Table X1.1a. Typical graduation ages, by level of education (2015) ...418
Table X1.1b. Typical age of entry by level of education (2015) ...420
Table X1.2a. School year and financial year used for the calculation of indicators, OECD countries ...421
Table X1.2b. School year and financial year used for the calculation of indicators, partner countries ...422
Table X1.3. Starting and ending age for students in compulsory education (2015) ...423
ANNEX 2 REFERENCE STATISTICS ...425
Table X2.1. Basic reference statistics (reference period: calendar year 2014 and 2015) ...426
Table X2.2. Basic reference statistics (reference period: calendar year 2005, 2008, 2010, 2011, 2012, 2013 current prices) ...427
Table X2.3. Basic reference statistics (reference period: calendar year 2005, 2008, 2010, 2011, 2012, 2013 in constant prices of 2014) ...429
Table X2.4a. Teachers’ statutory salaries at different points in their careers, for teachers with typical qualification (2015) ...431
Name of the indicator
in the 2016 edition Table X2.4b. Teachers’ statutory salaries at different points in their careers, for teachers
with minimum qualification (2015) ...433
Table X2.4e. Reference statistics used in calculating teachers’ salaries (2000, 2005 to 2015) ...435
Table X2.4f. Trends in average teachers’ actual salaries, in national currency (2000, 2005, 2010 to 2015) ...436
Table X2.5. Teachers with 15 years of experience, by level of qualification (2015) ...438
Table X2.6. Percentage of pre-primary, primary, lower secondary and upper secondary teachers, by level of attainment (2015) ...439
ANNEX 3 SOURCES, METHODS AND TECHNICAL NOTES ...441
Contributors to this publication ...443
Education Indicators in Focus ...449
Look for the StatLinks2at the bottom of the tables or graphs in this book. To download the matching Excel® spreadsheet, just type the link into your Internet browser, starting with the http://dx.doi.org prefix, or click on the link from the e-book edition.
Follow OECD Publications on:
This book has...
StatLinks
2
A service that delivers Excel files from the printed page! ® http://twitter.com/OECD_Pubs http://www.facebook.com/OECDPublications http://www.linkedin.com/groups/OECD-Publications-4645871 http://www.youtube.com/oecdilibrary http://www.oecd.org/oecddirect/ OECD Alerts http://gpseducation.oecd.org/
Education at a Glance 2017: OECD Indicators © OECD 2017
11
Who has not seen the glow in a child’s eyes when asked what they want to be when they grow up? Who does not reminisce about their own childhood dreams of a career? Typically, such dreams revolve around saving people, conducting breakthrough scientific research, fighting for justice, conveying emotion through the arts, or teaching the children of tomorrow. But often the careers people choose for themselves are nothing like the ones they dreamed of as children; this is because the factors that motivate students to pursue a career in a given field can be much more complex than assumed.At a relatively early age, students are asked to make important decisions about the paths they will follow towards their future: whether or not to continue in formal academic or vocational education, pursue a tertiary degree in a selected field of study, or enter the labour market. They will factor in their personal interests, beliefs about their capacity to excel, and the economic rewards of the different pathways. Their decision will affect the rest of their lives – a daunting prospect for a teenager – and will have repercussions on the societies we build in future generations. In whatever the field of study chosen, higher education programmes help students develop a broad range of knowledge, skills and attitudes that are indispensable for navigating through life, and not just through the labour market. Proficiency in critical thinking and problem solving, and in social and emotional skills, such as teamwork, communication and cultural awareness, are all essential to ensure an individual’s inclusion and constructive engagement in society.
This edition of Education at a Glance focuses on fields of study, analysing various indicators through the prism of young adults’ career choices. Results show that the most common field of study in which tertiary students enrol is business, administration and law, whereas science, technology, engineering and mathematics, commonly referred to as the STEM fields, are less attractive: approximately 23% of new entrants into tertiary education select to study business, administration and law compared to 16% in engineering, construction and manufacturing, and 6% in natural sciences, mathematics and statistics. The field of information and communication technologies (ICT) in particular attracts less than 5% of new entrants, the smallest share to a field of study, yet yields the highest employment rate on average across OECD countries – even exceeding 90% in about a third of them – signalling a shortage of supply.
However, not all science-related fields have high employment outcomes. Although there has been a recent push to produce more scientists in many OECD countries, the employment rate of graduates from the fields of natural science, statistics and mathematics is more comparable to the lower employment prospects of arts and humanities graduates than to the higher rate enjoyed by engineers and ICT specialists.
In addition, the persistent differences in the way men and women select their future careers are disturbing. Nowhere is this more apparent than in the teaching profession, where more than seven out of ten teachers, on average across OECD countries, are women – and there is no sign that this gender gap is narrowing among young adults entering the field of education. The opposite is observed in science and engineering where men still outnumber women. Results from the PISA 2015 assessment indicate that boys’ and girls’ career paths start to diverge well before they actually select a career. On average across OECD countries, although girls outperform boys in the PISA science test, boys are more likely than girls to envision themselves in a science-related career when they are 30. Gender differences are even starker when young adults select a field of study at the tertiary level: close to three out of four engineering students and four out of five ICT students are men.
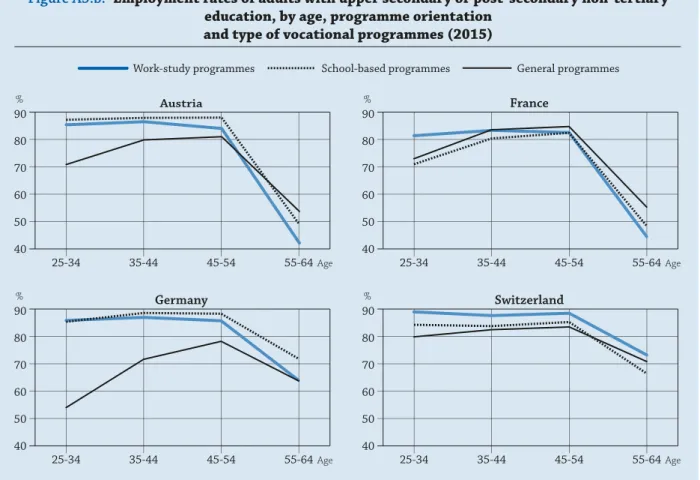
Enrolment in higher education has exploded over the past decade and the strong labour market outcomes associated with tertiary qualifications signal that this has not led to a decline in graduates’ employment prospects. Vocational programmes have long promoted their ties with the labour market and their ability to produce graduates with trade-specific skills. Meanwhile, apprenticeships and work-study programmes have promoted more flexible pathways into the labour market, although the earning prospects for graduates of these types of programmes have generally remained poor.
EDITORIAL
To participate fully in their society, people need to develop a transferable skillset over a lifetime. This is the objective at the heart of Goal 4 of the Sustainable Development Goals (SDGs) set by world leaders in New York in September 2015. By advocating “inclusive and equitable quality education and promoting lifelong learning opportunities for all”, Goal 4 establishes an ambitious agenda to ensure that every adult has an equal opportunity to a quality education and to contribute to society.
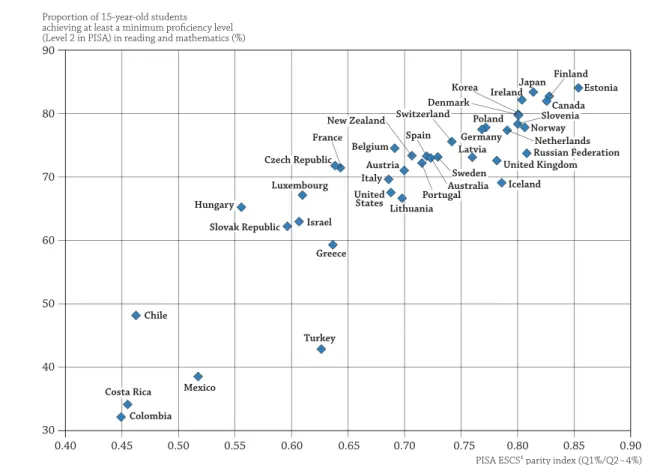
Education at a Glance dedicates an entire chapter to the SDGs, providing an assessment of where OECD and partner countries stand on their way to meeting the SDG targets. The results show that, for certain targets, the disparities across OECD countries are substantial. On average over the past 12 months, OECD and partner countries have achieved gender parity in the participation rate of adults in formal and non-formal education and training. However, this result masks one of the largest variations among all gender parity indicators, with the ratio of women to men participating in such programmes in the past 12 months ranging between 0.7 and 1.4 across countries. Similarly, the share of men and women achieving minimum proficiency in literacy and numeracy varies widely, reflecting inequalities in basic skills across OECD countries.
More than an end in itself, education is a means to deliver our vision of tomorrow. It is the foundation for promoting development, reducing economic disparities and creating a society of inclusiveness. Prosperous countries depend on skilled and educated workers, but more than ever, they also depend on a set of coherent strategies that link education outcomes to the needs and demands of society in a way that fosters inclusive growth.
Designing these strategies requires close alignment with the organisations, markets and industries that make up today’s world, but also strong leadership with the foresight to identify where we want to be in the next 30 years. More guidance and support must be provided to young students as they select their future careers. Young people need to find the right balance of personal interests, potential social and economic outcomes, and the skills they can expect to develop in the selected education programmes that will carry them through their lives.
Education fuels personal growth, particularly when it is of high quality and provided equitably, as well as economic growth, particularly when it is accompanied by a thorough understanding of how skills are linked with the labour market. Our responsibility is to ensure that education meets the needs of today’s children and informs their aspirations for the future, both personal and professional. We cannot let them down.
Angel Gurría
Education at a Glance 2017: OECD Indicators © OECD 2017
13
The organising framework
Education at a Glance 2017: OECD Indicators offers a rich, comparable and up-to-date array of indicators that reflects a consensus among professionals on how to measure the current state of education internationally. The indicators provide information on the human and financial resources invested in education, how education and learning systems operate and evolve, and the returns to investments in education. The indicators are organised thematically, and each is accompanied by information on the policy context and an interpretation of the data. The education indicators are presented within an organising framework that:
• distinguishes between the actors in education systems: individual learners and teachers, instructional settings and learning environments, education service providers, and the education system as a whole
• groups the indicators according to whether they address learning outcomes for individuals or countries, policy levers or circumstances that shape these outcomes, or to antecedents or constraints that put policy choices into context
• identifies the policy issues to which the indicators relate, with three major categories distinguishing between the quality of education outcomes and education opportunities, issues of equity in education outcomes and opportunities, and the adequacy and effectiveness of resource management.
The following matrix describes the first two dimensions:
INTRODUCTION:
THE INDICATORS AND THEIR FRAMEWORK
1. Education and
learning outputs and outcomes
2. Policy levers and
contexts shaping education outcomes 3. Antecedents or constraints that contextualise policy I. Individual participants in education and learning
1.I. The quality
and distribution of individual education outcomes
2.I. Individual attitudes
towards, engagement in, and behaviour in teaching and learning
3.I. Background characteristics of the individual learners and teachers II. Instructional
settings 1.II. The quality of instructional
delivery
2.II. Pedagogy, learning
practices and classroom climate
3.II. Student learning
conditions and teacher working conditions
III. Providers of
educational services 1.III. The output of educational
institutions and institutional performance
2.III. School environment
and organisation 3.III. Characteristics of the service providers and their communities
IV. The education
system as a whole 1.IV. The overall performance
of the education system 2.IV. System-wide institutional settings, resource allocations, and policies
3.IV. The national
educational, social, economic, and demographic contexts
Actors in education systems
The OECD Indicators of Education Systems (INES) programme seeks to gauge the performance of national education systems as a whole, rather than to compare individual institutional or other subnational entities. However, there is increasing recognition that many important features of the development, functioning and impact of education systems can only be assessed through an understanding of learning outcomes and their relationships to inputs and processes at the level of individuals and institutions. To account for this, the indicator framework distinguishes between a macro-level, two meso-levels and a micro-level of education systems. These relate to:
• the education system as a whole
• the educational institutions and providers of educational services
• the instructional setting and the learning environment within the institutions
• the individual participants in education and learning.
To some extent, these levels correspond to the entities from which data are being collected, but their importance mainly centres on the fact that many features of the education system play out quite differently at different levels of the system, which needs to be taken into account when interpreting the indicators. For example, at the level of students within a classroom, the relationship between student achievement and class size may be negative, if students in small classes benefit from improved contact with teachers. At the class or school level, however, students are often intentionally grouped such that weaker or disadvantaged students are placed in smaller classes so that they receive more individual attention. At the school level, therefore, the observed relationship between class size and student achievement is often positive, suggesting that students in larger classes perform better than students in smaller classes. At higher aggregated levels of education systems, the relationship between student achievement and class size is further confounded, e.g. by the socio-economic intake of schools or by factors relating to the learning culture in different countries. Therefore, past analyses that have relied on macro-level data alone have sometimes led to misleading conclusions.
Outcomes, policy levers and antecedents
The second dimension in the organising framework further groups the indicators at each of the above levels:
• Indicators on observed outputs of education systems, as well as indicators related to the impact of knowledge and skills for individuals, societies and economies, are grouped under the sub-heading output and outcomes of education and learning.
• The sub-heading policy levers and contexts groups activities seeking information on the policy levers or circumstances that shape the outputs and outcomes at each level.
• These policy levers and contexts typically have antecedents – factors that define or constrain policy. These are represented by the sub-heading antecedents and constraints. The antecedents or constraints are usually specific for a given level of the education system; antecedents at a lower level of the system may well be policy levers at a higher level. For teachers and students in a school, for example, teacher qualifications are a given constraint while, at the level of the education system, professional development of teachers is a key policy lever.
Policy issues
Each of the resulting cells in the framework can then be used to address a variety of issues from different policy perspectives. For the purpose of this framework, policy perspectives are grouped into three classes that constitute the third dimension in the organising framework for INES:
• quality of education outcomes and education opportunities
• equality of education outcomes and equity in education opportunities
• adequacy, effectiveness and efficiency of resource management.
In addition to the dimensions mentioned above, the time perspective in the framework allows for dynamic aspects of the development of education systems to be modelled as well.
The indicators that are published in Education at a Glance 2017 fit within this framework, though often they speak to more than one cell.
Introduction
Education at a Glance 2017: OECD Indicators © OECD 2017
15
Most of the indicators in Chapter A, The output of educational institutions and the impact of learning, relate to the first column of the matrix describing outputs and outcomes of education. Even so, indicators in Chapter A measuring educational attainment for different generations, for instance, not only provide a measure of the output of the education system, but also provide context for current education policies, helping to shape policies on, for example, lifelong learning.Chapter B, Financial and human resources invested in education, provides indicators that are either policy levers or
antecedents to policy, or sometimes both. For example, expenditure per student is a key policy measure that most directly affects the individual learner, as it acts as a constraint on the learning environment in schools and learning conditions in the classroom.
Chapter C, Access to education, participation and progression, provides indicators that are a mixture of outcome
indicators, policy levers and context indicators. Internationalisation of education and progression rates are, for instance, outcome measures to the extent that they indicate the results of policies and practices at the classroom, school and system levels. But they can also provide contexts for establishing policy by identifying areas where policy intervention is necessary to address issues of inequity, for example.
Chapter D, The learning environment and organisation of schools, provides indicators on instruction time, teachers’
working time and teachers’ salaries that not only represent policy levers that can be manipulated but also provide contexts for the quality of instruction in instructional settings and for the outcomes of individual learners. It also presents data on the profile of teachers, the levels of government at which decisions about education are taken, and pathways and gateways to gain access to secondary and tertiary education.
The reader should note that this edition of Education at a Glance covers a significant amount of data from partner countries as well (please refer to the Reader’s Guide for details).
Education at a Glance 2017: OECD Indicators © OECD 2017
17
READER’S GUIDE
Coverage of the statisticsAlthough a lack of data still limits the scope of the indicators in many countries, the coverage extends, in principle, to the entire national education system (within the national territory), regardless of who owns or sponsors the institutions concerned and regardless of how education is delivered. With one exception (described below), all types of students and all age groups are included: children (including students with special needs), adults, nationals, foreigners, and students in open-distance learning, in special education programmes or in education programmes organised by ministries other than the ministry of education, provided that the main aim of the programme is to broaden or deepen an individual’s knowledge. Vocational and technical training in the workplace, with the exception of combined school- and work-based programmes that are explicitly deemed to be part of the education system, is not included in the basic education expenditure and enrolment data.
Educational activities classified as “adult” or “non-regular” are covered, provided that the activities involve the same or similar content as “regular” education studies, or that the programmes of which they are a part lead to qualifications similar to those awarded in regular education programmes.
Courses for adults that are primarily for general interest, personal enrichment, leisure or recreation are excluded.
More information on the coverage of the indicators presented in Education at a Glance can be found in the OECD Handbook for Internationally Comparative Statistics on Education (OECD, 2017a).
Country coverage
This publication features data on education from the 35 OECD countries, 2 partner countries that participate in the OECD Indicators of Education Systems programme (INES), namely Brazil and the Russian Federation, and other partner G20 and OECD accession countries that do not participate in INES (Argentina, China, Colombia, Costa Rica, India, Indonesia, Lithuania, Saudi Arabia and South Africa). Data sources for the non-INES participating countries come from the UNESCO Institute of Statistics or from Eurostat.
The statistical data for Israel are supplied by and under the responsibility of the relevant Israeli authorities. The use of such data by the OECD is without prejudice to the status of the Golan Heights, East Jerusalem and Israeli settlements in the West Bank under the terms of international law.
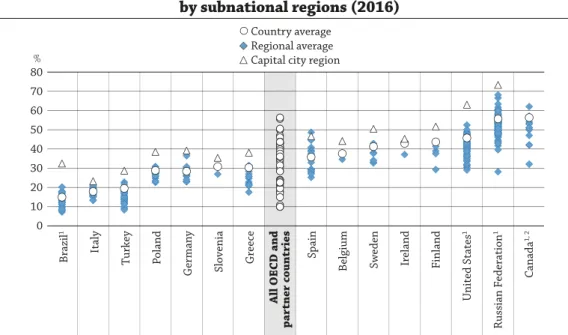
Note on subnational regions
When interpreting the results on subnational entities, readers should take into account that the population size as well as geographic size of subnational entities can vary widely within countries. For example, in Canada, the population of Nunavut is 37 082 and the territory covers 1.9 million square kilometres, while the population of the province of Ontario is 13.9 million and the territory covers 909 000 square kilometres (OECD Regional Statistics Database, OECD [2017b]). Also, regional disparities tend to be higher especially in big countries like Canada, the Russian Federation or the United States when more subnational entities are used in the analysis.
Calculation of international means
The main purpose of Education at a Glance is to provide an authoritative compilation of key international comparisons of education statistics. While countries attain specific values in these comparisons, readers should not assume that countries themselves are homogeneous. The country averages include significant variations among subnational jurisdictions, much as the OECD average encompasses a variety of national experiences.
For many indicators, an OECD average is presented; for some, an OECD total is shown. The OECD average is calculated as the unweighted mean of the data values of all OECD countries for which data are available or can be estimated. The OECD average therefore refers to an average of data values at the level of the national systems and can be used to answer the question of how an indicator value for a given country compares with the value for a typical or average country. It does not take into account the absolute size of the education system in each country.
The OECD total is calculated as the weighted mean of the data values of all OECD countries for which data are available or can be estimated. It reflects the value for a given indicator when the OECD area is considered as a whole. This approach is taken for the purpose of comparing, for example, expenditure charts for individual countries with those of the entire OECD area for which valid data are available, with this area considered as a single entity.
For tables using trend series, the OECD average is calculated for countries providing data for all reference years used. This allows for a comparison of the OECD average over time with no distortion due to the exclusion of certain countries in the different years.
For many indicators, an EU22 average is also presented. It is calculated as the unweighted mean of the data values of the 22 countries that are members of both the European Union and the OECD for which data are available or can be estimated. These 22 countries are Austria, Belgium, the Czech Republic, Denmark, Estonia, Finland, France, Germany, Greece, Hungary, Ireland, Italy, Latvia, Luxembourg, the Netherlands, Poland, Portugal, Slovenia, the Slovak Republic, Spain, Sweden and the United Kingdom.
For some indicators, a G20 average is presented. The G20 average is calculated as the unweighted mean of the data values of all G20 countries for which data are available or can be estimated (Argentina, Australia, Brazil, Canada, China, France, Germany, India, Indonesia, Italy, Japan, Korea, Mexico, the Russian Federation, Saudi Arabia, South Africa, Turkey, the United Kingdom and the United States; the European Union is the 20th member of the G20 but is not included in the calculation). The G20 average is not computed if data for both China and India are not available.
OECD, EU22 and G20 averages and totals can be significantly affected by missing data. In the case of some countries, data may not be available for specific indicators, or specific categories may not apply. Therefore, readers should keep in mind that the term “OECD/EU22/G20 average” refers to the OECD, EU22 or G20 countries included in the respective comparisons. Averages are not calculated if more than 40% of countries have missing information or have information included in other columns.
For some indicators, an average is presented. This average is included in tables with data from the 2012 and 2015 OECD Programme for the International Assessment of Adult Competencies (Survey of Adult Skills [PIAAC]). The average corresponds to the arithmetic mean of the estimates included in the table or figure from both the national and the subnational entities (which include the Flemish Community of Belgium and England/Northern Ireland [UK]). Partner countries are not included in the average presented in any of the tables or figures.
Standard error (S.E.)
The statistical estimates presented in this report are based on samples of adults, rather than values that could be calculated if every person in the target population in every country had answered every question. Therefore, each estimate has a degree of uncertainty associated with sampling and measurement error, which can be expressed as a standard error. The use of confidence intervals is a way to make inferences about the population means and proportions in a manner that reflects the uncertainty associated with the sample estimates. In this report, confidence intervals are stated at a 95% level. In other words, the result for the corresponding population would lie within the confidence interval in 95 out of 100 replications of the measurement on different samples drawn from the same population.
In tables showing standard errors, there is one column with the heading “%”, which indicates the average percentage, and a column with the heading “S.E.”, which indicates the standard error. Given the survey method, there is a sampling uncertainty in the percentages (%) of twice the standard error (S.E.). …
Reader’s Guide
Education at a Glance 2017: OECD Indicators © OECD 2017
19
For example, for the values: % = 10 and S.E. = 2.6, 10% has an uncertainty zone of twice (1.96) the standard error of 2.6, assuming an error risk of 5%. Thus, the true percentage would probably (error risk of 5%) be somewhere between 5% and 15% (“confidence interval”). The confidence interval is calculated as: % +/– 1.96 * S.E., i.e. for the previous example, 5% = 10% – 1.96 * 2.6 and 15% = 10% + 1.96 * 2.6.Classification of levels of education
The classification of levels of education is based on the International Standard Classification of Education (ISCED). ISCED is an instrument for compiling statistics on education internationally. ISCED-97 was recently revised, and the new International Standard Classification of Education (ISCED 2011) was formally adopted in November 2011 and is now the basis of the levels presented in this publication, with the exception of tables showing data from the Survey of Adult Skills (PIAAC).
In some indicators, intermediate programmes are also used. These correspond to recognised qualifications from an ISCED 2011 level programme which is not considered as sufficient for ISCED 2011 completion and is classified at a lower ISCED 2011 level.
Terms used in this publication ISCED classification
Early childhood education
Refers to early childhood programmes that have an intentional education component and aim to develop cognitive, physical and socio-emotional skills necessary for participation in school and society. Programmes at this level are often differentiated by age.
ISCED 0
(sub-categories:
01 for early childhood educational development and 02 for pre-primary education)
Primary education
Designed to provide a sound basic education in reading, writing and mathematics and a basic understanding of some other subjects. Entry age: between 5 and 7. Typical duration: 6 years.
ISCED 1
Lower secondary education
Completes provision of basic education, usually in a more subject-oriented way with more specialist teachers. Programmes may differ by orientation, general or vocational, though this is less common than at upper secondary level. Entry follows completion of primary education and typical duration is 3 years. In some countries, the end of this level marks the end of compulsory education.
ISCED 2
Upper secondary education
Stronger specialisation than at lower secondary level. Programmes offered are differentiated by orientation: general or vocational. Typical duration is 3 years.
ISCED 3
Post-secondary non-tertiary education
Serves to broaden rather than deepen the knowledge, skills and competencies gained in upper secondary level. Programmes may be designed to increase options for participants in the labour market, for further studies at tertiary level, or both. Usually, programmes at this level are vocationally oriented.
ISCED 4
Short-cycle tertiary education
Serves to deepen the knowledge developed at previous levels by imparting new techniques, concepts and ideas not generally covered in upper secondary education.
ISCED 5
Bachelor’s or equivalent level
Designed to provide participants with intermediate academic and/or professional knowledge, skills and competencies, leading to a first degree or equivalent qualification. Typical duration: 3-4 years full-time study.
ISCED 6
Master’s or equivalent level
Stronger specialisation and more complex content than bachelor’s level. Designed to provide participants with advanced academic and/or professional knowledge. May have a substantial research component.
ISCED 7
Doctoral or equivalent level
Designed to lead to an advanced research qualification. Programmes at this level are devoted to advanced study and original research, and exist in both academic and professional fields.
ISCED 8
Fields of education and training
Within ISCED, programmes and related qualifications can be classified by fields of education and training as well as by levels. Following the adoption of ISCED 2011, a separate review and global consultation process took place on the ISCED fields of education. The ISCED fields were revised, and the UNESCO General Conference adopted the ISCED 2013 Fields of Education and Training classification (ISCED-F 2013) in November 2013 at its 37th session. The ISCED 2013 Fields of Education and Training classification (UNESCO-UIS, 2014) is used for the first time in Education at a Glance 2017. Throughout this publication, the term “field of study” is used to refer to the different fields of this classification.
Symbols for missing data and abbreviations
These symbols and abbreviations are used in the tables and figures: a Data are not applicable because the category does not apply.
b There is a break in the series when data for the latest year refer to ISCED 2011 and data for previous years refer to ISCED-97.
c There are too few observations to provide reliable estimates (e.g. in the Survey of Adult Skills [PIAAC], there are fewer than 3 individuals for the numerator or fewer than 30 individuals for the denominator).
d Includes data from another category. m Data are not available.
r Values are below a certain reliability threshold and should be interpreted with caution. q Data have been withdrawn at the request of the country concerned.
x Data included in another category or column of the table (e.g. x(2) means that data are included in Column 2 of the table).
Further resources
The website www.oecd.org/education/education-at-a-glance-19991487.htm provides information on the methods used to calculate the indicators, on the interpretation of the indicators in the respective national contexts, and on the data sources involved. The website also provides access to the data underlying the indicators and to a comprehensive glossary for technical terms used in this publication.
All post-production changes to this publication are listed at www.oecd.org/publishing/corrigenda (corrections) and http://dx.doi.org/10.1787/eag-data-en (updates).
Education at a Glance uses the OECD’s StatLinks service. Below each table and figure in Education at Glance 2017 is a URL that leads to a corresponding Excel file containing the underlying data for the indicator. These URLs are stable and will not change. In addition, readers of the Education at a Glance e-book will be able to click directly on these links and the workbook will open in a separate window.
The Education at a Glance Database on OECD.Stat (http://stats.oecd.org/) houses the raw data and indicators presented in Education at a Glance, as well as the metadata that provides context and explanations for countries’ data. The Education at a Glance Database allows users to break down data in more ways than is possible in this publication in order to conduct their own analyses of education systems in participating countries. The Education at a Glance Database can be accessed from the OECD.Stat site under the heading “Education and Training”. Subnational data presented in this publication can be accessed from a subnational supplement to Education at a Glance via the website https://nces.ed.gov/surveys/annualreports/oecd/.
Layout of tables
In all tables, the numbers in parentheses at the top of the columns are simply used for reference. When a consecutive number does not appear, that column is available on line only.
Names used for territorial entities
For consistency, national and subnational entities are referred to as “countries” and “economies”, respectively, in the whole publication. Territorial and subnational entities are referred to throughout the publication by their subnational name and country, e.g. England (United Kingdom). For consistency with other indicators from …
Reader’s Guide
Education at a Glance 2017: OECD Indicators © OECD 2017
21
Education at a Glance, the subnational entity “Flanders (Belgium)” used in the Survey of Adult Skills (PIAAC) and the Teaching and Learning International Survey (TALIS) will be referred to by the name “Flemish Community of Belgium” throughout the publication. The Flemish Community of Belgium and French Community of Belgium are abbreviated in the tables and figures as “Flemish Com. (Belgium)” and “French Com. (Belgium)”.
Abbreviations used in this report ICT Information and communication technologies ISCED International Standard Classification of Education
PIAAC Programme for the International Assessment of Adult Competencies PPP Purchasing power parity
S.E. Standard error
STEM Science, technology, engineering, and mathematics UIS UNESCO Institute of Statistics
UOE Refers to the data collection managed by the three organisations, UNESCO, OECD, Eurostat
References
OECD (2017a), OECD Handbook for Internationally Comparative Education Statistics: Concepts, Standards, Definitions and Classifications, OECD Publishing, Paris, http://dx.doi.org/10.1787/9789264279889-en.
OECD (2017b), OECD Regional Databast, http://stats.oecd.org/Index.aspx?DataSetCode=REGION_DEMOGR.
OECD, Eurostat, UNESCO Institute for Statistics (2015), ISCED 2011 Operational Manual: Guidelines for Classifying National Education Programmes and Related Qualifications, OECD Publishing, Paris, http://dx.doi.org/10.1787/9789264228368. UNESCO–UIS (2014), ISCED 2013 Fields of Education and Training 2013 (ISCED-F 2013), UNESCO Institute for Statistics, Montreal, http://dx.doi.org/10.15220/978-92-9189-150-4-en.
Education at a Glance 2017: OECD Indicators © OECD 2017
23
Graduates from science-related fields are the most employable, though not across the board
In most OECD countries, the most popular tertiary degrees held by adults are in business, administration or law. On average across the OECD, 23% of tertiary-educated 25-64 year-olds hold a degree in one of these three fields of study, compared to 5% in natural sciences, statistics and mathematics; 4% in information and communication technologies; and 17% in engineering, manufacturing, and construction. The share is similar among new entrants to tertiary education, indicating that interest in these fields remains stable.
However, interest in science, technology, engineering and mathematics (STEM) grows with higher levels of education, with almost double the share of students graduating from these fields at doctoral level than at bachelor’s level in 2015. These fields are also favoured among international tertiary students, with the highest share, almost one-third of those studying in OECD countries, doing so in a science-related field.
Interest in engineering is higher for upper secondary vocational pathways than at tertiary level due to these programmes’ strong ties with the industry sector. Approximately one-third of students graduate from upper secondary vocational programmes with a degree in engineering, manufacturing and construction – more than double the share at tertiary level.
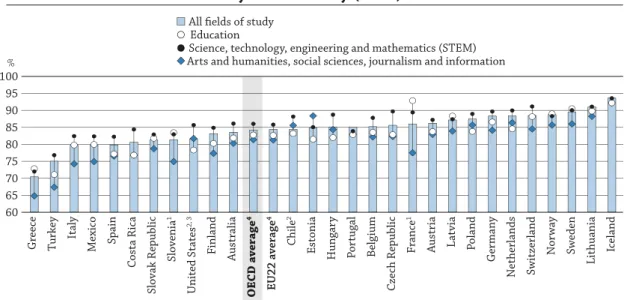
STEM-related fields also benefit from higher employment rates, reflecting the demands of an increasingly innovation-driven society: information and communication technologies (ICT) graduates can expect an employment rate that is 7 percentage points higher than those graduating from arts and humanities, or from social sciences, journalism and information. However, employment rates within science-related fields are unequal: natural sciences, mathematics and statistics graduates are more likely to have similar employment rates as arts and humanities graduates – both lower than the rates enjoyed by engineers or ICT specialists.
Gender parity in graduation rates is still a distant dream for some fields of study, particularly upper secondary vocational education. Gender parity improves at the tertiary level, though women still represent approximately only one in four entrants to engineering, manufacturing and construction. On the other hand they represent close to three out of four entrants in health and welfare fields of study. Other fields – such as business administration and law; and natural sciences, mathematics and statistics – have almost achieved gender parity among new entrants. Adults are generally better educated today, but some are still left behind
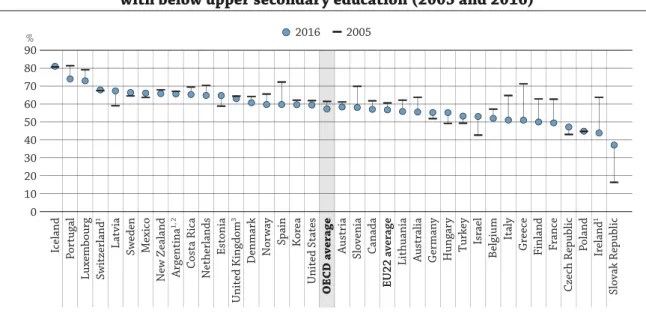
Since 2000, the workforce has become more highly educated across OECD and partner countries. Whereas in 2000, the majority of young adults had attained upper secondary education as their highest education level, today the largest share of 25-34 year-olds holds a tertiary degree. The share of young adults with below upper secondary education only has also declined in the majority of OECD and partner countries, to 16% in 2016 on average across OECD countries. Although more adults are reaching upper secondary level, completion of the programme still remains problematic. Among countries with available true cohort data, approximately 25% of students who enrolled had not graduated after two years from the theoretical end date of the programme; four out of five of these students are no longer enrolled in education. This is a critical loss: the unemployment rate for young adults (25-34 year-olds) who failed to complete upper secondary education is close to 17%, compared to 9% for those who did.
Adults with a tertiary degree benefit from substantial returns on their investment: they are 10 percentage points more likely to be employed, and will earn 56% more on average than adults who only completed upper secondary education. They are also the first to recover from economic downturns: employment rates for young adults with tertiary degrees have returned to pre-crisis levels, while rates for those who did not complete upper secondary education are still lagging behind. Tertiary-educated adults are also less likely to suffer from depression than their less-educated peers. For these reasons, young adults are increasingly inclined to pursue education that will enhance
their qualifications than to enter the labour market directly at the end of compulsory education. Between 2000 and 2016, the share of 20-24 year-olds still in education increased by 10 percentage points compared to a 9 percentage-point decrease of those in employment.
Total spending on tertiary education has outpaced student enrolments
Expenditure has been increasing at a much higher rate than student enrolments at all levels, particularly tertiary. Expenditure on primary, secondary, and post-secondary non-tertiary educational institutions increased by 4% between 2010 and 2014, although student enrolments decreased slightly over the same period. In contrast, total expenditure on tertiary institutions increased by more than twice the rate of students over the same period, reflecting the priority given by government and society to higher education.
While public expenditure on primary to tertiary institutions has clearly been rising, it did not keep up with the increase in GDP between 2010 and 2014 on average across OECD countries. This has led to a decrease of 2% in public expenditure on educational institutions as a percentage of GDP over the same period. Similarly, in half of OECD countries, the share of public spending on primary to tertiary education in total government spending declined between 2010 and 2014.
The share of public funding is significantly higher for compulsory than for tertiary education. While the public sector still provides 91% of the funds at primary, secondary and post-secondary non-tertiary levels, it only provides for 70% of total expenditure at tertiary level, leaving households to foot the rest of the bill. However, the share of public funding to education expenditure on institutions has remained generally stable between 2010 and 2014 across all levels.
Lagging salaries and an ageing workforce are ailing the teaching profession
Teachers are the backbone of the education system, yet the profession is increasingly unattractive to young students and the teaching population is getting older, particularly at higher levels of education. On average across OECD countries, 33% of primary to secondary teachers were at least 50 years old in 2015, up 3 percentage points from 2005. In addition, the profession is still largely dominated by women, who make up seven out of ten teachers on average across OECD countries. However gender parity improves at higher levels of education – while 97% of teachers at the pre-primary level are women, they make up 43% at the tertiary level.
Teachers’ salaries are low compared to other similarly educated full-time workers. This is a key obstacle for attracting young people into teaching. While salaries increase with the level of education taught, they still range between 78% and 94% of the salaries of full-time workers with tertiary education. The economic downturn in 2008 had a direct impact on teachers’ salaries, which were either frozen or cut in some countries. Between 2005 and 2015 teachers’ statutory salaries decreased in real terms in one-third of the countries and economies with available data.
Other findings
Due to lower public investment in early childhood education, the share of children enrolled in private institutions at this level is considerably larger than in primary and secondary education.
General upper secondary education programmes are more popular than vocational programmes: 37% of 15-19 year-olds are enrolled in general upper secondary education programmes, compared to 25% in vocational programmes though vocational programmes are a strong component in the educational systems of many countries.
Financial support helps offset the burden of high tuition fees charged by certain tertiary institutions; 75% or more of students in Australia, England (United Kingdom) and the United States benefit from public loans or scholarships/ grants.
Open admissions systems to public and/or private tertiary institutions can be found in more than half the countries and economies with available data. National/central examinations taken towards the end of upper secondary education, and entrance examinations administered by tertiary institutions, are most widely used for entry into first-degree tertiary programmes.
Executive summary
Education at a Glance 2017: OECD Indicators © OECD 2017
25
Primary, secondary and post-secondary non-tertiary
91% of expenditure on primary and secondary education – but only 70% of expenditure on tertiary education – from public funds
Tertiary 94 102 111 107 Pre-primary Primary 2005 30% 33% 11% 56% 56% 14% 2015 <30 years 30-49 years >=50 years 2008 2011 2014 2008 2011 2014 100 99 99 2000 25 26 2005 2010 2015 2016 50 40 30 20 10 105
Young people continue to attain higher levels of education...
Educational attainment rates (%) among 25-34 year-olds, OECD average
Are more likely to be employed: 84% compared to 74% % Below secondary Tertiary 43 16
… as higher education brings better labour
and life outcomes... ... but some are still left behind
Earn 56% more Adults with a tertiary degree
(as compared to adults with upper secondary degree only)
Are LESS likely to have suffered from depression
Yet total spending on educational institutions outpaced student enrolment
Index of change (2010 = 100) Index of change (2010 = 100)
Teacher salaries are not competitive
Teachers’ salaries relative to other tertiary-educated workers (2015) 101 Lower secondary , general Upper secondary , general programmes % 100 90 80 70
Earnings of tertiary-educated workers (=100)
The teaching force continues to age...
7 out of 10 teachers are women
… and the teaching profession attracts few men Expenditure Student enrolment Expenditure Student enrolment 95 97 104
25%
of upper secondary studentsdid not graduate two years after the end
of the programme (true cohort)
15%
of 18-24 year-olds are neither in employment
nor in education or training
The most popular degrees: business, administration and law
23%of tertiary-educated adults
22% 44%
Natural sciences, maths and stats
Engineering 6% 16% 17% 5% ICT 5% 4% Engineering ICT
Health and welfar
e
Education
Natural sciences, maths and stats Arts and humanities, social sciences, etc.
Max Min 60 100 80 Doctoral or equivalent 100 90 80 70 60 50 40 30 20 10 0 Bachelor’s or equivalent Upper secondary vocational Education 78% Health and welfare 76% Business admin. and law
54%
Natural sciences, maths and stats
50% Social sciences, journalism and information 64% Arts and humanities 63% Engineering 24% ICT 19% New entrants to tertiary education Tertiary-educated adults Science Technology Engineering Mathematics
Employment rate (%) of tertiary graduates (2016) % of graduates (2015)
Engineering is most popular among upper secondary vocational graduates, doctoral students favour natural sciences Overall, interest in scientific fields remains
stable across generations STEM are more popular at higher levels of education
Gender parity across disciplines: still a long way to go
% of women entering tertiary-level studies (2015)
STEM disciplines
Business,
administration
and law
Bachelor’s
graduates graduatesDoctoral
Business, admin. and law
Natural sciences, maths and stats Engineering
Other
STEM graduates have better employment prospects, though not across the board
OECD average