Review and
revision of
empirical
critical loads
Review and revision of empirical critical loads and
dose-response relationships
Proceedings of an expert workshop, Noordwijkerhout, 23-25 June 2010
This is a publication of:National Institute for Public Health and the Environment
P.O. Box 1 | 3720 BA Bilthoven The Netherlands
www.rivm.nl March 2011
001677
Review and revision of empirical critical loads and dose-response relationships
Proceedings of an expert workshop, Noordwijk
erhout, 23-25 June 2010
Report 680359002 / 2011
Empirical critical loads for nitrogen were reviewed, revised and finally agreed by consensus at a UNECE workshop held under the auspices of the Convention on Long-range Transboundary Air Pollution in Noordwijkerhout, The Netherlands (23-25 June 2010). Results are presented and summarized in this report. These show that in many cases the outer ranges of the empirical critical loads have decreased. The outcome of this report is of major importance for the protection of N-sensitive natural and semi-natural ecosystems across Europe.
R. Bobbink | J-P. Hettelingh (eds)
Review and revision of
empirical critical loads
and dose-response
relationships
Proceedings of an expert workshop,
Noordwijkerhout, 23-25 June 2010
Cover photo:
Grass encroachment in Danish Dunes, Korshage (source: Eva Remke, Bargerveen Foundation). Authors:
Roland Bobbink, Sabine Braun, Annika Nordin, Sally Power, Kirsten Schütz , Joachim Strengbom, Maaike Weijters, Hilde Tomassen
Editors:
Roland Bobbink* and Jean-Paul Hettelingh**
* B-WARE Research Centre (r.bobbink@b-ware.eu; www.b-ware.eu)
** Coordination Centre for Effects (jean-paul.hettelingh@rivm.nl; www.rivm.nl/cce). This research is performed by order and for the account of the Directorate for Climate and Air Quality of the Dutch Ministry of Infrastructure and the Environment within the framework of PBL project M/500090/01 and RIVM project E/680359/11, ‘UNECE Coordination Centre for Effects (CCE)’, in collaboration with the Swiss Federal Office for the Environment (FOEN) and the German Federal Ministry of the Environment, Nature Conservation and Nuclear Safety/ Federal Environment Agency (UBA), and for the account of (the Working Group on Effects within) the trust fund for the partial funding of effect-oriented activities under the Convention on Long-range Transboundary Air Pollution.
ISBN: 978-90-6960-251-6 RIVM report: 680359002 © CCE 2011
Parts of this publication may be reproduced provided that reference is made to the source. A comprehensive reference to the report reads as ‘Bobbink R and Hettelingh JP, (eds.) (2011) Review and revision of empirical critical loads and dose-response relationships, Coordination Centre for Effects, National Institute for Public Health and the Environment (RIVM), www.rivm.nl/cce.
Acknowledgements
This report is a product of the collaboration within the Effects Programme of the UNECE Convention on Long-range Transboundary Air Pollution, involving many institutions and individuals throughout Europe. We are grateful to all participants in the UNECE Workshop on the ‘Review and revision of empirical critical loads and dose-response relationships’ (23-25 June 2010, Noordwijkerhout, the Netherlands) for the fruitful discussions and their useful suggestions to improve the background documentation that finally resulted in this report.
In addition, the Coordination Centre for Effects (CCE) and B-WARE Research Centre acknowledge:
• Mariette van Empel, MSc and Dr Wil Prins of the Climate and Air Quality Directorate of the Dutch Ministry of Infrastructure and the Environment (I&M; www. rijksoverheid.nl/ministeries/ienm), Dr Martin Schiess and Mr Beat Achermann of the Swiss Federal Office for the Environment (FOEN; www.bafu.admin.ch) and Ms Gudrun Schütze of the German Federal Environment Agency (UBA; www.umweltbundesamt.de) for helping to facilitate the UNECE workshop and this report; • Dr Anne Christine Le Gall of INERIS (France), chair of the
Task Force of the International Cooperative Programme on the Modelling and Mapping of Critical Levels & Loads and Air Pollution Effects, Risks and Trends, and the members of the National Focal Centres, for their support;
• The UNECE secretariat of the Convention on Long-range Transboundary Air Pollution, for routing the executive summary of this report of the UNECE workshop in the official document ECE/EB.AIR/WG.1/2010/14 for the 29th session of the Working Group on Effects (Geneva, 22-24 September 2010);
• The review team consisting of Professor Mike Ashmore, Dr Martin Jenssen, Dr Mark Fenn, Professor Jan Roelofs and Dr Sarah Woodin, for their thorough scientific support and expert comments during the updating and drafting phase of the background document to the UNECE workshop. Furthermore, we gratefully acknow-ledge the detailed scientific comments from Professor Christian Körner, Dr Laurence Jones, Dr Eva Remke and Dr Seraina Bassin;
• Ms Karin van Doremalen, former management assistant of the CCE, for organising and managing the logistics of the UNECE workshop;
• Ms Annemieke Righart of Dunfield Editing, for her commitment and efficiency with respect to the editing of the language of the report, and for improving the consistency in terms between the chapters;
• Mr Martin Middelburg and Mr Gert Boer of the RIVM graphics department, for their collaborative and pro-active involvement to ensure the correct lay-out and printing of this report.
Rapport in het kort
Het RIVM heeft in opdracht van het ministerie van Infrastructuur en Milieu (I&M) de wetenschappelijke basis beschreven voor nieuwe drempelwaarden voor stikstofde-positie (empirische kritische destikstofde-positiewaarden). De hoeveelheid stikstof die vanuit de lucht neerslaat op de bodem is van invloed op de biodiversiteit. De empirische kritische depositiewaarden worden gebruikt om effecten van overmatige stikstofdepositie te schatten. De waarden zijn op basis van empirische veldwaarnemingen bepaald op diverse natuurtypen in Europa en zijn een update van resultaten uit 2003. In vergelijking met deze cijfers zijn nieuwe empirische kritische depositiewaarden tot stand gekomen, zoals voor oppervlaktewateren en mediterrane bossen. Daarnaast zijn enkele waarden verlaagd, zoals voor naaldbossen. Andere rapporten van het RIVM over effecten van luchtverontreiniging bevestigen dat stikstof in Europa een belangrijke risicofactor is voor onder meer veranderingen in de biodiversiteit.
Het Coordination Centre for Effects (CCE) aan het RIVM heeft het onderzoek uitgevoerd in nauwe samenwerking met Onderzoekcentrum B-WARE (Nederland), enkele Europese RIVM-zusterinstellingen en andere Europese onderzoeksinstituten. De update is in 2009 gestart door het CCE onder de auspiciën van de UNECE Conventie voor grootschalige grensoverschrijdende luchtverontreiniging. Het CCE is in 1990 op verzoek van Nederland bij de UNECE opgericht. Het werd bij het RIVM gevestigd om met diens Europese netwerk van circa dertig instituten het Europese luchtbeleid te ondersteunen. Nieuwe wetenschappelijke informatie over de effecten van stikstof op (half-) natuurlijke ecosystemen is nu opgenomen in de Europese databank van empirische kritische depositiewaarden van stikstof. Deze zijn geclassificeerd volgens het European Nature Information System (EUNIS).
Tijdens een door het CCE georganiseerde UNECE-workshop in juni 2010 hebben wetenschappers uit Europese lidstaten consensus bereikt over de resultaten. Consensus is belangrijk, omdat de effecten van stikstof binnen Europa kunnen verschillen als gevolg van variaties in meteorologische en bodemcondities.
Trefwoorden: Biodiversiteit, Kritische waarde, LRTAP Conventie, N-additie experimenten, Stikstofdepositie
Abstract
This report describes the scientific background and results from the review and revision of empirical critical loads of nitrogen that had been established for Europe in 2003 under the auspices of the UNECE Convention on Long-range Transboundary Air Pollution (LRTAP Convention). In 2009 the Coordination Centre for Effects started a project under the LRTAP Convention to bring empirical critical loads up to date. New relevant information from studies (autumn 2002 – spring 2010) on the impacts of nitrogen on natural and semi-natural ecosystems was incorporated in the existing European database on empirical critical loads of N. Empirical critical loads were structured following the classification used in the European Nature Information System (EUNIS).
Consensus on the results was obtained in a UNECE workshop on the ‘Review and revision of empirical critical loads and dose-response relationships’ (23-25 June 2010, Noordwijkerhout, the Netherlands), organised by the Coordination Centre for Effects and the B-WARE Research Centre. The results, as provided in Table 1 of the Executive Summary, show that in many cases the outer ranges of the empirical critical loads have decreased. The resulting European database of 2011 includes both revised and newly established value ranges of empirical critical loads of nitrogen for each EUNIS class. The outcome of this report is of major importance for the protection of N-sensitive natural and semi-natural ecosystems across Europe. This knowledge is used in support of European policies to abate air pollution.
Keywords: Biodiversity, Diversity, Empirical critical load, EUNIS, LRTAP Convention, N-addition experiments, Nitrogen deposition, Soil, Vegetation
Contents
Acknowledgements 3
Rapport in het kort 5
Abstract 5
Executive Summary 11
I Introduction 11
II Objectives and structure of the workshop 12
III Conclusions 12
IV Recommendations 13
Opening address at the Workshop on Review and Revision of Empirical Critical Loads and
Dose-Response Relationships, Noordwijkerhout, 23-25 June 2010 17
1 Introduction 21
1.1 Impacts of N deposition 21
1.2 Background to, and aims of the report 25
1.3 References 26
2 Updating and reviewing procedures for empirical critical loads of nitrogen 31
2.1 Updating procedure 31
2.2 Reviewing and setting values for empirical critical loads of nitrogen 32
2.3 Ecosystem classification 33
2.4 References 33
3 Effects of nitrogen deposition on marine habitats (EUNIS class A) 37
3.1 Introduction 37
3.2 Coastal salt marshes and saline reed beds (A2.5) 37
3.3 References 39
4 Effects of nitrogen deposition on coastal habitats (EUNIS class B) 43
4.1 Introduction 43
4.2 Coastal dunes and sandy shores (B1) 43
4.2.1 Shifting coastal dunes (B1.3) 43
4.2.2 Coastal stable dune grasslands (grey dunes) (B1.4) 44
4.2.3 Coastal dune heaths (B1.5) 48
4.2.4 Coastal moist to wet dune slacks (B1.8) 49
4.3 References 50
5 Effects of nitrogen deposition on inland surface water habitats (EUNIS class C) 55
5.1 Introduction 55
5.2 Surface standing waters (C1) 55
5.2.1 Atlantic soft-water lakes (part of permanent oligotrophic lakes, pools and ponds C1.1
and some elements of permanent mesotrophic water bodies C1.2) 56
5.2.2 Dune slack pools (permanent oligotrophic lakes, pools and ponds C1.16) 57
5.2.3 Oligotrophic boreal and alpine lakes (part of C1.1 and C1.4) 58
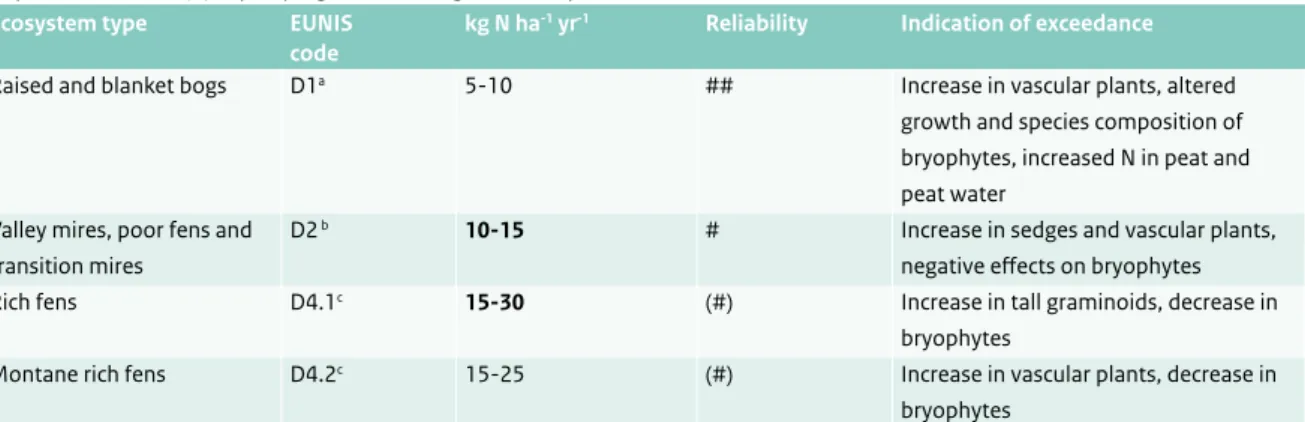
6 Effects of nitrogen deposition on mire, bog and fen habitats (EUNIS class D) 65
6.1 Introduction 65
6.2 Raised and blanket bogs (D1) 66
6.3 Valley mires, poor fens and transition mires (D2) 75
6.4 Base-rich fens (D4) 77
6.5 References 80
7 Effects of nitrogen inputs in grasslands and lands dominated by forbs, mosses and lichens
(EUNIS class E) 87
7.1 Introduction 87
7.2 Dry grasslands (E1) 88
7.2.1 Perennial calcareous grassland and basic steppes (E1.2) 88
7.2.2 Mediterranean xeric grassland (E1.3) 92
7.2.3 Non-Mediterranean dry acid and neutral closed grassland (E1.7) 92
7.2.4 Non-Mediterranean dry acid and neutral open grassland, including inland dune
grassland (E1.9) 96
7.3 Mesic grasslands (E2) 96
7.3.1 Low- and medium-altitude hay meadows (E2.2) 96
7.3.2 Mountain hay meadows (E2.3) 97
7.4 Seasonally wet and wet grasslands (E3) 97
7.4.1 Moist or wet oligotrophic grassland (E3.5) 97
7.5 Alpine and subalpine grasslands (E4) 99
7.5.1 Moss- and lichen-dominated mountain summits, ridges and exposed slopes (E4.2) 99 7.5.2 Alpine and subalpine acid (E4.3) and calcareous (E4.4) grasslands 100
7.6 References 102
8 Effects of nitrogen deposition on heathland, scrub and tundra habitats (EUNIS class F) 107
8.1 Introduction 109
8.2 Tundra (F1) and Arctic, alpine and subalpine scrub habitats (F2) 110
8.2.1 Tundra (F1) 110
8.2.2 Arctic, alpine and subalpine scrub habitats (F2) 113
8.3 Temperate shrub habitats: wet and dry heaths (F4.1 and F4.2) 114
8.3.1 ‘U’ Calluna-dominated wet heath (upland moorland) (F4.11) 115
8.3.2 ‘L’ Erica tetralix-dominated wet heath (lowland) (F4.11) 119
8.3.3 Dry heaths (F4.2) (mostly sub-Atlantic Calluna-Genista heaths (F4.22)) 120
8.4 Maquis, arborescent, matorral and thermo-Mediterranean brushes (F5) 125
8.5 References 127
9 Effects of nitrogen deposition on woodland, forest and other wooded land (eunis class G) 135
9.1 Introduction 135
9.2 Effects of N deposition on broadleaved and temperate coniferous forests
(G1, G3.1, G3.4, G3.5, G3.7 and G3.6) 136
9.2.1 Effects on soil processes 136
9.2.2 Effects of nitrogen deposition on growth, nutrition, physiology and parasite attacks on trees 139
9.2.3 Effects of nitrogen deposition on biodiversity of forests 146
9.2.4 Summary of empirical critical loads for coniferous and deciduous forests 152 9.3 Effects of N deposition on spruce and pine taiga woodlands (G3.A and G3.B) 152
9.3.1 Soil processes 152
9.3.2 Effects on biodiversity in taiga woodlands 153
9.4 Additional differentiations between empirical critical loads for forest ecosystems (EUNIS level 3) 159 9.5 Summary of empirical critical loads of N for woodland and forest (EUNIS Class G) 160
10 Overview of the relationship between exceedances of N critical loads and plant species
diversity at the European scale 175
10.1 Introduction 175
10.2 Approach 176
10.3 Relationships between plant species richness and exceedances 177
10.3.1 Grassland and tall forb habitats (E) 177
10.3.2 Arctic, alpine and subalpine habitats (F2) 177
10.3.3 Taiga woodlands (G3 A-C) 177
10.4 Conclusions 178
10.5 References 179
11 Conclusions and gaps in knowledge 183
11.1 Conclusions 183
11.2 Gaps in knowledge and research needs 188
11.3 References 189
Appendices 191
Appendix 1 193
Classification of habitats according to EUNIS and EU Habitats Directive (Natura2000) 193
Appendix 2 197
References for the critical load ranges for non-taiga woodlands 197
Appendix 2A: N-addition experiments 197
Appendix 2B: Gradient and resampling studies 203
Appendix 3 211
References for the critical load ranges for taiga woodlands 211
Appendix 3A: N-addition experiments 211
Appendix 3B: Gradient and resampling studies 215
Appendix 4 217
Proposed new empirical critical loads of nutrient N for fresh waters, based on ICP Waters report 217
Reference 218
Appendix 5 219
Report of Working Group 1: Marine habitats (A), Coastal habitats (B), Inland surface waters (C) and
Grasslands and lands dominated by forbs, mosses or lichens (E) 219
Appendix 6 225
Report of Working Group 2: Mires, Bogs and Fens (D) and Heathland, Scrub and Tundra (F) 225
Appendix 7 229
Report of Working Group 3: Forest and woodland habitats (G) 229
Appendix 8 235
List of Participants 235
Appendix 9 241
Agenda of the Workshop on the Review and Revision of Empirical Critical Loads and Dose-response
Executive Summary
I Introduction
1. The workshop on the review and revision of empirical critical loads and dose-response relationships was held under the Convention on Long-range Transboundary Air Pollution, in Noordwijkerhout, from 23 to 25 June 2010. The workshop was organised by the Coordination Centre for Effects (CCE) and supported by the Dutch Ministry of Housing Spatial Planning and the Environment, the Swiss Federal Office for the Environment and the German Federal Environment Agency.
2. The workshop was attended by 51 participants from the Czech Republic, France, Germany, Ireland, the
Netherlands, Norway, Portugal, Romania, Spain, Sweden, Switzerland, the United Kingdom and the United States, and by representatives from the
International Cooperative Programme (ICP) on ICP Waters, ICP Vegetation and ICP Modelling and Mapping. The secretariat to the Convention was not represented. 3. The decision to organise the workshop was adopted at
the 27th session of the Working Group on Effects, following recommendations from the 18th CCE workshop (21-23 April 2008) as supported by the 24th session of the Task Force on Modelling and Mapping (24-25 April 2008) held in Berne.
4. The meeting was opened by M.G. van Empel, Director of the Climate and Air Quality Directorate of the Dutch Ministry of Housing, Spatial Planning and the Environment (VROM).
Jean-Paul Hettelingh, Hilde Tomassen, Roland Bobbink
Workshop on the Review and Revision of Empirical Critical Loads and Dose-response Relationships Under the UNECE Convention on Long-range Transboundary Air Pollution
at the NH Conference Centre Leeuwenhorst,
Langelaan 3, 2211 XT Noordwijkerhout, The Netherlands, 23-25 June 2010.
5. The Status of the Convention was presented by A.C. Le Gall, chair of the Task Force on Modelling and Mapping, on behalf of the Secretariat to the Convention
II Objectives and structure of the
workshop
6. The workshop had the following objectives: a. Review and revise the empirical critical loads of
nitrogen for natural and semi-natural ecosystems, set at an expert workshop held in Berne from 11 to 13 November 2002 (see Achermann and Bobbink, 2003)1, on the basis of additional scientific information available for the period from late 2002 to 2010, as presented in a new and updated background document.
b. Provide guidance on how to use site-specific, modifying factors to improve the national application of the empirical approach.
c. Review relationships between exceedances of the empirical critical loads and species diversity on a European scale, together with possible regional applications.
7. The following classes according to the EUropean Nature Information System (EUNIS) were addressed: marine habitats (EUNIS class A), coastal habitats (EUNIS class B), inland surface waters (EUNIS class C), mires, bogs and fens (EUNIS class D), grasslands and lands dominated by forbs, mosses or lichens (EUNIS class E), heathland, scrubland and tundra (EUNIS class F), woodland, forest and other wooded land (EUNIS class G)
8. An international team of scientists (R. Bobbink, S. Braun, A. Nordin, K. Schütz, J. Strengbom, M. Weijters, H. Tomassen) prepared the background documentation for each EUNIS class. This documentation was reviewed by B. Achermann, M. Ashmore, M. Fenn, J-P. Hettelingh, M. Jenssen, S. Power, J.G.M. Roelofs, G. Schütze, and S. Woodin.
9. Deliberations on the background documentation, empirical critical loads, modifying factors and further work were structured in three Working Groups, the tasks of which were outlined in guidelines designed by R. Bobbink and J-P. Hettelingh:
1 Achermann, B. and Bobbink, R. (eds.) (2003). Empirical critical loads
for nitrogen. Environmental Documentation No.164 Air, pp. 43-170. Swiss Agency for Environment, Forest and Landscape SAEFL, Berne.
a. Working Group on marine habitats, coastal habitats, inland surface waters and grassland habitats (chair: J. Roelofs; Rapporteur: M. Ashmore)
b. Working Group on mire, bog and fen habitats and heathland, scrub and tundra habitats (chair: S. Woodin; Rapporteur : S. Power)
c. Working Group on forest and woodland habitats (chair: J. Strengbom and M. Jenssen; Rapporteur: M. Fenn)
10. The working groups exchanged their progress in short plenary sessions. Results, conclusions and recommen-dations were discussed and summarised in a final plenary session chaired by J-P. Hettelingh.
III. Conclusions
11. Statistically and biologically significant outcomes of field addition experiments and mesocosm studies were the basis for the assessment of empirical N critical loads. Only studies which have independent N treatments and realistic N loads and durations (below 100 kg N ha-1 yr-1; more than 1 yr) were used for the updating and refinement of critical load values. In cases where no appropriate N-addition studies were available, gradient and retrospective studies were given a higher weight.
12. Studies with higher N additions or shorter experimental periods were only interpreted with respect to the understanding of effects mechanisms, possible N limitation or sensitivity of the system. The methods used in these studies were carefully scrutinised to identify factors related to the experimental design or data analysis, which may constrain their use in assessing critical loads. This includes evaluation of the precision of the estimated values of background deposition at the experimental site.
13. Empirical critical loads for levels 2 and 3 of the EUNIS classification were agreed on for a range of deposition values for all EUNIS classes, including forest and woodland habitats (EUNIS class G). New results regarding nitrogen effects in surface waters could be included on the basis of activities presented by the ICP Waters. Novel findings for some Mediterranean species could be adopted as well. The reliability of empirical critical loads was qualitatively established, distin-guishing between ‘reliable’, ‘quite reliable’ and ‘expert judgement’ symbolised by ##, # and (#), respectively.
14. Empirical critical loads for nitrogen resulting from the reviewing and revising procedure were agreed by consensus at the workshop, as summarised in Table 1. Table 1 also includes the range and reliability of the empirical critical loads established in Achermann and Bobbink (2003)1, for comparison.
15. Additional qualitative information, in comparison to recommendations provided in Achermann and Bobbink (2003)1, on how to interpret the agreed ranges of critical loads in specific situations for an ecosystem was assigned to a number of modifying factors. However, short of agreement on how to quantify modifying factors for assessments on broad regional scales, consensus was reached to use the minimum value of the ranges of empirical critical loads in every EUNIS class to enable the comparison of their exceedances between different air pollution abatement scenarios. 16. To assess effects of exceedances on broad regional
scales, it was agreed that specific relationships between the nitrogen load and relevant indicators (see Chapter 10) could be considered, provided that results would only be presented to compare the environmental risk of scenarios in relative terms.
IV. Recommendations
17. More well-designed experiments with a wide range of N additions at sites with low background deposition are still urgently needed for several (possible) sensitive EUNIS classes or in regions with many unstudied ecosystems, if any more significant progress is to be made in defining and improving empirical critical loads in the coming years.
18. An increasing number of gradient (survey) studies with respect to atmospheric N deposition have been reported or recently initiated. More rigorous guidelines should be identified for evaluation of these studies, covering the estimation of deposition rates, the quantification of confounding factors and the applica-tion of methods for statistical analysis. It is recommen-ded to organise a separate expert workshop on this topic.
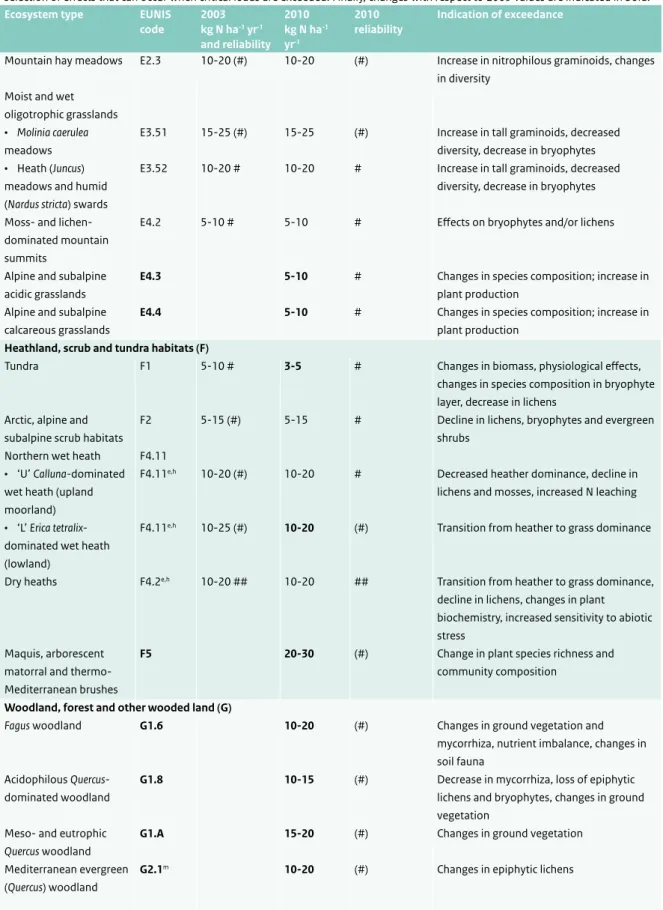
Table 1 Overview of empirical critical loads of nitrogen deposition (kg N ha-1 yr-1) to natural and semi-natural ecosystems (column 1), classified according to EUNIS (column 2), as originally established in 2003 (column 3), and as revised in 2010 (column 4).The reliability is qualitatively indicated by ## reliable; # quite reliable and (#) expert judgement (column 5). Column 6 provides a selection of effects that can occur when critical loads are exceeded. Finally, changes with respect to 2003 values are indicated in bold. Ecosystem type EUNIS
code 2003 kg N ha-1 yr-1 and reliability 2010 kg N ha-1 yr-1 2010 reliability Indication of exceedance Marine habitats (A)
Mid-upper salt marshes A2.53 20-30 (#) Increase in dominance of graminoids
Pioneer and low-mid salt marshes
A2.54 and A2.55
30-40 (#) 20-30 (#) Increase in late-successional species, increase in productivity
Coastal habitats (B)
Shifting coastal dunes B1.3 10-20 (#) 10-20 (#) Biomass increase, increased N leaching Coastal stable dune
grasslands (grey dunes)
B1.4a 10-20 # 8-15 # Increase in tall graminoids, decrease in prostrate plants, increased N leaching, soil acidification, loss of typical lichen species Coastal dune heaths B1.5 10-20 (#) 10-20 (#) Increase in plant production, increased N
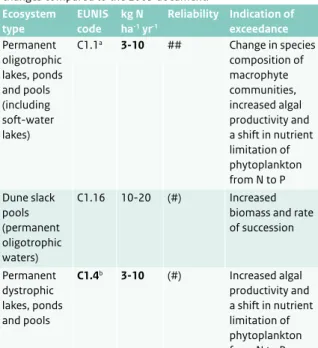
leaching, accelerated succession Moist to wet dune slacks B1.8b 10-25 (#) 10-20 (#) Increased biomass of tall graminoids Inland surface water habitats (C)n
Permanent oligotrophic lakes, ponds and pools (including soft-water lakes)
C1.1c 5-10 ## 3-10 ## Change in the species composition of macrophyte communities, increased algal productivity and a shift in nutrient limitation of phytoplankton from N to P
Dune slack pools (permanent oligotrophic waters)
C1.16 10-20 (#) 10-20 (#) Increased biomass and rate of succession
Permanent dystrophic lakes, ponds and pools
C1.4d 3-10 (#) Increased algal productivity and a shift in
nutrient limitation of phytoplankton from N to P
Mire, bog and fen habitats (D)
Raised and blanket bogs D1e 5-10 ## 5-10 ## Increase in vascular plants, altered growth and species composition of bryophytes, increased N in peat and peat water Valley mires, poor fens
and transition mires
D2f 10-20 # 10-15 # Increase in sedges and vascular plants, negative effects on bryophytes Rich fens D4.1g 15-35 (#) 15-30 (#) Increase in tall graminoids, decrease in
bryophytes
Montane rich fens D4.2g 15-25 (#) 15-25 (#) Increase in vascular plants, decrease in bryophytes
Grasslands and lands dominated by forbs, mosses and lichens (E) Sub-Atlantic semi-dry
calcareous grasslands
E1.26 15-25 ## 15-25 ## Increase in tall grasses, decline in diversity, increased mineralisation, N leaching; surface acidification
Mediterranean xeric grasslands
E1.3 15-25 (#) Increased production, dominance by
graminoids Non-Mediterranean dry
acidic and neutral closed grasslands
E1.7b 10-20 # 10-15 ## Increase in graminoids, decline in typical species, decrease in total species richness
Inland dune pioneer grasslands
E1.94b 10-20 (#) 8-15 (#) Decrease in lichens, increase in biomass
Inland dune siliceous grasslands
E1.95b 10-20 (#) 8-15 (#) Decrease in lichens, increase in biomass, increased succession
Low and medium altitude hay meadows
Table 1 Overview of empirical critical loads of nitrogen deposition (kg N ha-1 yr-1) to natural and semi-natural ecosystems (column 1), classified according to EUNIS (column 2), as originally established in 2003 (column 3), and as revised in 2010 (column 4).The reliability is qualitatively indicated by ## reliable; # quite reliable and (#) expert judgement (column 5). Column 6 provides a selection of effects that can occur when critical loads are exceeded. Finally, changes with respect to 2003 values are indicated in bold. Ecosystem type EUNIS
code 2003 kg N ha-1 yr-1 and reliability 2010 kg N ha-1 yr-1 2010 reliability Indication of exceedance
Mountain hay meadows E2.3 10-20 (#) 10-20 (#) Increase in nitrophilous graminoids, changes in diversity
Moist and wet oligotrophic grasslands • Molinia caerulea meadows
E3.51 15-25 (#) 15-25 (#) Increase in tall graminoids, decreased diversity, decrease in bryophytes • Heath (Juncus)
meadows and humid (Nardus stricta) swards
E3.52 10-20 # 10-20 # Increase in tall graminoids, decreased diversity, decrease in bryophytes
Moss- and lichen-dominated mountain summits
E4.2 5-10 # 5-10 # Effects on bryophytes and/or lichens
Alpine and subalpine acidic grasslands
E4.3 5-10 # Changes in species composition; increase in
plant production Alpine and subalpine
calcareous grasslands
E4.4 5-10 # Changes in species composition; increase in
plant production Heathland, scrub and tundra habitats (F)
Tundra F1 5-10 # 3-5 # Changes in biomass, physiological effects,
changes in species composition in bryophyte layer, decrease in lichens
Arctic, alpine and subalpine scrub habitats
F2 5-15 (#) 5-15 # Decline in lichens, bryophytes and evergreen shrubs
Northern wet heath F4.11 • ‘U’ Calluna-dominated wet heath (upland moorland)
F4.11e,h 10-20 (#) 10-20 # Decreased heather dominance, decline in lichens and mosses, increased N leaching
• ‘L’ Erica tetralix-dominated wet heath (lowland)
F4.11e,h 10-25 (#) 10-20 (#) Transition from heather to grass dominance
Dry heaths F4.2e,h 10-20 ## 10-20 ## Transition from heather to grass dominance, decline in lichens, changes in plant biochemistry, increased sensitivity to abiotic stress
Maquis, arborescent matorral and thermo-Mediterranean brushes
F5 20-30 (#) Change in plant species richness and
community composition
Woodland, forest and other wooded land (G)
Fagus woodland G1.6 10-20 (#) Changes in ground vegetation and
mycorrhiza, nutrient imbalance, changes in soil fauna
Acidophilous Quercus-dominated woodland
G1.8 10-15 (#) Decrease in mycorrhiza, loss of epiphytic
lichens and bryophytes, changes in ground vegetation
Meso- and eutrophic Quercus woodland
G1.A 15-20 (#) Changes in ground vegetation
Mediterranean evergreen (Quercus) woodland
Table 1 Overview of empirical critical loads of nitrogen deposition (kg N ha-1 yr-1) to natural and semi-natural ecosystems (column 1), classified according to EUNIS (column 2), as originally established in 2003 (column 3), and as revised in 2010 (column 4).The reliability is qualitatively indicated by ## reliable; # quite reliable and (#) expert judgement (column 5). Column 6 provides a selection of effects that can occur when critical loads are exceeded. Finally, changes with respect to 2003 values are indicated in bold. Ecosystem type EUNIS
code 2003 kg N ha-1 yr-1 and reliability 2010 kg N ha-1 yr-1 2010 reliability Indication of exceedance
Abies and Picea woodland G3.1 10-15 (#) Decreased biomass of fine roots, nutrient
imbalance, decrease in mycorrhiza, changed soil fauna
Pinus sylvestris woodland south of the taiga
G3.4 5-15 # Changes in ground vegetation and
mycorrhiza, nutrient imbalances, increased N2O and NO emissions
Pinus nigra woodland G3.5 15 (#) Ammonium accumulation
Mediterranean Pinus woodland
G3.7 3-15 (#) Reduction in fine-root biomass, shift in
lichen community
Spruce taiga woodland G3.Ai 10-20 # 5-10 ## Changes in ground vegetation, decrease in mycorrhiza, increase in free-living algae Pine taiga woodland G3.Bi 10-20 # 5-10 # Changes in ground vegetation and in
mycorrhiza, increase in occurrence of free-living algae
Mixed taiga woodland with Betula
G4.2 5-8 (#) Increased algal cover
Mixed Abies-Picea Fagus woodland
G4.6 j 10-20 (#)
Overall
Broadleaved deciduous woodland
G1k,l 10-20 # 10-20 ## Changes in soil processes, nutrient imbalance, altered composition mycorrhiza and ground vegetation
Coniferous woodland G3k,l 10-20 # 5-15 ## Changes in soil processes, nutrient imbalance, altered composition mycorrhiza and ground vegetation
a) For acidic dunes, the 8 to 10 kg N ha-1 yr-1 range should be applied, for calcareous dunes this range is 10 to 15 kg ha-1 yr-1. b) Apply the lower end of the range to habitats with a low base availability; and the higher end of the range to those with high base availability.
c) This critical load should only be applied to oligotrophic waters with low alkalinity with no significant agricultural or other human inputs. Apply the lower end of the range to boreal, sub-Arctic and alpine lakes, and the higher end of the range to Atlantic soft waters.
d) This critical load should only be applied to waters with low alkalinity with no significant agricultural or other direct human inputs. Apply the lower end of the range to boreal, sub-Arctic and alpine dystrophic lakes.
e) Apply the high end of the range to areas with high levels of precipitation and the low end of the range to those with low precipitation levels; apply the low end of the range to systems with a low water table, and the high end of the range to those with a high water table. Note that water tables can be modified by management.
f) For EUNIS category D2.1 (valley mires): use the lower end of the range (#). g) For high-latitude systems, apply the lower end of the range.
h) Apply the high end of the range to areas where sod cutting has been practiced; apply the lower end of the range to areas with low-intensity management.
i) In 2003 presented as overall value for boreal forests. j) Included in studies that were classified under G1.6 and G3.1. k) In 2003 presented as overall value for temperate forests. l) For application at broad geographical scales.
m) This critical load has been based on one European study in Portugal and evidence from studies in Mediterranean woodlands in California. During the final editing procedure of this report it became clear that the ambient background deposition of N in the Portuguese study had not been taken into account; therefore, the critical load was subsequently adapted to this value. n) See Appendix 4 for recent findings by the International Cooperative Programme on Waters under the LRTAP Convention.
Opening address at the
Workshop on Review and
Revision of Empirical Critical
Loads and Dose-Response
Relationships,Noordwijkerhout,
23-25 June 2010
The Workshop on the Review and Revision of Empirical Critical Loads and Dose Response Relationships in Noordwijkerhout will evaluate and possibly revise the empirical critical loads of nitrogen for natural and semi-natural ecosystems, set in 2002. Since then additional scientific information has become available, which has provided new insights into the relationships between nitrogen deposition and its effects on ecosystems and health.
This expert meeting, which is co-organised together with the Swiss Federal Office for the Environment and the German Federal Environment Agency, serves to review and evaluate this new knowledge and its significance for policy makers. With the help of this new knowledge we will be able to determine with more accuracy the maximum levels of nitrogen deposition which do not affect biodiversity and health, the so-called no-effects level. These revised critical loads are crucial to setting ambitious targets for the reduction of nitrogen emissions. Therefore, this workshop
Scientific work provides the foundation under successful air quality policy M. G. van Empel, MSc
Director Climate and Air Quality Directorate
Ministry of Infrastructure and the Environment, The Netherlands
is of importance to the revision of the Gothenburg Protocol which is currently underway.
For over three decennia the Netherlands has implemented a two-track policy towards the mitigation of transboundary air pollution. The first track, being based on studying the effects of nitrogen deposition on ecosystems and human health, provides the scientific basis for the second, policy track, which aims at setting targets and establishing measures for the reduction of nitrogen emissions. However because air pollution is not halted by national borders, our aim is also to reach consensus on reduction policy between the countries within the UNECE region and beyond. In this respect special attention is given to the countries of Eastern Europe, Caucasus and Central Asia. Supported by like-minded countries, many of which are represented here, this two-track policy approach has been successfully introduced to the Convention of Long-range Transboundary Air Pollution (CLRTAP). This workshop is a clear example of the effects-based approach of the Convention.
The Netherlands strongly supports the scientific work which provides the foundation under the Convention. The Coordination Centre for Effects (CCE), which has prepared the workshop in Noordwijkerhout, is the Programme Centre for the International Cooperative Programme (ICP) on Modelling and Mapping. It develops methodologies for modelling and mapping the effects of transboundary air pollution. The Netherlands is also the lead country of the Task Force on Integrated Assessment Modelling (TFIAM), which calculates possible national emission ceilings with the help of computer models.
Nitrogen increasingly challenges environmental quality, biodiversity, human wellbeing and health. Because of its reactive properties nitrogen compounds occur in different forms in the air, water and on the soil. Moreover, one single nitrogen molecule can, in time, affect biodiversity and public health and contribute to climate change as well. What is needed, therefore, is an integrated policy approach which means that measures for the reduction of all types of nitrogen, such as ammonia, nitrate and nitrous oxide, are taken simultaneously.
This in order to prevent that the problem is just passed on and, for example, a reduction of ammonia emissions from agriculture to the air leads to the increase of nitrate in the ground water.
We are also increasingly becoming aware of the important role of nitrogen towards climate change. Although these relationships are complicated and yet not fully understood, it is nevertheless clear that any successful climate policy needs to take into account measures related to nitrogen. It is necessary to look for synergies between policies towards air pollution and climate change in order to reinforce the mutual effects and to prevent counteracting measures. Therefore, in addition to the effects of nitrogen with respect to eutrophication, the relationship with climate change is the second reason why the Netherlands calls for high ambition in the revision of the Gothenburg Protocol.
The Netherlands has much to gain from the Convention on Long-Range Transboundary Air Pollution. The reason is that the Netherlands is small and has to deal with many foreign countries. This has implications for many policy issues, including the economy and the environment. Half of the concentrations and depositions of all well-known air pollutants in the Netherlands stem from foreign countries. In addition, the major share of Dutch emissions is exported out of the Netherlands. Therefore, an
international coordinated abatement policy will contribute to a level playing field which is both beneficial to our economic competitiveness as well as to environmental quality.
Furthermore, I would like to stress the importance of the outcome of this workshop. First of all, critical loads are at the basis of all international agreements on air quality. The revised critical loads resulting from this workshop will be incorporated in the GAINS-model that is used to calculate desirable emission ceilings for nitrogen. That makes them an important building stone for the revision of the Gothenburg Protocol, as well as for the NEC directive. However, the scientific work to improve empirical critical loads will not only be used to support air pollution policies. It is also of importance in support of policies in the field of biodiversity, for example, to maintain ecosystem-services that are important to human well-being. Globally, nitrogen deposition is a headline indicator under the Convention on Biological Diversity. In Europe, data on the exceedance of critical loads of nitrogen are used in support of the targets to halt biodiversity loss in Natura 2000 areas.
Although this workshop is first of all a scientific meeting, I would also like to stress the urgency of the outcomes of your work in support of air pollution policies in the near future.
As a consequence, I am looking forward to the report and the application of the results of this workshop in the mapping manual. In addition, I hope that the outcome of this workshop will contribute to maintain the ecological richness and the beautiful landscapes of natural areas in the whole UNECE region.
Chapter 1
1.1 Impacts of N deposition
Emissions of ammonia (NH3) and nitrogen oxides (NOx) strongly increased in the second half of the 20th century. Ammonia is volatilised from intensive agricultural systems, such as dairy farming and intensive animal husbandry, whereas nitrogen oxides originate mainly from burning of fossil fuel by traffic, industry and households. Because of short- and long-range transport of these nitrogenous compounds, atmospheric nitrogen (N) deposition has clearly increased in many natural and semi-natural ecosystems across the world. Areas with high atmospheric N deposition (20-80 kg N ha-1 yr-1) nowadays are central and western Europe, eastern United States and, since the 1990s, eastern Asia (e.g., Galloway and Cowling, 2002; Dentener et al., 2006).
The availability of nutrients is one of the most important abiotic factors which determine plant species composition in ecosystems. N is the primary limiting nutrient for plant growth in many natural and semi-natural ecosystems, especially for oligotrophic and mesotrophic habitats. Most of the plant species in such ecosystems are adapted to nutrient-poor conditions, and can only survive or compete successfully on soils with low N availability (e.g., Tamm, 1991; Aerts and Chapin, 2000). The series of events which occurs when N inputs increase in an area with originally low background deposition rates is highly complex. Many ecological processes interact and operate at different
temporal and spatial scales. As a consequence, high variations in sensitivity to atmospheric N deposition have been observed between different natural and semi-natural ecosystems. Despite this diverse sequence of events, the most obvious effects of increased N deposition are significant changes in the N cycle, vegetation composition and biodiversity. For more details, see Bobbink et al. (1998; 2010).
Many ecological processes interact and operate at different temporal and spatial scales. Furthermore, N is the limiting nutrient for plant growth in many natural and semi-natural ecosystems, especially oligotrophic and mesotrophic habitats. The severity of the impacts of atmospheric N deposition depends on a number of factors, of which the most important are (numbers not being a ranking): (1) the duration and total amount of inputs, (2) the chemical and physical form of the airborne N input, (3) the intrinsic sensitivity of the plant and animal species present, (4) the abiotic conditions, including climate, and (5) the past and present land use or manage-ment. Acid neutralising capacity (ANC), soil nutrient availability, and soil factors that influence the nitrification potential, N immobilisation and denitrification rates, are especially important. As a consequence, different ecosystems show high variability in sensitivity to atmos-pheric N deposition (Bobbink et al., 2010). Despite this highly diverse sequence of events, it is possible to generalise some types of impacts. A schematic overview of
1
the potential sequence of events is given in Figure 1.1.
(a) Direct toxicity of N gases and aerosols to individual species
An important effect of nitrogenous gases, aerosols and dissolved compounds (NH3,NO2, NO, HNO3 and NH4+) can be direct toxicity to the above-ground parts of individual plants. The impacts have been mostly studied in crops and saplings, but studies with native plant species or mixtures of species in open-top chambers (OTCs) and free-air fumigation have also demonstrated leaf injury, changes in physiology, and growth reductions at increased concentra-tions of just-mentioned N pollutants (e.g., Pearson and Stewart, 1993; Grupa, 2003; Sheppard et al., 2009). Direct toxicity impacts of NO2 were observed in parts of Europe and North America in the 1980s, but are currently rare in these regions, except in cities or in the direct neighbour-hood of roads with heavy traffic. However, concentrations of these nitrogen oxides in air are now increasing in large areas of Asia (primarily China and India), possibly leading again to direct foliar impacts. In addition, lichens are clearly the most sensitive group in the vegetation with respect to direct toxicity of NH3 (e.g., Hallingbäck, 1992; Van Herk et al., 2003). This, based on data from the United Kingdom, Italy and Portugal, has recently led to a significant lowering of the long-term critical level of NH3 for ecosystems in which lichens and bryophytes are important (Cape et al., 2009; Sutton et al., 2009).
Furthermore, it became obvious that the exceedances of this new critical level occur in many areas of North-western Europe (Sutton et al., 2009).
(b) Eutrophication
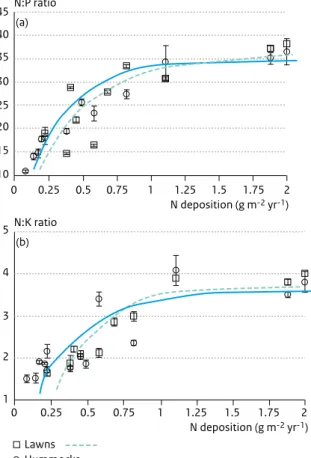
N is the limiting nutrient for plant growth in many natural and semi-natural terrestrial ecosystems, especially under oligotrophic and mesotrophic conditions. Increased N deposition results in an increase in the availability of inorganic N in the topsoil, in the short term, except in bogs and fens. This gradually leads to an increase in plant productivity in N-limited vegetation, and thus to higher annual litter production and litter with high concentrations of N. Because of this, N mineralisation will also gradually increase, which, in turn, may increase plant productivity. This is a positive feedback, because higher N mineralisa-tion leads to higher N uptake and its subsequent effects. Local plant species diversity increases with increasing resource availability at originally very low levels of resource availability. Above a certain level of primary productivity, however, local plant species diversity declines as production increases. Observational studies across N deposition gradients, and many N-addition experiments, demonstrate this effect in the long term. Competitive exclusion (‘overshading’) of characteristic species of oligotrophic or mesotrophic habitats occurs in the presence of relatively fast-growing nitrophilic species, with
Figure 1.1 Scheme of the main impacts of increased N deposition on ecosystems. Stress is considered to occur when external constraints limit the rate of dry matter production of the vegetation, whereas disturbance consists of mechanisms which affect soils and plant biomass by causing its partial or total destruction.
rare species at low abundances being especially at risk (Figure 1.2) (e.g., Bobbink et al., 1998; Suding et al., 2005). The rate of N cycling in the ecosystem is clearly increased in such situations, although the response time to increased N inputs can be long in highly organic soils (with high C:N ratios), or, indeed in any soil with large potential N sinks. When N is no longer limiting in the ecosystem, plant growth becomes limited by other resources, such as phosphorus (P), potassium (K), magnesium (Mg), or water. In this situation, the productivity of the vegetation will not increase any further with continuing increases in N. However, N concentrations within the plants do tend to increase when N availability continues to increase. This may affect the palatability of the vegetation for herbivores or the sensitivity to pathogens (see below), and will influence microbial communities, too. Recently, it has been suggested that after a shift from N to P limitation or in highly P-limited situations, changes in plant species composition can gradually still occur under long-term N inputs (see Chapter 6 for examples).
(c) Acidification
Soil acidification is characterised by a wide variety of long-term effects. It is defined as the loss of acid neutralis-ing capacity (ANC) and may lead to a decrease in soil pH. Changes in pH are dependent on the buffering capacity of the soil (e.g., Ulrich 1983; 1991). Acidifying compounds (N and S) deposited on calcareous soils (including substrates of young moraine regions) at first will not change soil acidity. In these soils HCO3- and Ca2+ ions leach from the system, but the pH remains the same until almost all of the calcium carbonate has been depleted. In soils dominated by silicate minerals (pH 6.5-4.5), buffering is taken over by cation exchange processes of the soil adsorption complexes. In this situation, protons are exchanged with Ca2+ and Mg2+, and these cations are leached from the soil together with anions (mostly nitrate or sulphate). Because of the restricted capacity of this
buffering system, soil pH will soon start to decrease. However, in mineral soils with a large cation exchange capacity and high base saturation, this buffering may continue for several decades, even at relatively high inputs.
At low pH (< 5.0), hydrous oxides of several metals dissolve. This causes a strong increase in the levels of toxic Al3+ and other metals in the soil solution. As a result of the decrease in pH, nitrification is strongly hampered or even completely absent in most of these highly acidic soils. This may lead to accumulation of ammonium, with nitrate levels decreasing to almost zero (e.g., Roelofs et al., 1985). In addition, the decomposition rate of organic material in the soil is lower in these acidified soils, which leads to increased accumulation of litter (e.g., Van Breemen et al., 1982; Ulrich, 1983; 1991). As a result of this cascade of changes, plant growth and species composition of the vegetation can be seriously affected: acid-resistant plant species will gradually become dominant, and several species typical to intermediate and higher soil pH will disappear.
(d) Differences in effects of oxidised versus reduced N
Emissions of ammonia (NH3) and nitrogen oxides (NOx) both contribute to atmospheric N deposition. Ammonia is volatilised from agricultural systems, such as dairy farming and intensive animal husbandry, whereas nitrogen oxides originate mainly from burning of fossil fuels in economic sectors including traffic (also by vehicle catalysts which may be a locally important source of N deposition), households and industry (Truscott et al., 2005). Because of this difference in sources (i.e. agriculture vs industry, households or traffic) and different rates of deposition from the atmosphere, the spatial and temporal patterns of deposition differ between reduced and oxidised com-pounds. Oxidised N deposition prevails in urban or industrial areas, whereas reduced N deposition clearly dominates in agricultural or rural regions. Furthermore, in most regions with a relatively high rate of N deposition, a Figure 1.2 A chalk grassland vegetation (Mesobromion erecti) (E1.2) in the Netherlands without N addition (left) and after three years of N addition (100 kg N ha-1 yr-1) (right). Photo: R. Bobbink.
high proportion of the deposited N originates from NHy (e.g., Asman et al., 1998; Fowler, 2002; Sutton et al., 2008). This may cause a change in the dominant N form in the soil from nitrate to ammonium, especially in habitats with low rates of nitrification (pH < 4.5).
The response of sensitive plant species can be significantly affected by this change in N form. Species of calcareous or slightly acidic soils are able to use nitrate, or a combina-tion of nitrate and ammonium, as their N source, whereas early studies showed that species of acidic habitats generally use ammonium (e.g., Gigon and Rorison, 1972; Kinzel, 1982), because at least some of these plants do not have nitrate reductase (Ellenberg, 1996). For several plant species reduced N appeared to be only toxic at low pH (Lucassen et al., 2003). Laboratory and field studies demonstrate that the performance of most forest understory species of deciduous forests in southern Sweden improves when not only ammonium but also nitrate can be taken up (Falkengren-Grerup, 1998; Olsson and Falkengren-Grerup, 2000).
One of the impacts of increased ammonium uptake is a reduced uptake of base cations and exchange of these cations (K+, Ca2+ and Mg2+) to the rhizosphere. Ultimately this can lead to severe nutritional imbalances, which are important in the decline in tree growth in areas with high
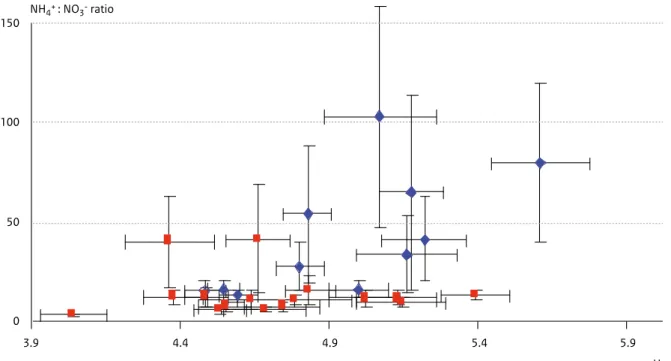
ammonia/ammonium deposition (e.g., Nihlgård, 1985; Van Dijk et al., 1990; references in Bobbink et al., 2003). High concentrations of ammonium in the soil or water layer are also toxic to many sensitive plant species, disrupting cell physiology, cell acidification, accumulation of N-rich amino acids, poor root development, and finally, inhibition of shoot growth. Strong evidence exists that many endangered vascular plant species of grasslands, heath-lands and soft-water lakes, and fen bryophytes, are very intolerant to increased concentrations of reduced N and to high NH4+:NO3- ratios (De Graaf et al., 1998; Paulissen et al., 2004; Kleijn et al., 2008; Van den Berg et al., 2008) (Figure 1.3).
(e) Increased susceptibility to secondary stress and disturbance
factors
The sensitivity of plants to stress (defined here as external constraints, such as drought, frost, pathogens or herbiv-ores, which limit dry-matter production rate), or distur-bance factors, (mechanisms which affect plant biomass by causing its partial or complete destruction), may be significantly affected by N deposition. With increasing N deposition, susceptibility to fungal pathogens and attacks by insects also increases. This is probably due to altered concentrations of phenolic compounds (leading to lower resistance) and soluble N compounds, such as free amino acids, together with a lower vitality of individual plants as
Figure 1.3. Characterisation of growth sites of common (blue diamonds) and rare (red squares) species typical to Dutch heaths, matgrass swards and fen meadows in terms of pH and NH4+:NO3- ratio in the soil. Symbols indicate mean ± SE. In contrast to common species, almost all rare species occur only at a low NH4+:NO3- ratio (from Kleijn et al., 2008).
3.9 150 100 50 0 4.4 4.9 pH NH4+ : NO3- ratio 5.4 5.9
a result of polluted deposition. Increased levels of pathogenic fungi have been found for several tree species in N-addition experiments and field surveys, but for most ecosystems data are lacking and the influence of such pathogens on diversity is still unclear (e.g., Flückiger et al., 2002; Bobbink et al., 2003).
In general, herbivory is affected by the palatability of plant material, which is strongly determined by its N content. Increased organic N content in plants, caused by N deposition, can thus result in increased insect herbivory (e.g., Throop and Lerdau, 2004). Data on herbivory and N deposition are very scarce, but a link has been demon-strated in dry Calluna heathlands. The frequency and intensity of infestations of heather beetle (Lochmaea
suturalis) are clearly related to atmospheric N inputs and N
concentrations in the heather (e.g., Brunsting and Heil, 1985; Berdowski, 1993; Bobbink and Lamers, 2002; for details see Chapter 8). N-related changes in plant physiology, phenology, biomass allocation (root:shoot ratios) and mycorrhizal infection can also differentially influence the sensitivity of plant species to drought or frost stress, leading to reduced growth in some species and possible changes in plant interactions.
1.2 Background to, and aims of the
report
Within the UNECE Convention on Long-range
Transboundary Air Pollution (LRTAP Convention), proce-dures have been developed to model and map critical loads for airborne N deposition in support of effect-based European policies for the abatement of air pollution (Bull
et al. 2001; Hettelingh et al. 2001; 2007). Both the
steady-state mass balance method and the empirical approach are used to scientifically support European policies aiming at effective emission reductions of air pollutants (ICP M&M, 2010). For the support of these policies it is important that scientific knowledge be regularly updated with new findings. This report focuses on recent knowl-edge for the review and revision of empirical critical loads. Empirical critical N loads are in almost all cases based on observed changes in the structure and functioning of ecosystems, primarily in a) species abundance, composi-tion and/or diversity (‘structure’), or b) N leaching, decomposition or mineralisation rate (‘functioning’). For a more complete overview of indicators, see Løkke et al. (2000). Effects have been evaluated for specific ecosys-tems. Statistically and biologically significant results from field addition experiments and mesocosm experiments conducted under close-to-field conditions have been used for quantifying empirical critical loads. Only studies on
independent N treatments with a duration of 2 years or more have been used. In particular data from long-term experiments in low-background areas are most useful for observing effects of N enrichment. However, since experimental studies have been conducted for a variety of reasons, their designs differ, and the methods used are carefully scrutinised to identify factors related to the experimental design or data analysis that may constrain their use. This includes evaluation of the accuracy of estimated values of background N deposition at experi-mental sites. In addition, the results from correlative or retrospective field studies have been used, but only as additional evidence to support conclusions from experi-ments, or as a basis for an ‘expert judgement’ rating. Empirical critical loads of N for natural and semi-natural ecosystems were first presented in a background docu-ment for the 1992 workshop on critical loads held under the UNECE Convention at Lökeberg (Sweden) (Bobbink et
al., 1992). After detailed discussions, before and during the meeting, the proposed values were set at that meeting (Grennfelt and Thörnelöf, 1992). Additional information from the 1992-1995 period was evaluated and summarised in an updated background paper and published as Annex III (Bobbink et al., 1996) of the UNECE manual on method-ologies and criteria for mapping critical levels and loads. The updated critical loads of N were discussed and set with full consensus at the December 1995 expert meeting held under the UNECE Convention in Geneva (Switzerland). They were also used for the development of the second edition of the Air Quality Guidelines for Europe by the World Health Organization’s Regional Office for Europe (WHO, 2000). Furthermore, the empirical critical loads for N deposition were extensively reviewed and updated in 2001-2002 (Berne workshop; Achermann and Bobbink, 2003). In that update, classification of the receptor ecosystems was brought in line with that of the European Nature Information System (EUNIS) (mostly level 3) (Davies and Moss, 2002; Hall et al., 2003; Davies et al., 2004), in addition to the incorporation of results from new N-impact studies from the 1996-2002 period (Bobbink et
al., 2003).
It was recognised at CCE workshops and Task Force meetings of the International Cooperative programme on Modelling and Mapping Critical Loads & Levels and Air Pollution Effects, Risks and Trends in Berne (ICP M&M, 2008) and Stockholm (ICP M&M, 2009) that considerable new insights into, and data on, the impacts of N deposi-tion on natural and semi-natural vegetadeposi-tion have become available since the compilation of the last background document. An update of the background material based on the availability of new scientific evidence for many N-sensitive ecosystems is thus pertinent and was adopted by the Working Group on Effects at its 28 session (WGE,
2009) under the LRTAP Convention. This report will be the basis for the revision of Chapter 5.2 of the modelling and mapping manual (ICP M&M, 2010).
The aims and structure of this report are as follows: • To add new relevant information from studies
(November 2002 – spring 2010) on the impacts of N on semi-natural and natural ecosystems, with emphasis on Europe, to the existing database on empirical critical loads of N
• To review and revise Achermann and Bobbink (2003) and provide a revised table on empirical loads of nitrogen for Europe, using the new scientific data, including on background N deposition (Chapters 2 to 8) • To differentiate and quantify empirical critical loads of N
for more specific EUNIS forest ecosystem types (Chapter 9)
• To synthesise the relationships between N exceedances and diversity at a European scale (Chapter 10);
• To refine and provide further guidance on the use of critical load ranges, including consideration of site-specific ‘modifying factors’ (Appendices 5,6 and 7 and Chapter 11)
• To link, where possible, the empirical critical loads of N based on the EUNIS classification with Natura2000 Annex 1 habitats (Appendix 1)
Finally, the report is completed with a number of appendi-ces. Appendix 1 addresses the link between the EUNIS classification and Natura 2000 habitats. Appendix 2 and 3 provide background information to chapter 9. Appendix 4 provides additional information on empirical critical loads of surface waters that became available after the CCE workshop in Noordwijkerhout, following the 26th session of the Task Force of the ICP Waters (October 4-6, 2010, Helsinki, Finland). The CCE workshop included separate sessions of three Working Groups each addressing one or more EUNIS classes. The summary reports of Working Group 1 (EUNIS classes A, B, C and E), Working Group 2 (EUNIS classes D and F) and of Working group 3 (EUNIS class G) can be found in Appendices 5, 6 and 7 respectively. Finally, Appendix 8 and 9 consist of the list of participants and workshop agenda respectively.
1.3 References
Achermann, B. and Bobbink, R. (eds.) (2003). Empirical
critical loads for nitrogen. Environmental Documentation
No.164 Air, pp. 43-170. Swiss Agency for Environment, Forest and Landscape SAEFL, Berne.
Aerts, R. and Chapin, F.S. (2000). The mineral nutrition of wild plants revisited: A re-evaluation of processes and patterns. Advances in Ecological Research 30, 1-67. Asman, W.A.H., Sutton, M.A. and Schjorring, J.K. (1998).
Ammonia: emission, atmospheric transport and deposition. New Phytologist 139, 27-48.
Berdowski, J.J.M. (1993). The effect of external stress and disturbance factors on Calluna-dominated heathland vegetation. In: Aerts, R. and Heil, G.W. (eds.), Heathlands:
patterns and processes in a changing environment, Kluwer,
Dordrecht, pp. 85-124.
Bobbink, R., Boxman, D., Fremstad, E., Heil, G., Houdijk, A. and Roelofs, J. (1992). Critical loads for nitrogen eutrophication of terrestrial and wetland ecosystems based upon changes in vegetation and fauna. In: Grennfelt, P. & Thörnelöf, E. (eds.), Critical loads for
nitrogen, Nord 41, Nordic Council of Ministers,
Copenhagen. pp. 111.
Bobbink, R., Hornung, M. and Roelofs, J.G M. (1996). Empirical nitrogen critical loads for natural and
semi-natural ecosystems. In: Manual on methodologies and
criteria for mapping critical levels/loads and geographical areas
where they are exceeded, Texte 71/96, III-1-54. Federal
Environmental Agency, Berlin.
Bobbink, R., Hornung, M. and Roelofs, J.G.M. (1998). The effects of air-borne nitrogen pollutants on species diversity in natural and semi-natural European vegeta-tion. Journal of Ecology 86, 717-738.
Bobbink, R. and Lamers, L.P.M. (2002). Effects of increased nitrogen deposition. In: Bell, J.N.B. and Treshow, M. (eds.), Air pollution and plant life (2nd edition), John Wiley and Sons, Chichester, pp. 201-235.
Bobbink, R., Ashmore, M., Braun, S., Fluckiger, W. and Van den Wyngaert, I.J.J. (2003). Empirical nitrogen critical loads
for natural and semi-natural ecosystems: 2002 update.
Environmental Documentation No. 164 Air, pp. 43-170. Swiss Agency for Environment, Forest and Landscape SAEFL, Berne.
Bobbink, R., Hicks, K., Galloway, J., Spranger, T., Alkemade, R., Ashmore, M., Bustamante, M., Cinderby, S.,
Davidson, E., Dentener, F., Emmett, B., Erisman, J-W., Fenn, M., Gilliam, F., Nordin, A., Pardo, L., and De Vries, W. (2010). Global assessment of nitrogen deposition effects on plant terrestrial biodiversity: a synthesis.
Ecological Applications: 20, 30-59.
Brunsting, A.M.H. and Heil, G.W. (1985). The role of nutrients in the interactions between a herbivorous beetle and some competing plant species in heathlands.