Towards
better
health
The Dutch 2010 Public Health Status and Forecasts Report
Towards better health
The Dutch 2010 Public Health Status and Forecasts
Report
Towards better health
Main report on the Public Health Status and Forecasts 2010
Illustrations: © 2011, Klutworks – The Hague
Design and layout: www.bureau-opstand.nl – The Hague Cover design: Optima Forma – The Hague
A publication of the National Institute for Public Health and the Environment
Postbus 1
3720 BA Bilthoven, The Netherlands Copyright
© 2010 National Institute for Public Health and the Environment, Bilthoven, The Netherlands
Original Dutch publication:
Van gezond naar beter. Kernrapport van de Volksgezondheid Toekomst Verkenning 2010. F. van der Lucht, J.J. Polder. RIVM report: 270061005 (ISBN 978 9078 1233 3; NUR 860)
The greatest care has been devoted to the accuracy of this publication. Nevertheless, the editors, authors and the publisher accept no liability for incorrectness or incompleteness of the information contained herein. They would welcome any suggestions concerning improvements to the information contained herein. All rights reserved. No part of this publication may be reproduced, stored in an automated database or made public in any form or by any means whatsoever, whether electronic, mechanical, using
photocopies, recordings or any other means, without the prior written permission of the National Institute for Public Health and the Environment and that of the publisher. Inasmuch as the production of copies of this publication is permitted on the basis of article 16b, 1912 Copyright Act in conjunction with the Decree of 20 June 1974, Bulletin of Acts, Orders and Decrees 351, as amended by the Decree of 23 August 1985, Bulletin of Acts, Orders and Decrees 471, and article 17, 1912 Copyright Act, the appropriate statutory fees should be paid to the Stichting Reprorecht (Publishing Rights Organization), PO Box 882, 1180 AW Amstelveen, The Netherlands. Those wishing to incorporate parts of this publication in anthologies, readers and other compilations (article 16, 1912 Copyright Act) should contact the publisher.
RIVM report number: 270061011 ISBN 978-90-6960- 250-9 NUR 860
This report is part of the Public Health Status and Forecasts Report 2010 Van gezond naar beter (Towards better health)
(ISBN 978 9078 12233 3)
Gezondheid en determinanten (Health and its determinants) (ISBN 978 9078 1234 0)
Effecten van preventie (Effects of prevention) (ISBN 978 9078 12235 7) Tijd en toekomst (Timetrends and future) (ISBN 978 9078 12236 4) Maatschappelijke baten (Health and Wealth) (ISBN 978 9078 12237 1) Verzamelbox Volksgezondheid Toekomst Verkenning 2010 Van gezond naar beter (Collection Box Public Health Status and Forecasts Report 2010 Towards better health) (ISBN 978 9078 12238 8)
Nederlanders aan het woord over gezondheid en gezond leven (Dutch citizens talk about health and living healthily) (ISBN 978 9078 12239 5) – not in collection box
Contents
Executive summary: towards better health
5
1 Dutch life (expectancy still on the rise
11
2 More disease, but not less healthy
23
3 Living a healthy life in a healthy environment
33
4 A healthy society
43
5 The health gap
51
6 The potential of prevention
61
7 A perspective for prevention
75
8 Health and wealth
83
PHSF 2010: Products, projectleaders,
projectteam and advisory committees
Investing in health: possible, desirable, indispensable
According to this edition of the Public Health Status and Forecast Reports (PHSF),
the health of the Dutch population is developing rather well. Dutch life
expec-tancy has increased in recent years, but this is not a reason to put on the brakes.
On the contrary! This forecast shows that investing in health is not only possible
but even essential to the Dutch economy.
This report provides a lot of information on the health of the Dutch and the steps
that need to be taken to improve it. It describes the results that have already
been achieved and those that are expected to be achieved thanks to ongoing
policy measures.
But above all, this forecast shows that the Netherlands can and must continue to
invest in the health of its citizens. Because health is priceless, and because an
ageing economy needs healthy citizens.
Executive summary:
Towards better
health
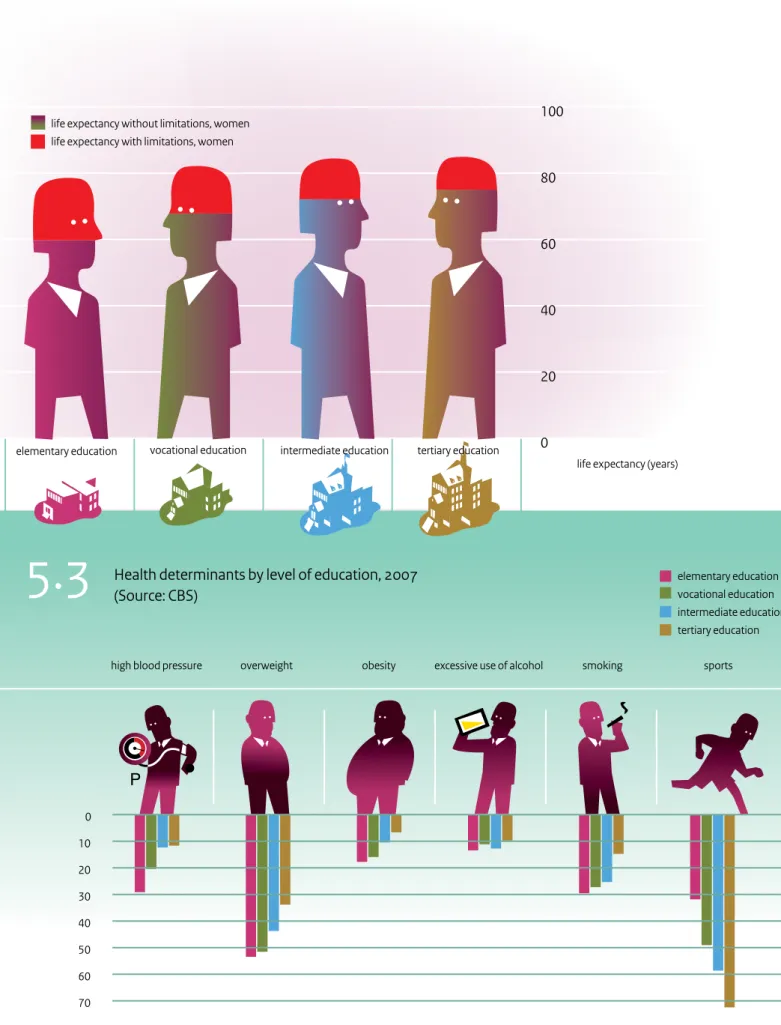
Dutch life expectancy is still lower than that of its neighbouring countries. The gap with countries such as Iceland, Switzerland, Spain, Sweden, France and Italy has not narrowed in recent years, while the Netherlands used to be a frontrunner. The life expectancy of Dutch women in particular is still far behind. There is also an alarming gap between people with a low education and people with a high education that is not narrowing despite the numerous measures that were implemented in the past.
The occurrence of unhealthy lifestyle habits is not or is only barely decreasing. Over the last decade, a small gain was only achieved in the area of smoking, but that doesn’t change the fact that the Dutch still smoke more than people in their neighbouring countries. In addition, almost half
the Dutch are overweight, and some 10% are obese. The standards for healthy nutrition and physical exercise are far from being met.
The already alarming gap between the life expectancy of people with a high education and people with a low education is twice as wide when the number of years a person can expect to live without physical limitations is examined. People with a low education live on average 14 years less without limitations than people with a high education. This gap has also not narrowed in recent years.
Investing in public health is investing in society and in the economy as a whole, and should therefore be high on the government’s list of priorities.
The Dutch live long in good health
Dutch life expectancy still on the rise
Between 2003 and 2008, Dutch life expectancy increased by more than two years to 78.3 years for men and 82.3 years for women. This is the fastest increase since World War II and is higher than predicted in the last PHSF. But this recent increase is not unique to the Netherlands: other European countries are also experiencing a rapid increase in life expectancy. There are a number of reasons for this trend, not all of which are clear, but what we do know is that the falling mortality rate for cardiovascular diseases is a major contributor. Life expectancy is expected to further increase by six years by 2050.
Two more years in good health
The two years of life that were recently gained are largely spent in good health and without physical limitations. Nevertheless more and more people have one or more diseases at the same time and the number of people with a chronic disease will continue to increase. This has, however, not resulted in more physical limitations or a lower level of perceived health. The increase in the number of diseases is partly due to their early detection and partly due to improved survival. This produces a paradoxical trend: more disease and better health at the same time.
Lifestyle trends no longer bad
Dutch lifestyle trends are improving. After a period of stability, the percentage of smokers has again fallen. The number of drug abusers and problem drinkers is not increasing, and the trends in overweight are stabilizing. More people are exercising, and more people with high blood pressure or high cholesterol are receiving treat-ment.
Environment is increasingly safe
More and more environmental risks are being identified and dealt with. The number of road traffic casualties is still falling, and environmental health risks have not increased despite the growing environmental burden. More is also being discovered about the positive effects the environ-ment has on health, not only in terms of the way the living environment is organized, but also in terms of the social environment.
Dutch society is healthy
The Netherlands is a prosperous country. The distribution of wealth has remained more or less equal and Dutch health care is one of the most accessible health care systems in the world. These are favourable social conditi-ons for public health. And good public health has a positive effect on participation in social and economic in life.
… but it still needs to improve ...
Health gap is big and intractable
An ongoing cause for concern is that people with a low education die six to seven years younger than people with a high education. The gap is alarmingly wide and disap-pointingly intractable. At 14 years, the difference in life expectancy without physical limitations between people with a high education and people with a low education is even bigger. Despite all of the measures taken, the health gaps have not narrowed in recent years, and for some lifestyle factors, such as smoking, they have even widened. To narrow the gap, health policy must focus more on achieving results among people with a low education. Life expectancy for women is still behind and the number of people with a chronic disease is increasing
Despite an increasing life expectancy, the Netherlands has still not regained its position among the top European countries mainly because of the lagging life expectancy for women. At 82.3 years, life expectancy for Dutch women is just above the average in the European Union.
Life expectancy is increasing but so too is the number of Dutch people with a chronic disease. Thirteen percent of all Dutch people have a physical limitation, with functio-nal limitations occurring most frequently. Today, one in three people with a chronic disease has two or more disorders and further increases are foreseeable. Risk factors stabilize at an unfavourably high level
The trends in unhealthy lifestyles have stabilized, but they are still far too high, especially among people with a low education. Despite ongoing mass media campaigns, the number of problem drinkers and drug abusers is not falling, nor is the number of Dutch people who are overweight or obese: 40 to 50% of the Dutch suffer from overweight. One in nine people is obese, and among the 2 to 9-year-olds, one in seven children suffers from over-weight. Things could be worse though, like in almost all of the neighbouring countries where these figures are even higher.
More than half the Dutch do not meet the Dutch standard for healthy nutrition, especially when it comes to the intake of fruit and vegetables. Almost half the Dutch donot meet the standard for healthy exercise, which recommends 30 minutes of moderately intensive physical activity every day.
After years of stagnation, the only number to fall in recent years is that of smokers. But with 27% of its population smoking, the Netherlands still performs badly. The target set by the minister to reduce the number of smokers to 20% by 2010 has not been achieved by far.
It is important to point out that unhealthy lifestyles often occur in combinations. Some of the Dutch, especially groups with little education, usually exhibit several forms
continue to be important, especially in a country as densely populated as the Netherlands, which has a lot of people, very high mobility and a lot of activity in a relatively small area. Innovation is a must. 2. Exploit unused potential of disease prevention
In the second half of the last century, disease prevention paid the biggest contribution to the increase in life expectancy with the introduction of vaccines, cholesterol and blood-pressure lowering drugs, and screening for certain types of cancer. Screening and early detection in youth health care can also be considered as successes, especially because of the high reach among the target group. Additional health gains can be achieved by exploiting unused potential in screening and vaccination. 3. Exploit the potential of health promotion
A lot of focus has been put on lifestyle changes since the last prevention policy paper was published. Key objectives have been defined with ambitious targets to reduce smoking, the harmful use of alcohol, overweight, diabetes and depression. There is, of course, a reason for this: there is a close relationship between today’s major chronic diseases and people’s behaviour. The focus on lifestyle and health promotion is therefore an obvious consequence of disease prevention. But lifestyle changes are not easy to make. A number of dilemmas come into play: citizens retain their freedom of choice, only a few intervention methods have been proven to be effective, and the institutional environment of health promotion is often counterproductive. This is why the effects of health promo-tion are marginal and a number of prevenpromo-tion targets have not been met. It also explains why there is a lot of room for improvement. Combinations of statutory measures, excise taxes, environmental interventions, and lifestyle interven-tions are all good candidates to achieve health gain. This implies a careful mix of national and local measures. More emphasis needs to be put on achieving results among people with a low education. Taking the lagging social determinants and the organization of the physical and social environment into account will certainly help the interventions succeed.
Public health policy in the long term
The Netherlands cannot move towards better health without making an effort. The will to do better is there, but there’s also a lot to do. The policy outlook on health and prevention that the Ministry of Public Health issued in 2007 provides a good basis for further development: ‘Be healthy, stay healthy’. This PHSF describes a number of long-terms measures that can be taken to move towards better health.
of unhealthy behaviour at the same time, regardless of their age.
New environmental risks require vigilance
The Dutch environment is safe and still improving, but new health risks are emerging, and infectious diseases have gained new importance in recent years. Diseases such as Q fever not only present a threat to public health, they also cause social upheaval because of the uncertainty they create and the far-reaching consequences they have on people’s health and the farming industry. The same applies to impending pandemics. A safe and healthy environment requires vigilance and continual adaptation to new threats.
Participation of people with a disease or limitation is still lagging
A chronic disease is a major barrier to social participation, especially if the disease is paired with limitations. To increase participation, the environment must be more accessible and the personal capabilities of people with a chronic disease or limitation improved. Both the national and local governments can invest in and work together on ways to prevent limitations and reduce their impact. The economy also benefits from a society that is open to citizens with limitations and in which better medical aids are developed and made available for more people. In short, a society in which people can fully participate, irrespective of their disease or limitations. This should not only be seen as a luxury. Since the Netherlands is steering towards a period of ageing and a shrinking working-age population. All hands must be on deck in order to keep the economy going. For the Dutch government, investing in the health of the population means investing in society and the economy as a whole and is therefore a very high priority.
… and things can be improved
1. Health protection produces a lot of health
Health protection measures in the areas of hygiene, clean drinking water and better housing have played, and continue to play, an important role in the reduction of infectious diseases. The reduction of infectious diseases resulted in a sharp fall in mortality rates, which led to a considerable rise in life expectancy. Policy on working con-ditions has also contributed a lot, with exposure to health risks on the shop floor declining sharply in recent years. Another success in health protection is the reduction of road traffic casualties since the 1970s. In addition to legislation and its enforcement, and infrastructural measures, the increasing safety of cars and improved driving behaviour also helped. This underlines the importance of policy coherence. Health protection will
work is less obvious. The increasing complexity of public health issues increases the complexity of the solution strategies. In order to explore and develop fine-tuned solutions, strategic, multidisciplinary research involving professionals from inside and outside the field will be more than ever necessary. The Minister of Health, Welfare and Sport will also have to ensure that up-to-date information is available for the whole area of public health.
Public health policy in the short term
In the short term, additional health gain can be achieved by stepping up efforts in the areas that are doing well and making new choices in those that are not.
1. Cultivate and innovate universal prevention
Universal prevention consists of measures aimed at people that do not have a high risk of disease. Health protection, which falls under this category, is an essential part of prevention that is undervalued and deserves more praise. Universal prevention is not always recognized as such, but it is very important for public health. Innovation is also very important in particular in terms of public information and communication. New digital media will have to be used more than ever in order to reach target groups effectively.
More emphasis should be put on environmental change, for example, through the implementation of legal measures, as they appear to be more effective than health promotion activities. In terms of behavioural change, it is advisable to take into consideration major events in a person’s life course, for example, a transition from school to work, pregnancy, or retirement. In the area of disease prevention, vaccinations and screening have a lot of unused potential, especially in the area of colorectal cancer screening. This potential needs to be carefully examined in terms of its advantages and disadvantages. Attention for social determinants, such as socioeconomic differences, is also part of universal prevention. These determinants require a comprehensive and coherent policy. An assessment framework that takes a variety of issues into account can help achieve progress in this tough area.
2. Selective prevention: remove institutional barriers
Selective prevention consists of detecting high-risk groups and leading them to personalized prevention and care. Selective prevention is a grey area that overlaps with public health and primary care, which is why it is currently not clear how this type of prevention should be funded. A lot of health gain can be achieved in this area, for example, with programmes aimed at neighbourhoods with a high incidence of low education or special target groups, such Social action programme: strengthen the network approach
A network approach is a way of making progress in the complex environment of public health. In order for such an approach to be successful, field expertise and leadership are key in all areas. This is why this approach is also referred to as ‘concerted action’, namely a joint and coherent action programme that is based on the best available knowledge, in which all of the involved parties are represented and which has an unambiguous leader-ship. Decisive action and support must be in balance. ‘Concerted action’ is also a matter of perseverance and requires a sense of urgency, political will, involvement, a shared vision and the willingness to set one’s own interests aside. The Minister of Health, Welfare and Sport is the right person to initiate such an action programme. Clear targets on all levels
A coherent national vision of public health should result in clear and achievable health targets with clear responsibili-ties on all administrative levels. The funding and imple-mentation of each of the targets must be put in place. Some targets and responsibilities should fall under the public sector, others should fall under the private sector. Some responsibilities have to be taken at the national level, others can be left to local governments. Levels of governance
Health promotion, aimed at changing the environment and lifestyle of citizens, needs national targets and frameworks just like health protection and disease prevention. A standard package for the health promotion activities should be developed and implemented by the Regional Public Health Services, as was the case for youth health care and environmental medicine. Local govern-ments should only be assigned the responsibilities they can deal with. Regional reports will have to show which local prevention measures have been implemented, which citizens have been reached and how the measures affected health.
Consistent assessment
In order to achieve as much health gain as possible with scarce public funds, there is an increasing need to develop ways of assessing the interrelated costs, benefits and social advantages and disadvantages of prevention and health care. What justifies an investment in health care, and when would prevention be better? On balance, does an invest-ment produce more health gain outside the health care sector or inside? The most effective solution is often found in the most unexpected area.
Knowledge agenda for better public health
A societal perspective on public health can only take shape if it is supported by strategic research. The importance of health for society and vice versa is evident, but how things
wealthy society go hand in hand. Health care expenditure doesn’t hurt society as much as a weakening of the public health system does. Prevention and health care contribute to the economy, and more importantly, they express fundamental social values. Investing in health is possible, desirable and indispensable. A move towards better health will improve everyone’s health!
as school dropouts. A gain could also be achieved if public health services, occupational health and school doctors worked more closely with general practitioners and primary care. This would create new opportunities for local policies, for example, to bridge the gap between prevention and health care. But it also requires novel forms of organization and funding.
3. Increase the scope of indicated prevention Getting people to prevention brings us straight to personalized prevention: indicated prevention and prevention in health care. The difference between indicated prevention and preventive health care is that the target group for indicated prevention does not have any health problems yet but has a high risk of developing them. The effectiveness of this approach is proven for combined lifestyle interventions in the areas of smoking, overweight and alcohol consumption. Indicated preven-tion, however, is not widely applied. Substantial health gains can be realized by extending the supply and increasing the demand by including these type of preven-tion in the health insurance package.
4. Prevention in guidelines
Prevention in health care is part of good medical practice and consists of preventing complications in people with existing health problems. The prevention of limitations takes on a new dimension. Different types of preventive health care are already included in standards and practice guidelines. More health can be gained by adding more types of prevention to practice guidelines and making them accessible to citizens with a high risk who are not yet being treated. In order to achieve this, doctors and other professionals must recognize and endorse the importance of prevention.
Health is wealth
The step towards better health requires investing in prevention and health care. The costs are high, but so are the benefits for society. Most citizens think their health is the most important thing they have, and therefore priceless. For society, healthy citizens are very important human capital. Physical and mental limitations can lead to the exclusion of groups of citizens whose participation in our society and economy is vital. Health impacts students’ school performance, people’s careers, labour participa-tion, absenteeism and labour productivity. Better population health contributes to economic growth and plays an essential role in reducing the costs of absenteeism and incapacity for work.
Health also plays a major role in other forms of social participation, including voluntary work and informal care. Good health of the population and a highly developed,
On 13 October 2009, the last Dutch person to live through the
twen-tieth century from start to end, died: Grietje Jansen-Anker was 112 years
old (1). She spent the last year of her life in a care home in Rotterdam,
together with her daughter! She shunned publicity because she didn’t
believe there was any merit in reaching such a high age. Merit it may
not have, but that doesn’t make it any less special: it is still a rare
phenomenon when people reach an age of 110 or over. But life
expec-tancy in the Netherlands is steadily increasing, in recent years even at
an accelerated pace.
1
Dutch life expectancy
still on the rise
M
80
65
M
M
65
W
W
���� ���� ���� ���� ���� ���� ���� ���� ���� �� �� �� �� ��life expectancy (in years)
Life expectancy at age 80,
1970-2050 (Source: CBS)
Life expectancy men, at birth,
1970-2050 (Source: CBS)
Life expectancy women, at birth,
1970-2050 (Source: CBS)
���� ���� ���� ���� ���� ���� ���� ���� ����
� � �� ��
remaining life expectancy (in years) ���� ���� ���� ���� ���� ���� ���� ���� ����
�� �� �� ��
remaining life expectancy (in years)
Life expectancy at age 65,
1970-2050 (Source: CBS)
History and future of life expectancy , 1970-2050 (Source: CBS)
���� ���� ���� ���� ���� ���� ���� ���� ���� �� �� �� �� ��
life expectancy (in years)
Men Women
Men Men
Women Women
life expectancy (in years) at birth, men
���� ���� ���� ����
Life expectancy in the
Netherlands and Europe,
1990-2007 (Source: CBS)
Netherlands EU 15 EU 27 Min/Max1.1
1.3
life expectancy (in years) at birth, women �� �� �� �� �� �� �� �� �� �� �� �� �� �� �� �� ���� ���� ���� ����
M
80
65
M
M
65
W
W
���� ���� ���� ���� ���� ���� ���� ���� ���� �� �� �� �� ��life expectancy (in years)
Life expectancy at age 80,
1970-2050 (Source: CBS)
Life expectancy men, at birth,
1970-2050 (Source: CBS)
Life expectancy women, at birth,
1970-2050 (Source: CBS)
���� ���� ���� ���� ���� ���� ���� ���� ����
� � �� ��
remaining life expectancy (in years) ���� ���� ���� ���� ���� ���� ���� ���� ����
�� �� �� ��
remaining life expectancy (in years)
Life expectancy at age 65,
1970-2050 (Source: CBS)
History and future of life expectancy , 1970-2050 (Source: CBS)
���� ���� ���� ���� ���� ���� ���� ���� ���� �� �� �� �� ��
life expectancy (in years)
Men Women
Men Men
Women Women
life expectancy (in years) at birth, men
���� ���� ���� ����
Life expectancy in the
Netherlands and Europe,
1990-2007 (Source: CBS)
Netherlands EU 15 EU 27 Min/Max1.1
1.3
life expectancy (in years) at birth, women �� �� �� �� �� �� �� �� �� �� �� �� �� �� �� �� ���� ���� ���� ����
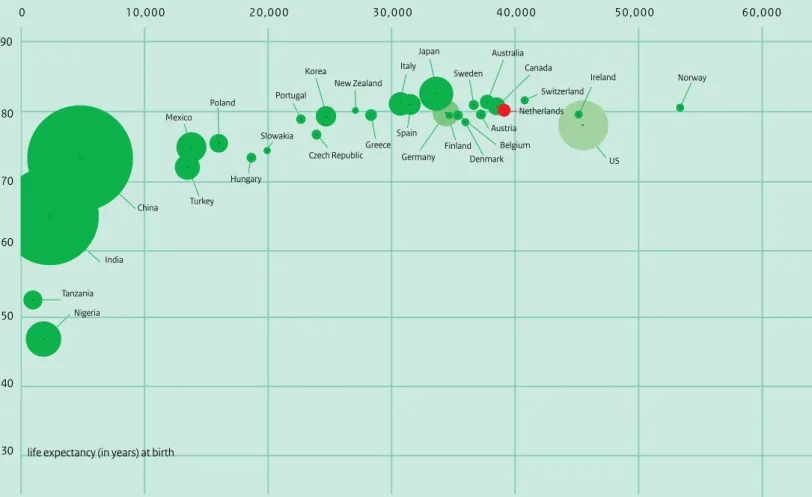
America present a completely different picture, as is shown in Figure 1.4.
Substantial differences in the Netherlands
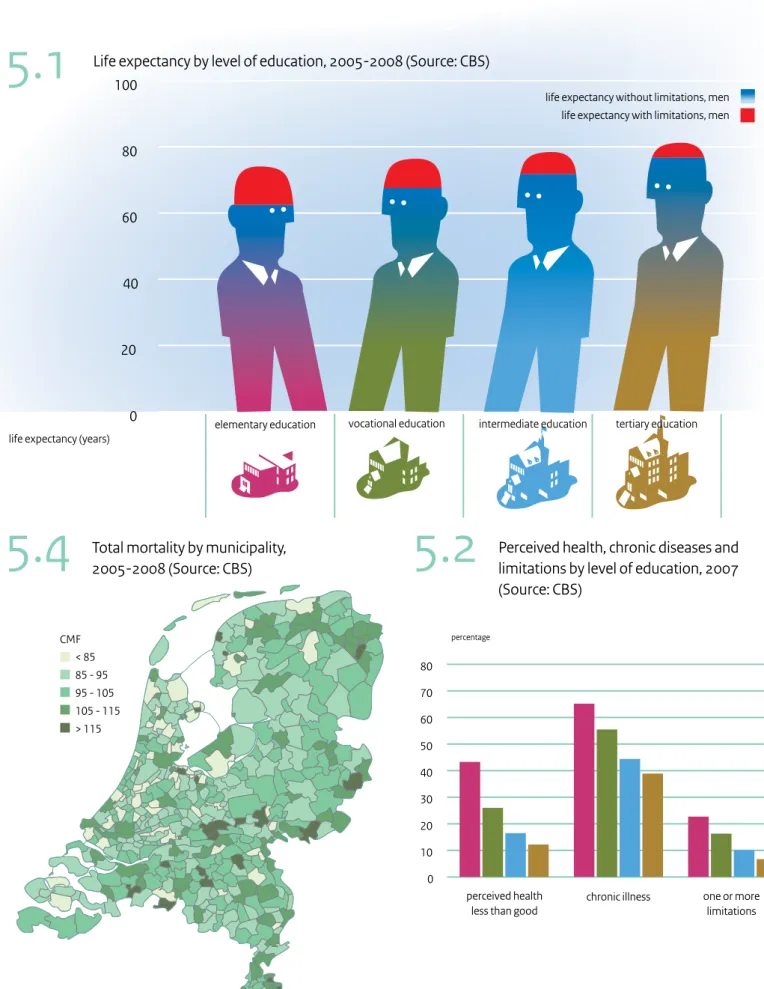
The average life expectancy is a good indicator of public health, but the differences within the population also need to be considered. And the differences in the Netherlands are certainly not insignificant. Figure 1.5 shows that life expectancy is the highest in the provinces of Zealand, South Holland and Utrecht, with the exception of the big cities. Life expectancy in the provinces of South Limburg and Twente is remarkably low, which may be related to a history of hazardous and arduous labour in mining and industry. In Groningen and the Betuwe, too, life expec-tancy is relatively low and deeply rooted in the socioecono-mic position of both regions, which is still low today. Such geographic differences are not an isolated phenomenon, but reflect differences in well-being, education and ethnicity. In the big cities, life expectancy even varies per neighbourhood. Here, socioeconomic influences are a determining factor. People with a high education live an average of six years longer than people with a low education. The situation is similar for groups with higher incomes.
The history of Dutch life expectancy
Grietje Jansen’s century was a century full of change, progress and development in every respect: economic, technological, social and in terms of public health. Wealth and health went hand in hand, and, in conjunction with all kinds of developments, a wide-ranging epidemiological transition took place in the twentieth century that raised life expectancy and both increased and decreased various causes of death.
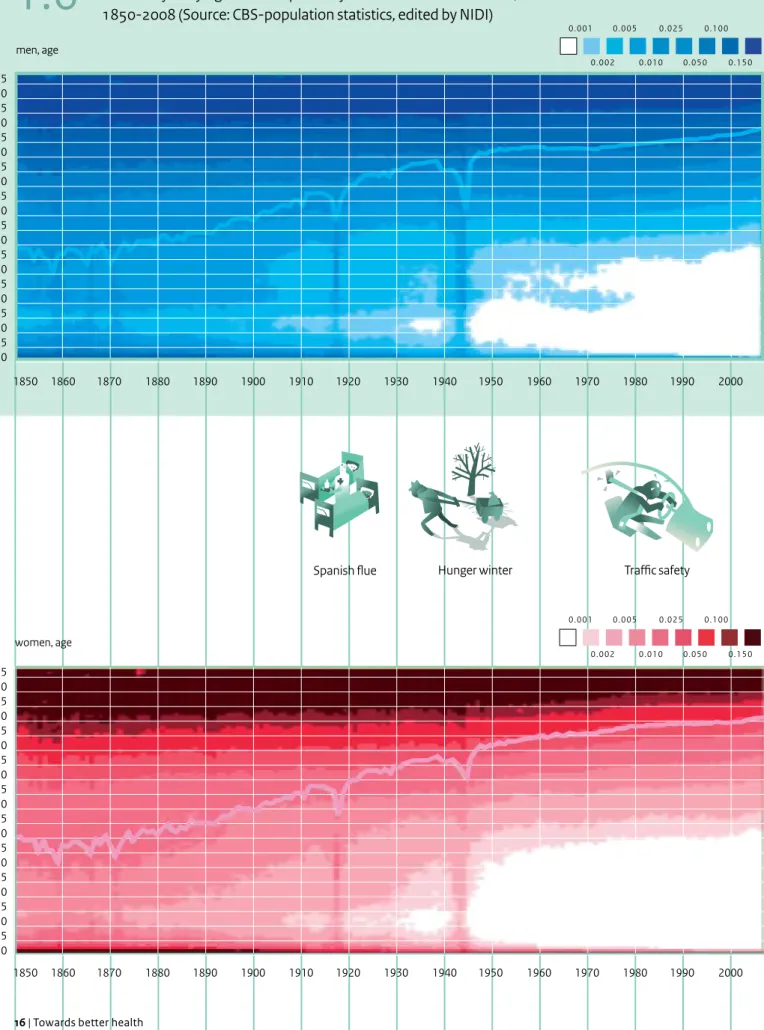
Life expectancy on a continuous rise since 1850
Around 1900, life expectancy at birth in the Netherlands was about fifty years for women and somewhat lower for men. Compared to the situation only a few decades earlier this was already high. Especially after 1875 a lot of gain had been achieved, but the big rise was yet to come (Figure 1.6). In the twentieth century, life expectancy increased like never before. Initially this was due to better housing, food and hygiene, and then, after World War II, vaccines, prevention and medical care played an increasing role.
Figure 1.6 shows a more or less continuously increasing
curve that is only interrupted by the Spanish flu (1918) and the World War related Dutch Famine of 1944-45, known as the Hunger Winter. Life expectancy trends for men also seems to have stagnated for a while between 1950 and 1970, which increased the already existing gap between men and women.
Current life expectancy
Unexpected sharp rise in life expectancy...
Since 2002, life expectancy at birth and life expectancy at 65 and 80 have been increasing at a remarkably fast pace
(Figure 1.1). Such an increase had not been anticipated. In
2008, a higher life expectancy had already been reached than that predicted for 2025 in the PHSF 2006 (Figure 1.2). The PHSF 2006 did suggest trends could change, but at that time no one would have thought they would change so quickly. It is difficult to specifically identify causes of this rapid increase in life expectancy. There are however indications that the mild summers and the mild winters could play a role, especially where mortality among older people is concerned. The fact that ever fewer men are smoking could also offer an explanation, and increased wealth and cohort effects are also likely contributors. With cohort effects, we people who were born in a particular year who have a lower mortality rate because they grew up in better living conditions. But according to Johan Mackenbach, professor in public health at Erasmus MC in Rotterdam, this does not sufficiently explain the current acceleration (2). His hypothesis is that the recent increase in life expectancy is the result of more and better health care since the beginning of the twenty-first century. His hypothesis is not based on thin air: it has been demonstra-ted that at least half the increase in life expectancy between World War II and the turn of the century, namely some four years, can be ascribed to medical care and prevention (3).
… but still not back among the top European countries With a life expectancy of 78.3 years for men and 82.3 years for women, the Netherlands is certainly not among the laggards in Europe. The life expectancy of Dutch men is even among the highest in the EU-27 (Figure 1.3). The gap is wide between the Netherlands and the new European member states, such as Latvia and Lithuania, where men live an average of 13 years less. For Dutch women, the picture is far less rosy. Life expectancy for women may be considerably higher than for men, but compared with other European countries, Dutch women score neither high nor low: their life expectancy fluctuates between the average in the EU-15 and the EU-27. Figure 1.3 shows that Dutch women have seriously fallen behind since 1980 when they were in the lead. This can be attributed to a relatively higher mortality rate among middle-aged and elderly Dutch women and the slower decrease in mortality compared with other countries.
European countries have some of the highest life expec-tancies in the world after Japan. The Netherlands and other Western countries combine a high wealth with high life expectancy. Most of the countries in Africa, Asia and South
���� ���� ���� ���� ���� ���� ���� ���� ���� ���� men ��.� ��.� ��.� ��.� ��.� women ��.� ��.� ��.� ��.� ��.� ���� ���� ���� ���� ���� ���� ���� ���� men ��.� ��.� �� ��.� ��.�-��.� ��.� ��.� ��.� women ��.� ��.� �� ��.� ��.�-��.� ��.� ��.� ��.� Key message
PHSF Base year Year of
prediction Life expectancy
Life expectancy
Life expectany of the Dutch in 2010 will be increased with 1-1.5 year compared to 1990. This gain in lifespan is only partly accompanied by healthy years.
Life expectancy is still increasing. Causes of death are changing. Men make up the arrears.
Dutch live ever longer and longer in good health.
The Dutch live longer and longer in good health
Unexepected sharp increase of life expectancy, however the Netherlands is not back yet in the top of Europe.
Key messages about life
expectancy in 5 PHSF's
�.��� �.��� �.��� �.��� �.��� �.��� �.��� �.��� �.��� �.��� �.��� �.��� �.��� �.��� �.��� �.��� �� �� �� �� �� �� �� �� �� �� �� �� �� �� �� �� �� �� �� �� �� �� �� �� �� �� �� �� �� �� �� �� �� �� �� �� �� �� �� �� ���� ���� ���� ���� ���� ���� ���� ���� ���� ���� ���� ���� ���� ���� ���� ���� ���� ���� ���� ���� ���� ���� ���� ���� ���� ���� ���� ���� ���� ���� ���� ���� men, age women, age
Spanish flue Hunger winter Traffic safety
Probability of dying and life expectancy of Dutch men and women,
1850-2008 (Source: CBS-population statistics, edited by NIDI)
China India Nigeria Japan Mexico Germany Turkey Italy Korea Spain Tanzania Poland Canada Australia Greece Belgium Portugal Czech Republic Hungary Sweden Austria Switzerland Slowakia Finland Ireland New Zealand US Norway Netherlands � ��,��� ��,��� ��,��� ��,��� ��,��� ��,��� Denmark �� �� �� �� �� �� ��
income per head in euros
life expectancy (in years) at birth
Global differences in wealth and life expectancy, 2007
1.6
1.4
Regional differences in
life expectancy at birth
2005-2008 (Source:CBS)
1.5
��.� - ��.� ��.� - ��.� ��.� - ��.� ��.� - ��.� ��.� - ��.� years (average is ��.�)Figure 1.4: Global differences in wealth and life expectancy, 2007
Figure 1.5:
Regional differences in life expectancy at birth 2005-2008 (Source:CBS)
Figure 1.6a:
Probability of dying and life expectancy of Dutch men, 1850-2008 (Source: CBS-population statistics, edited by NIDI)
Figure 1.6b: Probability of dying and life expectancy of Dutch women, 1850-2008 (Source: CBS-population statistics, edited by NIDI)Figure 1.7: Mortality by infectious disease, cancer and cardiovascular diseases, 1900-2008 (Source: CBS)
Figure 1.8: Best practice trend in female life expectancy, 1950-2007, according to Christensen (Source: Human Mortality Database, Oeppen & Vaupel) France United Kingdom Korea Tanzania Portugal Luxembourg Iceland
life expectancy (in years) at birth income per head
transition is not clear but it may be related to the fact that environmental influences are gaining the upper hand on behavioural factors. This is discussed in more detail in
Chapter 3.
Life expectancy to increase by six years by 2050
Although past performance is no guarantee for future success, the starting points used in projection methods to determine life expectancy are based on historical trends. This is done in both simple and more advanced ways. We will follow the Dutch demographers Fanny Janssen and Anton Kunst, who have made projections on the future life expectancy for this PHSF (5). Using advanced methods that take different trends into account for smokers and non-smokers and in which the existence of shared international trends is assumed, they expect life expec-tancy at birth in the coming decades to steadily increase to 88.1 years for women and 83.8 years for men by the year 2050 (Figure 1.1). This means that the increase for men and women will be almost the same, namely six years. According to these predictions, life expectancy for older people will also increase, namely by more than four years for people aged 65 and by more than two years for 80-year-olds.
There are, of course, other projection methods. Statistics Netherlands (CBS) estimates that mortality decline will level off, among other things, because of the expected adverse developments in the lifestyle of the Dutch, and in particular the smoking trend among women. Together with a number of other assumptions, this results in a projection that is lower than the above-stated 85.5 years for women and 83.2 years for men. Noteworthy in CBS’s outlook is that the gender gap in life expectancy keeps narrowing because a much lower rise in life expectancy is expected for women. In Janssen and Kunst’s projection, this gap is virtually stable. For the future of health care, this is of vital importance.
Is there such a thing as maximum life expectancy?
In 1980, the American professor James Fries contended that life expectancy will reach a ceiling at 85 years (6). The above-mentioned Dutch projections break that ceiling. In Japan, life expectancy for women has currently already exceeded 86 years. The existence of a maximum life expectancy is therefore an interesting question indeed. Maximum life expectancy is not the same as maximum age, which will always be higher. For example, Grietje Jansen exceeded the average life expectancy in the year she died by thirty years. Not to mention her life expectancy at birth, which was not higher than fifty. There is a lot of speculation about the maximum age, and an age of 140 is even mentioned. The main focus of this report, however, is life expectancy.
Mortality has shifted to higher age groups
The decrease in child mortality is one of the key factors in the increase of life expectancy. Around the year 1900, the Dutch mortality rate in the first year of life was about 15%, a century later it was lower than 0.5%. But child mortality was not the only figure that went down: the mortality rate fell for all ages. This is nicely depicted in Figure 1.6. It takes no more than one glance to see that the number of deaths in the 1 to 40 age groups shifted to higher age groups (4). The graph also reflects the most significant incidental events, such as the aforementioned Hunger Winter and the Spanish flu, as well as a number of outbreaks of infectious diseases (cholera and smallpox) in the nineteenth century. A comparison between men and women identifies two remarkable phenomena: a higher mortality rate for young men from the end of the 1950s to the mid-1970s caused by traffic accidents, and an increase in the mortality rate for men aged 50 and above, refelecting the long-term impact of the increase in smoking behaviour since the 1920s. Deaths caused by cardiovascular diseases have decreased spectacularly since the 1970s
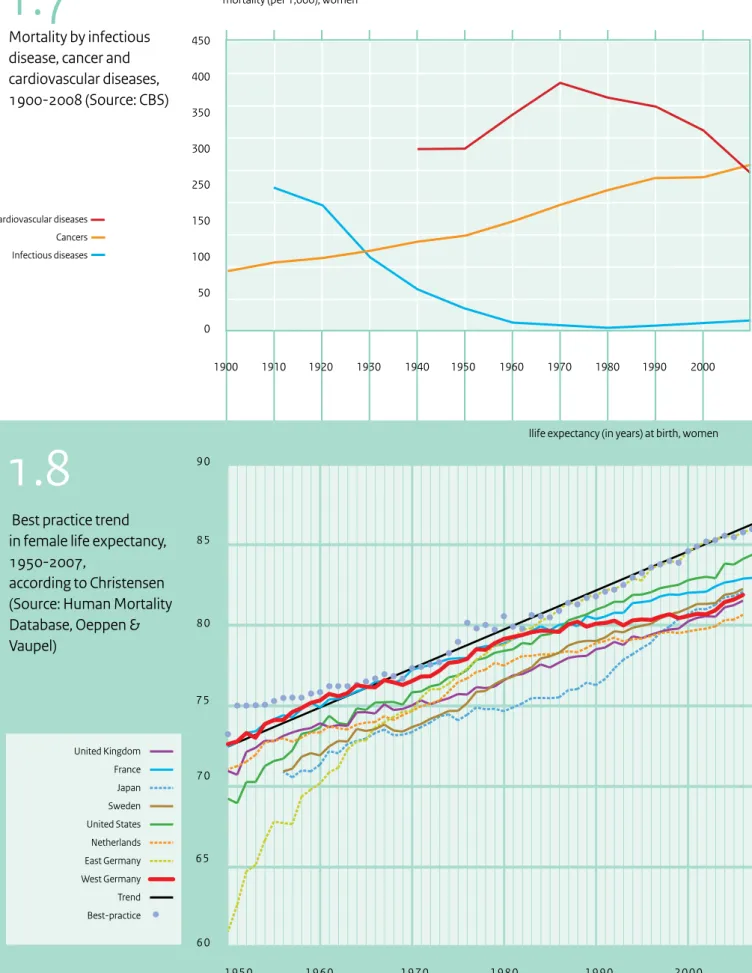
‘Epidemiological transition’, which was mentioned above, means that a development in life expectancy is caused by a changing mortality pattern. Since the late nineteenth century, ever fewer people have been dying from infectious diseases. In the twentieth century with wealth-related conditions such as cardiovascular diseases and cancer replaced infectious diseases as a major cause of death. Developments in the area of cardiovascular diseases had a very significant impact on life expectancy. Following a period of sharp increase, deaths caused by cardiovascular diseases have dramatically fallen since the 1970s (Figure 1.7). In addition to a healthier lifestyle, including a reduction in the number of male smokers, developments in preventive medicine (cholesterol and blood-pressure lowering drugs), new surgical techniques (angioplasty and bypass surgery) and organizational innovations (stroke units) played a significant role. In 2010, cancer took over the position as the leading cause of death in the Netherlands.
The future of Dutch life expectancy
What does the future have in store? Will life expectancy continue to rise, or is a maximum life expectancy slowly being reached? The latter seems unlikely considering the recent sharp increase in life expectancy in the Netherlands and the even higher life expectancy in other countries. Previous life expectancy predictions for the Netherlands have been categorically too low (Figure 1.2). The recent acceleration in life expectancy has conjured up the idea that a new epidemiological transition is at hand based on the fact that previous transitions were also marked by a sharp rise in life expectancy. The nature of this new
Mortality by infectious
disease, cancer and
cardiovascular diseases,
1900-2008 (Source: CBS)
450 400 350 300 250 150 100 50 0 1900 1910 1920 1930 1940 1950 1960 1970 1980 1990 2000mortality (per 1,000), women
Cardiovascular diseases Cancers Infectious diseases
Afbeelding 1.7
60 70 90 80 65 75 85 1950 1960 1970 1980 1990 2000llife expectancy (in years) at birth, women
Best practice trend
in female life expectancy,
1950-2007,
according to Christensen
(Source: Human Mortality
Database, Oeppen &
Vaupel)
United Kingdom France Japan Sweden United States Netherlands East Germany West Germany Trend Best-practice1.8
1.7
Figure 1.7: Mortality by infectious disease, cancer and cardiovascular diseases, 1900-2008 (Source: CBS)
Figure 1.8: Best practice trend in female life expectancy, 1950-2007, according to Christensen (Source: Human Mortality Database, Oeppen & Vaupel)
China
India
US
Nigeria
Japan
Mexico
Germany
Turkey
France
United Kingdom
Italy
Korea
Spain
Tanzania
Poland
Canada
Australia
Netherlands
Greece
Belgium
Portugal
Czech Republic
Hungary
Sweden
Austria
Switzerland
Denmark
Slowakia
Finland
Norway
Ireland
New Zealand
Luxembourg
Iceland
life expectancy (in years) at birth
income per head
life expectancy (in years) at birth, women United Kingdom France Japan Sweden United States Netherlands East Germany West Germany
Because the increase in life expectancy was considerably higher than estimated, one might think that the govern-ment should sit back and relax. This is a misconception. In order to attain a further increase in life expectancy, mortality rates will have to further decrease. This means that the mortality rates for other causes of death, such as cancer, will have to drop as much as for cardiovascular diseases. Prevention and treatment will have to become more effective, which requires investing in prevention and health care. The government will have to make these investments if it sets an increase in life expectancy as one of its objectives.
… requires a wider view
An increase in life expectancy does not automatically imply that the population’s health status has improved. More important is that the years gained are healthy years and that ageing people do not suffer from old age ailments or limitations that prevent them taking part in social life. Healthy ageing is the challenge society is facing. Another important theme is the gap in life expectancy. Why do people in lower socioeconomic groups live so much shorter, and can something be done about it? The government, too, is confronted with the effects of ageing on health care needs. How can society meet future care demands? These questions are discussed in Chapters 2, 5 and 8.
Figure 1.8 is based on an interesting article by Christensen
and colleagues that was published in the Lancet in 2009 (7). This graphic shows what is called ‘best-practice life expectancy’, meaning the highest life expectancy in the world that developed in a more or less straight line for more than a century and that increased by 0.2 years per calendar year. Christensen contends that, imagining this line continues to develop in the same way during the twenty-first century, half the children born after 2000 in these leading countries will celebrate their one hundredth birthday. The authors shied away from statements about maximum life expectancy. It’s not a very important limit. More important is the question whether the years gained are healthy years and how society can meet the demand for care associated with ageing.
Meaning
A white spot in our knowledge
Dutch life expectancy is still on the rise. This is good news, but it is still disappointing that previous projections were categorically too low and that experts are still unable to pinpoint what has been causing the recent rapid increase in life expectancy. Are their common factors occurring in all countries? Is it true that better care played an important role? Or are there other influences? Mortality rates will have to be further investigated in order to determine why life expectancy keeps increasing. This is not only interes-ting because of the historical developments: a better understanding of the trends will result in better predicti-ons about future life expectancy. The assumptipredicti-ons a projection is based on do really matter. Further refinement is desirable.
Life expectancy as social investment …
Increasing life expectancy is good news for the inhabitants of the Netherlands and for the government. At the same time, further ageing gives rise to new questions and problems, for example, in the area of pension plans. Although this will repeatedly put increasing life expec-tancy on the political agenda, ageing and its problems should never be a reason to stop striving for a further increase in life expectancy. Quite the contrary! The Constitution of the Kingdom of the Netherlands states that the government must take measures to promote the health of the population. An increasing life expectancy clearly may indicate that the population’s health is improving, and an ageing population can be seen as an achievement of a highly developed society.
Further reading
This chapter is based on the sub-reports and the website of the Public Health Status and Forecasts Report 2010. More information can be found on the websites of the Dutch National Public Health Compass and the Dutch National Atlas of Public Health.
References
(1) Oudste inwoner van Nederland overleden, De Volkskrant, 15 October 2009.
(2) Mackenbach JP, Garssen J. Renewed progress in life expectancy: the case of the Netherlands in:Crimmins et al. International Differences in mortality at older ages. Washington: The National academic press, 2011 (369-384)
(3) Meerding WJ, Polder JJ, Hollander AEM de, Mackenbach JP. Hoe gezond zijn de zorguitgaven? - De kosten en opbrengsten van gezondheidszorg bij infectieziekten, kankers, en hart- en vaatziekten. Zorg voor euro’s – 6. Bilthoven: RIVM, 2007. (4) Van Poppel F, Ekamper P. Historische ontwikkeling
van de sterfte, Van gezond naar beter – deelrapport Tijd en toekomst. Bilthoven: RIVM, 2010.
(5) Janssen F, Kunst A. Levensverwachting. Van gezond naar beter – deelrapport Tijd en toekomst. Bilthoven: RIVM, 2010.
(6) Fries JF. Aging, natural death, and the compression of morbidity. NEJM, 1980;303(3):130-5.
(7) Christensen K, Doblhammer G, Rau R, Vaupel JW. Ageing populations: the challenges ahead. Lancet, 2009;374(9696):1196-208.
Dutch life expectancy is rising, but is the population getting any healthier?
This question is difficult to answer. If we are to believe Trudy Dehue, professor
in Groningen, the Netherlands is fighting a real depression epidemic (1). And
according to the national health funds, at least fifteen million Dutch are
chronically ill. The Dutch Rheumatism Fund (Reumafonds) reports 2.3 million
rheumatism patients and the Dutch Skin Foundation (Huidfonds) and the
Dutch Digestive Diseases Foundation (Maag Lever Darm Stichting) estimate
their target groups to consist each of some two million patients. It would
therefore appear that the Dutch population is getting sicker. But that’s only
one side of the story. The other side is nicely described by a respondent who
participated in a survey on perceived health. According to her, ‘Being healthy
means feeling healthy, whether you’re sick or not.’ She said what a lot of
people think: health is not so much the absence of disease as the physical and
mental ability to do the things we want. Looking at it from this perspective,
the health of the Dutch has not gotten worse. More disease as well as more
health. That is the main message of this chapter.
2
More disease, but
not less healthy
���� ���� ���� ���� ���� ���� ���� ���� ����
years, women
Healthy life expectancy
1983-2008
(Source: CBS)
���� ���� ���� ���� ���� ���� ���� ���� ����
years, men
life expectancy (= l.e.) l.e. without limitations l.e. in good self-perceived health l.e. without chronic diseases �� �� �� �� �� �� �� �� �� �� �� �� �� �� �� �� �� �� �� �� �� ��
2.1
undisputedly the number one killer, with lung cancer not far behind. Lung cancer tops the list of life years lost (Figure
2.3) for both men and women due to the relatively young
age at which these cancer patients die. For women, lung cancer has not only caught up with coronary heart disease, but also with stroke and breast cancer. Together, the top-ten main causes of death represent about half of all deaths.
Disease burden
Combining lost years with the most common diseases (taking the severity of the disease into account) indicates how much disease impacts Dutch public health. Expressed in disease burden (DALYs [disability-adjusted life years]), coronary heart disease, depression and stroke are the three main contributors to the total burden of disease (Figure 2.3). Compared with mortality and years of life lost, the top-ten list of disease burden is mainly populated with diseases that have a significant negative impact on quality of life but do not cause death, such as mental disorders and arthrosis.
‘Rare diseases occur frequently’
Some further distinguishing is required when talking about disease burden, as it refers to the total disease burden for the whole of the Netherlands. This is why frequently occurring health problems are at the top of the list. This is also important from a public health perspec-tive. At the same time, one must realize that a number of rare diseases that present a huge disease burden for patients are not included in this national overview. A disease is considered to be rare if it occurs in fewer than 1 in 2,000 people. Rare diseases consist mainly of genetic disorders. The Dutch Rare Disease Foundation (Zeldzame Ziekten Fonds) estimates that one million Dutch have a rare disease. When added together, rare diseases no longer seem rare, and the disease burden is no longer negligible. The rarity of these diseases makes them difficult to diagnose and makes the development of medicines unappealing to the pharmaceutical industry.
Cancers catch up with cardiovascular diseases as main cause of death
In 2007, for the first time more people in the Netherlands died of cancer than of cardiovascular diseases. This is mainly because the mortality rates for coronary heart disease and strokes have sharply fallen, whereas the mortality rate for cancer has not. The decrease in deaths from cardiovascular diseases, and in its incidence, is the result of positive changes in the number of smokers and better prevention of high blood pressure and high cholesterol. The number of deaths is also falling thanks to better treatment of patients suffering from coronary heart disease, heart failure and stroke. The decrease in cardio-vascular diseases is higher for men than for women
Life expectancy with disease and
healthy life expectancy
Dutch life expectancy is still on the rise. Figure 2.1 shows that the years of life gained in the last 25 years are mainly years with a disease. In this period, life expectancy without a disease decreased for both men and women to 48 and 42 years respectively, representing a decrease of four to nine years. In 2008, a Dutch woman will live almost half her life with a chronic disease. This, however, doesn’t mean that the health of the Dutch population is deteriora-ting. There is also good news: since 1983, the Dutch have gained an average of 5 years without physical limitations and 2.5 years lived in good perceived health (2). This is almost as high as the increase in life expectancy (four years). Consequently these additional years are mainly years without limitations and with a good perceived health. Although more and more people are ill, the Dutch do not feel less healthy or more limited.
Disease in the Netherlands
The trends show a considerable increase in the number of people that have a disease. What are the main diseases and health problems, and are they increasing or decreasing? Most common diseases
Diabetes mellitus is the most common disease in the Netherlands, followed closely by arthrosis, coronary heart disease, neck and back complaints, and hearing impair-ments, each with more than 600,000 cases (Figure 2.2). The top-10 diseases with the highest prevalence (existing cases) are mainly chronic diseases. Incidence (new cases) is a better indicator for short-term illness, such as infections and accidents. The main four illnesses in this category are the common cold, neck and back complaints, acute urinary tract infections and accidents in the home. The prevalence and incidence figures are based on data from health care registrations, especially those maintained by general practitioners. This means that mild diseases and conditi-ons for which people decide not to cconditi-onsult a health-care provider are not included and that the figures are conse-quently lower than the actual number of people who are sick. This is true for the common cold and influenza, as well as for mental disorders. The latest NEMESIS study shows that depression occurs 1.5 times and anxiety disorders 10 times more often than the general practitio-ner is aware of.
Mortality and lost years of life are mainly caused by coronary heart disease and lung cancer
In 2007, 133,000 people died in the Netherlands, 12,000 of which died from coronary heart disease. This disease is
Disease in the future
Diabetes mellitus and arthrosis will continue to be the diseases with the highest prevalence in the Netherlands. They are also the diseases for which the absolute preva-lence will increase the most. The number of men and women who have experienced an acute myocardial infarction, the number of women with COPD and the number of men with prostate cancer will increase most. The future causes of death are increasingly characterized by ageing-associated diseases: conditions that people die from at an old age. From a public health perspective, this is a less meaningful way of ranking disease and mortality. It is much more interesting to look at the disease that will disrupt a person’s life most. This is done using the indicator ‘years lived with disease’ (YLD) (Figure 2.5). The ranking of the diseases will more or less stay the same, but a few diseases will show an absolute increase. Mental disorders and diabetes have the highest percentage increase.
Why more Dutch have a disease ...
More and more Dutch have a disease. How can this be? Have we adopted an unhealthy lifestyle, are we exposed to more risks, or are other factors at play? Determinants of health and disease certainly play a role, but they do not fully explain the increase in the number of people with a disease. Apparantly, something more is going on. Two factors clearly stand out: the first is the influence of medical science, the second is the concerted action of all kinds of social influences.
Medical factors: early detection and better chances of survival Advances in medical science increase knowledge about diseases, their causes and their treatments. This means that more can be done and that health of the population will improve. This new knowledge helps prevent diseases, but it also helps increase their occurrence because they may be detected earlier and treated better. Early detection and better treatment enable people to live longer with a disease, but they also increase the number of people with a disease. A few examples of increased disease prevalence through early detection are diabetes mellitus and various types of cancer for which population screening was introduced. Cataracts are another example. Better surgical techniques enable more people with cataracts to be treated. This improves public health, but also increases the occurrence of cataracts in our statistics, as measured by the number of surgical procedures. The number of patients is increasing, but that is good news too. Diseases are detected at a stage at which people experience only relatively few problems and can still be treated. This brings us to the second aspect. Successful treatment actually because the number of men who smoke is falling faster
than the number of women who smoke. This means that the number of men suffering from lung cancer and COPD is falling, whereas the number is still rising for women. Striking too, is the increasing number of people suffering from diabetes. This is undoubtedly linked to the increasing number of people who are overweight and the fact that general practitioners are more actively looking for diabetes patients. An active general practitioner who is more inclined to check a patient’s blood glucose levels invariably registers more patients. And finally, general practitioners are also registering more and more patients suffering from depression and anxiety disorders. And yet, new population studies have revealed that the number of people with mental disorders remains more or less steady. This means that more and more people with mental problems are seeking help and that their problems are being recognized and treated.
Low mortality from coronary heart disease and stroke compared with other countries
Although coronary heart disease and strokes are among the main causes of death in the Netherlands, internatio-nally, the Netherlands is not doing badly. The number of deaths caused by these diseases is among the lowest in Europe. Moreover, the decrease in the Netherlands, and especially that for coronary heart disease, is one of the largest in Europe. Compared with other European countries, also relatively few people in the Netherlands die from traffic accidents and suicide. The Netherlands does not fair so well among the EU-27 in terms of cancer deaths: the mortality rate for breast cancer and lung cancer among Dutch women is high, and the increase for lung cancer among Dutch women is among the highest in the European Union.
Multimorbidity: 1.3 million people suffer from multiple diseases
Combined, the lists of major diseases provide a coherent but incomplete picture of the diseases and health
problems among the Dutch population. This is not because a large number of diseases were not taken into account, but because the lists use diseases as their starting point and neglect the fact that people may be suffering from several diseases at the same.
Using people instead of diseases as the starting point shows that at least 4.5 million people in the Netherlands have a chronic disease. Of these 4.5 million people, 1.3 million suffer from several diseases at the same time. Multimorbidity is relatively rare up to the age of 55, but is much more common among older people. Almost one in three people over the age of 75 suffers from more than one chronic disease (Figure 2.4). The consequences for patients are worse for multimorbidity than for a single condition.
whether there is actually a higher burden of disease, but it is very clear that more diagnoses are being made.
… and why more diseased people does
not automatically mean less health
More diseased people, or actually more diagnoses, but not less health. This is depicted in Figure 2.1. Being healthy is apparently not the same as not having a disease. Research conducted by the Netherlands Institute for Social Research into health perceptions showed that for many people health is determined by two aspects. The first aspect is the feeling that they are healthy, fit, vital and simply feel good. The second aspect refers to ‘the ability to do the things they want to’, which also encompasses independence and freedom (of choice). People with a chronic disease can perceive themselves as healthy when these two conditions are met. Participation in the sense of actively participating and belonging can help a person feel healthy in spite of a disease or disability. It is difficult to feel healthy when a disease makes a person dependent, or when the disease is unpredictable, highly incapacitating or frightening and life-threatening.
This makes health much more than just the complement of disease, as is shown in Figure 2.6 for people with one or more chronic diseases. Although people with a chronic disease report limitations or a lower self-perceived health more frequently, it is striking that three-quarters of the Dutch with a chronic disease feel healthy and an even larger proportion indicate that they do not have any limitations. This percentage decreases as the number of health problems a person has increases. Yet, half the people with three or more diseases do not feel they have limitations. This is in part related to the influence of medicine as we discussed in the previous section. Detecting diabetes at an early stage reduces a person’s risk of complications and limitations. Early detection increases the number diabetics, but it also reduces the number of people limited by the disease.
Better care and medical aids
As already indicated in the previous PHSF, the disabling effect of diseases is decreasing (5). This development is explained by improvements in the treatment of diseases and better compensation for limitations with medical aids. This trend has continued in the last years, with an annual increase in the use of almost all medical aids. Between 2004 and 2008, the number of hearing-aid users doubled (6). The increase in the use of medical aids has reduced the number of older people who depend on personal care and has increased their ability to manage on their own. Not only medical aids but also medical interventions can help reduce a person’s limitations. For example, more and more increases a sick patient’s chances of survival. In short, a
side-effect of successful health care can be an increase in the number of people with a disease.
Societal influences
A lot of Dutch people say ‘there’s something wrong’ with them, and according to health surveys, that number is increasing. One of the reasons could be the changing demands of society. On the one hand, this is a logical and rational development: civilization not only goes hand in hand with increasing demands, but also with a society that is willing to meet them. On the other hand, people are less prepared to accept discomforts and setbacks, and seek professional help instead. Health problems can thus become a way of getting attention. People are also less tolerant of variations in behaviour and health status in part because our society more often sees prevention and treatment as solutions. There is no objective need for people to smoke, drink or be fat. Moreover, the continuing expansion of the health idea into the area of wellness and vitality is adding ever more behaviours, experiences and desires to the field of health and disease. Bearing this in mind, it is not surprising that the number of people with diseases is increasing in the medical sector and in people’s own perception.
Health-care professionals and the pharmaceutical industry also contribute to the increase in the number of sick people in the Netherlands by medicalizing common conditions. This form of medicalization is referred to as ‘disease mongering’, a reference to the inappropriate widening of the diagnostic boundaries of ‘disease’ (3). The Dutch Consumer Association refers to it as ‘symptom advertising’ and has engaged in a fight against TV commercials for nail fungus, restless legs and overactive bladder that in this way medicalize ordinary discomforts (4).
The last contributors to the increase in the number of ‘sick people’ are the ever changing and increasing demands that our knowledge economy is putting on people. Certain population groups find it increasingly difficult to deal with all pressures, as is clearly reflected in the area of mental disorders. Children who were once described as very active and later proved fully capable of holding a job are now diagnosed with ADHD and risk receiving disability assistance for handicapped young persons as soon as they leave school. A learning disability such as dyslexia is also increasingly treated as a disease.
More disease is not necessarily a bad sign
The increase in disease perception and in the number of people who are sick can be interpreted in a number of ways but does not have to be alarming. It can even reveal a positive development in public health. It is not clear