a) RIVM, Bilthoven
b) Alterra, Wageningen
c) CTB, Wageningen
RIVM report 601450019/2004
The new decision tree for the evaluation of pesticide leaching from soils
A.M.A. van der Lindena, J.J.T.I. Boestenb, A.A. Cornelesec, R. Kruijneb, M. Leistrab, J.B.H.J. Lindersa, J.W. Polc, A. Tiktaka and A.J. Verschoora.
This investigation has been performed by order and for the account of the Ministry of Spatial-planning, Housing and the Environment within the framework of project M/601450, ‘Pesticide Fate in the Environment’. The Al-terra contribution has been performed by order and for the account of the Ministry of Agriculture, Nature and Food Quality within the framework of research program 416 ‘Pesticides and the Environment’. The CTB con-tribution has been performed for the account of both ministries.
Het rapport in het kort
Dit rapport beschrijft een nieuwe beslisboom voor de beoordeling van uitspoeling van gewas-beschermingsmiddelen naar het grondwater. Een nieuwe beslisboom was nodig om aanslui-ting te houden met Europese beoordelingsrichtlijnen. In de EU-beoordeling staat het begrip ‘reasonable worst case’ centraal. In de nieuwe beslisboom wordt dit begrip expliciet gedefi-nieerd als het 90-percentiel van de uitspoelingsconcentratie in het gebied waarin het gewasbe-schermingsmiddel mogelijk wordt toegepast. In de eerste stap van de beoordeling wordt het model PEARL toegepast op één enkel scenario. Deze stap is bedoeld om stoffen met een ver-waarloosbaar risico op uitspoeling te identificeren. Om aan te sluiten bij de EU-beoordeling wordt in deze stap gebruik gemaakt van een scenario dat ook in de EU-beoordeling gebruikt wordt, namelijk het ‘FOCUS Kremsmünster scenario’. Indien het uitspoelingsrisico niet ver-waarloosbaar klein is, kan de tweede stap in werking treden. In deze stap wordt met behulp van het ruimtelijk verdeeld uitspoelingsmodel GeoPEARL het 90-percentiel van de uitspoe-lingsconcentratie berekend. Ook biedt de tweede stap de mogelijkheid om meer realistische waarden voor stofparameters te introduceren, bijvoorbeeld stofparameters verkregen op basis van lysimeter- of veldstudies. Als in de tweede stap blijkt dat er een risico voor uitspoeling bestaat, dan kan in de derde stap van de beoordeling worden nagegaan of in de waterverza-digde zone tot op een diepte van 10 m voldoende afbraak plaats vindt en het risico van uit-spoeling naar het diepere grondwater beneden de geaccepteerde norm blijft. In vergelijking met de oude beslisboom blijkt de nieuwe beslisboom in de eerste stap ongeveer even streng te zijn als de oude, zonder dat een veiligheidsfactor gebruikt hoeft te worden. In de nieuwe tweede stap worden, op het kritische niveau van 0,1 µg dm-3 (in de oude procedure),
concen-traties berekend die tot ongeveer een factor 10 hoger liggen. Het hanteren van herhaalde toe-passing in de nieuwe beslisboom is de belangrijkste oorzaak voor dit verschil. Hoewel dit niet is onderzocht, wordt verwacht dat de nieuwe beslisboom op korte termijn geen invloed heeft op de breedte van het middelenpakket. De reden is dat de laatste – uiteindelijk beslissende – stap in de beoordeling niet is veranderd.
Trefwoorden: registratie; bestrijdingsmiddelen; uitspoeling; beslisboom; GeoPEARL;
Abstract
The Dutch decision tree on leaching from soil has been re-designed to be more in line with EU guidelines on the assessment of the leaching potential of substances. The new decision tree explicitly defines reasonable worst-case conditions as the 90th percentile of the area to which a substance is applied. The tree also determines whether the median annual leaching concentration over a period of 20, 40 or 60 years complies with the EU-drinking water limit, with the length of the period depending on the application frequency. The FOCUS Krems-münster scenario, officially adopted in the Netherlands as the national scenario, is, in the first tier, used to identify substances with a negligible leaching risk, which can then be registered without further assessment. The core of the decision tree is the second tier, in which the spa-tially distributed model, GeoPEARL, is used to calculate the leaching. The third tier considers the water-saturated zone up to a depth of 10 m below soil surface. As this tier did not need an update, the new approach is expected to have very little influence on the number of registered substances. Comparing the new approach with the old, we found the new first tier to be al-most as strict as the old one, at least when the safety factor of 100 was not used, as in the old tree. For substances for which the leaching concentration was calculated at around 0.1 µg dm
-3 using the old procedure, GeoPEARL yielded results that were approximately 10 times
higher. This difference was mainly due to the annual application of the substances in the new procedure.
Preface
In their meeting of September 10th, 2004, minister Veerman of the Ministry of Agriculture, Nature and Food Quality and State Secretary Van Geel of the Ministry of Spatial-planning, Housing and the Environment decided to adopt the new decision tree on leaching as the offi-cial procedure to evaluate the leaching potential of plant protection products in the Nether-lands. This decision tree is described in this report.
The work described in this report has been discussed several times with representatives of the Dutch ministries of LNV and VROM and other stakeholders. We are grateful for constructive discussions and appreciated the suggestions for improvements. The group of representatives consisted most recently of (alphabetical order):
− André Bannink, VEWIN; − Dominique Crijns, VROM;
− Gerhard Görlitz, Bayer CropScience; − Her de Heer, LNV;
− Peter Leeuwangh, Ecotox; − Marianne Mul, UvW; − Jo Ottenheim, LTO; − Leo Puijker, KIWA; − Jan de Rijk, VROM; − Wim Stegeman, DuPont; − Paul Sweeney, Syngenta;
Contents
Samenvatting 11 Summary 13 1 Introduction 15 1.1 Background 15 1.2 Motivation 16 1.3 Objectives 17 1.4 Approach 17 1.5 Reading guidance 182 The new decision tree on leaching 19
2.1 Overview 19
2.2 Starting points and criteria 22
2.3 Detailed description of the decision tree 23
2.3.1 Description of tier 1 23
2.3.2 Description of tier 2 24
2.3.3 Description of tier 3 29
3 Example applications of the decision tree 31
4 Comparison with the old decision tree on leaching 39
4.1 Comparison with the old standard scenario for spring applications 39 4.2 Comparison with FOCUS scenarios for spring applications 41 4.3 Comparison with the old standard scenario for autumn applications 42 4.4 Comparison with FOCUS scenarios for autumn applications 43
5 Conclusions and recommendations 47
5.1 Conclusions 47
5.2 Recommendations 48
References 49
Appendix 1 Glossary 51
Appendix 2 Old decision tree 53
Appendix 3 Overview of the new decision tree on leaching 55
Samenvatting
Nederland heeft sinds 1988 gebruik gemaakt van een beslisboom om het risico van uitspoe-ling van bestrijdingsmiddelen naar grondwater te kunnen beoordelen. Door recente ontwikke-lingen op EU niveau was het noodzakelijk om deze beslisboom te herzien om de afstemming met de EU optimaal te houden.
Uitgangspunt is het EU standpunt dat het grondwater bescherming behoeft; met name wat betreft de functie ‘bron voor de bereiding van drinkwater’. De EU invulling van deze be-scherming geeft aan dat concentraties van werkzame stoffen en relevante metabolieten in het grondwater niet groter dan of gelijk mogen zijn aan 0,1 µg dm-3. Nederland heeft deze norm
gelegd op het grondwater dat zich op 10 m beneden het bodemoppervlak bevindt. Om te kun-nen functioneren in een beslisboom is echter een meer operationele en toetsbare norm nodig. Dit rapport geeft als operationeel criterium dat de mediaan van de concentraties in het grond-water op 10 m diepte over een lange periode (20 – 60 jaar afhankelijk van de toepassingsfre-quentie) lager moet zijn dan 0,1 µg dm-3, onder tenminste 90 % van het oppervlak waarop de stoffen worden gebruikt.
De nieuwe beslisboom is een hulpmiddel bij het toetsen. Evenals de oude beslisboom is de nieuwe beslisboom onderverdeeld in drie stappen (zo’n stap wordt internationaal ‘tier’ ge-noemd). In de eerste stap wordt een screening van stoffen uitgevoerd op basis van het mini-maal vereiste dossier. Getoetst wordt of de berekende 80-percentiel-concentratie (van een reeks van 20 jaren, respectievelijk 40 of 60 jaar afhankelijk van de toepassingsfrequentie) voor het FOCUS Kremsmünster-scenario, berekend met PEARL, lager is dan 0,1 µg dm-3. Stoffen die hieraan voldoen, kunnen in Nederland worden toegelaten voor wat betreft het uit-spoelingsgedrag. Stoffen die niet voldoen, kunnen geen toelating krijgen tenzij in de tweede of derde stap alsnog blijkt dat aan het criterium wordt voldaan.
In de tweede stap van de beslisboom staan berekeningen met het model GeoPEARL centraal. GeoPEARL berekent de uitspoeling van een stof specifiek voor het toepassingsareaal van de stof. De belangrijkste uitkomst is de 90-percentiel-waarde over het oppervlak van de mediane concentratie in de tijd in het bovenste grondwater. De mediaan van de concentraties wordt gezien als een meer robuuste parameter dan het gemiddelde, omdat dit laatste sterk beïnvloed kan worden door toevallige extremen in de invoer voor de berekeningen. De tweede stap biedt de mogelijkheid om aanvullende gegevens uit laboratorium, lysimeterstudies en veldstudies mee te nemen om tot een betere benadering van de verwachte praktijksituatie te komen. De tweede stap biedt tot slot de mogelijkheid de uitspoeling te toetsen aan gegevens uit monito-ring studies betreffende het bovenste grondwater; deze gegevens dienen dan aan te tonen dat de verwachte uitspoeling in de praktijk niet optreedt.
Omdat grondwaterbeschermingsgebieden gemiddeld genomen kwetsbaarder zijn voor uit-spoeling van stoffen dan totale landbouwgebieden, kunnen stoffen niet worden toegelaten in deze gebieden als de Kremsmünster-concentratie (tier 1) of de GeoPEARL concentratie voor het gebruiksoppervlak (tier 2) groter dan 0,01 µg dm-3 is. Door middel van aanvullende
speci-fieke informatie over het gedrag van stoffen in deze gebieden kan een toelatingaanvrager tonen dat de verwachte uitspoeling in de praktijk niet op zal treden. In dat geval kan de aan-vraag alsnog worden gehonoreerd voor het totale toepassingsgebied.
Als de tweede stap van de beoordeling niet leidt tot toelating van de stof, kan de aanvrager gegevens over het gedrag van de stof in de waterverzadigde zone tussen 1 en 10 m diepte overleggen of gegevens over het voorkomen van de stof op 10 m beneden maaiveld. Deze stap in de beoordeling is niet gewijzigd ten opzichte van de oude beslisboom. Hoewel dit niet is onderzocht, wordt dan ook verwacht dat de nieuwe beslisboom geen invloed heeft op de breedte van het middelenpakket.
Het rapport geeft een aantal voorbeelden, waarin het gebruik van de beslisboom wordt gede-monstreerd. Daarnaast wordt voor een aantal stoffen een vergelijking gemaakt tussen de oude en de nieuwe beslisboom. De belangrijkste conclusies uit deze vergelijking zijn:
− het FOCUS Kremsmünster-scenario is voor het merendeel van de stoffen en toepassingen belangrijk kwetsbaarder dan het oude Nederlandse scenario; de voorheen gehanteerde vei-ligheidsfactor van 100 in de eerste stap van de beoordeling kan hierdoor komen te verval-len;
− als het gehele agrarische gebied in de berekeningen wordt meegenomen, dan blijkt de 90 percentiel GeoPEARL-concentratie op het kritische niveau van 0,1 µg dm-3 tot onge-veer een factor 10 hoger te liggen dan de concentratie berekend met het oude scenario; de belangrijkste oorzaak hiervan is dat in de nieuwe procedure wordt uitgegaan van herhaal-de toepassing van herhaal-de stof.
Summary
In the Netherlands a decision tree has been used since 1988 to assist in the evaluation of the risk of leaching of pesticides to groundwater and in decision making. Recent developments in registration procedures at the EU level made it necessary to redesign the decision tree and to update a number of accompanying procedures.
EU procedures aim at protecting groundwater against contamination with pesticides above the level of 0.1µg dm-3, with special regard to the groundwater as a source for drinking water. Pesticides and relevant metabolites should not exceed this concentration level. The Nether-lands has implemented this part of the EU directive 91/414/EEC in its national legislation; specifically it is stated that groundwater at a depth of 10 m below soil surface should comply with the directive. For use in a decision tree however, the criterion needs further specification; it should be possible to test scientifically whether concentrations in groundwater comply. This report gives an operational criterion: the long-term median concentration of an active ingredi-ent or its relevant metabolites at 10 m depth should not exceed the value of 0.1 µg dm-3 under at least 90 % of the area of potential use of the substance.
The new decision tree helps in the evaluation of the registration of plant protection products. Like in the old decision tree, three tiers are distinguished. The first tier identifies substances with a small or negligible risk of leaching to groundwater, with only minimal requirements for the dossier. This tier evaluates whether the 80th percentile leaching concentration (in a series of 20, 40 or 60 years, depending on the application frequency) for the FOCUS Krems-münster scenario, calculated with PEARL, is below 0.1 µg dm-3. If so, the substance can be registered in the Netherlands. If not, substances cannot be registered unless higher tier evalua-tion demonstrates that the substance complies with the criterion.
In the second tier the GeoPEARL software package is used to evaluate the leaching of the substance. GeoPEARL calculates the leaching of a substance to the uppermost groundwater for the area of use of the substance. The most important result for the decision tree is the 90th areal percentile of the median leaching concentration over a period of 20, respectively 40 or 60 years, depending on the application frequency. The median concentration is regarded to be more robust than the mean leaching concentration as the latter is highly influenced by occasional extreme situations in the calculations. In the second tier it is possible to introduce results from more specific laboratory studies and field or lysimeter experiments on the leach-ing of pesticides. Such results may refine the evaluation. Finally, the second tier offers the possibility to evaluate the leaching on the basis of results of monitoring programs concerning the occurrence of pesticides in the uppermost layer of the groundwater. Results of such moni-toring programs should show whether the expected leaching occurs under practical circum-stances.
Agricultural soils in groundwater protection areas are, on average, more vulnerable to leach-ing than soils in other agricultural areas. Therefore, a safety factor is introduced to protect these areas. If the target concentration, as calculated with PEARL for the Kremsmünster
sce-nario or with GeoPEARL for the area of use in the Netherlands, is larger than 0.01 µg dm-3, then the plant protection product cannot be allowed in groundwater protection areas. Specific information on the behaviour of the plant protection product, however, might be used to dem-onstrate the safe use in these areas and therewith overrule the safety factor.
If the registration of a substance is denied in the second tier of the decision tree, an applicant may show, with results of experiments on the behaviour of the substance in the water-saturated zone, whether the criterion is met at 10 m below soil surface. He may also show this via results of a dedicated monitoring programme for this depth. This third tier is identical to the third tier of the old decision tree. It is therefore expected that application of the new deci-sion tree has hardly any effect on the number of available active substances in the Nether-lands.
Next to the new decision tree itself, this report gives a number of examples on the use of the decision tree. Furthermore the new decision tree is compared to the old one for a number of substances. The most important conclusions from these comparisons are:
− the FOCUS Kremsmünster scenario is considerably more vulnerable to leaching than the old standard Dutch scenario for the majority of substances; the formerly used safety factor of 100 is no longer necessary in the first tier of the new decision tree;
− if the total agricultural area of the Netherlands is considered, then the 90th percentile
GeoPEARL concentration is up to a factor of 10 higher than the value calculated with the old standard scenario. The most important reason for this difference is the periodically re-peated application in the GeoPEARL calculation procedure whereas a single application was assumed in the old procedure.
1 Introduction
1.1 Background
Leaching to groundwater is a possible side effect of the use of plant protection products (PPPs), which endangers the functioning of groundwater, being:
− a source for the production of drinking water;
− a source for the production of irrigation and process water; − a source of water supply for certain nature reserve areas; − an environment for organisms inhabiting groundwater.
General policy in the European Union is to protect groundwater from being contaminated and therefore leaching is one of the aspects included in the evaluation procedure preceding the registration of PPP. The evaluation procedure aims at protecting groundwater from being con-taminated with plant protection products because of at least three reasons:
− general precaution; − human safety; − ecosystem quality.
The procedure evaluates whether the concentrations of residues of PPPs in groundwater re-main below the concentration limit (0.1 µg dm-3), or, if lower, a toxicologically based value. The first value is based on a general precautionary principle.
In member states of the European Union plant protection products (PPPs) can only be regis-tered if they fulfil the requirements as stated in Directive 91/414/EEC (EU, 1991) and later updates and implementation notes. The estimation of the risk of groundwater contamination is part of the registration procedure. Annex VI to the Directive 91/414/EEC (EU, 1997) states that admission shall be granted if the chemical and each of its relevant metabolites:
− have a calculated concentration in the groundwater of less than 0.1 µg dm-3 or less than
0.1 times the ADI in µg/kg bodyweight (smallest of both values), or
− have a measured concentration in groundwater of less than 0.1 µg dm-3 or less than
0.1 times the ADI in µg/kg bodyweight (smallest of both values).
Due to internal EU regulation, each of the member states is obliged to incorporate the criteria in their national legislation. In the Dutch legislation, the leaching criterion is set for the upper groundwater (BMB, 1995; BUBG, 1995; RUMB, 2000). To protect the groundwater as a source of drinking water there must be reasonable certainty that the concentration of the chemical or its relevant metabolites in the groundwater at 10 m depth does not exceed
0.1 µg dm-3. It should be noted that the criterion of 10 m depth is the Dutch elaboration of the European standard described for water intended to be used for drinking water.
After the current transition stage from national to European registration procedures, evalua-tion of the possible registraevalua-tion of a PPP at the member state level can only be considered if the active substance of the PPP has an Annex I listing; i.e. it occurs on the list of substances for which safe use in areas of the EU is possible. With regard to leaching, the possible safe use can be demonstrated using the FOCUS scenarios (FOCUS, 2000). The evaluation of the leaching at the European level is highly standardised (harmonised) for first tier decisions;
there are nine scenarios with fixed soil and climate parameters, there is a limited choice in models and extensive guidance is given for deriving the input parameters. The evaluation at the national level is not harmonised (yet); most countries however follow a tiered approach. In the first tier some countries use a few FOCUS scenarios to evaluate the leaching in their country (for example the United Kingdom) while other countries use their own standard sce-nario (for example Germany and the Netherlands). Higher tiers build upon the first tier, but discussion on the harmonisation for these levels is just starting up.
In the Netherlands a tiered approach is operational since 1989 (CTB, 1993; Brouwer et al., 1994; CTB, 2003). The approach has been laid down in an explicit scheme (decision tree) with clear criteria. Figure A1 in Appendix I gives the current version of this scheme. A central role is given to the Dutch standard scenario, which was developed in 1987 – 1988 (Van der Linden and Boesten, 1989; Boesten and Van der Linden, 1991). This scenario, in this text further referred to as NLS, was constructed to be a realistic worst case scenario, using a great deal of expert judgement. A 75% wet year in combination with a soil ranking approximately 80% in vulnerability (based on expert judgement, taking into account organic matter content in the top metre and soil texture) was thought to be suitable. In the first two tiers of the deci-sion tree the leaching of a substance is calculated using this scenario. In the first tier a safety factor of 100 is applied to account for uncertainties in the scenario, in the model and in the model input in order to avoid unwarranted approval of substances. Substances meeting this criterion do not need further leaching examination, while others have to undergo further evaluation in a higher tier.
1.2 Motivation
FOCUS (2000) explicitly defines the realistic worst case as the scenario having the 90th per-centile in vulnerability. Although FOCUS has defined a scenario as being a realistic combina-tion of crop, soil, weather and management condicombina-tions (FOCUS, 1995), vulnerability is attrib-uted only to soil and climatic conditions (FOCUS, 2000); for other aspects average conditions and / or label instructions are used. For example, the calculation has to be made for the crop on / in which the PPP, for which registration is requested, will be used. Furthermore, dosage, application time and application technique should be according to label instructions, which follow Good Agricultural Practice. The approach used in the Netherlands up till now deviates from the FOCUS approach. The construction of the scenario was analogous to the FOCUS approach with respect to the selection of the soil. For the climatic conditions, an explicit choice for a relatively wet year was made in the Netherlands, whereas FOCUS chooses the 80th percentile leaching concentration after calculating for a weather sequence of 20 years. Application time, May 26th for a spring application or November 1st for an autumn applica-tion, and crop are fixed in the Dutch approach, so also deviating from the FOCUS approach. FOCUS has chosen to follow label instructions with respect to dosage, application timing and application technique. Fate and behaviour properties of substances are not part of the vulner-ability definition in both approaches; average properties are used as input.
The reasons for reconsidering the Dutch decision tree on leaching were:
− the deviations between the Dutch approach and the FOCUS approach;
− the availability of Dutch data (such as soil, climate and land use data) in Geographical Information Systems (GIS);
− the availability of a spatially distributed model: GeoPEARL.
The availability of the spatially distributed model and the electronic data make it possible to explicitly test the vulnerability objectives of the decision tree. Such a model takes location specific circumstances into consideration, which is a big advantage over approaches used up till now.
1.3 Objectives
The goals of this study are to develop a fully transparent decision tree for the evaluation of leaching of plant protection products and to compare this new decision tree with the existing procedure in the Netherlands.
1.4 Approach
The development of the decision tree is ‘bottom-up'. This implies that the final decision on the admissibility of a substance is the starting point for the development; criteria for earlier deci-sions in the process are derived from the final criterion. The general philosophy of decision trees implies that earlier or interim decisions are based on more stringent criteria than the final decision. Decisions in earlier tiers usually are based on less information and therefore more stringent criteria are warranted. The procedure should minimise the chance of unwarranted approval of the substance.
The tiered approach of the old decision tree generally is considered to be adequate as it fo-cuses attention on substances having a leaching potential around the critical value or higher. In the first tier the leaching potential is assessed with a minimum of effort. For substances having a low leaching potential a final decision with regard to leaching can already be taken in the first tier. It was decided to keep this tiered approach. The development of the new deci-sion tree included the structure of the decideci-sion tree as well as the decideci-sion criteria at each step, except of course the final criterion. The approach was discussed with the ministries that commissioned this study and with stakeholders at different stages of the development.
For the development of the decision tree as well as for the evaluation of its functioning, the following research was conducted:
− for a number of substances calculations were performed for the NLS (using PEARL) and for the Netherlands as a whole (using GeoPEARL). The target quantities obtained in these calculations were compared in pairs;
− for hypothetical substances calculations were performed with PEARL for relevant FO-CUS scenarios and the results compared with the results obtained under 1. This exercise was performed to evaluate the possibility of using one or more FOCUS scenarios in the first tier of the decision tree;
− a few example substances were taken through both the old and the new decision tree and the decisions at tier 1 and tier 2 were compared. The comparison was not relevant for
tier 3, because essentially there was no change in this tier. The evaluation of monitoring data, for both shallow groundwater and groundwater at a depth of 10 m, has been made more explicit, but the approach and the criteria have not been changed; this is described in a separate report (Cornelese et al., 2003);
− the new decision tree assesses leaching of a substance regarding the area on which the substance is expected to be used, whereas the old decision tree assessed the leaching without regard of the area of use. The influence of this difference in area was demon-strated with a few examples, covering a range in crop areas;
− finally the potential leaching in catchment areas for drinking water production was com-pared to the potential leaching in the area of use in the Netherlands. This is treated in a separate report (Kruijne et al., 2004).
1.5 Reading guidance
This report is one of a series of reports dealing with the newly developed decision tree. This report describes the framework of the decision tree, while other reports zoom in on specific aspects of the decision tree. Chapter 2 of this report describes the new decision tree, including the criteria and decision points. Chapter 3 demonstrates the use of the decision tree. In chapter 4 the new decision tree is compared systematically with the old decision tree. Also this chap-ter highlights some of the new features of the software used in parts of the decision tree, espe-cially with respect to groundwater abstraction areas and to zooming in on crops. Finally, chapter 5 draws some conclusions and gives recommendations. The other reports in this series are:
− a report on the interpretation of field and lysimeter experiments, considering parent sub-stances (Verschoor et al., 2001);
− a report on the evaluation of monitoring studies (Cornelese et al., 2003);
− a report dedicated to the evaluation of leaching in groundwater abstraction areas (Kruijne
et al., 2004);
− two reports on the backgrounds and use of GeoPEARL (Tiktak et al., 2003; 2004);
− a report on the interpretation of field and lysimeter experiments, considering metabolites, is foreseen.
2 The new decision tree on leaching
2.1 Overview
As stated in chapter 1, the general aim of the evaluation procedure with respect to leaching is to protect groundwater from being contaminated. The most important aspect here is that groundwater is a source for drinking water and that this water has to comply with the quality criteria. The concentration of a pesticide or relevant metabolite in public wells should comply with the drinking water standard. This standard is equal to the maximum allowable concentra-tion of a plant protecconcentra-tion product in groundwater as menconcentra-tioned in Annex VI of Directive 91/414/EEC (EU, 1991; EU, 1997). The evaluation procedure should identify, with reason-able certainty, substances that comply with this value. Because of the highly varireason-able condi-tions that occur in the field, absolute certainty that the limit will never be exceeded would imply that no substance can be registered. Therefore, the limit value should be regarded as a target value and the compliance with this value should be specified in more detail in the evaluation procedure.
FOCUS (2000) interprets the Directive as: the value of 0.1 µg dm-3 should not be exceeded under reasonable worst case conditions (also called realistic worst case conditions), with rea-sonable worst case defined as the 90th percentile in vulnerability. For the first-tier assessment at EU level, the 90th percentile in vulnerability for a certain region was approximated by tak-ing a soil in that region ranktak-ing 80% in vulnerability (primarily based on qualitative databases and expert judgement) and the 80th percentile of the annual average leaching concentrations calculated for a time series of 20 periods of 1, 2 or 3 years. This simplified approach was fol-lowed because of poor availability of data.
The better availability of data on soil properties in the Netherlands, as compared to the situa-tion for Europe in 1999 - 2000, makes it possible to approximate the realistic worst case bet-ter. Vulnerability is determined by many factors, a.o. crop, soil properties, climatic conditions and properties of the substance. For crops, soils and climate rather detailed databases, stored in a GIS, are available. It is unattractive to include uncertainty in substance properties in the vulnerability definition because there is usually little information available about e.g. uncer-tainty in DegT50 and Kom (the dossier contains usually some four degradation and sorption
studies which does not result in robust estimates of standard deviations of DegT50 or Kom). An
additional disadvantage is that such an estimation will often lead to discussions between CTB and notifiers which may delay the regulatory decision. It is an interesting topic of research whether including uncertainty of substance properties will lead to strongly different estimated leaching concentrations (considering the 90th percentile in both cases). FOCUS (2000) has chosen not to incorporate the crop in the scenario definition; this primarily because the regis-tration is specific to a certain crop. This leaves soil properties and climate as the two most important factors for the definition of the realistic worst case. Considering these two factors, more than one approximation of the realistic worst case is possible. To realise the 90th percen-tile vulnerable situation several combinations of these properties are possible, ranging from attributing all vulnerability to the soil and none to the climate to attributing all vulnerability to the climate and none to the soil. In the FOCUS definition, the temporal variability of climate
is considered and not the spatial variability. From the perspective of the groundwater func-tions, it is considered appropriate to attribute all vulnerability to space; i.e. to soil and the spa-tial variability in climate. Therefore, the workgroup proposes the following explicit criterion for plant protection products, and their metabolites, in groundwater:
The concentration in groundwater should be less than 0.1 µg dm-3 under at least
90% of the potential area of application for at least 50% of the time.
The value of 0.1 µg dm-3 should be replaced by the value of 0.1 times the ADI in µg/kg
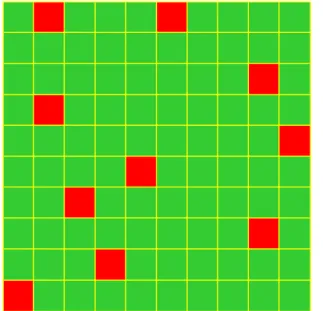
bodyweight if this value is smaller than 0.1 µg dm-3. Figure 2.1 gives a simplified graphical representation of the criterion for a substance just meeting the criterion. The figure indicates that, in this situation, the average concentration beneath 90% of the area is below 0.1 µg dm-3 and beneath 10% of the area is 0.1 µg dm-3 or above. The percentage of area meeting the value of 0.1 µg dm-3 is taken as the basis for the decision.
Production wells of drinking water plants usually are positioned lower than 10 m below soil surface (upper position of the well screen). In the production wells water from a larger infil-tration area is mixed. Water at the depth of 10 m usually originates from a relatively small infiltration area and concentration patterns at this depth still resemble the concentration pat-terns in the uppermost groundwater if transformation in the zone between approximately 1 and 10 m depth is negligible (Uffink and Van der Linden, 1998; Tiktak et al., 2004). Disper-sion processes below the depth of 10 m and mixing of water from different zones in the infil-tration area of the production plant will change conceninfil-trations.
Figure 2.1. Graphical representation of the leaching criterion. Green grid cells indicate a concentration below 0.1 µg dm-3, red grid cells indicate a value at or above 0.1 µg dm-3.
In the evaluation procedure it is determined whether the operational criterion is met. The evaluation procedure starts with examining the completeness of the dossier and the quality of the individual reports. If the dossier meets the minimal requirements, enough information is
available for determining the leaching potential of a substance. This leaching potential is de-termined with the help of a decision tree. A highly simplified scheme of this decision tree is given in Figure 2.2. A more detailed scheme is given in Appendix 2.
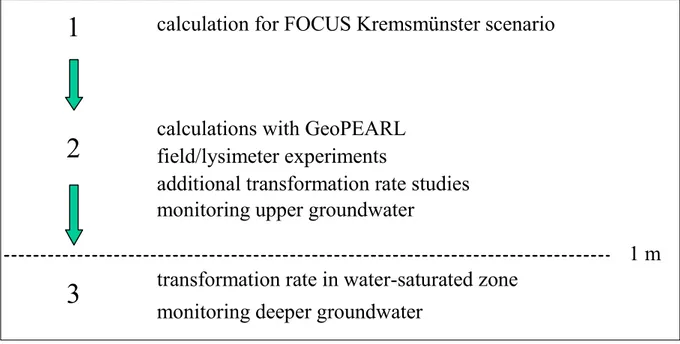
The decision tree follows a tiered approach, like most of the decision trees. In the following, the decision tree is summarised; a more detailed description is given in paragraph 2.3. The first tier involves a simple calculation procedure for the FOCUS Kremsmünster1 scenario. For non-volatile substances having a DegT50 > 10 d and a Kom > 10 dm3 kg-1, the procedure
en-tirely follows the procedures as recommended by FOCUS (2000), although here a calculation with PEARL (Tiktak et al., 2000; Leistra et al., 2001) is required. For volatile substances, injected into or incorporated in the soil, it is assumed that there always is a certain potential to reach the groundwater by vapour diffusion and these substances are immediately taken to tier 2. For substances not complying with the DegT50 and Kom requirements the leaching is
highly dependent on the time of application, so also for these substances a GeoPEARL calcu-lation is required.
1
2
3
calculation for FOCUS Kremsmünster scenario
calculations with GeoPEARL
field/lysimeter experiments
additional transformation rate studies
monitoring upper groundwater
transformation rate in water-saturated zone
monitoring deeper groundwater
1 m
Figure 2.2. Simplified representation of the new decision tree on leaching.
The second tier involves calculations with the GeoPEARL software package, which calculates the potential of a substance to reach the uppermost groundwater under the area of use. If the minimal information from the dossier is not sufficient to demonstrate an acceptable leaching potential, the applicant may use information from additional laboratory and field studies (in-cluding lysimeter studies). Finally, at the end of the second tier the applicant might perform a monitoring study in order to demonstrate that the leaching potential is acceptable.
1 The Kremsmünster scenario has been chosen, because in this scenario the groundwater level
is fluctuating within the boundaries of the soil profile. This situation is thought to be represen-tative for most of the soil profiles occurring in the Netherlands.
Groundwater protection areas are, on average, more vulnerable to pesticide leaching than other agricultural areas (Kruijne et al., 2004). For selected hypothetical substances, the calcu-lated GeoPEARL target concentration was considerably higher for the ensemble of ground-water protection areas than for the agricultural area, dependent on the crop for which the cal-culations were run. Therefore, a safety factor is introduced for these areas: a plant protection product cannot be used in groundwater protection areas if the calculated target concentration for the area of use is between 0.01 and 0.1 µg dm-3. Additional information on the behaviour in groundwater protection areas might however demonstrate the possible safe use and over-rule the safety factor.
The third tier evaluates the behaviour of the substance in the saturated zone of the soil, up to a depth of 10 m below soil surface. The applicant might demonstrate that transformation in the saturated zone is such that the concentration at 10 m below soil surface meets the require-ments (see Van der Linden et al. (1999) for more details). The final stage of the third tier, at the same time the final stage of the decision tree, uses data from monitoring studies with sam-ples taken around the target depth of 10 m below soil surface. If these data show that the leaching potential is acceptable, the substance can be registered. If these data fail to show an acceptable leaching potential, the registration of the substance in the Netherlands will be de-nied.
2.2 Starting points and criteria
The new decision tree leaching is a framework of rules, criteria and approaches, which assists in decisions on the registration of plant protection products. The evaluation procedure has to assess the possible contamination of the groundwater above the EU guideline value. Special emphasis is on groundwater as a possible source for the production of drinking water. It is evaluated whether concentrations of a substance in potentially abstracted groundwater remain below the limit value. Kruijne et al. (2004) treat this part in more detail.
The EU has chosen to base decisions with respect to leaching on reasonable worst case condi-tions (EU, 1991). So in a scenario representing reasonable worst case condicondi-tions, the calcu-lated leaching concentrations should not exceed the threshold value. FOCUS (1995) specifies the reasonable worst case as the situation indicating the 90th percentile in vulnerability. As described in chapter 1, FOCUS (2000) attributes vulnerability to soil and climatic conditions, in equal shares, and not to crop, properties of plant protection product or management prac-tice. When considering these five aspects of a scenario, we agree with FOCUS that substance properties, crop and management practice should not be part of the vulnerability definition. Crop should not be part because a registration application is for one or more specific crops. With respect to groundwater quality and the function of groundwater being a source for drink-ing water, it is considered better to protect a larger area from exceeddrink-ing on average the threshold value than a smaller area against peaks. Following this line of thinking, the 90th percentile in vulnerability is determined by the area of use, for which the average concentra-tion in time should not exceed the threshold value.
General principles of decision trees are:
− criteria are more severe in earlier stages in order to avoid unwarranted approval of the substance;
− the information used for taking decisions increases when going to higher tiers; − going to higher tiers requires more efforts from both the applicant and the assessor; − the final criterion equals the juridical requirements for the substance.
Decisions are taken after each assessment at each tier. The decisions at the end of the first and at the end of the second tier may be overruled by information from higher tier experiments or studies. The structure and layout of the decision tree should be such that the higher tier allows to show that the substance can be registered although a non-registration decision was taken at the earlier tier. The environmental criterion in:
− tier 1 is the calculated target concentration, obtained with PEARL for the Kremsmünster scenario, using input data from the basic dossier. Its value should be below 0.1 µg dm-3; − tier 2 is either the calculated target concentration, obtained with GeoPEARL using input
data from the basic dossier and /or higher tier experiments, or the 90th percentile of moni-toring results from the uppermost groundwater. The target concentration in GeoPEARL pertains to 90% of the area of potential application in the Netherlands. The target concen-tration should be lower than 0.1 µg dm-3;
− tier 3 is transformation in the saturated zone under all chemical conditions such that the 90th percentile concentration in groundwater at 10 m depth is below 0.1 µg dm-3. The noti-fier may also use monitoring data to show that samples taken around 10 m depth show that the concentration at 10 m depth is below 0.1 µg dm-3.
In the first and the second tier, a safety factor of 10 is applied to the PEARL and GeoPEARL calculations for drinking water abstraction areas; a plant protection product will not be al-lowed in these areas if the target concentration is between 0.1 and 0.01 µg dm-3. Specific in-formation for groundwater abstraction areas may overrule this safety factor.
2.3 Detailed description of the decision tree
2.3.1 Description of tier 1
Tier one is the first step of the evaluation. This step distinguishes substances with a small or negligible risk of leaching from substances with some leaching potential on the basis of the minimally required information (basic dossier information) and with minimal effort of the assessor. The evaluation in the first tier is without regard to the area of use. Based on the cal-culations presented in chapter 4, the work group considers it appropriate to use results from the EU monograph on a specific substance, provided that:
− the substance is not both volatile2 and injected or incorporated into the soil;
− the substance is not dissociable, or the pKa of the substance is ≥ 8;
− the DegT50 does not depend on soil properties;
2 A substance is considered volatile if the vapour pressure at 20 °C is greater than 10-4 Pa
− the average DegT50 under reference conditions is above 10 days and the average Kom is
above 10 dm3 kg-1;
− there are leaching estimates for the Kremsmünster scenario, obtained with the PEARL model.
If the above criteria are fulfilled, calculated results for the Kremsmünster scenario are taken for making the decision. If the criteria 1 through 4 are met, but not criterion 5, a standard cal-culation for the Kremsmünster scenario is performed with the PEARL model. If the calculated leaching concentration (i.e. the 80th percentile in time of the annual average leaching concen-tration at 1 m depth) is below the threshold value of 0.1 µg dm-3, the substance is considered to have a leaching potential that meets the criterion stated in law (conform chapter 1). The substance can be registered with respect to the leaching criterion. If the second and / or third criteria are not met, the leaching for the Kremsmünster scenario is calculated according to FOCUS procedures, using conservative estimates of Kom and DegT50. E.g the Kom can be
taken at pH (CaCl2) of 7.5 or, alternatively, the Kom,base may be used. Again the FOCUS target
value is used for decision making and the same criterion is used. If the first criterion is not met, the substance is considered to have some potential to reach groundwater by vapour diffu-sion. These substances are taken to the second tier and evaluated there. A single scenario is insufficient to evaluate downward movement of relatively volatile substances through the soil. For substances not fulfilling the fourth criterion the time of application has a high influence on the calculated leaching concentration, so the target GeoPEARL concentration is not neces-sarily lower than the 80th percentile Kremsmünster concentration. For this reason these sub-stances are also taken to the second tier and evaluated there. As stated before, a safety factor of 10 is applied to protect groundwater abstraction areas.
In the calculations to be performed, the following information from the EU monograph is used:
− physico-chemical properties of the substance; for example molar mass, solubility in water, vapour pressure and, for ionisable substances, pKa;
− central values for the transformation and sorption properties of the substance, standardised to reference conditions if appropriate; i.e. DegT50 (d), Kom (dm3 kg-1, obtained from Koc
through division by 1.724) and the Freundlich exponent N; for acidic substance the sorp-tion constants for both the neutral and the charged species are required;
− the crop or crops on which the substance is to be used;
− the method of application, the dosage and the (proposed) application scheme.
For first tier calculations the procedures as described by FOCUS (FOCUS, 2000) are fol-lowed, except for the dissociable substances as described above. FOCUS (2004b) recom-mends to use the geometric mean of DegT50-values in the calculations.
2.3.2 Description of tier 2
The second tier of the decision tree evaluates in greater detail whether a substance, which according to the evaluation in the first tier has some potential to leach to groundwater, indeed has a potential to leach to groundwater above the threshold level. The second tier can roughly
The safety factor
The old decision tree, developed in the late 1980s, used a safety factor of 100 at the end of the first tier to avoid unwarranted approval of a substance. This safety factor was used to account for uncertainties in: − the model;
− the scenario; and − substance properties.
It was not possible to assign factors to the individual sources of uncertainty; the overall factor was as-sumed to be large enough to cover the three sources of uncertainty, despite the huge sensitivity of the leaching to for instance the substance properties.
There is no safety factor in the new decision tree, except for specific areas. The reasoning behind not using a general safety factor any longer is as follows:
− In the EU three models, PEARL, PELMO and PRZM, are selected for use in the evaluation of the leaching risk. At the critical level of 0.1 µg dm-3 and below the PEARL model always predicts the highest leaching levels (see Boesten (2004) for the main reasons of this higher leaching prediction). Choosing the PEARL model for the calculations is therefore a conservative approach, from the EU perspective.
− Results for the Kremsmünster scenario have been compared with GeoPEARL results for the Nether-lands (all plot combinations), using substances covering a wide variety in sorption and transformation properties. The concentrations for the Kremsmünster scenario were always above the 90th percentile of the GeoPEARL calculations (see chapter 4). This indicates that it is rather unlikely that the Krems-münster scenario is less vulnerable than realistic worst case for the Netherlands.
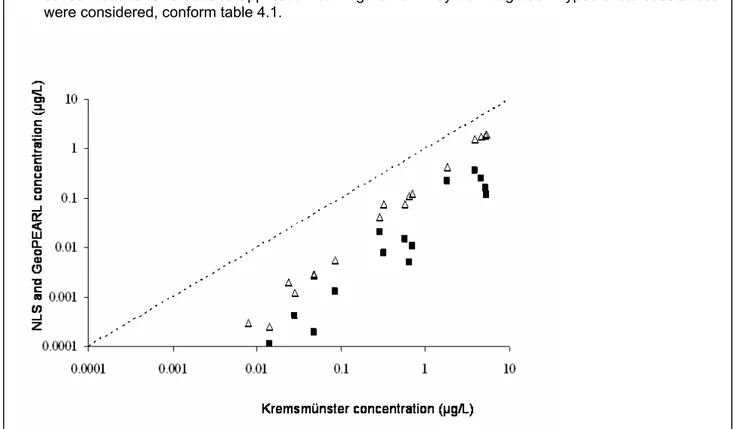
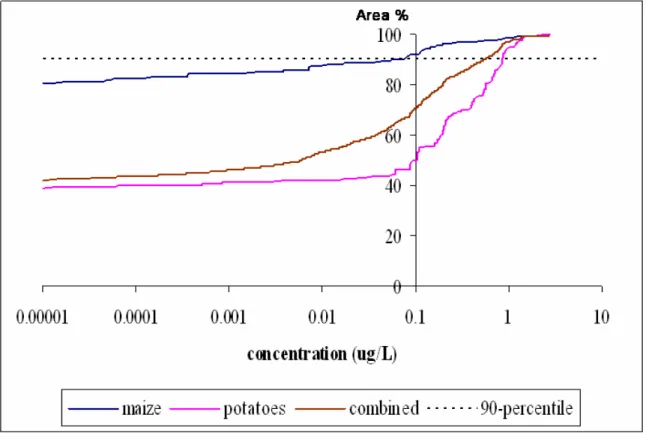
− Results for the Kremsmünster scenario have been compared with results for the old standard sce-nario for the Netherlands (NLS). It turned out that, at the critical level of 0.001 µg dm-3, the ratio of the Kremsmünster scenario results and the standard scenario results is ≥ 70. Based upon experience of CTB over the last 15 years that the safety factor of 100 in general was large enough to avoid unwar-ranted approval (CTB, pers. communication), it is considered that this ratio of 70 is large enough to cover uncertainties in the substance properties. The figure below relates calculations for the Krems-münster scenario to the calculations for the old standard scenario (NLS) and the GeoPEARL target concentrations for a surface application of 1 kg ha-1 on May 26th. Eighteen hypothetical substances were considered, conform table 4.1.
Figure B.1 Comparison of target concentrations of Kremsmünster with target concentrations of GeoPEARL (∆) and NLS () for an application of 1 kg ha-1 on May 26th.
be divided into two parts: a part using the GeoPEARL package and a part in which monitor-ing data of the uppermost groundwater are considered. This latter part is described in detail in a separate report (Cornelese et al., 2003). The result of the evaluation of the monitoring data may overrule the evaluation based on GeoPEARL, provided that all criteria, stated in the re-port, are met.
The evaluation at this stage starts from using information from the basic dossier, but addi-tional information may be used to refine the evaluation. The procedure in tier 2 may start with GeoPEARL calculations, using input from the basic dossier. A detailed description of the concepts of GeoPEARL and how to use this software tool is given elsewhere; see Tiktak et al. (2003) for the theoretical background and Tiktak et al. (2004) for the user manual. The proce-dure is partly similar to the proceproce-dure in the first tier, when using PEARL. The most impor-tant difference is that the GeoPEARL software package is used instead of the FOCUS PEARL model. GeoPEARL is a spatially distributed model, which runs for up to 6405 unique combi-nations of soil type, climate, etc. The most important output of GeoPEARL is the 90th percen-tile of the leaching concentrations in the area of use. If the substance is to be used on more than one crop, GeoPEARL calculates for each of the crops independently and gives results for the individual crops as well as for the combination of crops.
Running the model for all 6405 unique combinations would require a run time of almost 10 days on a state-of-the-art computer. For this reason, GeoPEARL has the possibility to run for less than 6405 unique combinations. However, running the model with less unique combi-nations introduces an error. Analyses have shown that this error remains acceptable as long as the number of unique combination is more than 250 (see Tiktak et al., 2004 and appendix IV). Although it is possible to run GeoPEARL for less than 250 plots, an assessment with less than 250 plots will not be acceptable for registration purposes. On the other hand, a GeoPEARL assessment with more than 250 plots will be accepted by the registration authorities because runs with more plots are considered more accurate.
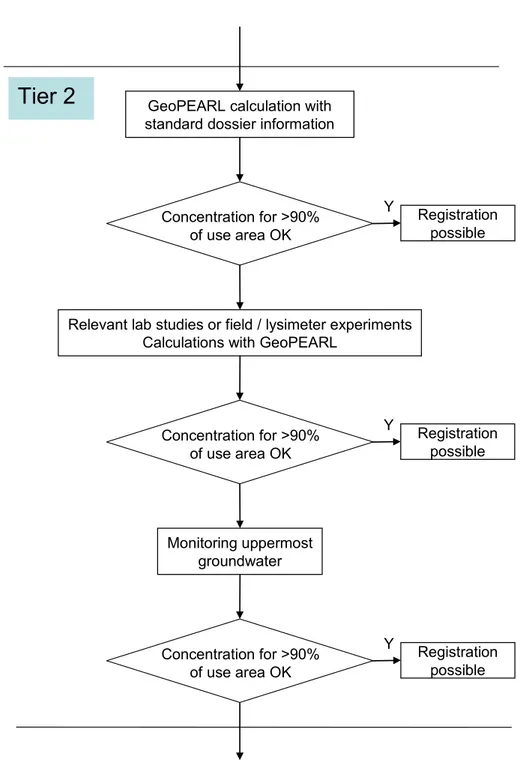
Figure 2.3 gives a detailed outline of the second tier of the decision tree. The flowchart de-picted in figure 2.3 gives a typical path through this tier, but it is not necessary that each part is covered. If the GeoPEARL run, using the information from the basic dossier, does not re-sult in an acceptable leaching potential, i.e. the target concentration is above 0.1 µg dm-3, the applicant may introduce information from additional laboratory experiments and / or informa-tion from field or lysimeter experiments. The results from the addiinforma-tional laboratory studies lead to new input parameters for GeoPEARL calculations, while results from lysimeter and field experiments may lead to both new input parameters and a correction factor for the GeoPEARL calculations.
The information of additional laboratory studies on the transformation rate or the sorption of the substance may reveal that the data in the basic dossier are not representative of the trans formation rates or the sorption coefficients in the area of use of the substance. The following situations may occur regularly:
Tier 2
GeoPEARL calculation withstandard dossier information
Relevant lab studies or field / lysimeter experiments Calculations with GeoPEARL
Monitoring uppermost groundwater Concentration for >90% of use area OK Y Registration possible Concentration for >90% of use area OK Y Registration possible Concentration for >90% of use area OK Y Registration possible
− the average transformation rate for soils representative of the area of use of the substance differs from the average transformation rate in the basic dossier. An approach might be to check whether these averages are statistically significant (t-test, 95 % confidence level). In this case the data from the basic dossier might be disregarded and the average transforma-tion rate for the representative soils could be used as input; i.e. the DegT50 to be used is
calculated from the relevant soils only;
− the average transformation rate for soils representative of the area of use of the substance is not statistically significant (t-test, 95 % confidence level) different from the average transformation rate in the basic dossier. In this case all data are taken together to calculate the average transformation rate and this value is used to derive the input for the GeoPEARL calculations;
− the additional information may reveal that the transformation of the substance is depend-ent on (correlated to) one or several soil parameters. The dependency is tested for statisti-cal significance (R2 of the regression line better than 0.8 or F-test with significance level α = 0.1). The data from the basic dossier are included in this procedure, unless insufficient information is present in the dossier or it is demonstrated statistically that these data should be considered as outliers (Grubb’s test, with significance level α = 0.05). Instead of using average transformation parameters in the calculation now specific or soil-dependent properties should be used. For instance, the transformation rate may be de-pendent on soil organic matter content, soil clay content and / or soil pH. GeoPEARL of-fers the possibility to calculate with soil-dependent transformation parameters. An exam-ple is given in chapter 3. See Tiktak et al. (2003) for more details;
− non-equilibrium sorption is expected to occur for most substances and therefore should not be neglected if experimental data are available. The data are used to derive new sorp-tion and transformasorp-tion parameters and average values are used as input for new GeoPEARL calculations. For further information the reader is referred to Boesten and Van der Linden (2001), Tiktak et al. (2003) and FOCUS (2004b).
At the moment there is hardly any experience in deciding on the representativeness of sorp-tion and transformasorp-tion data. It is recommended to use the suggessorp-tions given above in combi-nation with expert judgement.
Interpretation of field and lysimeter experiments may show that the leaching of the substance cannot be simulated well with the PEARL model. The ratio of calculated leaching and meas-ured leaching, the so-called simulation error (Verschoor et al., 2001), is then used to adjust the target quantity of the GeoPEARL calculations and the adjusted result, Cadj, is used for the
decision: adj GeoPEARL target, f C Cadj = with
Cadj the adjusted concentration (µg dm-3) to be used for decision making
Ctarget, GeoPEARL the target concentration (µg dm-3) of the GeoPEARL calculations
The adjustment factor is defined as the lower limit of the confidence interval for the average simulation error, obtained via the procedure as described in the text box below.
The second major part of tier 2 concerns data obtained from monitoring studies regarding the uppermost groundwater; i.e. the groundwater layer ranging from 0 to 1 m below the ground-water level, immediately beneath fields treated with the substance. Tier 2 evaluates whether the 90th percentile monitoring concentration in the uppermost groundwater is convincingly below the limit value. Two possible approaches exist: 1) monitoring of the uppermost groundwater under a relatively small number of vulnerable soils, and 2) monitoring of the uppermost groundwater under a large number of soils, collectively representative of the area of use of the substance (Cornelese et al., 2003). Provided that all requirements are fulfilled, the monitoring results overrule results obtained via calculations with PEARL or GeoPEARL.
2.3.3 Description of tier 3
Tier 3 considers the behaviour of the substance in the water-saturated zone of the soil, i.e. the zone between 1 and 10 m below soil surface. A substance enters tier 3 when the target con-centration as calculated with GeoPEARL at the end of tier 2 was above 0.1 µg dm-3 or when monitoring in the uppermost groundwater showed a concentration above 0.1 µg dm-3. Tier 3 is divided into two major parts: a part which considers behaviour studies with soil materials from the water-saturated zone and a part which considers monitoring data obtained from a depth of 10 m or more below soil surface.
The applicant can perform transformation and sorption studies in materials obtained from the saturated zone between 1 and 10 m depth and show that under all chemical conditions, oxic to methanogenic, transformation is fast enough to reduce the concentration to below the level of 0.1 µg dm-3. The procedures are described in more detail in Van der Linden et al. (1999). The materials gathered from the water-saturated zone should be representative of the subsurface conditions of the area of use of the substance.
Finally the applicant may show through monitoring that the concentration at 10 m depth will remain below 0.1 µg dm-3. Concentration measurements at a depth of 10 m below soil surface will seldom be available. Especially for new substances it will take a long time before rele-vant monitoring results at this depth can be obtained; it may take more than 30 years before this substance arrives at this depth. The procedure for the monitoring and the interpretation of the results is described in more detail in Cornelese et al. (2003). The interpretation of the data does not include further statistical examination of the data. As the monitoring results will usu-ally be obtained via sampling of existing (observation) wells, statistical boundary conditions will usually not be met. The interpretation of the results requires a great deal of expert judge-ment.
Derivation of the adjustment factor
For one substance in different situations the simulation error (see text above or Verschoor et al., 2001) can differ an order of magnitude. Considering this large variation in simulation errors for one sub-stance, a decision based on one simulation error is highly uncertain. For this reason the lower limit of the confidence interval of the average simulation error is used as the adjustment factor.
The simulation error is likely to be log-normally distributed because it can increase without bound, but is confined to a finite value at the lower limit (=0). Therefore, the procedure starts with a log-transformation of the observed simulation errors (we will use natural logarithms here). The natural logarithm of the simulation error probability distribution will yield a normal distribution curve. In prac-tice, the number of simulation errors will be limited, so a t-distribution will apply. After transformation, the arithmetic mean and the standard deviation of the transformed data are calculated. The lower limit of the confidence interval for the transformed data is now determined according to:
n SD t SE SE tr prob tr ll tr, = − ⋅ with
SEtr,ll the lower limit of the confidence interval of the transformed simulation errors tr
SE the arithmetic mean of the transformed simulation errors
tprob the t-distribution probability factor
SDtr the standard deviation of the transformed simulation errors
n the number of experiments (the number of degrees of freedom is n minus one)
As we are concerned about over-correction, only the lower limit of the confidence interval is of interest. Therefore, we can apply single-sided statistics. Up till now, there is little experience in using the ad-justment factor and thus in choosing the probability factor. For the moment, it seems reasonable to use a 75% confidence limit (α = 0.25).
The adjustment factor is obtained through back-transformation:
(
trll)
adj SE
f =exp .
The procedure described above can be followed if more than one field or lysimeter experiment is per-formed. If there is only one experiment, there are no degrees of freedom left and the adjustment factor cannot be determined according to the formula. If only one experiment is available, the adjustment factor is calculated using essentially the formulae above assuming a variation coefficient of 75% for the population of transformed simulation errors. This procedure might be updated after having gained more experience with the procedure.
Example
Suppose we have 3 lysimeter experiments with simulation errors of respectively 2, 7, and 20 (geomet-ric mean = 6.55). Following the procedure, we obtain: ln(SE) = 0.69, 1.94 and 3.00; mean = 1.88 and standard deviation = 1.15. As we have two degrees of freedom, the single sided t-probability factor (α = 0.25) is 0.816. SEtr,ll = 1.88 – 0.816*1.15/(√3) = 1.34 and fadj = exp(1.34) = 3.81
t-values (one-sided, alfa=0.25)
df 1 2 3 4 5 6 7 8 9 10
3 Example applications of the decision tree
This chapter illustrates the use of tiers 1 and 2 of the new decision tree by evaluating a few hypothetical examples:
A. substance D20K50, having a DegT50 of 20 days (standard conditions) and a Kom of
50 dm3 kg-1, applied in maize;
B. substance D30K50, having a DegT50 of 30 days (standard conditions) and a Kom of
50 dm3 kg-1, applied in maize;
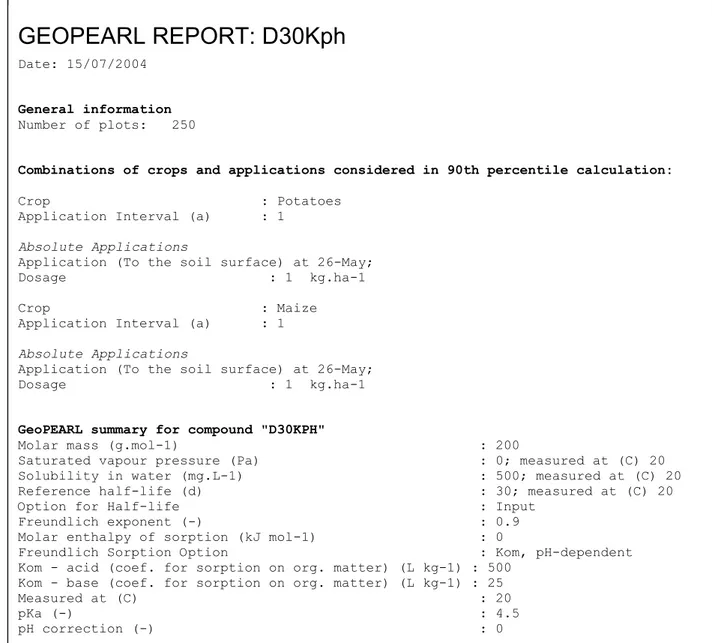
C. substance D30Kph, having a DegT50 of 30 days (standard conditions) and pH dependent
sorption: pKa = 4.5, Kom,acid is 500 dm3 kg-1, Kom,base is 25 dm3 kg-1; two different
situa-tions are considered: use in maize and use in potatoes;
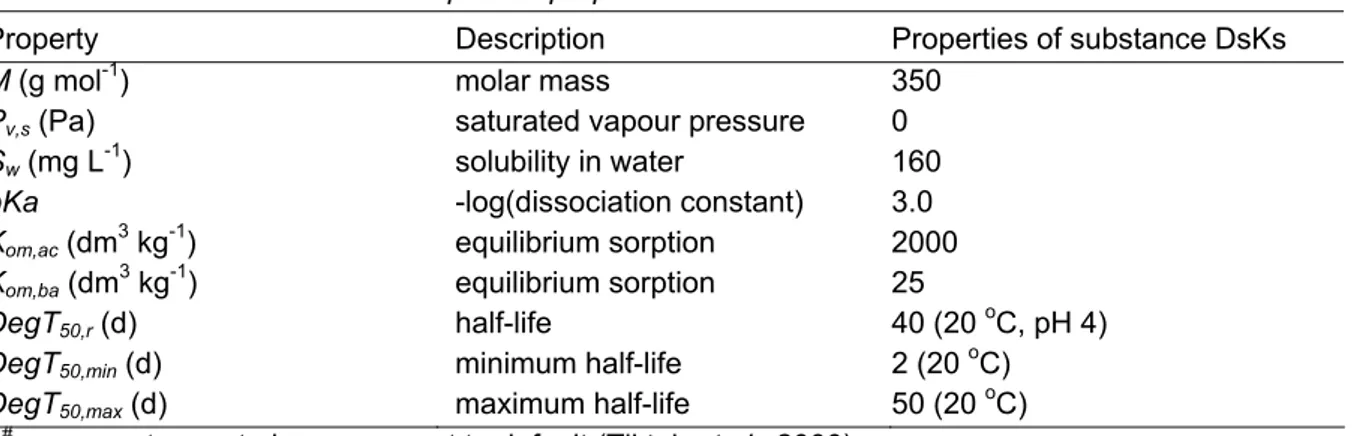
D. substance DsKs, having DegT50 and Kom dependent on soil characteristics.
The use of monitoring data in tier 2 and tier 3 as a whole will not be demonstrated. The use of monitoring data is explained in a separate report (Cornelese et al., 2003). The part on trans-formation in the water-saturated zone has not changed. In case of failure of a substance to pass tier 2, the applicant has to demonstrate that the concentration for the 90th percentile of the use area, obtained by the GeoPEARL calculations or by the monitoring of the uppermost groundwater, declines below the limit value, due to chemical or biochemical reactions under all kinds of redox conditions. The procedure has hardly changed as only the initial concentra-tion is obtained via a different procedure: a PEARL or monitoring result in the old situaconcentra-tion versus a GeoPEARL or monitoring result in the new procedure.
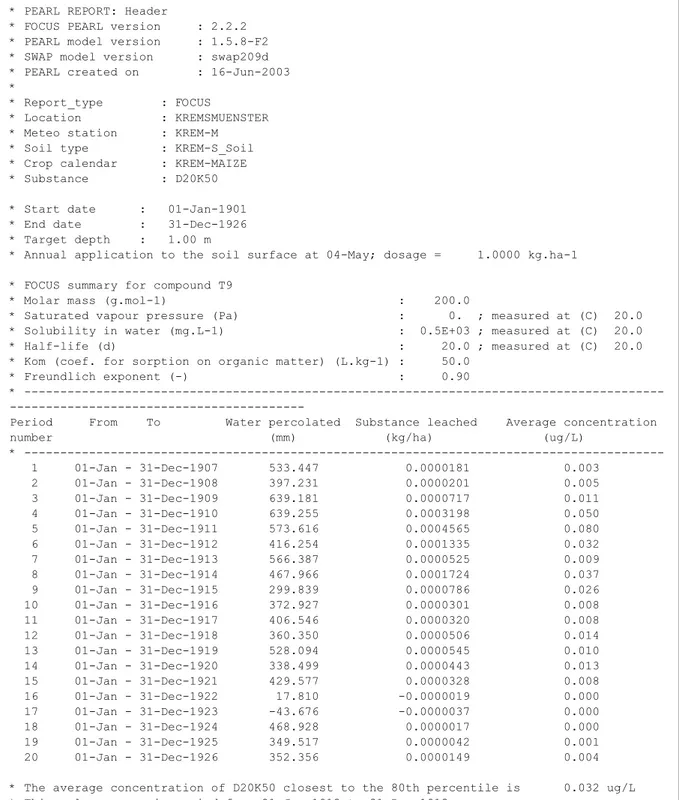
Example A: Substance D20K50, having a DegT50 of 20 days and a Kom of 50 dm3 kg-1
The substance is defined in PEARL and the physico-chemical properties, the DegT50 and the
Kom, are put into the PEARL database. An application scheme is created, in this case a dosage
of 1 kg ha-1 applied to the soil surface, one day before emergence of the crop. With the help of the FOCUS wizard in PEARL a run is created in which Kremsmünster is chosen as the sce-nario, maize as the crop and the substance applied each year, according to the created applica-tion scheme. Then PEARL is run for a period of 26 years, including 6 warm-up years. Results for this case are shown in Figure 3.1. The target quantity, in this case the 80th percentile leach-ing concentration for the Kremsmünster scenario, is 0.032 µg dm-3. This value is below the
limit of 0.1 µg dm-3, which implies that the substance fulfils the criterion and can be
regis-tered with respect to leaching. The use in groundwater protection areas, however, will be de-nied as the calculated concentration is between 0.01 and 0.1µg dm-3.
Figure 3.1 Summary report of the FOCUSPEARL run for substance D20K50. The text is slightly changed to fit in this report; essential information is kept unchanged.
Example B: Substance D30K50, having a DegT50 of 30 days and a Kom of 50 dm3 kg-1
A standard run for this substance, using the Kremsmünster scenario, gives an 80th percentile
leaching concentration of 0.415 µg dm-3. This is above the criterion and therefore the sub-stance can not be registered at the first tier level. The subsub-stance is taken to the second tier and
* PEARL REPORT: Header
* FOCUS PEARL version : 2.2.2 * PEARL model version : 1.5.8-F2 * SWAP model version : swap209d * PEARL created on : 16-Jun-2003 *
* Report_type : FOCUS
* Location : KREMSMUENSTER * Meteo station : KREM-M * Soil type : KREM-S_Soil * Crop calendar : KREM-MAIZE * Substance : D20K50 * Start date : 01-Jan-1901 * End date : 31-Dec-1926 * Target depth : 1.00 m
* Annual application to the soil surface at 04-May; dosage = 1.0000 kg.ha-1 * FOCUS summary for compound T9
* Molar mass (g.mol-1) : 200.0
* Saturated vapour pressure (Pa) : 0. ; measured at (C) 20.0 * Solubility in water (mg.L-1) : 0.5E+03 ; measured at (C) 20.0 * Half-life (d) : 20.0 ; measured at (C) 20.0 * Kom (coef. for sorption on organic matter) (L.kg-1) : 50.0
* Freundlich exponent (-) : 0.90
* ---
Period From To Water percolated Substance leached Average concentration number (mm) (kg/ha) (ug/L)
* 1 01-Jan - 31-Dec-1907 533.447 0.0000181 0.003 2 01-Jan - 31-Dec-1908 397.231 0.0000201 0.005 3 01-Jan - 31-Dec-1909 639.181 0.0000717 0.011 4 01-Jan - 31-Dec-1910 639.255 0.0003198 0.050 5 01-Jan - 31-Dec-1911 573.616 0.0004565 0.080 6 01-Jan - 31-Dec-1912 416.254 0.0001335 0.032 7 01-Jan - 31-Dec-1913 566.387 0.0000525 0.009 8 01-Jan - 31-Dec-1914 467.966 0.0001724 0.037 9 01-Jan - 31-Dec-1915 299.839 0.0000786 0.026 10 01-Jan - 31-Dec-1916 372.927 0.0000301 0.008 11 01-Jan - 31-Dec-1917 406.546 0.0000320 0.008 12 01-Jan - 31-Dec-1918 360.350 0.0000506 0.014 13 01-Jan - 31-Dec-1919 528.094 0.0000545 0.010 14 01-Jan - 31-Dec-1920 338.499 0.0000443 0.013 15 01-Jan - 31-Dec-1921 429.577 0.0000328 0.008 16 01-Jan - 31-Dec-1922 17.810 -0.0000019 0.000 17 01-Jan - 31-Dec-1923 -43.676 -0.0000037 0.000 18 01-Jan - 31-Dec-1924 468.928 0.0000017 0.000 19 01-Jan - 31-Dec-1925 349.517 0.0000042 0.001 20 01-Jan - 31-Dec-1926 352.356 0.0000149 0.004 * The average concentration of D20K50 closest to the 80th percentile is 0.032 ug/L * This value occurs in period from 01-Jan-1912 to 31-Dec-1912
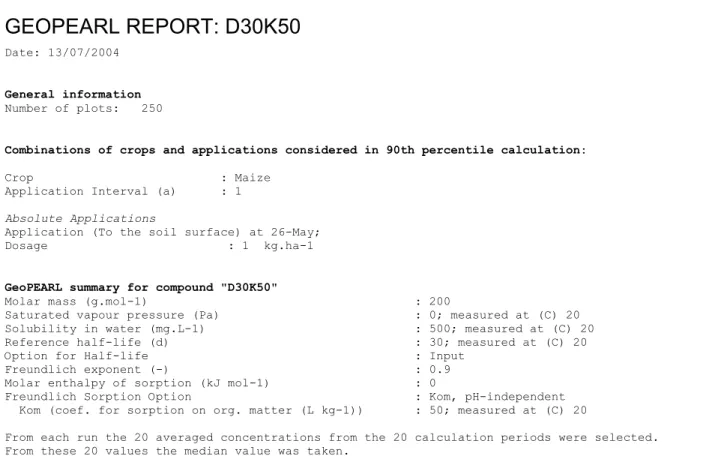
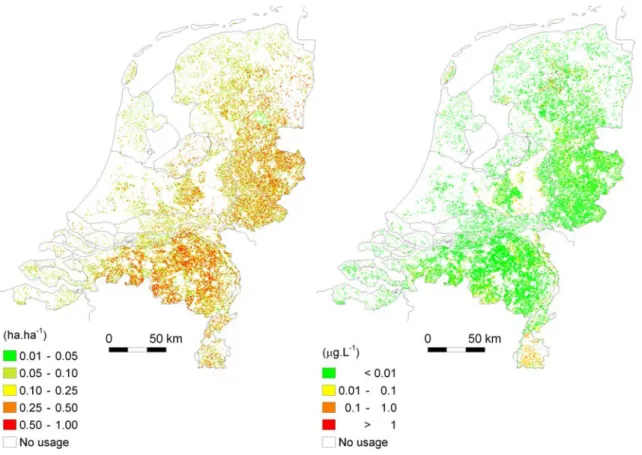
a run with GeoPEARL is performed. Figure 3.2 gives the summary report of the calculations and Figure 3.3 gives maps of the area of use and the map of the resulting concentrations for an application of D30K50 in maize. The target concentration, obtained with the GeoPEARL model, is 0.0321 µg dm-3; below the critical value of 0.1. The substance therefore can be
reg-istered, but because the calculated concentration is above 0.01 µg dm-3 the use in groundwater protection areas can not be allowed. Note that only a calculation with GeoPEARL, with in-formation from the basic dossier, is necessary to reach the conclusion.
Figure 3.2 Summary report of the GeoPEARL run for substance D30K50. The calculations were per-formed for 250 plots.
GEOPEARL REPORT: D30K50
Date: 13/07/2004 General information Number of plots: 250Combinations of crops and applications considered in 90th percentile calculation: Crop : Maize
Application Interval (a) : 1
Absolute Applications
Application (To the soil surface) at 26-May; Dosage : 1 kg.ha-1
GeoPEARL summary for compound "D30K50"
Molar mass (g.mol-1) : 200
Saturated vapour pressure (Pa) : 0; measured at (C) 20 Solubility in water (mg.L-1) : 500; measured at (C) 20 Reference half-life (d) : 30; measured at (C) 20 Option for Half-life : Input
Freundlich exponent (-) : 0.9 Molar enthalpy of sorption (kJ mol-1) : 0
Freundlich Sorption Option : Kom, pH-independent Kom (coef. for sorption on org. matter (L kg-1)) : 50; measured at (C) 20
From each run the 20 averaged concentrations from the 20 calculation periods were selected. From these 20 values the median value was taken.
Using this median value the 90th percentile in space was calculated for the whole area of use. In the procedure each concentration was weighed by its surface area. The resulting 90th percentile concentration (ug/L) was: 0.0321
The 90th percentile concentrations of the different crops in the areas of use were:
Crop Conc. (ug/L) Area