263 PEDAGOGISCHE STUDIËN 2020 (97) 263-280
Abstract
In the transition from Dutch primary to secondary education, two indicators are used to place students in the right track: primary school teachers’ track recommendations (TTR) and standardized achievement tests (SATs) at the end of primary school. Which indicator is better for placing students is a long-standing issue among educational researchers and professionals. Since 2015, the SAT is administered after the TTR has been given; previously, SAT was administered first. In the current study, it was investigated to what extent TTR and a commonly used SAT predict students’ educational attainment after three years of secondary education for multiple cohorts before and after 2015. The results were compared for educational tracks and for different socio-economic status (SES) groups, using multiple samples approaching population data. For all educational tracks and SES groups the results show that TTR is a better predictor of educational attainment than SAT. Furthermore, large differential effects for SES were found. The change of administrative sequence in 2015 had no effect on the overall predictive accuracy: TTR remained the better predictor. The results give new insights into the predictive value of both TTR and SAT before and after the change in administration sequence.
Keywords: transition, track recommendations, standardized achievement tests, primary school, secondary school
1 Introduction
For a multi-tiered education system such as in Dutch secondary education, it is important to have an accurate placement procedure. The initial track in which students are placed is a
strong determinant of the educational level they will ultimately obtain (Lenhard & Schröppel, 2014; Tolsma & Wolbers, 2010). Furthermore, the transition from primary to secondary education can offer both oppor-tunities and barriers for students’ cognitive and social-emotional development, depending on their personal characteristics and the accuracy of the placement procedure (Anderson et al., 2000; Benner, 2011; Van Rooijen et al., 2016). Hence, investigating and understanding the predictive power of the different indicators used in this placement procedure is important for students’ educational attainment.
Placement in Dutch secondary education is based on the track recommendation of the primary school teacher (TTR) and a (mandatory) standardized achievement test (SAT) in grade 6. There is an ongoing debate amongst researchers, educational profes-sionals, policy makers, journalists, and the general public about which assessment should be preferred (see Section 1.6). There are concerns that TTR is biased by teacher perceptions (De Boer, Bosker, & Van der Werf, 2010), with negative consequences particularly for students from low socioeconomic status (SES) backgrounds. On the other hand, the focus of SATs on cognitive capacities could be a drawback as well, since non-cognitive measures (e.g., working attitude) also play an important role in educational attainment (Farrington et al., 2012).
The transition from primary to secondary education in the Netherlands has been studied quite extensively (e.g., Timmermans, Kuyper, & Van der Werf, 2015; Van Rooijen et al., 2016), and some results add to the TTR versus SAT debate. In terms of predictive power, TTR has been found to be a better predictor of educational attainment than SATs (Feron, Schils, & Ter Weel, 2015; Lek & Van
The predictive power of track recommendations in
Dutch secondary education
264 PEDAGOGISCHE STUDIËN de Schoot, 2019; Luyten, 2004), although an
SAT may be a better predictor for pre-university education (Lek & Van de Schoot, 2019). However, studies conducted thus far have been limited to single cohorts and it is not clear whether these findings hold when looking at multiple cohorts, including cohorts after the administrative change in sequence in 2015 (see Section 1.5).
The present study investigates the current placement procedure in the transition from Dutch primary to secondary education and compares TTR and a commonly used SAT for multiple cohorts. Moreover, it compares the findings with the placement procedure that was implemented up until 2015, thus giving new insights into the accuracy of both procedures and their predictive power. This comparison may help in evaluating which placement procedure, based on (almost) population data, results in the most accurate prediction of student attainment.
1.1 The transition from Dutch primary to secondary education
At the age of twelve, Dutch students enter secondary education in one or a combination of the following tracks: practical education (PrO1), pre-vocational secondary education
(vmbo), senior general secondary education (havo), and pre-university education (vwo). Vmbo can be further split up (from the lowest to the highest level) into vmbo-bb, vmbo-kb, vmbo-gtl, vmbo-bb being the most practical track and vmbo-gtl the most theoretical track. Vmbo has a duration of four years and prepares for different levels of senior vocational education and training (VET), havo consists of five years and prepares for higher professional education, and vwo has a duration of six years and prepares for university. In the first year(s) of secondary education, most students are placed in year groups consisting of a combination of two or more adjacent educational tracks. Further allocation into tracks occurs in the second or third year.
The current placement procedure in secondary education is based on two indicators: a) primary school TTR, and b) a SAT. In 2015, an SAT became compulsory
for arithmetic and the Dutch language. SATs are seen as important objective indicators of the cognitive performance of students (PO-Raad, AVS & VO-Raad, 2011) and one SAT (see Section 1.3) was already used by the majority of primary schools before 2015. In the following sections, the two indicators (TTR and SAT) are explained in more detail. 1.2 Teacher track recommendation
To foster a smooth transition from primary to secondary education, teachers should make an accurate estimation of the capabilities and learning potentials of the student and translate this to a track recommendation (Ministerie
van OCW [Dutch Ministry of Education,
Culture, and Science], 2016a). TTR may include a single track (PrO, bb, vmbo-kb, vmbo-gtl, havo, vwo) or a combination of adjacent tracks. A combination of two adjacent tracks is used when a student’s learning potential is still undecided. The TTR is the minimum level at which a secondary school must place the student.
Multiple indicators are taken into account when composing the TTR. The most frequently used indicator is students’ former achievement (Inspectie van het Onderwijs [Dutch Inspectorate of Education], 2014), which is seen as the most proximal source of information available (Allen, 2005). Achievement scores in the last three grades of primary school have proved to be the most accurate predictors of educational attainment after four years of secondary education (Van Aarsen, 2013), especially the scores on reading comprehension, arithmetic skills, and spelling.
Although cognitive achievement measures are significantly more strongly related to TTR than non-cognitive measures (Driessen & Doesborgh, 2005; Driessen & Smeets, 2007; 2011; Luyten & Bosker, 2004; Timmermans et al., 2015), teachers also tend to take non-cognitive measures into consideration when composing a track recommendation (Inspectie van het Onderwijs, 2014), including emotional aspects, such as working attitude and student background characteristics, closely followed by behavioural aspects, particularly effort.
265 PEDAGOGISCHE STUDIËN
Moreover, SES is unintentionally considered in composing the track recommendations. However, the relationship between cognitive and non-cognitive student characteristics and TTR is rather complicated, as these variables may interact in various ways (Driessen & Doesborgh, 2005).
1.3 Standardized achievement tests
The need for a more objective measure of student achievement was expressed at educational policy level, especially for disadvantaged students from low-SES backgrounds. Therefore, multiple stand-ardized tests for the assessment in grade 6 have been developed, including the Centrale eindtoets (Central end-of-primary-school test; CET), IEP Eindtoets, ROUTE 8, AMN Eindtoets, and Dia-eindtoets (Slob, 2018). These SATs are commercial products that have governmental approval. CET was by far the most commonly used test in the years considered in this study (Dekker, 2015; 2016). CET consists of two obligatory parts, testing students’ Dutch language skills and arithmetic skills. There is an optional part which includes geography, history, and biology. The test scores can be converted into a track recommendation by using a conversion table (see Section 2.2 for further details).
School grades may contain some subjectivity (Lenhard & Schröppel, 2014). This makes grades hard to interpret and compare between schools. SATs have been developed to eliminate these problems, as they are expected to be more objective measures of students’ educational attainment. However, as they are often administered only once per year, they are just a snapshot of the reality. There may be errors in this measurement due to the specific time point the tests are administered. In contrast, a longitudinal view may make a recom-mendation less error prone. Nevertheless, SATs at least seem valuable as a supplement to help teachers with their TTRs; in Dutch policy they are often referred to as an objective ‘second opinion’ (Lenhard & Schröppel, 2014).
SATs are also used as indicators of school performance by the Dutch Inspectorate of
Education. This may cause strategic behaviour of teachers, such as teaching to the test, cheating during test administration, and deviating from the standard guidelines by prompting students with the right answer (Ehren & Swanborn, 2012; Jacob & Levitt, 2003). For example, Ehren and Swanborn (2012) found that 5.5% of schools did not comply with the administration guidelines. Moreover, in some schools children are trained in answering the questions posed in the CET. These behaviours may cause an inflation of the test results and a reduction of the predictive validity of SATs (Ehren & Swanborn, 2012; Koretz, McCaffrey, & Hamilton, 2001).
1.4 Role of socioeconomic status
The socioeconomic status of students, commonly measured by parents’ educational level, highly impacts their educational trajectory. Students with highly educated parents tend to perform better than students with lower educated parents (Luyten & Bosker, 2004; Inspectie van het Onderwijs, 2018). Even with equal performances, low-SES students get lower TTRs on average than high-SES students (De Boer et al., 2010; Timmermans et al., 2015). Also, students from low-SES backgrounds more often continue their education in the lower tracks or repeat a year (Tieben & Wolbers, 2010). A lower aspiration level of both parents and the student (De Boer et al., 2010) and a less favourable working attitude (Hornstra, 2013) are common explanations for this phenomenon, but comprehensive under-standing is lacking.
1.5 Administrative shift in 2015
Before 2015, the SAT was generally administered in February, several months before the end of the final primary school year. A negative side-effect of this setup was a clear decline in time spent on formal education by students after taking the SAT. To stimulate schools to continue formal edu-cation during these months, the SAT was moved to a later point in the school year in 2015: namely, in March/April. This shift also implies that now the SAT takes place after
266 PEDAGOGISCHE STUDIËN teachers have provided the TTR, which needs
to be given before 1 March (Ministerie van OCW, 2016b).
The relative importance of TTR has increased due to the 2015 shift. In the current situation, the TTR is leading and the SAT functions as a second source of information. Following the SAT score, the final TTR can only be adjusted upwards, not downwards: for example, from havo to vwo. Teachers, who have monitored the students for several years, can better estimate the most fitting educational level in secondary education than a SAT, it is argued (Luyten, 2004; PO- Raad, 2013). This finding makes the shift in time in 2015 (first TTR, then SAT) and the relative importance given to the two indicators a defensible choice. However, it is not clear whether the result is also valid in a more systematic study of the predictive powers of both TTR and SAT.
The shift in sequence may have some consequences for the predictive values of both TTR and SAT. When students are happy with the recommendation they have received, their motivation for performing well on the SAT may be quite low. This might result in a lower SAT score than was potentially possible for these students and may, therefore, also impact the predictive value of the test negatively. However, this effect has not yet been investigated. Another effect of the shift in sequence is that secondary schools are not allowed to place students based on the SAT, but only on the TTR. The educational level in which a secondary school places students is of great importance for their educational trajectory (Lenhard & Schröppel, 2014; Tolsma & Wolbers, 2010). Therefore, this may result in a higher predictive value of TTR and a lower predictive value of SAT after 2015.
1.6 The Dutch debate
There is an ongoing debate in the Netherlands about the use of TTR and SAT (e.g., van Eck, 2016; Lek & Van de Schoot, 2019). There are concerns that TTR is biased by teacher perceptions (De Boer et al., 2010). These concerns are fuelled by findings that students with comparable cognitive capacities receive
a lower TTR if they are from low-SES families than if they are from higher SES families (Luyten & Bosker, 2004). On the other hand, the focus of a SAT on cognitive capacities could be a drawback, since non-cognitive measures also play an important role in educational attainment (Farrington et al., 2012) and should thus not be overlooked. Moreover, a SAT is a snapshot of the actual attainment of the student, which aggravates concerns about its use.
To provide new input for the debate, we need a better understanding of the predictive powers of TTR and SAT after the 2015 shift, particularly regarding their predictive powers for students from low-SES backgrounds. It should be noted that TTR and SAT are not entirely on an equal footing in this comparison. Although both TTR and SAT are used for student placement, TTR is leading and the SAT provides a ‘second opinion’ since the 2015 shift. Furthermore, TTR may have been leading before the shift in 2015 as well. Thus, it is quite likely that the predictive power of TTR is at least to some extent due to a self-fulfilling prophecy, in which the students follow the educational trajectory recommended. Furthermore, students and their teachers and parents may see the student as a typical student for the level he/she is in, which strengthens the preconceptions of the students’ attainment level.
1.7 The current study
We examined the correspondence between TTR, CET, and school level in the third year of secondary education (P3) among large-scale, recent datasets that approach the population data of all students in secondary education. These results can help decide which indicator or placement procedure (i.e., the sequence of CET and TTR) would be preferred based on the placement of students in secondary education. Also, further insights into the role of SES into the relationship between placement, CET, and TTR can contribute to the ongoing debate. Moreover, the fact that the current research includes population data of multiple cohorts strengthens the added value of the research results.
267 PEDAGOGISCHE STUDIËN
In contrast to the other, related studies, multiple student cohorts were investigated. P3 was used as outcome variable, as almost all students are tracked in homogenous classes by then, and the educational levels they pursue are generally more stable than before. P3 is therefore seen as a valid and accurate indicator of the educational level in which students will take their final school examinations. Furthermore, two types of cohorts were considered: four CET-TTR-P3 cohorts and two TTR-CET-P3 cohorts. In the CET-TTR-P3 cohorts the TTR was given to the students after they took the CET, and in the TTR-CET-P3 cohorts the students received their TTR before they sat the CET. In both situations, CET scores could have been considered in the final TTR to some extent, either because teachers before 2015 based the TTR partly on the CET scores, or because teachers after 2015 adjusted the final TTR using the CET scores. The results were compared for different tracks and different SES groups.
The following research questions were formulated: (a) To what extent do TTR and
CET predict P3? And which of these predictors is the most accurate predictor? (b) To what extent do the aforementioned results differ for the various tracks? (c) To what extent do the results differ for the SES groups? and (d) To what extent are the results affected by the administrative change in 2015?
Previous studies used different methods of calculating the predictive value of both predictors (e.g., De Boer, 2009; Timmermans et al., 2013), which makes it difficult to compare the findings. Furthermore, it is unclear which method should be preferred. Therefore, prior to the final analyses, we used and compared different methods of calculating the predictive value of the predictors to investigate whether the method used affects the conclusions (see Appendix A). The findings showed that the different calculation methods led to the same conclusions. All results presented here were calculated using the proportion of correspondence, which is the easiest to interpret.
It is hypothesized that TTR is a better predictor of P3 than CET (Luyten, 2004;
PO-Raad, 2013). Furthermore, there was no reason to assume that the overall results would be different for CET-TTR-P3 and TTR-CET-P3 cohorts (Feron et al., 2015; Lek & Van de Schoot, 2019). Moreover, due to ceiling and floor effects, we expected that the highest level (vwo) and lowest level (vmbo-bb) would be best predicted by both TTR and CET.
Luyten and Bosker (2004) found that the difference in TTR between high- and SES children was largest among low-performing students, with low-SES students receiving a lower TTR than high-SES students. These findings suggest a likelihood of differential effects for SES in the current study as well. However, since no research into this comparison has been done, the research question regarding SES remained exploratory without specific hypotheses.
The current study provides clear answers to 1) the long-standing issue of which indicator should be preferred in terms of predictive power for attainment in secondary education, 2) questions about the effect of the 2015 shift in sequence, and 3) questions about the effect of SES on the predictive values of TTR and SAT. Multiple very large samples, approaching population data, were used, eliminating generalization issues due to selective sampling. Furthermore, multiple cohorts were investigated to determine whether the results were stable over time.
2 Method
2.1 Participants
The current study used data from Dienst Uitvoering Onderwijs (DUO), a governmental institute that collects the educational data of all students in the Netherlands. We used the data of students who completed the last grade of primary education (grade 6) from 2010-2011 until 2015-2016. In Table 1, cohorts A to D are CET-TTR-P3 cohorts, whereas cohorts E and F are TTR-CET-P3 cohorts. Students who sat the CET (73% to 79% of all grade 6 students) were included in the calculations of the correspondence between CET and P3. In addition, students who repeated the first or
268 PEDAGOGISCHE STUDIËN second year of secondary school, or dropped
out of secondary education before year three, were excluded from the dataset. Table 1 presents the final numbers of students in each cohort. Only students who received a TTR that is included in the so-called conversion table (see Table 2) were included in the comparison of TTR and CET (85% to 93% of the participants), eliminating a small group of students that received a TTR including three adjacent tracks or PrO.
2.2 Measures
The CET comprises two compulsory parts: arithmetic (85 items) and the Dutch language (135 items). For cohorts A to D, the CET was administered in February, approximately five months before the end of the school year, following standardized guidelines. For cohorts E and F, the CET was administered in March/April, about one month after the TTR was given (see Section 1.5). The test results are converted to an overall standard score
(ranging from 501 to 550). Using conversion Table 2, the overall standard score can be translated to a track recommendation (which does not necessarily correspond with the TTR given to the students). Table 2 is based on admission and trajectory research conducted by Cito.
TTR contains a recommendation for one level or a combination of adjacent levels of secondary education (vmbo-bb, vmbo-kb, vmbo-gtl, havo, and vwo). Educational attainment after three years of secondary education (P3) was assessed approximately three years after students took the CET and got the TTR.
For SES, a four-group classification based on the highest achieved level of education of the parents was used. The lowest SES group (SES1) comprised parents with a maximum of two years of Vocational Education and Training (VET) as their highest educational level. SES2 comprised the group with a maximum of four years of VET as their highest educational level. In SES3, a university of applied sciences was the highest educational level of the parents. The highest SES group (SES4) consisted of parents who had completed university.
2.3 Analysis plan
TTR and P3 were measured on a categorical (ordinal) scale; SAT was measured on an interval scale. Predictive validity was assessed using the proportion of corre - s pondence (see Appendix A). Since dual recommendations include two levels of education (adjacent tracks), both recom-mended tracks were counted as corre-
Cohort no. Year grade 6 Year P3 CET TTR Total number
of students in grade 6 A 2010-2011 2013-2014 140.681 161.337 189.511 B 2011-2012 2014-2015 147.421 170.595 193.349 C 2012-2013 2015-2016 151.167 178.845 195.160 D 2013-2014 2016-2017 149.575 178.695 192.688 E 2014-2015 2017-2018 151.986 169.546 192.233 F 2015-2016 2018-2019 135.352 179.250 186.424 Table 2
Conversion table of the Centrale eindtoets (College voor Toetsen en Examens, 2016).
Score Advice 501 – 518 vmbo-bb 519 – 525 vmbo-bb/kb 526 – 528 vmbo-kb 529 – 532 vmbo-gtl 533 – 536 vmbo-gtl/havo 537 – 539 havo 540 – 544 havo/vwo 545 – 550 vwo Table 1
269 PEDAGOGISCHE STUDIËN
s pondence. For instance, for a TTR of vmbo-gtl/havo, both vmbo-gtl and havo in P3 were seen as correspondence. Therefore, the dual and single recommendations were investigated separately. Furthermore, all educational levels and all SES groups were investigated separately.
Since the sample sizes of this study were very large, and the data were almost population data, no significance tests were conducted. When conducting a significance test with these sample sizes, a difference of .01 is significant at the .01% level, and therefore also at the 5% level that is commonly used in statistical hypothesis testing. Thus, all differences presented in the next section are significant at the 5% level. With very large sample sizes, it is more informative to look at effect sizes. In this study, for ease of interpretation, a difference between pro-portions or correlations that was equal to or less than .05 was referred to as small, between .05 and .10 was labelled medium, and above .10 was considered large.
3 Results
3.1 Teacher track recommendation vs. standardized achievement test
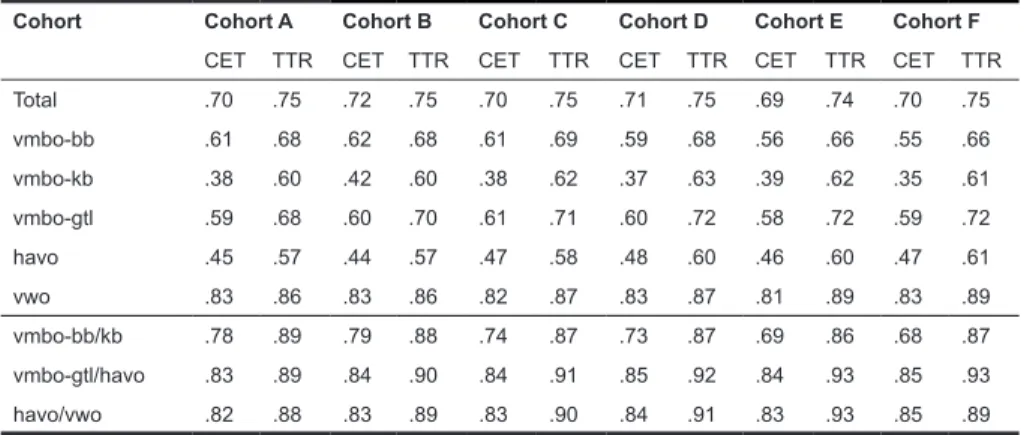
Consider the upper row associated with the overall proportion of correspondence in Table 3. The two columns per cohort present the proportions of students that are in the same track in TTR and P3, and in CET and P3, respectively, for all six cohorts. The correct prediction of P3 using CET ranges from .69 to .72, whereas the correct prediction of P3 using TTR ranges from .74 to .75. Thus, the overall predictions of both indicators are quite stable over time. Furthermore, for each cohort, TTR is a slightly more accurate predictor of P3 than CET, both before and after the 2015 shift. A higher proportion of the students attained the level of education of TTR than the level of education of CET, with small differences ranging from .03 to .05. 3.2 Educational tracks
Table 3 further presents the proportions of correspondence between TTR and P3, and
CET and P3, for the individual educational tracks. For all cohorts and all educational tracks, TTR has a higher predictive value for P3 than CET. For all cohorts, the single track vwo is predicted most accurately, by both CET (.81 to .83) and TTR (.86 to .89). Furthermore, for all cohorts, vmbo-kb has the lowest correspondence between recom-mendation and educational attainment, both for CET (.35 to .42) and TTR (.60 to .63).
Large differences between the predictive values of TTR and CET can be found for the level vmbo-kb for both the CET-TTR-P3 cohorts (.18 to .26) and the TTR-CET-P3 cohorts (.23 to .26). Large differences are also found for havo in the CET-TTR-P3 cohorts (.11 to .14). For vmbo-gtl (.09 to .12), medium to large differences between TTR and CET are found for the CET-TTR-P3 cohorts, whereas large differences are found for vmbo-gtl (.13 to .14) in the TTR-CET-P3 cohorts. Vmbo-bb shows medium differences in the CET-TTR-P3 cohorts (.06 to .09) and large differences in the TTR-CET-P3 cohorts (.10 to .11). For the single recommendation vwo, small differences are found for the CET-TTR-P3 cohorts (.03 to .05), whereas for the TTR-CET-P3 cohorts there are medium differences (.06 to .08). For most of the single recommendations, the differences between TTR and CET are larger for the TTR-CET-P3 cohorts than for the CET-TTR-P3 cohorts. 3.3 Dual recommendations
For all cohorts, the dual recommendations vmbo-gtl/havo and havo/vwo predicted P3 the most accurately of all educational tracks, both by TTR (.88 to .93) and by CET (.82 to .85). Since for dual recommendations either position in year 3 counts as agreement, the higher accuracy in comparison with the single recommendations is partly due to the calculation method.
For the dual recommendation vmbo-bb/ vmbo-kb, medium to large differences (.09 to .14) between TTR and SAT are found for the CET-TTR-P3 cohorts, whereas large differences (.17 to .19) are found for vmbo-bb/vmbo-kb in the TTR-CET-P3 cohorts. For the dual recommendation vmbo-gtl/havo, the differences between TTR and CET are
270 PEDAGOGISCHE STUDIËN medium for all cohorts (.06 to .09). Havo/
vwo has medium differences in the CET-TTR-P3 cohorts (.06 to .07) and small to medium differences in the TTR-CET-P3 cohorts (.04 to .10). For most of the dual recommendations, the differences between TTR and CET are larger for the TTR-CET-P3 cohorts than for the CET-TTR-P3 cohorts. 3.4 SES
Table 4 presents the proportions of correspondence between TTR, CET, and P3 for the four different SES groups. For all SES groups and for all educational tracks, TTR is the best predictor of P3. In terms of overall predictions, the accurateness of both predictors increases with the educational level of the parents: CET and TTR are least accurate for SES1 and most accurate for SES4. The differences between CET and TTR for the overall predictions are small to medium (.01 to .06) for all cohorts. Furthermore, the overall predictive values of CET and TTR are very similar for SES4.
The predictive powers of CET and TTR vary largely for the individual educational tracks. For example, the predictive values of both predictors decrease from SES1 to SES4, for all cohorts, in the case of vmbo-bb, yet increase from SES1 to SES4, for all cohorts, for vwo and havo/vwo. Furthermore, differences in predictive value between CET and TTR also vary largely for the individual educational tracks. For example, for vwo,
differences are small for SES4 for all cohorts. However, for vmbo-kb, all differences between CET and TTR are large, for all cohorts and all SES groups. Moreover, for the dual recommendation vmbo-bb/kb, differences are medium for SES1, yet large for SES2, SES3, and SES4, for all cohorts.
Table 5 displays the proportions of students that attained a lower or higher level in P3 than their TTR indicated. For all cohorts and all educational tracks, the proportion of students that attained a lower level decreases from SES1 to SES4, whereas the proportion of students that attained a higher level increases from SES1 to SES4. Furthermore, in the SES1 group, for all cohorts and all educational tracks, except vmbo-kb of cohorts E and F, more students attained a lower level than a higher level than their TTR indicated. We see the opposite in the SES4 group: for all cohorts and all educational tracks, more students attained a higher level than a lower level than their TTR indicated.
Table 6 displays the proportions of students that attained a lower or higher level in P3 than their CET indicated. Again, for all cohorts and all educational tracks, the proportion of students that attained a lower level decreases from SES1 to SES4, whereas the proportion of students that attained a higher level increases from SES1 to SES4. Furthermore, for all cohorts and all SES groups, more students attained a lower level than a higher level in the track vmbo-kb. Cohort Cohort A Cohort B Cohort C Cohort D Cohort E Cohort F
CET TTR CET TTR CET TTR CET TTR CET TTR CET TTR
Total .70 .75 .72 .75 .70 .75 .71 .75 .69 .74 .70 .75 vmbo-bb .61 .68 .62 .68 .61 .69 .59 .68 .56 .66 .55 .66 vmbo-kb .38 .60 .42 .60 .38 .62 .37 .63 .39 .62 .35 .61 vmbo-gtl .59 .68 .60 .70 .61 .71 .60 .72 .58 .72 .59 .72 havo .45 .57 .44 .57 .47 .58 .48 .60 .46 .60 .47 .61 vwo .83 .86 .83 .86 .82 .87 .83 .87 .81 .89 .83 .89 vmbo-bb/kb .78 .89 .79 .88 .74 .87 .73 .87 .69 .86 .68 .87 vmbo-gtl/havo .83 .89 .84 .90 .84 .91 .85 .92 .84 .93 .85 .93 havo/vwo .82 .88 .83 .89 .83 .90 .84 .91 .83 .93 .85 .89 Table 3
Proportions of correspondence between TTR and P3, and CET and P3 for the different educational tracks
271 PEDAGOGISCHE STUDIËN
Cohort SES* Cohort A Cohort B Cohort C Cohort D Cohort E Cohort F
CET TTR CET TTR CET TTR CET TTR CET TTR CET TTR
Total 1 .58 .62 .59 .62 .59 .64 .60 .63 .58 .62 .59 .64 2 .63 .67 .63 .67 .62 .68 .62 .68 .60 .66 .61 .67 3 .70 .74 .71 .74 .69 .74 .70 .73 .68 .71 .68 .71 4 .78 .79 .78 .79 .77 .78 .77 .78 .75 .76 .75 .77 vmbo-bb 1 .59 .64 .61 .66 .59 .66 .58 .66 .57 .63 .55 .63 2 .58 .61 .57 .62 .56 .63 .55 .63 .52 .61 .51 .58 3 .48 .56 .44 .52 .43 .54 .45 .51 .37 .51 .39 .50 4 .43 .52 .43 .46 .48 .61 .34 .44 .34 .46 .38 .53 vmbo-kb 1 .42 .54 .42 .56 .41 .56 .42 .59 .44 .58 .39 .57 2 .40 .57 .41 .58 .40 .60 .38 .61 .39 .59 .37 .59 3 .31 .55 .33 .57 .30 .60 .28 .57 .28 .57 .25 .47 4 .26 .57 .25 .52 .21 .51 .18 .52 .18 .47 .18 .61 vmbo-gtl 1 .46 .57 .48 .58 .51 .61 .50 .61 .48 .63 .52 .64 2 .53 .64 .55 .65 .56 .67 .57 .69 .55 .69 .56 .68 3 .61 .69 .63 .70 .63 .71 .62 .70 .59 .69 .58 .69 4 .57 .64 .60 .67 .60 .67 .57 .67 .52 .64 .51 .65 havo 1 .32 .44 .32 .44 .34 .47 .36 .47 .33 .48 .33 .51 2 .40 .51 .38 .52 .40 .53 .40 .54 .39 .54 .41 .55 3 .47 .55 .46 .58 .50 .58 .51 .60 .49 .59 .49 .59 4 .51 .56 .51 .55 .51 .56 .50 .58 .51 .56 .49 .58 vwo 1 .60 .67 .61 .68 .62 .69 .61 .69 .59 .69 .61 .73 2 .71 .76 .71 .76 .69 .76 .69 .74 .66 .76 .69 .76 3 .81 .83 .81 .82 .80 .84 .81 .84 .78 .85 .79 .84 4 .87 .89 .89 .89 .88 .89 .89 .90 .88 .91 .89 .90 vmbo-bb/ kb 1 .78 .86 .78 .83 .76 .83 .76 .83 .75 .85 .73 .85 2 .74 .84 .74 .84 .72 .86 .70 .85 .67 .83 .66 .83 3 .61 .82 .66 .78 .60 .79 .58 .81 .53 .77 .52 .76 4 .54 .81 .55 .83 .50 .75 .48 .72 .38 .75 .40 .79 vmbo-gtl/ havo 1 .69 .77 .70 .79 .70 .79 .73 .81 .70 .83 .75 .82 2 .76 .83 .77 .83 .78 .84 .79 .85 .77 .86 .79 .86 3 .82 .87 .83 .88 .84 .90 .84 .88 .84 .91 .83 .89 4 .83 .89 .82 .86 .83 .89 .83 .88 .80 .87 .79 .87 havo/ vwo 1 .60 .69 .62 .71 .64 .77 .65 .80 .61 .77 .65 .76 2 .71 .79 .71 .79 .71 .81 .72 .82 .71 .83 .72 .81 3 .82 .86 .82 .86 .82 .87 .82 .88 .83 .89 .83 .88 4 .87 .90 .87 .90 .88 .91 .89 .92 .89 .93 .89 .92
*Highest educational level of parents: SES1 = maximum of two years of Vocational Education and Training (VET), SES2 = maximum of four years of VET, SES3 = University of applied sciences, SES4 = University.
Table 4
Proportions of correspondence between TTR and P3, and CET and P3 for the different educa-tional tracks split into four SES groups.
272 PEDAGOGISCHE STUDIËN In the tracks vmbo-gtl and vmbo-gtl/havo,
more SES1 students attained a lower level than a higher level than their CET indicated, for all cohorts. However, in the SES4 group, the opposite is true.
For the recommendations vmbo-bb and vmbo-bb/kb, there is no lower level to attain in regular schools, so only the proportion of students that attained a higher level is shown. Also here, we see that the proportion of
students that attained a higher level than the their TTR and CET indicated becomes larger as SES becomes higher. For the recommendations vwo and havo/vwo, there is no higher level to attain. Here, the proportion of students that went to a lower level than their CET and TTR indicated becomes smaller as SES becomes higher. These results show that there are clear differential effects for SES in favour of high-SES students.
SES* Cohort A Cohort B Cohort C Cohort D Cohort E Cohort F Low** High*** Low High Low High Low High Low High Low High
vmbo-bb 1 .23 .20 .21 .23 .25 .25 2 .31 .29 .29 .29 .31 .33 3 .38 .40 .31 .43 .45 .43 4 .43 .50 .39 .53 .49 .45 vmbo-kb 1 .25 .12 .24 .13 .24 .13 .19 .15 .15 .21 .14 .22 2 .20 .17 .19 .18 .17 .18 .13 .21 .11 .25 .10 .26 3 .14 .26 .13 .25 .10 .25 .10 .29 .05 .33 .07 .34 4 .11 .28 .13 .30 .10 .34 .10 .34 .05 .42 .06 .41 vmbo-gtl 1 .27 .06 .27 .06 .24 .06 .22 .08 .18 .10 .17 .11 2 .21 .08 .20 .07 .18 .08 .16 .09 .12 .13 .12 .13 3 .12 .13 .12 .13 .11 .14 .10 .16 .07 .19 .08 .19 4 .09 .20 .09 .17 .08 .19 .06 .21 .05 .25 .05 .24 havo 1 .35 .09 .35 .11 .33 .11 .31 .10 .30 .12 .27 .12 2 .28 .13 .28 .12 .28 .12 .25 .13 .23 .14 .23 .13 3 .20 .19 .18 .18 .19 .18 .17 .18 .14 .21 .16 .19 4 .14 .25 .13 .24 .13 .25 .11 .25 .09 .29 .10 .27 vwo 1 .25 .23 .20 .22 .22 .20 2 .18 .17 .17 .19 .17 .16 3 .12 .13 .11 .12 .11 .15 4 .07 .06 .07 .06 .05 .06 vmbo-bb/kb 1 .07 .09 .08 .08 .10 .08 2 .11 .10 .11 .10 .11 .11 3 .14 .18 .41 .17 .20 .20 4 .19 .17 .39 .23 .25 .22 vmbo-gtl/ havo 1 .13 .02 .11 .06 .10 .02 .09 .01 .07 .02 .05 .03 2 .09 .02 .09 .02 .06 .02 .06 .02 .04 .03 .05 .02 3 .04 .03 .04 .02 .03 .02 .02 .03 .02 .03 .02 .03 4 .03 .04 .02 .05 .02 .05 .01 .05 .01 .25 .02 .05 havo/vwo 1 .19 .19 .20 .13 .22 .16 2 .18 .13 .17 .12 .17 .10 3 .12 .08 .11 .07 .11 .06 4 .07 .04 .07 .03 .05 .03
*= Highest educational level of parents: SES1 = maximum of two years of Vocational Education and Training (VET), SES2 = maximum of four years of VET, SES3 = University of applied sciences, SES4 = University.
**= attained lower level than TTR ***= attained higher level than TTR
Table 5
273 PEDAGOGISCHE STUDIËN
4 Discussion
4.1 ConclusionsIn the current study, we examined to what extent teacher track recommendation (TTR) and the Central end-of-primary-school test (CET), a commonly used standardized achievement test (SAT), predict the educational position of students in the third
year of secondary education (P3). Furthermore, we investigated which of the two predictors is the most accurate, and whether this differs for the different educational tracks and different SES groups. Moreover, we investigated whether the predictive values differed for the CET-TTR-P3 cohorts and TTR-CET-P3 cohorts.
In line with the hypotheses, TTR proves to SES* Cohort A Cohort B Cohort C Cohort D Cohort E Cohort F
Low** High*** Low High Low High Low High Low High Low High
vmbo-bb 1 .21 .19 .21 .23 .23 .25 2 .29 .29 .30 .33 .34 .35 3 .40 .44 .47 .46 .53 .51 4 .46 .43 .41 .58 .54 .54 vmbo-kb 1 .18 .33 .20 .29 .16 .36 .12 .38 .14 .35 .10 .43 2 .12 .44 .13 .40 .10 .45 .09 .47 .09 .46 .07 .50 3 .07 .56 .07 .53 .05 .60 .04 .63 .04 .61 .03 .65 4 .07 .63 .05 .64 .03 .71 .04 .74 .02 .71 .02 .73 vmbo-gtl 1 .39 .06 .37 .06 .34 .07 .33 .09 .38 .07 .30 .10 2 .31 .09 .30 .08 .29 .09 .26 .10 .29 .10 .24 .13 3 .18 .14 .17 .14 .15 .16 .13 .19 .17 .18 .15 .22 4 .14 .23 .13 .21 .10 .25 .10 .29 .10 .31 .06 .35 havo 1 .52 .06 .54 .05 .48 .07 .49 .06 .53 .05 .50 .08 2 .45 .08 .47 .07 .43 .09 .43 .09 .48 .07 .42 .10 3 .33 .13 .35 .12 .32 .13 .30 .14 .32 .12 .28 .17 4 .22 .21 .23 .19 .21 .22 .20 .24 .19 .24 .15 .30 vwo 1 .31 .30 .29 .30 .34 .31 2 .23 .22 .25 .25 .28 .25 3 .15 .15 .16 .16 .18 .17 4 .09 .08 .09 .09 .09 .09 vmbo-bb/kb 1 .13 .13 .16 .16 .18 .18 2 .20 .19 .23 .24 .27 .26 3 .33 .29 .37 .37 .41 .42 4 .40 .37 .43 .46 .53 .53 vmbo-gtl/ havo 1 .21 .02 .20 .01 .19 .02 .16 .02 .20 .01 .15 .03 2 .14 .02 .15 .02 .14 .02 .12 .03 .14 .02 .10 .03 3 .08 .04 .07 .03 .07 .05 .05 .05 .06 .04 .04 .06 4 .05 .07 .04 .07 .03 .08 .02 .09 .03 .11 .02 .13 havo/vwo 1 .28 .30 .29 .30 .29 .27 2 .21 .22 .25 .25 .23 .20 3 .12 .15 .16 .16 .12 .12 4 .06 .08 .09 .09 .06 .05
*= Highest educational level of parents: SES1 = maximum of two years of Vocational Education and Training (VET),
SES2 = maximum of four years of VET, SES3 = University of applied sciences, SES4 = University. **= attained lower level than CET
***= attained higher level than CET
Table 6
274 PEDAGOGISCHE STUDIËN be a better predictor of P3 than CET overall.
This is consistent across the different cohorts, tracks, and SES groups. The overall differences between the predictive values of TTR and CET are small, although the differences become bigger in comparisons at track level. These results are in line with the findings of Luyten (2004), Feron et al. (2015), and Lek and Van de Schoot (2019). Based on this finding, we conclude that educational trajectories follow the TTR more closely than SAT. Although TTR appears to be a better predictor of P3 than SAT, it should be noted that there are other variables, such as confounding biases or values of primary and secondary school teachers, that may play a role in students’ development. Moreover, the predictors are also indicators on which the placement decision is made, which may have influenced the strength of the predictive power.
Regarding the individual educational tracks, the predictive values of the single recommendations vmbo-kb and havo by both TTR and CET are the lowest of all educational tracks in all cohorts. The single recommendation vwo and the dual recommendations vmbo-gtl/havo and havo/ vwo are predicted most accurately by both TTR and CET, for all cohorts. For vwo and havo/vwo, this may (partly) be due to ceiling effects. Furthermore, looking at the overall numbers, we do not see an overall change in differences in predictive values over time, but some notable changes are visible when looking at the different educational levels. Moreover, TTR remained a better predictor of P3 after the switch in sequence of SAT and TTR.
Regarding different SES groups, the predictive value of TTR and CET showed differential effects. The difference between the predictive values of TTR and CET was the smallest for the highest SES group. For all recommendations, the proportion of students that attained a lower level than their CET and TTR indicated became smaller as SES became higher. The proportion of students that attained a higher level than their CET and TTR indicated became larger as SES became higher. Differences between
SES groups are quite large. In the lowest SES group, for most recommendations, attaining a lower level than CET and TTR indicated was more common than attaining a higher level. For the highest SES group, the opposite was true. These results were consistent across almost all cohorts and almost all educational levels. The fact that low-SES students, who get a lower TTR whilst having the same CET score, more often attain a lower than a higher level than recommended, evidently shows the complex interactions between SAT (De Boer et al., 2010; Timmermans et al., 2015), TTR, SES, and educational attainment.
A lower aspiration level of both parents and the student (De Boer et al., 2010) and a less favourable working attitude (Hornstra, 2013) are common explanations for the higher rate of students attaining a lower level than expected in the low-SES group. Teachers have lower performance expectations for low-SES students in primary education and also expect their performance level in secondary education to be lower. These lower expectations negatively affect their achievement level. Furthermore, high-SES students might get more parental support, such as intellectual and financial support in doing their homework or receiving training and tutoring (Kuyper & van der Werf, 2012). The academic language used in education might be more challenging for low-SES students as well (Heppt, Haag, Böhme, & Stanat, 2014). More research is needed into the mechanism behind the effect of SES on the relationship between educational attainment, TTR, and SAT in order to tackle this phenomenon.
The fact that TTR is also a better predictor when SAT is not included suggests that the SAT did not greatly affect the TTR. It should be noted, however, that teachers usually use the test results of students’ final year(s) of primary education in their TTR. Thus, the TTR after 2015 is not only based on the subjective opinion of the teacher. It is still affected by test results and grades. Luyten and Bosker (2004) noted that use of a SAT in teachers’ final recommendations may have caused a trend in which teachers are less biased by background variables, such as SES,
275 PEDAGOGISCHE STUDIËN
in giving the TTR. Also, a SAT was sometimes seen as a useful ‘second opinion’ (Driessen & Doesborgh, 2005). The results of this study show that the CET also has differential effects regarding SES. Therefore, SAT does not seem to be as resistant to SES differences as was previously thought.
The higher predictive value of TTR may be due to teachers’ consideration of non-cognitive measures, such as working attitude or SES background, in addition to the possibility that the SAT score was taken into account, along with other cognitive measures that teachers take into account (Inspectie van het Onderwijs, 2014). When SES continues to have an effect on secondary school students’ educational attainment, it may well be that TTR is a more accurate predictor than the SAT score. However, on average, the difference between the predictive values of the two indicators is small. The fact that non-cognitive measures are substantially less closely related to the recommendations than the cognitive measures may explain the small difference in predictive value (Driessen & Doesborgh, 2005; Driessen & Smeets, 2007, 2011; Luyten & Bosker, 2004; Timmermans et al., 2015). The conclusion that TTR is a better predictor may also be explained by the fact that it is better to look at the development in a student’s achievement scores than at a student’s relative scores compared to other students’ achievement scores (Visser, 2014).
Both TTR and CET predict to a large extent the educational position of students in their third year of secondary education. It can be concluded that teachers as well as standardized tests are good predictors of the attainment levels of their students in secondary education. However, this high predictive value may also be a sign of immobility in secondary education. Students are commonly placed in the recommended track and stay in this track throughout their secondary education. The fact that students rarely change between tracks results automatically in a high predictive value of track placement. Another confounding mechanism may be that schools base their placement more on TTR than on SAT, which might affect the results. TTR and SAT may be
used differently in making decisions regarding educational trajectories. Therefore, we should be careful in interpreting a high predictive value solely as a good thing.
4.2 Recommendations and Implications A great deal of discussion has taken place recently about the shift in sequence and importance of TTR and the SATs. The findings of the current study add objective information to this discussion: TTR has a slightly higher predictive validity for P3 than SAT, both before and after the switch in sequence in 2015. Based solely on these results, it would be recommendable to give more weight to TTR, which validates the shift in weight implemented in 2015.
Regarding educational practice, and looking at the separate educational tracks, both TTR and CET have a relatively lower predictive validity for the vmbo-kb and havo tracks. Moreover, the differences in the predictive values of TTR and CET are larger for the vmbo-kb recommendation than for the other tracks. Based on these findings, it seems reasonable to pay extra attention to these two levels and investigate further what may cause this lower predictive value. For such analyses, a broad set of student characteristics, including non-cognitive characteristics such as motivation and behavior, should be included in order to be able to characterize these specific student groups, in addition to indicators of their cognitive functioning in secondary education.
The current findings show differential effects of SES on the predictive values of both TTR and CET. Further investigation into these differential effects is needed. Moreover, teachers should be aware of the sensitivity to SES of both TTR and SAT. The fact that SAT is a less precise predictor of educational trajectories for low-SES students than for high-SES students indicates that the SAT is not a suitable check for ruling out biases owing to students’ SES.
4.3 Limitations
It is important to note that CET being a less accurate predictor does not necessarily mean that it is a poor basis for recommendations,
276 PEDAGOGISCHE STUDIËN since it is still accurate in most cases.
Furthermore, students and their environments may change in those three intermediate years, which may influence the secondary school trajectory of the student. The educational trajectory of students is strongly dependent on the level of education in the first year(s) of secondary education (Lenhard & Schröppel, 2014; Tolsma & Wolbers, 2010); therefore, it is hard to pinpoint what caused the higher predictive value of TTR. It is possible that TTR gives a more thorough image of the capacities of students; however, this may also be the result of a self-fulfilling prophecy once a student is placed in a certain track. These considerations need to be taken into account when interpreting the results.
The current research only included schools that used the CET developed by Cito. Although this was a large part of the total population of Dutch schools up until the cohort of grade 6 students in 2016, there may be a systematic difference between schools that used this particular test and those that did not. Each year more and more schools choose to administer a SAT other than the CET developed by Cito (Dekker, 2016). It would be interesting to investigate the predictive validity of these other SATs as well. Furthermore, the earlier cohorts in this study were more representative of the overall Dutch population of schools and students than the later cohorts (Van Boxtel, Engelen, & De Wijs, 2011). Another limitation is that students who repeated year 1 or 2 of secondary school, or dropped out of secondary education before third year, were excluded from the dataset. Although repeating a year is more common in upper secondary education, the exclusion of these students may result in slightly different conclusions.
The predictive validities of TTR and CET were investigated in the current research and compared for several cohorts in which the CET was administered before the TTR was given and for two cohorts in which the TTR was given before the CET was administered. The results show that TTR is generally a more accurate predictor of educational attainment than CET. This holds for both
situations; therefore, administering TTR before the CET or after the CET does not make a difference. When the different educational tracks are considered separately, slight differences in predictive values are present in the two situations. Since the tracking at the beginning of secondary education is largely dependent on both TTR and CET, the question remains whether the TTR truly is a better predictor of the educational performances of students or if the greater accuracy of TTR is in a way a self-fulfilling prophecy (Rosenthal & Jacobsen, 1968; Rubie-Davies et al., 2015).
NOTE
1 PrO was not considered in the current study
because of differences in its structure compared with the other tracks
Acknowledgements
The authors thank Herman Jonker of DUO for helping in preparing the datasets used in this study.
References
Allen, J. D. (2005). Grades as valid measures of academic achievement of classroom learning. The Clearing House: A Journal of Educational Strategies, Issues and Ideas, 78(5), 218-223. doi: 10.3200/TCHS.78.5.218-223.
Anderson, L. W., Jacobs, J., Schramm, A., & Splittgerber, F. (2000). School transitions: beginning of the end or a new begin-ning? International Journal of Educational Research, 33, 325-339. doi: 10.1016/ s0883-0355(00)00020-3.
Benner, A. D. (2011). The transition to high school: Current knowledge, future directions. Educa-tional Psychology Review, 23, 299-328. doi: 10.1007/s10648-011-9152-0.
College voor Toetsen en Examens. (2016). Te-rugblik 2015: Resultaten centrale eindtoets 2015. Utrecht, The Netherlands: College voor Toetsen en Examens.
leer-277 PEDAGOGISCHE STUDIËN
lingen in het voortgezet onderwijs. Groningen: GION.
De Boer, H. Bosker, R. J. & Van der Werf, M. P. C. (2010). Sustainability of teacher expectation bias effects on long-term student performance. Journal of Educational Psychology, 102, 168-179. doi:10.1037/a0017289.
Dekker, S. (2015). Eerste inzichten Wet Eindtoet-sing PO. Government document, Den Haag, 4 december 2015.
Dekker, S. (2016). Eindtoetsresultaten en de over-gang van leerlingen naar het voortgezet on-derwijs in schooljaar 2015/2016. Government document, Den Haag, 1 november 2016. Driessen, G., & Doesborgh, J. (2005). Relaties
tus-sen achtergrondkenmerken en competenties van leerlingen en hun advies voor voortgezet onderwijs. In: Driessen, Doesborgh, Ledoux, Overmaat, Roeleveld, & Van der Veen (Reds.). Van basis- naar voortgezet onderwijs. Voor-bereiding, advisering en effecten (pp 39-70). Nijmegen / Amsterdam: ITS / SCO-Kohnstamm Instituut.
Driessen, G., & Smeets, E. (2007). De relatie tussen prestaties en advies: onder- of overadvisering bij de overgang van basis- naar voortgezet onderwijs? In: Inspectie van het Onderwijs, Onderadvisering in beeld (pp. 59-81). Utrecht: Inspectie van het Onderwijs.
Ehren, M. C. M., & Swanborn, M. S. L. (2012). Strategic data use of schools in account-ability systems. School Effectiveness and School Improvement, 23(2), 257-280. doi: 10.1080/09243453.2011.652127.
Farrington, C. A., Roderick, M., Allensworth, E., Nagaoka, J., Keyes, T. S., Johnson, D. W., & Beechum, N. O. (2012). Teaching adolescents to become Learners: The role of noncogni-tive factors in shaping school performance: A critical literature review. Chicago: University of Chicago Consortium on Chicago School Research.
Feron, E., Schils, T., & Ter Weel, B. (2016). Does the teacher beat the test? The additional value of teacher assessment in predicting student abil-ity. De Economist, 164, 391-418. doi: 10.1007/ s10645-016-9278-z.
Heppt, B., Haag, N., Böhme, K, & Stanat, P. (2015). The role of academic-language features for reading comprehension of language-minority students and students from low-SES families.
Reading Research Quarterly, 50(1), 61-82. Doi: 10.1002/rrq.83.
Hornstra, T. E. (2013). Motivational developments in primary school: Group-specific differences in various learning contexts. Amsterdam: UVA. Inspectie van het Onderwijs. (2014). De kwaliteit
van het basisschooladvies. Een onderzoek naar de totstandkoming van het basisschooladvies en de invloed van het basisschooladvies op de verdere schoolloopbaan. Utrecht: Inspectie van het Onderwijs.
Inspectie van het Onderwijs. (2018). De staat van het onderwijs 2016/2017. Utrecht: Inspectie van het Onderwijs.
Jacob, B. A., & Levitt, S. D. (2003). Rotten apples: An investigation of the prevalence and predictors of teacher cheating. The Quarterly Journal of Economics, 118, 843-877. doi: 10.3386/w9413.
Koretz, D. M., McCaffrey, D. F., & Hamilton, L. S. (2001). Toward a Framework for Validating Gains under High-Stakes Conditions (CSE Technical Report). Los Angeles, USA: Univer-sity of California.
Kuyper, H., & van der Werf, G. (2012). Excellente leerlingen in het voortgezet onderwijs. School-loopbanen, risicofactoren en keuzen. Gronin-gen: GION Onderwijs/Onderzoek.
Lek, K., & Van de Schoot, R. (2019). Wie weet het beter, de docent of de centrale eindtoets? De psycholoog, 54 (4), 10-21.
Lenhard, W., & Schröppel, D. (2014). Prediction of academic performance prior to intersections within a multi-tiered school system. Educatio-nal Research and Evaluation, 20(6), 454-468. doi: 10.1080/13803611.2014.975136. Luyten, H. (2004). Succes in het voortgezet
on-derwijs: Capaciteiten, inzet of achtergrond? Pedagogische studiën, 81, 151-166.
Luyten, H., & Bosker, R. J. (2004). Hoe merito-cratisch zijn schooladviezen? Pedagogische studiën, 81, 89-103.
Ministerie van Onderwijs, Cultuur en Weten-schap. (2016a, 15th February). Overgang van
leerlingen van primair naar voortgezet onder-wijs [Government document]. Retrieved from https://www.rijksoverheid.nl/documenten/brie- ven/2016/02/15/brief-over-overgang-van-leer-lingen-van-primair-naar-voortgezet-onderwijs Ministerie van Onderwijs, Cultuur en Wetenschap.
278 PEDAGOGISCHE STUDIËN
Eindtoetsing PO [Government document]. Retrieved from https://www.rijksoverheid. nl/documenten/kamerstukken/2017/01/27/ kamerbrief-over-tussenevaluatie-wet-eind-toetsing-po
Raad. (2013). Eindtoets verplaatst, wens PO-Raad gehoord. Utrecht: PO-PO-Raad.
PO-Raad, AVS, & VO-Raad. (2011). Effectief Scha-kelen: verbeteren van de informatie overdracht tussen PO en VO. Utrecht: PO-Raad. Rosenthal, R., & Jacobsen, L. (1968). Pygmalion in
the classroom. The Urban Review, 3(1), 16-20. doi: 10.1007/BF02322211.
Rubie-Davies, C. M., Peterson, E. R., Sibley, C. G., & Rosenthal, R. (2015). A teacher expectation intervention: Modelling the practices of high expectation teachers. Contemporary Educa-tion Psychology, 40, 72-85. doi: 10.1016/j. cedpsych.2014.03.003.
Slob, A. (2018). Kamerbrief over schooladviezen en resultaten op eindtoets in schooljaar 2017-2018. Government document, Den Haag, 29 november 2018.
Tieben, N., & Wolbers, M. (2010). Success and failure in secondary education: socio- economic background effects on secondary school outcome in the Netherlands, 1927-1998. British Journal of Sociology of Education, 31, 277-290. doi:10.1080/01425691003700516. Timmermans, A. C., Kuyper, H., & Van der Werf, G.
(2015). Accurate, inaccurate, or biased teacher expectations: Do Dutch teachers differ in their expectations at the end of primary education? British Journal of Educational Psychology, 85, 459-478. doi: 10.1111/bjep.12087.
Tolsma, J., & Wolbers, M. H. J. (2010). Onderwijs als nieuwe sociale scheidslijn? De gevolgen van onderwijsexpansie voor sociale mobili-teit, de waarde van diploma’s en het relatieve belang van opleiding in Nederland. Tijdschrift voor Sociologie, 31(3), 239-259.
Van Aarsen, E. (2013). Voorspellende waarde van LOVS toetsen voor schoolsucces. Utrecht: Oberon.
Van Boxtel, H., Engelen, R., & De Wijs, A. (2011). Wetenschappelijke verantwoording van de Eindtoets 2010. Arnhem: Cito.
Van Eck, E. (2016). Is er iets mis met het school-advies? Didactief. Downloaded on 10 June 2020, from https://didactiefonline.nl/blog/ blonz/is-er-iets-mis-met-het-schooladvies
Van Rooijen, M., Korpershoek, H., Vugteveen, J., Timmermans, A. C., & Opdenakker, M.-C. (2016). Overgangen en aansluitingen in het on-derwijs. Deelrapportage 2: empirische studie naar de cognitieve en niet-cognitieve ontwikke-ling van leerontwikke-lingen rondom de po-vo overgang. Groningen: GION Onderwijs/Onderzoek. Visser, J. (2014). Toetsen en normeringen:
en-kele misverstanden opgehelderd. Basisschool-management, 28(2), 19-23.
Authors
Monique Dijks is a PhD Candidate at the Faculty
of Behavioral and Social Sciences at the University of Groningen. Matthijs Warrens is an
associate professor at the Faculty of Behavioral and Social Sciences at the University of Groningen. Erik Fleur is a Senior Researcher at
Dienst Uitvoering Onderwijs (DUO, The Education Executive Agency of the Dutch Ministry of
Education, Culture and Science). Hanke
Korpershoek is a Professor (adjunct) at the
Faculty of Behavioral and Social Sciences at the University of Groningen. Inge Wichgers is a PhD
Candidate at the Faculty of Behavioral and Social Sciences at the University of Groningen. Roel Bosker is Professor at the
Faculty of Behavioral and Social Sciences at the University of Groningen.
Correspondence address: M.A. Dijks, University of Groningen, Grote Rozenstraat 3, 9712 TG Groningen, the Netherlands; E-mail: m.a.dijks@ rug.nl
Samenvatting
De predictieve kracht van schooladviezen voor het voortgezet onderwijs
In de overgang van het basis- naar het voortgezet onderwijs worden twee indicatoren gehanteerd voor de plaatsing in het voortgezet onderwijs: het schooladvies van de leerkracht en een gestandaardiseerde toets. Welke indicator het beste werkt om leerlingen te plaatsen is een doorgaande discussie onder onderwijs-onderzoekers en professionals. Sinds 2015
279 PEDAGOGISCHE STUDIËN
wordt de gestandaardiseerde toets afgenomen nadat de schooladviezen gegeven zijn, terwijl dit voor 2015 andersom was. De huidige studie onderzoekt in welke mate het schooladvies en de Centrale eindtoets de onderwijspositie in het derde leerjaar van het voortgezet onderwijs voorspellen voor meerdere cohorten voor en na 2015. De resultaten zijn vergeleken voor de verschillende onderwijsniveaus en SES-groepen. Hiervoor zijn meerdere steekproeven die populatiedata benaderen gebruikt. Voor alle onderwijsniveaus en SES-groepen geldt dat het schooladvies een betere voorspeller is voor de onderwijspositie in jaar 3 dan de Centrale eindtoets. Grote differentiële effecten voor SES werden gevonden. De verandering in volgorde van het schooladvies en de afname van de Centrale eindtoets had geen effect op deze conclusies. De resultaten van dit onderzoek geven nieuwe inzichten in de predictieve waarde van de schooladviezen en de Centrale eindtoets voor en na 2015.
Kernwoorden: overgangen, schooladvies, gestandaardiseerde eindtoets, primair onderwijs, voortgezet onderwijs
280 PEDAGOGISCHE STUDIËN
Appendix A
Table A1
Values of overall correspondence between TTR and P3, and SAT and P3 for six cohorts.
2011-2013 2012-2014 2013-2015 2014-2016 2015-2017 2016-2018
TTR Proportion correspondence .69 .70 .70 .70 .69 .70
Average CET score* .83 .84 .85 .85 .86 .86
Educational ladder* .87 .87 .88 .89 .89 .89
SAT Proportion correspondence .66 .67 .66 .66 .65 .65
Average CET score* .80 .81 .81 .82 .81 .81
Educational ladder* .82 .83 .83 .84 .82 .83