Paris-aligned energy transition
pathways for India
July 2020
Note
Paris-aligned energy transition pathways for India
© PBL Netherlands Environmental Assessment Agency The Hague, 2020
PBL publication number: 4160
Corresponding author
andries.hof@pbl.nl
Authors
Anteneh G. Dagnachew, Andries F. Hof
Graphics
PBL Beeldredactie
Editing and production
PBL Publishers
This publication can be downloaded from: www.pbl.nl/en. Parts of this publication may be reproduced, providing the source is stated, in the form: Anteneh G. Dagnachew, Andries F. Hof (2020), Paris-aligned energy transition pathways for India, PBL Netherlands
Environmental Assessment Agency, The Hague.
PBL Netherlands Environmental Assessment Agency is the national institute for strategic policy analysis in the fields of the environment, nature and spatial planning. We contribute to improving the quality of political and administrative decision-making by conducting outlook studies, analyses and evaluations in which an integrated approach is considered paramount. Policy relevance is the prime concern in all of our studies. We conduct solicited and
Contents
FINDINGS
4
1
CONTEXT AND AIM
5
2
TRENDS AND AMBITION
6
3
SCENARIO RESULTS
11
3.1 Context 11
3.2 CO2 emissions 12
3.3 Power generation capacity 14
3.4 Industry 17
4
CONCLUSIONS
18
REFERENCES
20
FINDINGS
Under the Paris Agreement, countries agreed to limit global warming to well below 2 °C and to pursue efforts to limit it to 1.5 °C. This implies a fast decarbonisation of the world’s energy system: for 1.5 °C, CO2 emissions need to be net zero by
around 2040. At the same time, the energy demand of many emerging economies is expected to increase strongly in the coming decades. This is especially the case for India; in fact, no country in the world has such a large growth in energy use as India. Aligning this growth with the objectives of the Paris Agreement is a huge task. This PBL report aims to guide effective climate action in India by analysing developments in India’s energy system based on current trends, India’s policy ambitions and the results of Paris-aligned scenarios. The main findings of this study are:
• Power generation and industry are the most important sectors for climate action in India, as they are responsible for over 50% and 30%, respectively, of India’s energy-related CO2 emissions.
• Power generation capacity is projected to approximately double between 2017 and 2030. While COVID-19 will have a high impact on energy use in 2020, current projections show that energy use will continue to increase strongly, from 2021 onwards.
• Coal capacity has increased strongly, over the past decade, but stabilises in Paris-aligned scenarios in the coming decade. After 2030, almost all Paris-Paris-aligned scenarios show an absolute decline in coal capacity.
• Achieving India’s renewable energy targets for 2022 and beyond will require a significant increase in capacity in both solar and wind power compared to current trends. Based on projected costs of power generation technologies, solar and wind make up the largest increase in generation capacity in existing 2 °C and 1.5 °C scenarios. The capacity additions of natural gas, hydro, nuclear and bioenergy are much smaller.
• The relatively small role for natural gas in power generation in Paris-aligned pathways is consistent with current trends – which show no increase in total gas capacity since 2015 – and India’s National Electricity Plan, which shows hardly any increase in gas due to uncertainty in gas availability.
• Increasing energy efficiency in industry is an important measure in both national policies and in scenarios. Scenarios with limited growth in industry energy demand show a stabilising trend in natural gas use at current levels. Scenarios with strongly increasing industry energy demand show an increase in natural gas use in the coming decade.
• India has declared the need for international assistance to achieve its climate goals. Given the above observations in current trends, ambitions and scenarios, cooperation with India could focus on: i) assisting the transition from coal-fired power plants, ii) increasing onshore wind and solar PV (both ground-mounted and rooftop), and iii) promoting energy efficiency in industry.
1 Context and aim
With a population close to 1.4 billion, India is the third largest greenhouse gas emitter and the third largest final energy consuming country in the world, after China and the USA (IEA 2020a; Olivier and Peters 2019). CO2 emissions and energy
consumption are increasing rapidly: between 2007 and 2017, both increased by more than 70%. Even so, final energy use per capita is still only a third of the global average and India’s CO2 emissions per capita equal 1.6 tCO2, compared to
4.3 tCO2,globally. Nevertheless, India’s current energy system, and especially its
electricity system, is heavily reliant on fossil fuels, with 75% of all electricity generated by coal-fired power plants.
Projections based on current trends and policies show that final energy use will continue to increase strongly, driven by population growth, increased access to modern services, increasing electrification rates and GDP growth. IEA (2019a) projections show that India will have the strongest absolute increase in energy consumption of all countries between 2018 and 2040. Without additional policies to reduce greenhouse gas emissions, India’s CO2 emissions are projected to surpass
those of the United States, by around 2035. COVID-19 will clearly have a large impact on GDP, and therefore on energy consumption, with a projected decline in GDP of 4.5% in 2020. However, for 2021, the IMF projects a growth of 6.0% for India, which is similar to the IMF projection before the COVID-19 crisis. The strong increase in energy use is therefore expected to continue from 2021 onwards. A key question is therefore how to align this strong increase in energy use with the objectives of the Paris Agreement and the sustainable development goals. India has already responded to its strong dependence on coal for power generation by setting a target of 40% non-fossil fuel power generation capacity by 2030 in its nationally determined contribution (NDC) and by aiming to increase its non-fossil power generation capacity to 450 GW in 2030 (from 118 GW in 2018). Achieving this latter target calls for a transition that presents both opportunities and challenges for the country’s energy system and that requires many new investment decisions in the energy sector. These decisions require early anticipation, planning and analysis, since they will have long-term consequences for the energy mix and energy-related CO2 emissions. Scenario-based analysis is a powerful tool to explore
the potential pathways of such an energy transition. At the same time, current trends and policy ambitions should also be considered to identify key areas for transformation.
This report aims to provide insight into India’s energy transition by analysing developments in India’s energy system based on current trends, India’s policy ambitions (Section 2), and the results of Paris-aligned energy transition pathways (Section 3).
2 Trends and ambition
India’s energy system is largely based on the use of coal for power generation and industry, oil for transport, and bioenergy for residential heating and cooking. Bioenergy and coal are mostly sourced nationally, while oil and natural gas are mainly imported (IEA 2020b). Because of the different structure of India’s economy compared with most other OECD countries, the relative contributions of its sectors to CO2 emissions also differ. The most important difference is that the building
(residential) and transport sectors have a much smaller share in total CO2
emissions than in other OECD countries (Figure 2.1). Also, more than half of India’s CO2 emissions are currently from power generation and more than a quarter from
industry. Given the dominance of power and industry in CO2 emissions, this report
focuses on these two sectors.
2.1 Power generation
India’s power generation capacity has expanded rapidly in recent years: between 2010 and 2018, it more than doubled to almost 400 GW. In terms of installed capacity per capita, however, it is still very low. China, a country with about the same population as India, has an installed capacity of about 1,800 GW. However, the strong increase in power generation capacity is expected to continue, although the way in which this happens is changing (Figure 2.2). Until 2016, most capacity additions were from coal-fired power plants; this has however been overtaken by solar PV. Also, capacity additions from natural gas have hardly increased since 2010, and in fact halted from 2015 onwards. Wind energy capacity has shown a steady increase, with 2 GW to 4 GW added each year since 2010, and overtook gas capacity in 2017. Solar PV is expected to overtake gas capacity in the next one or two years.
The fast development of solar and wind is largely driven by the declining cost of these technologies. Levelised costs of electricity (LCOE), calculated as the required tariff to meet the equity rate of return, is a generally accepted method to compare the costs of different technologies. The LCOE of Solar PV in India decreased by more than 50%, between 2013 and 2019, and that of onshore wind decreased by more than 40%, between 2010 and 2019 (IRENA 2020a). Ground-mounted PV and onshore wind already have the lowest LCOE in India and this is projected to
improve further in the future (Figure 2.3). Pithead coal, nuclear and small hydro have slightly higher LCOEs, and projections show an increasing LCOE for coal. Rooftop PV still has the highest LCOE, but this is projected to change very soon due to decreasing costs of solar PV and increasing costs of bioenergy, natural gas and non-pithead coal.
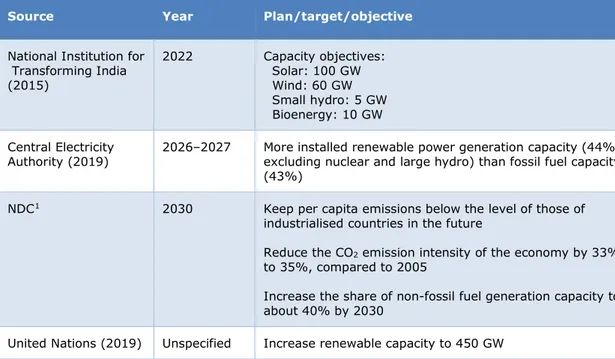
To further promote renewable energy, India has concrete targets for its renewable capacity for 2022 (Table 2.1). Achieving these targets will require a fast scaling up of additional capacity, especially for solar power. In 2017 and 2018, about 10 GW of solar PV was added each year. To achieve the 2022 target, this will need to increase to 18 GW annually on average. For wind, 6 GW of capacity needs to be added annually – compared to an average of 3 GW in the past years. One policy to increase renewable capacity is the KUSUM scheme, which aims to replace 26 GW of diesel-powered agricultural pumps with solar pumps. Furthermore, the second phase of the Grid Connected Rooftop Solar programme aims to achieve 40 GW of rooftop PV by 2022 through central financial assistance for residential units and welfare associations (UNEP 2019).
After 2023, the strong increase in renewable capacity will have to continue to achieve the plan of India’s government to have more installed renewable power generation capacity than fossil fuel capacity and a total share of non-fossil fuel capacity of 57% by 2027 (Central Electricity Authority 2019). This is far more ambitious than the target of increasing the share of non-fossil fuel capacity to about 40% by 2030, as communicated in India’s NDC.
Table 2.1 Plans and objectives relevant for renewable energy in India
Source Year Plan/target/objective
National Institution for Transforming India (2015) 2022 Capacity objectives: Solar: 100 GW Wind: 60 GW Small hydro: 5 GW Bioenergy: 10 GW Central Electricity
Authority (2019) 2026–2027 More installed renewable power generation capacity (44%, excluding nuclear and large hydro) than fossil fuel capacity (43%)
NDC1 2030 Keep per capita emissions below the level of those of
industrialised countries in the future
Reduce the CO2 emission intensity of the economy by 33%
to 35%, compared to 2005
Increase the share of non-fossil fuel generation capacity to about 40% by 2030
United Nations (2019) Unspecified Increase renewable capacity to 450 GW
It should be noted that the power generation mix differs substantially from the electricity capacity mix. In 2017, 14% of the total power capacity consisted of solar and wind, but only 5% of power was generated by solar and wind (Figure 2.4). About 75% of all electricity was generated by coal, which has a 60% share in the total generation capacity. The reason for this is that solar and wind are highly intermittent and therefore have a lower load factor. The remainder of this report focuses on capacities as: i) these determine the investment needs, and ii) the targets for renewable electricity are expressed in capacities.
2.2 Industry
The energy mix of the industry sector is dominated by coal (Figure 2.5). The use of coal, oil, natural gas and electricity all increased by 15 to 18 megatonnes of oil equivalent (Mtoe) between 2010 and 2018, although the share of coal in the total energy mix declined, from 47% to 41% in the same period. Coal use in industry seems to have stabilised after a strong increase between 2012 and 2014, while oil use has increased more strongly since 2014. The use of natural gas has increased steadily over the years, but its share is still lower than that of all the other energy carriers.
There are no specific targets for India related to industrial energy use or emissions, although there are major programmes – as part of the National Mission on
Enhanced Energy Efficiency – that focus on improving energy efficiency in industry and business sectors (IEA 2020b). These programmes include a perform, achieve and trade (PAT) scheme. The PAT scheme is a domestic cap-and-trade mechanism in which plants are assigned an energy consumption target. If a plant beats its target over the three-year compliance period, it can issue certificates that can be traded. In the first cycle of the PAT scheme (2012–2015), 8.67 Mtoe was saved and 31 MtCO2 was avoided (UNEP 2019). The total energy savings target for cycles two,
three and four is 19 Mtoe. The fifth cycle of PAT was notified in 2019 and will continue to improve energy efficiency, as it applies to almost 40% of India’s industrial energy demand.
3 Scenario results
Several organisations and companies have developed below 2 °C and well below 1.5 °C scenario studies for India’s energy future, mostly in the context of the global energy transition. For the purpose of this study, we analysed fifteen 2 °C and nine 1.5 °C scenarios, presented in the Annex. We specifically looked at what these scenarios show in terms of total and sectoral CO2 emissions, change in power
generation capacities, and fuel mix for industry. The medians and ranges of all scenarios for which data are available are provided. The energy transition scenarios Sustainable Development of the IEA and Transforming Energy of IRENA are
highlighted, as these are often referred to in policy discussions. Looking separately at these two scenarios, we can analyse whether they are in line with a broader range of scenarios. Before presenting the results, Section 3.1 provides context to the scenarios, which is important for interpreting the results.
3.1 Context
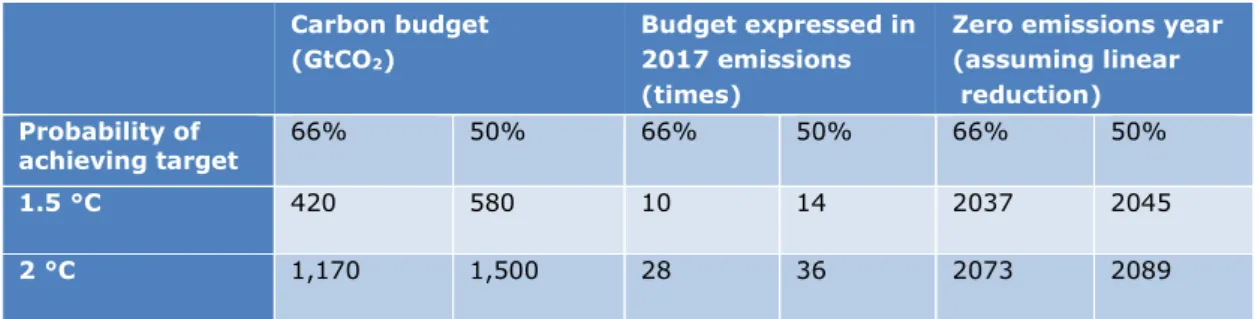
Based on the IPCC Special Report (IPCC, 2018), cumulative global CO2 emissions
from 2018 onwards must be limited to 420 GtCO2 to keep the global temperature
change below 1.5 °C and to 1,170 GtCO2 to keep it below 2 °C, both with a likely
(>66%) probability of achieving the targets. These global ‘carbon budgets’ can be determined based on the strong linear relationship between long-term temperature change and cumulative CO2 emissions. Given that current emissions are about
40 GtCO2, the world needs to be carbon neutral by around 2040 to achieve the
1.5 °C target and by around 2070 to achieve the 2 °C target, both with a 66% likelihood of achieving the target (Table 3.1). Carbon neutrality could be somewhat delayed if large-scale carbon dioxide removal technologies are implemented after achieving carbon neutrality.
Table 3.1 Global carbon budgets from 2018
Carbon budget (GtCO2)
Budget expressed in 2017 emissions (times)
Zero emissions year (assuming linear reduction) Probability of achieving target 66% 50% 66% 50% 66% 50% 1.5 °C 420 580 10 14 2037 2045 2 °C 1,170 1,500 28 36 2073 2089
Source: Based on IPCC (2018)
Given these global carbon budgets, the question remains which share of the budget countries are entitled to – or, in other words, what the ‘fair’ contributions of
countries to mitigating greenhouse gas emissions are (van den Berg et al. 2019). This relates to one of the key principles of the UNFCCC, Common But Differentiated Responsibilities (CBDR). This principle states that, while all countries have a shared obligation to mitigate climate change, developed countries that have contributed more to climate change and that have greater means to take mitigation measures have a higher responsibility to act. Indeed, average per capita emissions of most
developing countries, including India, are and always have been well below global average per capita emissions. Effort-sharing approaches that allocate carbon budgets to countries can help to derive ‘fair’ budgets. Often-used approaches to determine country-level budgets include equal (cumulative) per capita emissions and ability to pay (van den Berg et al. 2019). Many scenario studies, however, determine regional CO2 emission reductions based on minimising global costs:
reductions take place wherever it is cheapest to do so. Most of the scenarios included in this report are based on this principle, but it is important to remember that this does not imply that the costs of achieving these reductions have to be paid by the country itself. This is especially relevant as scenarios based on global cost minimisation generally lead to higher costs as share of GDP for developing countries (van den Berg et al. 2019).
3.2 CO
2emissions
After China and the United States, India has the highest CO2 emissions of all
countries in the world. However, per capita emissions are far below the global average. This is reflected in the scenarios, where large population and economic growth leads to slightly increasing CO2 emissions in India up to 2030, even in most
2 °C scenarios (Figure 3.1). The IEA’s Sustainable Development scenario and IRENA’s Transforming Energy scenario both show an increase in CO2 emissions of
about 15%, between 2017 and 2030. This increase is much lower than the
projected 60% to 65% increase under current and planned policies. By 2040, most 2 °C scenarios show lower emission levels than 2030 and 2017 levels.
The 1.5 °C scenarios show significantly lower emission levels, with – on average – 2030 emission levels 20% below 2017 levels and 2040 levels 60% lower than 2017 levels. The wide range in 2030 and 2040 emission levels in the scenarios, especially for 2 °C scenarios, captures the uncertainty in the mitigation potential of countries relative to each other.
The Indian government is committed to keeping its per capita emissions below the level of those of industrialised countries as part of its NDC, which it submitted in October 2015. India has also pledged to reduce the emission intensity of the economy by between 33% and 35% by 2030, measured against the level in 2005. In all the scenarios analysed, as well as in most scenarios on current and planned policies, India’s per capita CO2 emissions stay well below the global average and
the emission intensity of the economy is reduced by more than 35%. This is again an indication that current policies go beyond the targets stated in India’s NDC, something which is confirmed in several other studies (UNEP 2019). Current and stated policies are projected to lead to much higher CO2 emissions than the 2 °C
Only a few scenarios report sectoral emission trends. The 2 °C scenarios that do so show especially large reductions for power generation (Figure 3.2). Shell’s Sky scenario is an exception, consistent with an earlier PBL study that showed that mitigation action in Shell’s Sky scenario is delayed relative to most other existing 2 °C scenarios (Dagnachew et al. 2019). While this reduces the effort in the short term, it also implies that much more effort is needed in the longer term, with a strong dependence on CO2 removal technologies such as bioenergy combined with
carbon capture and storage.
For industry, most scenarios show increasing emissions, but these increases are much smaller than projected under current and planned policies. It is therefore evident that additional policies are needed to achieve the reductions in power generation and industry. For transport and buildings, the differences in CO2
emissions between current and planned policy scenarios and mitigation scenarios are smaller.
3.3 Power generation capacity
Total power generation capacity increases strongly in all the scenarios analysed (Figure 3.3). On average, the 2 °C scenarios show approximately a doubling of total capacity between 2017 and 2030, and a tripling between 2017 and 2040, while the 1.5 °C scenarios show slightly lower additions – mainly due to higher efficiency improvements in end use. This increase reflects increasing electrification rates and population growth, as well as increased demand due to expected economic growth. The IEA’s Sustainable Development scenario and IRENA’s Transforming Energy scenario both show a relatively stronger increase in power generation capacity, compared to other scenarios. This increase is even stronger than the projected increase under current and planned policies. The explanation may be that, unlike most other mitigation scenarios, these scenarios also target full energy access in addition to climate objectives.
The majority of capacity additions consist of solar and wind power, which contribute on average about 150 GW each by 2030 and 300 GW each by 2040 (with a large uncertainty range, especially for solar power, Figure 3.4). Hardly any coal capacity is added, and the capacity addition of natural gas is also limited in almost all scenarios. The numbers for 2030 are broadly in line with India’s National Electricity Plan, which aims for 275 GW of total renewable capacity by 2027. In all scenarios, the NDC target of 40% non-fossil generation capacity is achieved; on average, the share of non-fossil power generation (including large hydro and nuclear) is more than 60%, compared to 30% in 2017. The 40% non-fossil target can therefore be regarded as being less ambitious than existing 2 °C and 1.5 °C scenarios, and also less ambitious than national policies.
The IEA’s Sustainable Development scenario and IRENA’s Transforming Energy scenario both show relatively high capacity additions of solar PV. This could be explained by the fact that their current and planned policy scenarios already show large solar capacity additions (more, in fact, than the average of all 2 °C
scenarios). IRENA’s Transforming Energy scenario shows a relatively fast phase-out of coal and natural gas, compared to the other mitigation scenarios.
In some of the Paris-aligned mitigation pathways, coal-fired power plants are closed before the end of their lifetime. According to Vishwanathan and Garg (2020), coal-fired power plants older than 20 years will be closed before the end of their lifetime in the deeper mitigation pathways – although not all studies show this (Figure 3.4). In all scenarios, the large increase in renewable capacities has to be complemented with grid improvements and energy storage to handle higher shares of variable renewable energy. According to one study, this will require average annual
investments in the order of USD 270 billion between 2015 and 2030, compared to USD 120 billion in an NDC scenario (Vishwanathan and Garg 2020). Most of these investments would be in solar power and storage systems.
3.4 Industry
As shown in Figure 2.5, the energy mix of India’s industry is dominated by coal, which accounts for 40% of the energy use. Electricity accounts for another 20%, oil and bioenergy both 14%, and natural gas has the smallest share with 12%. Only a few scenarios report specifically on industry. Those that do show quite diverse futures in terms of total energy use and mix (Figure 3.5).
In the scenarios by the IEA and especially the European Commission, the total energy demand from industry increases less than in the other scenarios (the 1.5 °C scenario of the European Commission even shows declining energy demand
between 2017 and 2040). These scenarios assume strong improvements in energy efficiency, allowing a less rapid increase in industrial coal use. The Shell Sky
scenario shows a strong increase in coal and electricity use until 2030. This again can be explained by the delayed climate action in the Shell Sky scenario. IRENA’s Transforming Energy scenario also shows a strong increase in energy use by industry. Power contributes the most to this increase, in this scenario.
Overall, the picture is rather mixed, especially for natural gas. The key uncertainty seems to be the trend in total energy demand, which depends on the growth in energy-intensive manufacturing and on the degree to which energy efficiency can be improved.
4 Conclusions
Due to India’s rapid economic and population growth, the demand for energy is expected to increase strongly: between 2017 and 2030, the change in total power generation capacity is projected to increase by about 200 GW to 550 GW,
compared to the current capacity of about 400 GW. While COVID-19 will have a considerable impact on energy use in 2020, current projections show that, from 2021 onwards, energy use will continue to increase strongly.
In 2017 and 2018, more solar capacity was added than coal capacity for power generation. However, achieving India’s renewable targets for 2022 will require a significant increase in capacity additions of both solar and wind compared to current trends.
Based on projected costs of power generation technologies, the largest increase in generation capacity in existing 2 °C and 1.5 °C scenarios for India is in solar and wind power. The average capacity addition of each of these technologies is about 150 GW between 2017 and 2030. The capacity additions of other technologies are much smaller, with natural gas showing about 50 GW capacity addition and hydro, nuclear and bioenergy combined also 50 GW capacity addition.
The smaller role for gas in power generation in Paris-aligned pathways is consistent with current trends, which show no increase in total gas capacity from 2015
onwards, and India’s National Electricity Plan, which shows hardly any increase in gas capacity due to uncertainty in gas availability.
Due to the strong increase in electricity demand, coal-fired generation capacity does not decline in Paris-aligned pathways in the coming decade. Most scenarios do however show an absolute decline in coal capacity between 2017 and 2040,
especially in the 1.5 °C scenarios.
India made a commitment to increase India’s renewable generation capacity to 450 GW at the 2019 UN Climate Summit in New York. The average non-fossil power generation capacity in the analysed 2 °C and 1.5 °C scenarios just exceeds 450 GW by 2030, implying that India’s target is in line with existing 2 °C scenarios. The NDC target of 40% non-fossil power generation capacity by 2030 is less ambitious than national policy ambitions, and the 2 °C and 1.5 °C scenarios also show much higher shares of non-fossil power generation capacities by 2030.
The largest uncertainty seems to be developments in industry. While all 2 °C and 1.5 °C scenarios show an increase in the use of electricity and bioenergy, the picture for coal, gas and oil is mixed and strongly depends on developments in total energy demand. If the growth in industry energy demand can be limited, as in the scenarios by the European Commission, natural gas use could be stabilised at current levels. Otherwise, the scenarios show an increase in natural gas and coal use in the coming decade.
Given the above observations in current trends, ambitions and scenarios, the opportunities for cooperation with India could focus on: i) assisting the transition
from coal-fired power plants, for instance by combining policies to reduce the lifespan of India’s coal-fired power plants with developing a strategy to rehabilitate communities dependent on the coal sector (UNEP 2019); ii) increasing onshore wind and solar PV (both ground-mounted and rooftop); and iii) promoting energy efficiency in industry. India has also mentioned the need for international
assistance on these topics: India’s NDC, for instance, describes the need for
technology transfer, low-cost international finance and international architecture for the quick diffusion of cutting-edge climate technology in India and for joint
collaborative R&D for such future technologies.
Due to challenges with regard to access to energy and budget restraints, a good energy transition strategy should also consider the socio-economic context. This is especially important for livelihoods that currently depend on the coal sector, as mentioned above. With regard to stimulating renewable energy, policies could emphasise and subsidise the dissemination of small-scale renewable systems to poorer households that have a higher need for affordable energy.
References
Ahluwalia M, Gupta H and Stern N. (2016). A More Sustainable Energy Strategy for India. ICRIER.
Central Electricity Authority (2019). National Electricity Plan (Volume II Transmission). New Delhi, Government of India, Ministry of Power.
Dagnachew AG, Hof AF, Lucas PL and Van Vuuren DP. (2019). Insight into Energy Scenarios: A comparison of key transition indicators of 2 °C scenarios. The Hague, PBL report 3686.
European Commission (2018). A Clean Planet for all A European strategic long-term vision for a prosperous, modern, competitive and climate neutral economy, Brussels, European Commission.
IEA (2019a). Global Energy & CO2 Status Report: The latest trends in energy and
emission in 2018. International Energy Agency.
IEA (2019b). World Energy Outlook 2019. International Energy Agency.
IEA (2020a) IEA Atlas of Energy. http://energyatlas.iea.org/, Retrieved: May 14, 2020
IEA (2020b). India 2020: Energy Policy Review. International Energy Agency. IMF (2020). World Economic Outlook, April 2020: The Great Lockdown.
International Monetary Fund.
IPCC (2018). Global warming of 1.5 °C: An IPCC Special Report on the impacts of global warming of 1.5 °C above pre-industrial levels and related global
greenhouse gas emission pathways, in the context of strengthening the global response to the threat of climate change, sustainable development, and efforts to eradicate poverty. The Intergovernmental Panel on Climate Change.
IRENA (2020a). Renewable Power Generation Costs in 2019. International Renewable Energy Agency, Abu Dhabi.
IRENA (2020b). Global Renewables Outlook: Energy transformation 2050.
International Renewable Energy Agency, Abu Dhabi.t <susan@naturalenglish.nl>
National Institution for Transforming India (2015). Report of the Expert Group on 175 GW RE by 2022. Government of India, New Delhi.
Olivier JGJ and Peters JAHW. (2019). Trends in global CO2 and total greenhouse gas emissions: 2019 report. PBL Netherlands Environmental Assessment Agency, The Hague.
Pachouri R, Spencer T and Renjith G. (2019). Exploring Electricity Supply-Mix Scenarios to 2030. TERI.
Shell (2018). Shell Scenarios: Sky - Meeting The Goals Of The Paris Agreement. Shell International B.V.
Shukla P, Dhar S, Pathak M, Mahadevia D and Garg A. (2015). Pathways to deep decarbonization in India. SDSN - IDDRI.
United Nations (2019). Report of the Secretary-General on the 2019 Climate Action Summit - The Way Forward in 2020.
UNEP (2019). Emissions Gap Report 2019. United Nations Environment Programme, Nairobi.
Van den Berg NJ, Van Soest HL, Hof AF, Den Elzen MGJ, Van Vuuren DP, Chen W, Drouet L, Emmerling J, Fujimori S, Höhne N, Köberle AC, McCollum D, Schaeffer R, Shekhar S, Vishwanathan SS, Vrontisi Z, Blok K (2019). Implications of various effort-sharing approaches for national carbon budgets and emission pathways. Climatic Change.
Vishwanathan SS and Garg A. (2020). Energy system transformation to meet NDC, 2 °C, and well-below 2 °C targets for India. Climatic Change.
Annex
Table A1 List of scenarios covered in this study
Source Reported scenario name
Scenario description Limiting global temperature increase to CD-LINKS project
https://data.ene.iiasa.ac.at/cd-links/
NPi2020_400 National Policies until 2020, as of 2020 staying within 400 GtCO₂ budget globally between 2011 and 2100. Scenarios from nine models included (AIM, AIM/Enduse, COPPE-COFFEE, DNE21+, IMAGE, MESSAGE-GLOBIOM, POLES, WITCH, India-MARKAL)
<1.5 °C with 66% probability
NPi2020_1000 National Policies until 2020, as of 2020 staying within 1,000 GtCO₂ budget globally between 2011 and 2100. Scenarios from nine different models included (same models as for NPi2020_400)
<2.0 °C with 66% probability
IEA (2019b) Sustainable Development Scenario (SD)
Integrated approach to achieving internationally-agreed objectives on climate change, air quality and universal access to modern energy
<1.8 °C with 66% probability <1.65 °C with 50% probability
Shukla et al. (2015) Sustainable CO2 mitigation actions are
back-casted from the national sustainability goals set at the end-time horizon (2050). The assessment is restricted to the CO2 emissions from fossil
energy use in India
National scenario only
European Commission (2018) 2 °C Average of five different scenarios, considers strong improvement in energy efficiency and developments of renewable energy, as well as improvements in transport system efficiency
<2.0 °C with 66% probability
1.5 °C Average of two scenarios, one
aims to further increase the contribution of all the technology options and relies more heavily on BECCS, the other assumes a drive by EU business and consumption patterns towards a more circular economy <1.5 °C with 50% probability IRENA (2020b) Transforming Energy Scenario (TES)
An ambitious energy transfor-mation pathway based largely on renewable energy sources and steadily improved energy
Well below 2 °C with 66% probability
efficiency (though not limited exclusively to these
technologies).
Shell (2018) Sky Unprecedented and sustained collaboration across all sectors of society, supported by highly effective government policy
<2 °C with 85% probability
Pachouri et al. (2019) High RE Scenario (HRES)
Only electricity; no coal power addition after the completion of the under-construction pipeline in 2022; a higher growth of renewable energy – mainly in solar and wind – after 2022
National scenario only
Ahluwalia et al. (2016) Low Carbon (LC) scenario
Strong action to mitigate GHG emissions, promote energy efficiency and shift to cleaner energy sources