RIVM letter report 2020-0217 T.P. Traas et al.
Colophon
© RIVM 2021Parts of this publication may be reproduced, provided acknowledgement is given to the: National Institute for Public Health and the Environment, and the title and year of publication are cited.
DOI 10.21945/RIVM-2020-0217 T.P. Traas (author), RIVM P.G.P.C. Zweers (author), RIVM J.T.K. Quik (author), RIVM S.L. Waaijers (author), RIVM J.P.A. Lijzen (author), RIVM Contact:
Johannes Lijzen RIVM-DMG
johannes.lijzen@rivm.nl
This research was performed by order, and for the account, of the Ministry of Infrastructure and Water Management, the Department of Sustainable Living Environment and Circular Economy, within the framework of the project ‘Resources and Recycling’.
Published by:
National Institute for Public Health and the Environment, RIVM
P.O. Box 1 | 3720 BA Bilthoven The Netherlands
Synopsis
Towards sustainable recycling
A method for comparing the safety and sustainability of the processing of residual flows
One of the main elements of the European Green Deal is the Circular Economy Action Plan. An important component of this plan is to landfill or incinerate less waste and to reuse or recycle it as much as possible. However, this must be done in a manner that is safe for humans and the environment. RIVM is proposing a method for comparing the safety and sustainability of different ways of processing waste materials. By using such methods, policymakers and waste processors can make well-considered choices with regard to new forms of waste processing. The method consists of six steps. In these steps, consideration is given to the risk of hazardous substances that may be present and the
environmental benefit of the waste processing. The substances involved include Substances of Concern (SoC; or ZZS in Dutch) and can be extended to pathogens, residues of medicines, and pesticides. Step 1 collects information about the hazardous substances present. Step 2 looks at the options available for processing the waste. Step 3 checks whether the concentrations of the substances do not exceed limit values. If that is the case, then a risk analysis is carried out in Step 4 to determine whether humans, or the environment, can be exposed to the substance during the further processing and use. Step 5 calculates the quantity of energy (and associated CO2) that is saved and to what degree land use would be affected if the material were to be recycled. The last step compares the various options with one other.
RIVM provides recommendations for improvements and additions to this proposal. The method has already been worked out in more detail with regard to the risks presented by SoC; the other associated risks related to other SoC have also already been taken into account. For this
purpose, the databases containing information on the components of products and materials, and on environmental footprints, also need to be updated and expanded. To make this feasible, further testing and development with European partners from the waste processing chain and policymakers is recommended.
Keywords: safety, recycling, circularity, sustainability, Substances of Concern, SoC, risk assessment, Waste Framework Directive
Publiekssamenvatting
Naar duurzame recycling
Methodiek voor het vergelijken van veiligheid en duurzaamheid van de verwerking van reststromen
De Europese Green Deal is bedoeld om Europa klimaatneutraal te maken in 2050. Een belangrijk onderdeel is minder afval storten of verbranden, en het zo veel mogelijk hergebruiken of recyclen. Dat moet wel veilig zijn voor mens en milieu. Het RIVM stelt een methode voor om te kijken hoe veilig en duurzaam verschillende vormen om afval te verwerken zijn. Door de resultaten te vergelijken kunnen beleidsmakers en afvalverwerkers goed doordachte keuzes maken over nieuwe vormen van afvalverwerking.
De methode bestaat uit zes stappen. Daarin wordt gekeken naar het risico van eventueel aanwezige schadelijke stoffen en de winst van de afvalverwerking voor het milieu. Het gaat om Zeer Zorgwekkende Stoffen (ZZS), maar ook om ziekteverwekkers, resten van medicijnen en bestrijdingsmiddelen.
Stap 1 verzamelt informatie over aanwezige schadelijke stoffen. Stap 2 bekijkt welke mogelijkheden er zijn om het afval te verwerken. Stap 3 controleert of de stoffen niet boven de gestelde maximale concentraties uitkomen. Als dat wel zo is, wordt in stap 4 met een risicoanalyse
bepaald of mensen of het milieu aan de stof kunnen worden blootgesteld tijdens de verdere verwerking en gebruik. Stap 5 geeft aan hoeveel energie (en daarmee CO2) het bespaart en in welke mate landgebruik vermindert als het materiaal wordt gerecycled. De laatste stap vergelijkt de mogelijkheden met elkaar.
Het RIVM geeft aanbevelingen voor verbeteringen en aanvulling op deze eerste uitwerking. De methode is nu uitgewerkt voor de risico’s van ZZS, maar in de opzet is al rekening gehouden met andere genoemde risico’s. Ook moeten hiervoor de databases met informatie over de bestanddelen van producten en materialen en voor
duurzaamheidsberekeningen worden uitgebreid. Om dit praktisch mogelijk te maken, is het gewenst de methode verder te testen en ontwikkelen met Europese partners uit de afvalketen en beleidsmakers. Kernwoorden: recycling, veiligheid, duurzaamheid, zorgwekkende
Contents
Summary — 9
1 Introduction — 11
1.1 European context — 11 1.2 Goals and scope — 11 1.3 Substances of Concern — 12
2 Main elements of the methodology — 15
2.1 Closing material loops — 15
2.2 Risk and sustainability analysis — 17
3 Risk and Sustainability Analysis — 19
3.1 Step 1: Information on Substances of Concern — 19 3.2 Step 2: Information on waste treatment options — 21 3.3 Step 3: ZZS threshold assessment — 22
3.4 Step 4: Risk analysis — 24
Step 2.1 Are limit values applicable to the ZZS, given the foreseen use and are these limit values met? — 24
Step 2.2 Are the ZZS fixed in the material matrix (i.e. is there limited exposure throughout the life cycle)? — 25
Step 2.3 Will the ZZS-containing material be traceable so that the ZZS can be removed at a later stage? — 27
3.5 Step 5 Sustainability and Circularity Analysis — 28 Sustainability analysis — 28
Circularity analysis — 30
3.6 Step 6 Comparison of treatment options — 32
4 Examples — 35
4.1 HBCDD in expanded polystyrene boards — 35 Scenario — 35
Information on SoC and waste treatment options (Steps 1 and 2). — 36 Threshold values for SoC (Steps 3 and 4) — 36
Sustainability and circularity (Steps 5 and 6) — 38 Conclusions — 39
4.2 Rubber granules used as infill material — 39 Scenario — 40
Information on SoC and waste treatment options Steps 1 and 2). — 41 SoC (Figure 2.2: Steps 3 and 4) — 42
Sustainability (Steps 5 and 6) — 43
4.3 Overall conclusions for both examples — 45
5 Discussion and recommendations — 47
5.1 Positive environmental performance of recycling — 47 5.2 Facilitating information exchange in waste streams — 49
5.3 Supply chain cooperation to achieve sustainable non-toxic cycles — 50 5.4 Towards more generic approaches — 50
5.5 Conclusions and recommendations — 51
Summary
One of the main elements of the European Green Deal (Commission 2019) is the Circular Economy Action Plan. This action plan aims to support actors in circular value chains and regulator to save valuable resources, thus contributing to a reduced climate impact. The ambition of Europe’s Chemicals Strategy for Sustainability is also to move towards toxic-free material cycles where Substances of Concern (SoC) are minimised in products and recycled materials. To support these various ambitions, it is important that valuable resources are kept safely in the loop and that the negative impacts caused by hazardous
chemicals in recyclates are prevented. To help actors in supply chains to make informed choices on the safety and sustainability of different waste treatment scenarios, it is important that potential trade-offs are made visible. We propose easy-to-apply methods to facilitate this. These methods can be further developed leading to an integrated assessment of sustainability benefits on the one hand (such as effects on climate change and land use), and human and environmental health impacts on the other hand. Such an assessment framework should also help
recyclers and regulators to define criteria and boundary conditions for safe and sustainable recycling.
In this report we present an assessment framework, which is based on experience gained from the current practice of dealing with SoC in existing waste streams; this framework is intended to be generally applicable to assess options for waste treatment and recycling. Six steps are described which, depending on the outcome, can be repeated. In Step 1 information on SoC is collected and, in Step 2, available waste treatment options are identified. In Step 3 the SoC contents are assessed and compared to known thresholds. If the SoC are above thresholds, a risk analysis is carried out in Step 4 to determine if the SoC could lead to human or environmental exposure and risks during further processing and use, including the next use phase. In Step 5 a sustainability analysis specifies what could be gained by the reduced use of primary materials, the CO2-emissions which are prevented and the reduced (impact on) land use. In Step 6 the positive and negative impacts of different options for waste treatment and further use are compared, in order to draw conclusions on the preferred options. Two case studies are then explored to demonstrate the results of the assessment method described here: HBCDD in expanded polystyrene boards and rubber granules infill for use on synthetic turf fields. The case studies demonstrate that the risk analysis is very case dependent. In complex cases such as the ELT case, no definitive conclusion could be drawn in regard to the lower tiers. Data availability on the SoC content in recycled materials is critical, because lack of data will often lead to an inconclusive assessment of the lower tiers of the SSML.
The case studies also demonstrate that the benefit of the contribution towards a circular economy can be weighted in recycling options. The example of HBCDD in secondary EPS illustrates that sustainability gains strengthen the conclusion to favour recycling; measures for potential improvements can also be identified.
To develop the proposed methodology further towards a general framework, several improvements are recommended to enable some methodological and practical hindrances to be overcome. First, the sustainability and safety assessments should be elaborated. From a lifecycle perspective, appropriate circularity indicators and simple sustainability assessment methods should be further developed. In addition to SoC, the scope could be widened to include biological risks and other contaminations, like pharmaceuticals and pesticides, if relevant to the case. Multiple substance risk assessment should also be taken into account.
Secondly, databases (e.g. SCIP-database, sectoral waste treatment plans) are very important for the assessments and should be extended to fit data requirements needed for an integral approach. When
thresholds and safety levels in materials or products are missing, these should be derived to make the methodology easy to apply for screening purposes.
Thirdly, participation and cooperation within the supply chain is essential to apply and improve the proposed methodology and to share the
essential data. Part of this cooperation should involve the application of this presented methodology in more case studies in order to strengthen the methodology, learn how to improve information exchange, extend supply chain responsibility and to map value chain and sector-specific sustainability hotspots.
1
Introduction
1.1 European context
One of the main elements of the European Green Deal (European Commission, 2019) is the new Circular Economy Action Plan for a Cleaner and More Competitive Europe (European Commission, 2020b). In this new Action Plan initiatives along the entire life cycle of products have been announced, which aim to ensure that the resources used are kept in the EU economy for as long as possible. It targets, for example, their design, promoting circular economy processes, fostering
sustainable consumption. The new Action Plan also stimulates circularity in production processes, focussing on specific product value chains. In an earlier communication on the ‘interface between chemical, product and waste legislation’ ((European Commission, 2018b), the Commission also identified several problems encountered with the objective to close material loops. Ultimately, products should be safe and sustainable-by-design and, after the use phase(s), these products should be processed into safe and sustainable recycled materials and products. Because Europe wants to move towards toxic-free material cycles, the use of Substances of Concern (SoC) should be minimised in products and recycled materials (European Commission, 2020a). Legacy substances that are no longer allowed in new products may, however, seriously hamper recycling. For the recycling of existing waste streams with legacy substances or other SoC, the European Commission mentions that an overall positive environmental and climate performance should be ensured (European Commission, 2020a). This report presents a method about how this could be achieved for SoC in waste streams. The ambition to recycle as much as possible may conflict with the aim to prevent adverse environmental or health impacts if the presence of SoC is not recognised, assessed and properly managed within a circular economy. In 2016, in its conclusions on the first action plan ‘Closing the Loop’, the Council of the European Union was already calling upon the Commission to develop, in cooperation with the Member States, ‘a
methodology to determine whether recycling, recovery or disposal provides the best overall outcome to achieve both non-toxic material cycles and increased recycling rates, while respecting the existing high level of protection of human health and the environment and taking into account the precautionary principle’ (Council of the EU, 2016). In the
recent chemicals strategy for sustainability (European Commission, 2020a), the Commission stated its ambition to develop methodologies for chemical risk assessment that take into account the whole life cycle of substances, materials and products.
1.2 Goals and scope
To enable the safe and sustainable recycling of waste streams it is important to obtain insight into the safety and sustainability of various recycling options. The goal of this report is to outline a methodology that allows for a comparison of various waste treatment options which integrates safety and sustainability aspects. The comparison of
be prevented or mitigated, while still ensuring an overall positive environmental performance from a life-cycle perspective. The
methodology can contribute to the goals of a circular economy as well as protect environmental and human health by facilitating the making of informed decisions.
This report focusses on the downstream part of product or material life cycles, including the extended use and recycling of materials. Important questions are: how safe are various waste treatment methods with regard to SoC and other hazards in the recycled materials and products made thereof, and what is the sustainability benefit of the various alternative waste treatment methods compared to the linear production (discarded materials and consumption of virgin resources). The use of recycled material should try to maximise the sustainability benefits with regard to climate change and overall environmental impact, while avoiding the adverse impacts of SoC and other impacts on
environmental or human health. This is how ‘overall positive environmental and climate performance’ is defined in this report. In this report we present an assessment framework called ‘Safe and Sustainable Material Loops’ (SSML, (Quik et al., 2019). This framework is based on experience gained in the current practice of dealing with SoC in existing waste streams, and is meant to be generally applicable to assess waste treatment and recycling in terms of safety and
sustainability.
The quality of secondary materials is influenced by the presence of SoC, but also other factors such as the presence of pathogens, antibiotics, pharmaceuticals etc. The methodology also includes these factors, but in this report we focus on the safety related to SoC. This should help
regulators to define boundary conditions for safe and sustainable recycling.
1.3 Substances of Concern
Various categories of chemicals that are ubiquitous in man-made
materials and products such as stabilisers, pigments, softeners or flame retardants, may be present in different consumer or industrial waste streams (Bodar et al., 2018). Reuse and recycling become challenging when substances, materials and products contain hazardous substances such as Substances of Very High Concern (SVHC) according to
Regulation (EC) 1907/2006 (REACH), persistent organic pollutants (POPs) according to the Stockholm Convention, or other SoC. In fact, apart from SVHC and POPs, waste may also contain a legacy of other substances that can cause secondary materials to be unsafe, such as various heavy metals, pharmaceutical residues and pathogens. This category of SoC as introduced in the Commission working document (European Commission, 2018a) has not yet been defined.
In this report we focus on a category of SoC that has specific regulatory attention in the Netherlands as a specific list of SoC: ZZS (abbreviation of ‘zeer zorgwekkende stoffen’). These ZZS have the characteristics of SVHC, and include compounds which are not on the EU lists. The presence of such ZZS (and other compounds or hazards) can be a hindrance to a circular economy and can lead to problems if new
products or recycled materials still containing ZZS are not safe to use (‘regrettable recycling’). Therefore the risk of adverse environmental or human-health impacts and the benefits of a more sustainable use of resources should be analysed together.
From a full life cycle perspective it should be ensured that recycling technologies have an overall positive environmental and climate performance. An assessment method should make the sustainability benefits of recycling transparent and make clear that the risks presented by SoC to humans and the environment are controlled (or low). This should lead to a comparison of options for recycling, reducing
concentrations and risks of SoC, improve the quality of the regained materials and thereby optimise sustainability benefits.
The main elements of the framework will be outlined in Chapter 2. Chapter 3 details the main steps for a first tier assessment. Chapter 4 shows the application of the framework for the recycling of expanded polystyrene boards containing HBCDD and for the recycling of
granulated rubber tires (containing various SoC, e.g. polyaromatic hydrocarbons and zinc). Chapter 5 evaluates the merits of the framework and provides recommendations for further development.
2
Main elements of the methodology
This chapter outlines the six main elements of the proposed methodology for comparing various waste treatment and recycling options with regard to sustainability in general and the prevention of the human and environmental risks, and other adverse impacts, presented by SoC. We focus on the human and environmental risks of substances coming from the recycling process, in the second use phase and of future recycling and use.
First we define the scope of the methodology in relation to the life cycle of products and detail strategies for intervention when moving to a circular economy (Section 2.1). This is followed by an introduction of six consecutive steps of the methodology which can be repeated if needed (Section 2.2).
2.1 Closing material loops
The European Commission noted that a growing number of chemical substances are becoming subject to restrictions or prohibitions, because of health or environmental concerns (European Commission (2018a). SoC or ZZS (as defined in Section 3.1) will still be present in waste streams for the coming decades, and efficient methods are needed to assess the risks presented by SoC under various waste treatment scenarios, with the aim of achieving toxic-free material cycles. This also applies to other regulated substances and other potential risks (e.g. pathogens or radiation). During the transition to a circular economy, adverse effects of these hazards on human health and the environment caused by increased recycling and reuse of materials and products should be avoided. The goal is to ensure that risks of SoC are negligible, and if not, can be controlled by specific measures. If additional waste treatment is needed, this should be taken into account in the
sustainability assessment of the method to ensure an overall positive environmental and climate performance.
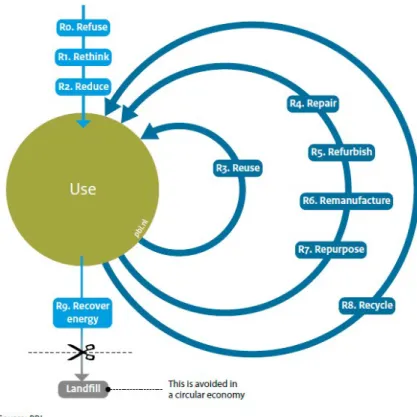
Different resource reduction strategies that can be followed may have an impact on SoC in waste streams ((Beekman et al., 2020). Smart use and design of products (R0-R2 in Figure 2.1) will slow down the rate at which SoC enter material cycles. A ‘Safe by Design’ approach can be followed, which means that known SoC are no longer used in production (European Commission, 2020b). However, dealing with safety (in
relation to the SoC) in recycling is necessary both now and in the future for a variety of reasons.
• Legacy: although SoC are prohibited or severely restricted on the market, they will still be present in products and waste streams. • Essential uses: SoC may still be needed because of a specific
functionality and replacement takes time due to technological and chemical challenges. For instance, SVHC under REACH can be authorised for use in specific spare parts for refurbishment or repair (strategies R3-R7 in Figure 2.1).
• Unknown SoC: the harmful effects of chemicals may become (better) known after a substance is introduced, as knowledge on
hazards and exposure increases, i.e. substances not yet suspected may become SoC at some point in time. • Changes in SoC use: because of jumps in innovation,
technological progress and societal change, changes in supply and demand for chemicals can strongly influence the production of SoC.
Figure 2.1 Classification of approaches to reduce primary material and resource use, from high (R0) to low (R9) reduction in resource use or contribution to the circular economy (Potting et al., 2018).
Various waste treatment scenarios (Strategy R8-R9 in Figure 2.1) are possible to ensure that a recovered stream containing a specific or several SoC, or other hazardous components, can still be used safely. For example, a waste stream can be used for all-purpose use, for specific uses, or cannot be re-used anymore. It is essential to define these treatment scenarios, including assumptions and the scope of the assessment. This should be based on knowledge of the life cycle of the regained materials and their uses, such that a targeted sustainability analysis can be performed. Finding data on both ZZS and sustainability elements of various waste treatment options can be time-consuming and an in-depth analysis may not always be needed to support
decisions. Thus a tiered workflow for the safe and sustainable material loops (SSML) framework was proposed (Quik et al., 2019). This means 'simple when possible, more thorough when necessary'. For each higher tier, more detailed information is required, but a tier is only useful if the previous tier does not provide a clear answer. The information
requirements for a tiered approach are based on the content of the SoC in the recovered materials, information on the foreseen and intended
uses, and the data to calculate the expected sustainability benefits of the alternative use options.
2.2 Risk and sustainability analysis
The methodology to compare safe and sustainable recycling options is shown in six steps for ease of presentation. Figure 2.2 outlines the stepwise assessment based on Zweers et al. (2018) and (Quik et al., 2019). The main goals of the methodology are to provide:
• Transparency in relation to the available information on chemical risks and sustainability benefits for the various waste treatment options.
• A simple method where possible (e.g. if SoC content in materials or environmental media is below relevant thresholds, no further analysis would be needed), and more detailed where needed. • A way to gather, analyse present and compare information on
the trade-offs of the various treatment options and associated uses and applications.
The six steps are described in more detail in Chapter 3. Depending on the outcome, several steps can be repeated, e.g. if more information needs to be collected or additional waste treatment options may need to be considered.
Figure 2.2 Stepwise assessment for the safe and sustainable waste treatment of existing and new product chains
1. Information on Substances of Concern (SoC)
The first step is to gather relevant information on the possible presence of single or multiple SoC in materials (or products) in order to determine whether the SoC content in a waste stream needs further risk analysis. Mixture toxicity has not yet been taken into account.
1. Information on SoC in
waste stream
2. Information on waste
treatment options
4. Risk analysis ZZS
3. ZZS threshold
assessment
6. Comparison of options
4. Sustainability analysis
2. Information on waste
treatment options
4. Risk analysis SoC
3. SoC threshold
assessment
2. Information on Waste treatment options
When the SoC content triggers further analysis, available treatment options will be identified. If a certain technique is commercially
available, then this is considered to be proof of technical and economic feasibility. All available waste treatment options can be taken into account at this stage.
3. Threshold assessment
If the SoC content of waste streams before treatment is below specific thresholds (see Section 3.2), no further analysis is usually needed. If the SoC content is above specific thresholds, the risk analysis is carried out. The heterogeneity of the waste stream can make the SoC-content difficult to determine. It might be easier to check whether thresholds are met after pre-treatment, as the material will be more homogenous then.
4. Risk analysis SoC
This step gives a general indication, for each of the relevant options of waste treatment, and further use as a secondary material, whether the presence of SoC could lead to human or environmental exposure and present risks during further processing and use, including the next waste stage. Steps 4 and 5 may need to be repeated when risk
reduction measures are taken, before it can be demonstrated that risks with respect to SoC content are adequately controlled.
5. Sustainability analysis
The sustainability analysis should specify, for each of the relevant options of waste treatment, and further use as a secondary material, what can be gained in terms of the reduced use of primary materials, the prevention of CO2 emissions, the reduced (impact of) land use, etc. This could also be done in parallel with Steps 3 and 4.
6. Comparison of options
The outcome of the analyses for each of the different options for waste treatment, and further use as a secondary material, will be compared in order to draw a conclusion on preferred options.
3
Risk and Sustainability Analysis
This chapter details each of the six steps of the methodology, and discusses possible choices regarding the scope of the assessment, criteria to use and sources of information.
3.1 Step 1: Information on Substances of Concern
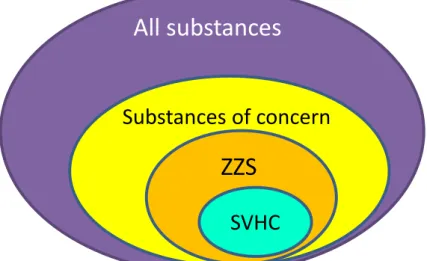
The first step is to gather relevant information on the SoC content of waste streams, recycled materials or products. The category of the SoC, as introduced in the Commission working document (European Commission, 2018a) has not yet been defined. The first focus on SoC in this report (Section 3.1 to 3.4) is on ZZS (‘zeer zorgwekkende stoffen’ in Dutch, translated as ‘substances of high concern’). The concept of ZZS is used in the Netherlands in a national context to connect international chemicals policy with regulations for industrial emissions. ZZS cover a much broader range than the current substances of very high concern (SVHC) under REACH (Figure 3.1), but only include substances which fulfil at least one of the hazard criteria of REACH Article 57:
• Carcinogenic category 1A or 1B according to Regulation 1272/2008/EC.
• Mutagenic category 1A or 1B according to Regulation 1272/2008/EC.
• Toxic for reproduction category 1A or 1B according to Regulation 1272/2008/EC.
• Persistent, Bioaccumulative and Toxic in accordance with the criteria set out in REACH Annex XIII.
• Very Persistent and Very Bioaccumulative in accordance with the criteria set out in REACH Annex XIII.
• Substances for which there is scientific evidence of probable serious effects on human health or the environment which give rise to an level of concern equivalent to the criteria listed above. RIVM has compiled a non-limitative list of these substances which is updated twice a year. Currently this ZZS list contains over 1,500 substances (Herwijnen, 2013; RIVM, 2018). Only a proportion of these substances is already regulated by specific chemical legislation. The ZZS list covers in particular:
• Substances on the Candidate list;1 these substances have been identified as Substances of Very High concern (SVHC) and are candidates for authorisation (REACH Annex XIV).
• Substances listed in Annex IV of the POP Regulation (EU) 2019/1021 (850/2004/EC was repealed).
• Priority Hazardous Substances according to the Water Framework Directive 2000/60/EC.
• The OSPAR list of substances for priority action.
The ZZS in this list can be categorised in different classes (e.g.
according to functionality, origin or chemical structure). The Dutch ZZS policy focuses on the minimisation of emissions from ZZS. This can be 1 SVHC-list: https://echa.europa.eu/nl/candidate-list-table
done by minimising or preventing emissions, or by substituting the ZZS with less harmful alternatives.
Other substances can also be of concern in addition to ZZS. For instance, for metals such as zinc or copper, environmental quality
standards have been set, and these metals can be relevant for assessing waste treatment options. However, they do not fulfil the criteria of REACH Article 57, are not listed in the above-mentioned substance lists, and have not yet been integrated in the methodology presented in this report. The same applies to other SoC which are not on the NL ZZS list, such as pharmaceutical residues and pathogens.
Figure 3.1 Illustration of the chemical subsets ‘Substances of Concern’ (SoC), ZZS as defined in the Netherlands (substances fulfilling criteria of REACH Article 57) and SVHC identified under REACH.
In Step 1, relevant information on the source, application and quality of a given waste or material stream is collected by addressing the following questions:
• Can ZZS be expected to occur, given the origin and functionality of the original material streams or products; e.g. heavy metals, plasticisers, stabilisers, flame retardants, pigments, pesticide residues, etc.?
• Can ZZS be expected as part of the material stream or products, e.g. components in mineral oils such as PAHs?
• Is it possible to distinguish and separate ZZS-containing streams from ZZS-free streams?
Chemical analysis or some form of monitoring may be required for certain streams that are expected to contain concentrations of ZZS (e.g. the flame retardant HBCDD in EPS foam), or in recovered materials that are used where human exposure needs to be excluded, e.g. consumer exposure (food packaging, cosmetics) or children’s toys. There is a difference between the analytical methods which are suitable for determining levels of ZZS in (homogenous) product streams and those that are used for sorting waste streams containing different levels of contamination(the exact concentration is less important when sorting).
SVHC
All substances
Substances of concern
If chemical analysis data are available, the following additional questions should be addressed:
• Are ZZS being measured in daily operations at industrial scale, and if so, how is the analysis done and what levels of ZZS are detected in this way?
• What are the typical concentrations for the expected ZZS? The analysis should preferably be done according to existing EU standards and methods.
The collection of information on the presence of ZZS in waste streams is under development (Wassenaar et al. (2017). In the context of
industrial emissions, an expert-judgement based tool called the ‘ZZS navigator’ has been developed in the Netherlands (RIVM, 2018). The tool screens for (potential) environmental releases of ZZS to water or air, based on the type of (industrial) activities and makes a distinction between use and emission. This could be extended to SoC in material streams and might also be useful on a European scale. Furthermore, in the context of the Netherlands’ National Waste Management Plan, an inventory was made of the ZZS that may be present in each type of waste identified in the plan (Hofstra, 2019).
Information can be found on presence of SVHC in articles2 on the ECHA website. In addition, as prescribed by the revised Waste Framework Directive 2008/98/EC, in January 2021 a database hosted by ECHA was made operational which contains notifications from suppliers of articles which have an SVHC content of above 0.1%. The SCIP database (ECHA, 2020) lists information on SVHC in articles and in complex objects (products). These databases should help to generate the data needed to be able to assess the recycling of waste stream. Whether this will be sufficient data to assess whether the recycling is safe is not yet clear.
3.2 Step 2: Information on waste treatment options
First of all, it is considered whether there are any technical methods for removing or separating SoC from the waste streams (see also Figure 3.3,Block 1.1) or separating the containing waste from the ZZS-free stream. If these methods are operational, the best available technique (BAT) is preferred if it is practically and logistically possible and sufficient processing capacity is available (Block 1.2). If all this is in the affirmative, these methods should be applied to reduce ZZS
concentrations as much as possible and at least below specific limit values before new materials are produced from the waste stream. If the ZZS can technically be removed but the operational capacity falls short, the feasibility of extending the capacity should be considered, to establish the economic feasibility (Block 1.3). If the available capacity is at a relatively large distance away from the source of the waste stream, entailing additional energy consumption and costs for transport,
investing in removal capacity which is nearer can be a solution. Similar considerations apply to incineration facilities.
More details on how the relevant considerations can be taken into
account in determining whether removal of ZZS is feasible, can be found in Zweers et al. (2018) and Quik et al. (2019).
In the EU, the Waste Framework Directive uses a hierarchy of waste treatment options, striving for the highest quality possible (Figures 1.1 and 2.1). New options for waste treatment, such as better fractionation (sorting) or chemical recycling, open up new possibilities for waste streams containing ZZS or SoC. Additional effort and energy is needed to recycle waste streams rather than use disposal options of hazardous waste (e/g/ incineration or landfilling), if that is possible from a risk perspective and is legally permitted. This should pay off in terms of a reduced impact on health and the environment. The available alternative treatment options, depending on the type of waste stream, should be compared in terms of safety and sustainability gains.
3.3 Step 3: ZZS threshold assessment
To determine whether a risk analysis is needed, the ZZS content of the recovered material intended for reuse (possibly after waste processing if it removes or reduces the ZZS content) should be compared to relevant limit values, Figure 3.2. A generic ZZS threshold has been proposed of 0.1% (by weight) (Zweers et al., 2018), based on the threshold in the REACH and CLP legislation. This level applies to the incoming waste stream and the recovered material. Heterogeneity of the waste stream can make it difficult to determine the SoC-content. The check to see if threshold limits are met might be easier after pre-treatment, because the material will be more homogenous. This generic threshold can be high in relation to risks depending on the substance and the use of materials. Therefore, lower limit values apply or can be used in specific cases:
• As specified in Annex VI of the CLP Regulation. • As specified in Annex IV of the POP Regulation.
• As prescribed by specific legislation for the foreseen new application(s), e.g. food contact materials, toys and cosmetics directives (Zweers et al., 2018).
The methodology was developed to assess whether waste treatment could be allowed via a permit, as is required in Netherlands, but the same principles for assessing risks are applicable to recycling. Given the terminology of Figure 3.2, the waste stream indicates the envisaged recyclate (the waste stream after processing).
The position in the product-chain is relevant and determines the waste criteria or product-criteria that apply. For intermediate products, for example, product criteria might already apply.
* Also the lower limit values for ZZS as specified in Annex VI of the CLP Regulation should be considered
** More stringent limit values may be applicable dependent on the envisaged use, Figure 3.2 Flow diagram to determine whether a risk analysis should be
performed in order to regulate the recovery of ZZS-containing waste streams or recovered materials (Zweers et al., 2018).
Preventing the unnecessary contamination of secondary materials by ZZS requires enhanced separated waste collection systems. Currently, ZZS-free and ZZS-containing waste streams become mixed e.g. by mechanical shredding. This means that ZZS contamination of specific materials become diluted in ‘post shredder’ streams. In this way, ZZS is contained in a larger volume waste stream at lower concentrations and, therefore, more difficult to extract. In addition, the produced secondary material may contain various ZZS (e.g. flame retardants, plasticisers, stabilisers, pigments etc.), which may limit its functionality and market value. On the other hand, efficiency may be a reason for separating waste streams after mixed collection. Optimal methods have to be selected, depending on the waste stream. This applies, for example, for
Is one of the following situations applicable?
• The ZZS in the waste stream is listed on Annex XIV of
REACH (authorisation list) and the envisaged use is not an article.
• The ZZS in The waste stream is listed on Annex XVII of
REACH (restriction) and for the envisaged use a restriction is applicable.
• The ZZS is a POP addressed by the POP Convention.
Is the concentration of the ZZS as such or in a mixture equal to or exceeding 0.1% (w/w) *,**
No
Perform a risk analysis
Yes
Is the risk acceptable?
The ZZS in the waste stream do not obstruct a permit
Yes
No risk analysis has to be performed. Other (Waste) Regulations are applicable.
No Yes
The envisaged application cannot be permitted
window screens when shredded in the automotive industry. If the ZZS-containing products can easily be recognised, separate waste collection should be carried out, for example PCB-containing transformers.
3.4 Step 4: Risk analysis
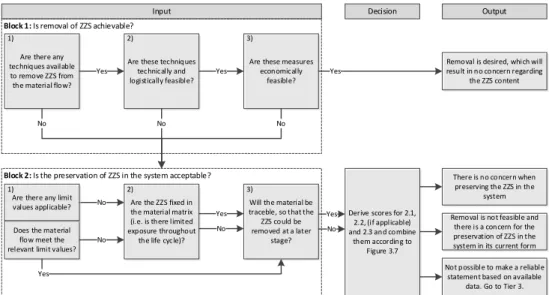
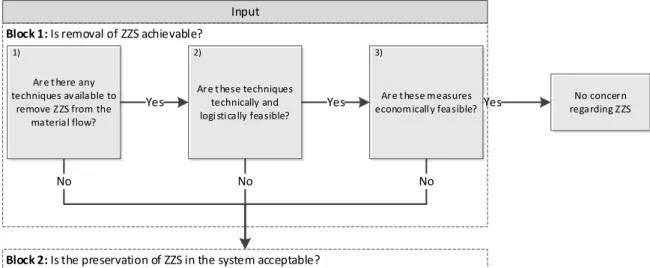
The risk analysis step is depicted schematically in Block 2 of Figure 3.3, and worked out below for the ZZS-list compiled by RIVM (Block 1 is already explained in Section 3.2 on the waste treatment options). The risk analysis in Block 2 is carried out when removal of ZZS is feasible. A comparable approach can be applied to other SoC. Risks are calculated for the alternative treatment options, but they can also be estimated for the baseline scenario. Both scenarios can be compared.
Figure 3.3 Schematic representation of the risk analysis (Zweers et al., 2018)3.
Block 2 is sub-divided in three sections concerning: ZZS content and limit values (2.1); fixation of ZZS in the material (2.2); and traceability of the ZZS-containing material during the life cycle (2.3). Scores for these three sections are expressed as traffic light colours (i.e. green, orange or red) and combined in order to obtain an overall outcome of the risk analysis (see below).
Step 2.1 Are limit values applicable to the ZZS, given the foreseen use and are these limit values met?
• At first all relevant limit values that apply to the ZZS in the material with respect to the intended use application(s) are gathered (Table 3.1. gives an overview of relevant chemical legislation corresponding with use applications).
• Assess if and which relevant ZZS limit values are exceeded. • Determine the consequences of exceeding the limit values.
Are there any techniques available to remove ZZS from the material flow?
Are these techniques technically and logistically feasible?
Yes Are these measures economically feasible? Yes
Does the material flow meet the relevant limit values?
Are the ZZS fixed in the material matrix (i.e. is there limited exposure throughout
the life cycle)?
No Will the material be traceble, so that the ZZS could be removed at a later
stage?
Derive scores for 2.1, 2.2, (if applicable) and 2.3 and combine
them according to Figure 3.7
Removal is desired, which will result in no concern regarding
the ZZS content
There is no concern when preserving the ZZS in the
system Removal is not feasible and
there is a concern for the preservation of ZZS in the system in its current form Not possible to make a reliable
statement based on available data. Go to Tier 3. Yes
Yes No
Yes
Input Decision Output
Block 1: Is removal of ZZS achievable?
Block 2: Is the preservation of ZZS in the system acceptable?
No No No
Are there any limit values applicable? No 1) 2) 3) 1) 2) 3) Yes No
When none of the relevant limit values are exceeded, Block 2.1 is scored ‘green’ and the analysis continues with Block 2.3. When no limit values are applicable to (or have been derived for) the ZZS, given its intended application, one should continue with Block 2.2. In that case, Block 2.1 will be scored ‘orange’, since it remains unclear whether the general concentration limit value of 0.1% (see Figure 3.2) is sufficiently protective. When a relevant limit value is exceeded, which results in a use restriction, Block 2.1 will be scored ‘red’. When a relevant limit value is exceeded that results in other, less restrictive measures (e.g. classification and labelling or notification), Block 2.1 will be scored ‘orange’. When the final score in Block 2.1 is ‘orange’ or ‘red’, one should continue with Block 2.2. The corresponding consequences of exceeding the limit value(s) will be taken into account when weighing all scores of Block 2.
Step 2.2 Are the ZZS fixed in the material matrix (i.e. is there limited exposure throughout the life cycle)?
With respect to Block 2.2 the potential exposure is established by addressing four questions:
1 Are the ZZS released during processing/recycling throughout the product life and at the end of the life phase? If the answer is yes or unknown Block 2.2 will be scored ‘red’. If the answer is no or limited, one should proceed with Question 2.
2 Is there a legislative framework for the intended application which provides migration or emission limits (e.g. food contact materials or construction materials)? If this is the case, the migration or emission should be analysed according to this legislation. If the ZZS migration/emissions meets the criteria laid down in the applicable legislation, Block 2.2 is scored ‘green’. Otherwise this block is scored ‘red’. If no migration or emission limits are applicable, one should proceed with Question 3. 3 Can existing measurement methods and criteria from adjacent
legislative frameworks be used for the intended application? If any migration or emission limits have been derived, whether these can be applied for the intended use applications should be considered. If ‘Yes’, go back to Question 2. If ‘No’, proceed with Question 4.
4 Can it be assumed that the ZZS can be released from the material? For example, by evaporation (in the case of volatile substances), weathering or decay of the material (e.g. in the case of rubber), or during the processing of the material. This question is more from a theoretical perspective compared to Question 1. If ‘No’, Block 2.2 will be scored ‘green’. If the conclusion is that the release is limited (in the range of limit values of adjacent legislative frameworks), block 2.2 will be scored ‘orange’. If ‘Yes’, Block 2.2 will be scored ‘red’.
Table 3.1 Overview of regulations containing concentration limit values or migration limit values relevant for ZZS.
Regulations Limit values Consequences
REACH restrictions4 Varying
(also <0.1%) Restriction in use REACH candidate list5 0.1% (for
PBT/vPvB/C/M substances) 0.3% (for R substances) With a number of possible exceptions (e.g. see Annex II)
Notification and communication (and upon release)
registration obligation
REACH authorisation
list (conform CLP)6 0.1% (for PBT/vPvB/C/M substances) 0.3% (for R substances) With a number of possible exceptions (e.g. see Annex II)
Authorisation must be applied for CLP7 0.1% (for PBT/vPvB/C/M substances) 0.3% (for R substances) With a number of possible exceptions (e.g. see Annex II)
Classification and labelling
POP regulation8 Varying
(also <0.1%) General restriction on production and placing on the market Food contact material
regulations9 Varying (also <0.1%) Restriction in use Toys Directive10 Varying
(also <0.1%) Restriction in use Cosmetics Directive11 Varying
(also <0.1%) Restriction in use RoSH Directive12 0.1 or 0.01% Restriction in use NL Fertiliser act13 Varying (expressed in
mg/kg fertilizing ingredient)
Restriction in use NL Soil Quality
Decree14 Varying (also <0.1%) Restriction in use 4 REACH restrictions
5 REACH candidate list 6 REACH authorisation list 7 CLP
8 POPs Regulation 2019 9 Food Contact Material Directive 10 Toys Directive
11 Cosmetics Directive 12 RoSH Directive 13 Fertilizer Act
Step 2.3 Will the ZZS-containing material be traceable so that the ZZS can be removed at a later stage?
To establish the score with respect to Step 2.3, two main questions have to be answered and three additional questions.
Main questions:
1. Is there a legally-required classification or labelling of the products/objects/materials made from the ZZS-containing
material? As a rule of thumb, classification and labelling based on hazardous properties meets this criterion, on the condition that it is relevant for the intended (new) application.
2. Is there a recovery system, so that it is ensured that the products/ objects made from the ZZS-containing material are returned to recyclers? As a rule of thumb, an isolated and recognised waste stream or the possibility for separation (mechanically or chemically) fulfils this criterion.
Additional questions:
1. Does the volume of the ZZS-containing material remain the same during its use in the intended application (i.e. there is no increase or decrease in volume during its lifetime)? If there is a decrease in stream volume (e.g. caused by (bio)degradation), the ZZS concentration could increase if the ZZS is not lost or degraded in that stream. If there is an increase in volume and this is caused by better waste treatment (not to dilute), then this can be considered acceptable. If it is the consequence of mixing waste then this is considered unacceptable.
2. Are the products/objects/materials produced from the ZZS-containing material exclusively used for industrial and/or professional applications (i.e. it is not intended for the general public = consumer use)? If the products or materials are used by the general public, it will be more difficult to trace sufficiently and properly manage ZZS-containing waste.
3. Is it possible to monitor the ZZS-containing products during the next life cycle and in the next waste phase? If the ZZS-containing products or waste cross the border, this is not the case. If the number of applications is limited or it concerns large-scale use the waste can be collected more effectively after use, the ZZS will be better traceable than if this is not the case.
If both essential questions are answered with ‘yes’, as well as one of the additional questions, Block 2.3 will be scored ‘green’. If one of the essential questions is answered with ‘yes’ and at least one of the
additional questions with ‘yes’, Block 2.3 will be scored ‘orange’. If both essential questions or all the additional questions are answered with a ‘no’, then Block 2.3 will be scored ‘red’.
If relevant limit values are not exceeded (see Block 2.1), but ZZS concentrations are less than a factor of 10 below the relevant
concentration limit values, the following scores will be applied for Block 2.3: A ‘red’ score is applied in the event of wide-dispersive use,
indicating that ZZS are still present in certain material cycles and are not traceable, e.g. in generic plastic packaging recyclate. A ‘green’ score is applied if there is no wide dispersive use.
If at least two of the aspects (2.1, 2.2 [if relevant], or 2.3) score ‘red’, this means that the risks are not adequately controlled. Therefore, the outcome will be: “Removal is not feasible and there is a concern for the continued presence of ZZS in the material system in its new
application”. If no ‘red’ scores are provided, and only ‘green’ or ‘green and orange’ scores are applicable, this means that the risks can be considered controlled. In this case the outcome will be: “There is no concern for the continued presence of ZZS in the system in its new application”. If one of the aspects scores ‘red’ or all aspects score ‘orange’, this indicates that the risks are not adequately controlled or that there are too many data gaps to exclude risks sufficiently. In this case the outcome of the risk analysis can either be: “Removal is not feasible and there is a concern for the continued use of ZZS in the material stream in its current form” or “Not possible to make a reliable assessment based on available data”.
In that case, one has to refine the risk analysis. One option is to retrieve more refined information on the fixation of the ZZS to the material (2.2) or its traceability (2.3) in order to demonstrate that safety is
guaranteed. The proposed method has been developed to take into consideration case-specific controlled conditions to prevent exposure. However, it is also possible to adapt the scope of the risk analysis by selecting other applications which have less critical limit values, for instance by excluding uses that lead to consumer exposure.
One can only proceed with Step 5, when the conclusion is that the risks for human health and the environment are considered sufficiently controlled.
3.5 Step 5 Sustainability and Circularity Analysis
Sustainability analysis
The premise for recycling is that it will reduce the use of virgin materials and thereby reduce environmental impact. In the sustainability analysis step this premise is tested and the degree of benefit is estimated in comparison to a baseline scenario. The analysis includes effects on the environment in the long run, such as climate change or loss in
ecosystem services.
The environmental impact will be estimated for the various disposal and recycling scenarios with a screening level assessment. This assessment provides an alternative to elaborate life cycle assessment studies, by focussing on differences in alternative recycling scenarios and efficient indicators of environmental impact. A full life cycle assessment would then only be needed in a higher-tier analysis.
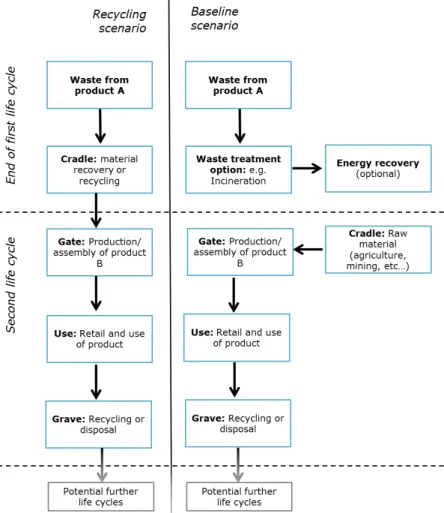
First of all, the key differences in the life cycle of a recycling scenario are identified, compared to the baseline ‘business as usual’ scenario (see Figure 3.4). This leads to a manageable data requirement.
For example, in the case of using End-Of-Life Tyre (ELT) granules as infill material in artificial football pitches (see Section 4.2), the
assessment is limited to the impact of the raw material that would be used instead of ELT granules and the impact of producing rubber granules from ELT. The other life cycle stages (use and end of life) are
similar in both scenarios and therefore do not need to be included in the assessment.
Second, practical indicators of environmental impact were found in energy and land use (Quik et al., 2019). Several key studies show that energy indicators and land use indicators together show a good
correlation with climate change and environmental impact (Huijbregts et al., 2010; Steinmann et al., 2016; Steinmann et al., 2017). These two indicators have a strong relationship with other impacts, such as air quality, eutrophication and biodiversity loss.
The energy indicators are calculated as the cumulative energy demand (CED) and the carbon footprint, assuming that the raw data is available for different materials, production processes, transport methods and energy sources. The total CED (MJ) and carbon footprint (CO2 eq.) per kg or ton of material recovered is calculated by summing up these different processes as part of the baseline scenario.
The land use indicators are expressed as the sum of the land surface area required to produce the materials for production of the product for the same functional unit.
Figure 3.4 Sustainability analysis based on comparing a recycling scenario to a baseline scenario. The material recycled or recovered (cradle) from waste from product A (Recycling scenario) is used to produce product B (gate). In the baseline scenario waste from product A is disposed and production of product B (gate) requires material from another origin.
Circularity analysis
Circularity means that recycled material replaces virgin material, and can be recycled again (multi-life cycle application) when it reaches the end of its service-life. These aspects are not covered by the
sustainability indicators introduced in the previous section, hence new indicators are introduced for circularity. The energy demand and land use calculations take into account any additional processing or raw materials needed in the various recycling scenarios.
First of all, an assessment of high potential benefit is made by assessing if the recycling option concerns an EU critical resource (European
Commission, 2017). Additionally, if the recycling option is intended to use a significant fraction of the market of the waste material, circularity needs to be assessed.
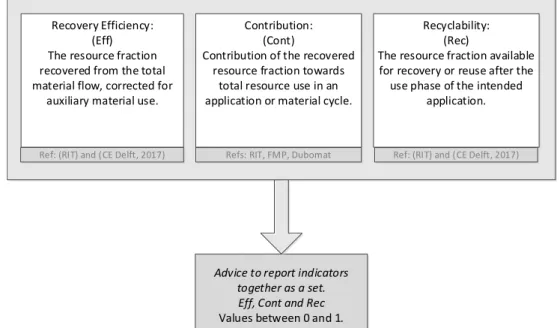
Figure 3.5 Scheme illustrating the assessment of circularity based on recovery efficiency (Eff), Contribution (Cont) and Recyclability (Rec).
The circularity assessment (Figure 3.5) is based on (i) the recovery efficiency, (ii) the contribution of the recovered resource to the total demand and (iii) the recyclability of the produced material or product, which is the fraction of the resource to potentially reach the next recycling step. The indicators are normalised to a score between 0 and 1. The assessment should be applied to the different scenarios of waste treatment, e.g. current practice and a (presumed) more circular
alternative. After comparing the two scenarios, the relative benefit can be estimated.
Recovery efficiency
The recovery efficiency (Eff) is based on the recovery of a material from a total residual material flow, e.g. clean polystyrene from building isolation material. Recovery inherently encounters some losses during processing, i.e. some material is not available for a subsequent material cycle. Furthermore, additional raw material might be required for recycling purposes, which may counteract the material circularity
Contribution: (Cont)
Contribution of the recovered resource fraction towards
total resource use in an application or material cycle. Recovery Efficiency:
(Eff) The resource fraction recovered from the total material flow, corrected for
auxiliary material use.
Ref: (RIT) and (CE Delft, 2017)
Advice to report indicators together as a set. Eff, Cont and Rec
Values between 0 and 1.
Recyclability: (Rec)
The resource fraction available for recovery or reuse after the
use phase of the intended application.
benefits. The indicator, therefore, corrects for auxiliary primary materials required for recycling purposes; calculation details can be found in Quik et al. (2019)).
This approach gives, for example, an 80% recovery efficiency for the recycling of old tyres to rubber granules (RecyBEM and ARN, 2011) caused by inherent losses. This process does not include any auxiliary materials as this is a purely mechanical process and thus Eff equals 0.8. For phosphate recovery from wastewater via struvite, about 23 to 47% of total P can be recovered. However, a significant amount of auxiliary materials are used to precipitate P in the struvite mineral. Thus the efficiency is even lower, resulting in Efficiency between 0.06 and 0.24 (Quik et al., 2019).
Contribution
This indicator (Cont) quantifies the contribution of the recovered
material towards the reduction of raw material use in an application. For instance, if worldwide all the phosphorus was recovered from
wastewater, it could still only replace part of the demand for
phosphorus. This means that other phosphorus sources are also needed. The contribution indicator is based on the fraction of the total of applied materials in the intended application or materials cycle that is
substituted by the recovered resource. This includes other materials required for the system to support the intended function. For example there are enough rubber granules from end of life tires (ELT) to fulfil the demand, but in previous years about 90% of synthetic turf used ELT granules as infill, e.g. Contribution equals 0.9.
Recyclability
The recyclability indicator (Rec) quantifies the potential for the
recovered resource to be recycled or reused again after the current use phase (see Figure 3.5). This consists of two measures:
1. The fraction of material available at the end of the current use phase, after subtracting the losses, e.g. caused by wear and tear. 2. The quality of the recovered materials in combination with its
current application compared to the source material. The quality factor is divided into three classes (CE Delft et al., 2017): a) The recovery of material at the same functional level as the
source of the material flow.
b) (Target) resource is recovered, but contaminated by non-target materials, or characteristics of the material have deteriorated to such a degree that it cannot again be used to fulfil a comparable function (e.g. rubber granules). This results in a lower-grade material.
c) Recovered material mixed with non-target materials in such a way that only long term application in another domain is possible, e.g. use as a substitute for building materials or filler material.
Weights given to these classes are 1, 0.5 and 0.25 respectively for each degree (CE Delft et al., 2017). Furthermore, it is advisable to use a quality classification factor of 0 when the material can no longer be used and is land filled or incinerated.
Overall score
Although the three indicators can be aggregated by calculating an average, or by multiplication, it is preferable to discuss them separately in order to pay attention to these individual aspects of circularity. If any of these indicators is low or 0, the loop is not closed. For example, if the recovery efficiency and recyclability are both high, but the material flow is very small compared to demand, the overall material flow for that material shows low circularity. If recyclability is low, the material loop is not closed because a lot of material is lost in the use phase. If recovery efficiency is low, a lot of material is wasted or ends up in another material loop.
3.6 Step 6 Comparison of treatment options
The last step of the assessment is a qualitative comparison based on the collected information, integrating the safety and sustainability aspects of the waste treatment options. Many factors influence this integral
assessment including socio-economic costs and benefits, technical feasibility, safety and sustainability. The goal of the qualitative
comparison is to help companies and policy makers to make informed decisions on the most favourable treatment options for specific cases. These waste treatment options can be compared, as shown in Figure 3.4.
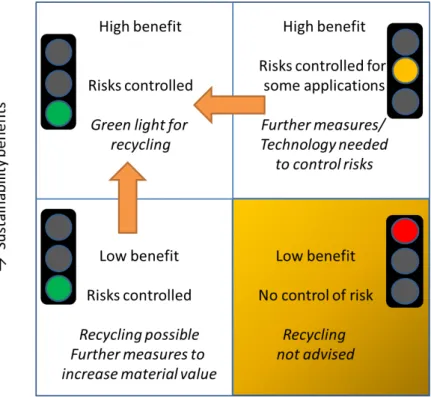
In Figure 3.6 the quadrant figure on safety and sustainability shows a generalised scheme for maximising the sustainability returns of recycling. The higher the expected sustainability benefits (in terms of reduced environmental and climate impact, the more resources are available (both technically and economically) for measures to prevent the potential negative effects of SoC. The overall goal of the assessment is to maximise the environmental and climate performance of the waste treatment and minimise risks presented by SoC.
We can distinguish four main situations of recycling of existing waste streams in Figure 3.6:
• Recycling may be advised against when health or environmental risks of SoC are expected, available technology cannot prevent those risks sufficiently, and sustainability benefits of the
envisaged recycling are relatively low (lower right corner). • If risks are insufficiently controlled but the sustainability benefit
is also substantial, it should be considered whether it’s technically and economically feasible to mitigate these risks (sufficient risk reduction), for example, by the removal of SoC (upper right corner). High sustainability benefits are a strong driver for technological innovation on SoC removal.
• When risks are controlled but recycling is hampered by the presence of SoC (caused by material quality loss and/or poor market acceptance), upstream or downstream methods should be considered for enhancing the quality together with enhancing the sustainability benefits of recycling (lower left corner). • In the ideal case, risks are negligible and the maximum benefit of
For waste streams containing SoC, options can be explored to improve the quality of the waste stream, such that the risks of SoC for all different waste treatment options (for recycling options, but also for a baseline scenario: incineration, landfilling or any other standard
practice) are controlled. At the same time, the required energy demands and contribution to circularity of the additional measures are assessed. By comparing this to a baseline scenario the overall sustainability benefit can then be reviewed. Treatment options leading to the lowest concentrations and controlled risks, together with the highest
sustainability benefit will be the preferred option.
Figure 3.6 Optimising recycling by increasing sustainability benefits while controlling and minimising risks for human health and the environment
4
Examples
This chapter presents two case studies to demonstrate the results of the assessment method described here: for HBCDD in expanded polystyrene boards and for rubber granules infill for use on synthetic turf. These case studies originate from Quik et al. (2019).
4.1 HBCDD in expanded polystyrene boards
Until 2015 the brominated flame-retardant HBCDD was commonly used in EPS foam boards applied for e.g. building isolation purposes. It is a substance of very high concern (SVHC) under the EU REACH Regulation and was listed as a persistent organic pollutant (POP) in 2015 under the UNEP Stockholm Convention. Because its content in EPS for isolation purposes is above the POP threshold of 0.01%, EPS containing HBCDD that is discarded as waste has to be destroyed or irreversibly
transformed. Incineration of the massive quantities of isolation-EPS that are being, and going to be, released (for the coming 50 to 100 years) from building renovation and demolition represents a challenge because of the sheer volume of the waste stream and the operational difficulties in incineration plants. As a solution to this problem, industry has
developed a recycling technique that extracts HBCDD from EPS called the PS Loop process, a process which recovers the EPS polymer leading to HBCDD-concentrations below 0.01%, while destroying the HBCDD and recovering bromine (Van Dijk and Reichenecker, 2019). This EPS is then sufficiently free of HBCDD.
Scenario
In the baseline scenario (right hand side Figure 4.1), energy is recovered from the incineration of EPS and additional virgin PS is required for the production of new EPS for use in the second life cycle. In the recycling scenario (left side Figure 4.1), energy is used for the processing of EPS using the PS loop process, which includes the
recovery of bromine. Further use in the second life cycle is assumed to be equal for both scenarios, hence ‘use’ and ‘grave’ life phases are crossed out in Figure 4.1. The carbon footprint of the recycling scenario is increased by the amount of energy otherwise recovered by
incineration in the baseline scenario, based on applying the ‘system expansion’ method (Finnveden, 1999). This also applies to the recovered Bromine and recycled EPS. For instance, the carbon footprint of the baseline scenario is increased by the carbon footprint of production of virgin PS.
Land use is considered relevant when a product or material in one of the considered scenarios comes from land-based mining, agriculture or forestry. This is not the case for bromine or virgin PS in this assessment.
Figure 4.1 Overview of EPS recycling and the baseline incineration scenario (Quik et al, 2019). Information on SoC and waste treatment options (Figure 2.2: Steps 1 and 2). Crossed boxes mean that this part of the life cycle can be ignored as they are the same in both scenarios.
Information on SoC and waste treatment options (Steps 1 and 2).
General information on the HBCDD content in EPS is available from UNEP. EPS used in the building sector contains HBCDD in percentages of 0.8 to 2.5% (UNEP, 2011). Occasionally, HBCDD has been used in EPS for consumer products, such as beanbags and for packaging material. Information on the recycling option studied here is primarily taken from publications of the PolyStyrene Loop project.
Threshold values for SoC (Steps 3 and 4)
Under the Stockholm Convention 2004 and, as indicated in the revised POP-regulation,15 HBCDD is restricted to levels below 100 mg/kg
(0.01%) in materials, mixtures or objects. This threshold triggers specific obligations for the destruction of HBCDD. In this case it means that HBCDD needs to be removed from the EPS stream with regular HBCDD levels to allow for recycling. This follows the approach detailed in
Block 1 of the risk analysis step (Section 3.4, Figure 4.2) and covers the rationale for allowing this scenario under the Basel Convention16 which
indicates which treatments are allowed.
Figure 4.2 Basic setup of Tier 2 of the SoC risk analysis module (ZZS is the abbreviation for the SoC list of RIVM [figure adapted from Zweers et al., 2018]).
Risk Analysis, Block 1: Is removal of SoC feasible?
The risk analysis of the SSML framework, starting with Block 1 (Figure 4.1), leads to the following considerations.
1.) Are there any methods available for removing SoC from the
material flow?
The HBCDD content can adequately be removed by the PS Loop method, which results in recovery of the EPS polymer and of bromine. This process meets the threshold of HBCDD in EPS. Applying this method results in an HBCDD concentration in recovered polymer of below 100 mg/kg (0.01%), which is
considered acceptable for reuse. The answer to question 1 is thus ‘yes’.
2.) Are these measures technically feasible?
Test data on the PS Loop technique - applied on lab and pilot plant scale - are documented in the scientific literature. These data show that the resulting EPS has HBCDD levels below the set 100 mg/kg (Tange et al., 2016). However, this has not yet been tested in a larger scale treatment plant, but is planned for 2021 when the plant becomes operational. The answer to Question 2 in Block 1 is thus ‘yes’, with some residual uncertainty related to the upscaling of the method.
3.) Is the removal of SoC economically feasible?
The economic feasibility of the PS Loop process depends on the energy and transport costs involved, the market prices of virgin EPS and bromine, and demand for the service. With regard to the decision to build a commercial-scale PS Loop plant in the
Netherlands (expected to be operational in 2021), the industry considers the process economically viable. The answer to
16www.basel.int
Are there any techniques available to
remove ZZS from the material flow?
Are these techniques technically and logistically feasible?
Yes Yes economically feasible?Are these measures Yes regarding ZZSNo concern Input
Block 1: Is removal of ZZS achievable?
Block 2: Is the preservation of ZZS in the system acceptable?
No No No