a) RIVM, Bilthoven
b) Alterra, Wageningen
*) Corresponding author. E-mail a.tiktak@rivm.nl
RIVM report 716601008/2004
The GeoPEARL model
Part II. User guide and model description update A. Tiktaka,*, A.M.A. van der Lindena, J.J.T.I. Boestenb, R. Kruijneb and D. van Kraalingenb
This investigation has been performed by order and for the account of the Ministry of Spatial-planning, Housing and the Environment within the framework of project M/716601, ‘Pesticide Fate in the Environment’. The Al-terra contribution has been performed by order and for the account of the Ministry of Agriculture, Nature and Food Quality within the framework of research program 416 ‘Pesticides and the Environment’.
Het rapport in het kort
Nederland heeft sinds kort een nieuwe beslisboom om het risico van uitspoeling van bestrij-dingsmiddelen naar het grondwater te kunnen beoordelen. In deze beslisboom wordt beoor-deeld of de concentratie van bestrijdingsmiddelen in het grondwater de EU drinkwaternorm van 0,1 µg/L zal overschrijden. De nieuwe beslisboom houdt expliciet rekening met het op-pervlak waarop het middel wordt toegepast. Een middel kan uitsluitend worden toegelaten indien de concentratie in het grondwater over een lange periode lager is dan 0,1 µg/L, onder tenminste 90% van het oppervlak waarop het middel zal worden verbruikt. Om dit criterium te kunnen toetsen is het model GeoPEARL ontwikkeld. Dit model zal een centrale rol gaan spelen in het nieuwe toelatingsbeleid. Dit rapport bevat een handleiding van het model, met nadruk op de nieuwe registratieprocedure. Het rapport dient te worden gebruikt in combinatie met rapport 601450019, dat de nieuwe beslisboom beschrijft.
Trefwoorden: bestrijdingsmiddelen; registratie; uitspoeling; modellering; GeoPEARL;
Abstract
Recently, the Netherlands has adopted a new decision tree for evaluating the leaching poten-tial of pesticides, specifically to see if the concentration in groundwater exceeds the EU drink-ing-water limit of 0.1 µg/L. The spatial criterion in the new decision tree states that the long-term average concentration of a pesticide or its relevant metabolites should not exceed the drinking-water limit for at least 90% of the surface area where the pesticide is potentially used. A spatially distributed model, ‘GeoPEARL’, has been developed to scientifically test the above criterion. GeoPEARL will play a key role in the new Dutch decision tree. The aim of this report is to provide a guideline on the use of GeoPEARL, with special emphasis on the Dutch registration procedure. This report should be used in combination with RIVM report no. 601450019, which describes the new decision tree and the role of GeoPEARL in this tree. Background information, including the theory behind the model, can be found in the earlier RIVM report, no. 716601007.
Preface
Pesticide behavior in soils and leaching to the groundwater has widespread attention of the Dutch Ministries of VROM (Ministry of Spatial planning, Housing and the Environment) and LNV (Ministry of Agriculture, Nature and Food Quality). For this reason, they commissioned RIVM and Alterra to develop methods and tools to be used in the evaluation of pesticide reg-istration and to assess the overall environmental quality with respect to pesticides. Since 1987, RIVM and Alterra have co-operated in several projects to serve the goals of the minis-tries with regard to pesticide policy. Particularly in the field of pesticide leaching this long-term co-operation has led to products that are not only used for the Dutch registration proce-dure, but in international context as well.
GeoPEARL, the tool described in this report, will play a central role in the new Dutch deci-sion tree for evaluating the leaching behavior of pesticides in the Dutch registration proce-dure. During the periode 2002-2003, beta versions of GeoPEARL were presented to stake-holders in the field of pesticide registration. Discussions with stakestake-holders have triggered some model modifications. Also, the PEARL team has developed the GeoPEARL User Inter-face, which gives easy access to data and model. With the release of this model version, GeoPEARL becomes accessible to a broad public.
GeoPEARL makes use of results obtained in related projects. The spatial schematisation was created within the framework of the STONE project, a co-operation of Alterra, RIZA and RIVM. The PEARL team acknowledges the participants to the stakeholder meetings for stimulating discussions and suggestions for improvements. The group consisted of the follow-ing individuals (alphabetical order):
− André Bannink, VEWIN − Adi Cornelese, CTB − Dominique Crijns, VROM
− Gerhard Görlitz, Bayer Cropscience − Her de Heer, LNV
− Peter Leeuwangh, Ecotox − Minze Leistra, Alterra − Jan Linders, RIVM − Marianne Mul, UvW − Jo Ottenheim, LTO − Werner Pol, CTB − Leo Puijker, KIWA − Jan de Rijk, VROM − Wim Stegeman, DuPont − Paul Sweeney, Syngenta
− Jan Renger van de Veen, BASF − Anja Verschoor, RIVM
Contents
Samenvatting 11
Summary 13
1 Introduction 15
2 User’s guide of the GeoPEARL User Interface 17
2.1 Database structure 18
2.2 Installation of the GeoPEARL User Interface 19 2.3 Getting started with the GeoPEARL User Interface 20
2.4 The projects form 22
2.5 The main screen 22
2.6 Editing substances 23
2.7 Editing application schemes 30
2.8 Composing an assessment with the Assessment Wizard 31
2.9 Checking assessment definitions 32
2.10 Running the model 32
2.11 Reports showing the target variable for registration 33
2.12 Viewing maps and graphs 34
2.13 Archiving your assessment 37
2.14 Directory structure for the GeoPEARL User Interface 37
2.15 Using another database 38
3 User’s guide of the command-line version of GeoPEARL 39
3.1 Performing an assessment with the stand-alone version 39
3.2 File structure 40
3.3 Creating an assessment with multiple assessment items 40
3.4 Adding and editing substances 41
3.5 Adding and editing application schemes 44
3.6 Editing the control file 46
3.7 Running the model 50
3.8 Output files 51
3.9 The percentiles program 55
3.10 Further output processing 57
3.11 Using GeoPEARL on a grid 58
4 Procedure for plot selection 61
4.1 Methodology 61 4.2 Results 62 5 Theory 65 5.1 Hydrology 65 5.2 Heat flow 69 5.3 Pesticide fate 70 References 81
Samenvatting
Nederland heeft sinds 1988 gebruik gemaakt van een beslisboom om het risico van uitspoe-ling naar het grondwater te kunnen beoordelen. Door recente ontwikkeuitspoe-lingen op EU-niveau was het noodzakelijk om deze beslisboom te herzien om de afstemming met de EU optimaal te houden. Uitgangspunt is het EU-standpunt dat het grondwater bescherming behoeft. De EU-invulling van deze bescherming geeft aan dat de concentraties van individuele werkzame stoffen en relevante metabolieten in het grondwater niet hoger mogen zijn dan 0,1 µg/L. Om te kunnen functioneren in een beslisboom is echter een meer operationele en toetsbare norm nodig. De nieuwe beslisboom geeft als operationeel criterium dat de concentratie in het grondwater over een lange periode (20 jaar) lager moet zijn dan 0,1 µg/L, onder tenminste 90% van het oppervlak waarop de stof wordt gebruikt.
De nieuwe beslisboom bevat dus, in tegenstelling tot de vroegere procedure, een expliciet ruimtelijk criterium. Om dit criterium wetenschappelijk te kunnen toetsen is een ruimtelijk verdeeld uitspoelingsmodel, GeoPEARL, ontwikkeld. GeoPEARL berekent de uitspoeling van een stof specifiek voor het toedieningsareaal van de stof.
Dit rapport bevat een handleiding van het model, waarbij de nadruk ligt op toepassing in het kader van de nieuwe Nederlandse registratieprocedure. Dit rapport dient gebruikt te worden in combinatie met RIVM rapport 601450019, waarin zowel de nieuwe beslisboom als de rol van GeoPEARL in deze beslisboom, beschreven worden. Achtergrondinformatie over het model zelf, inclusief de theorie, zijn te vinden in een eerder verschenen RIVM rapport, namelijk rap-port 716601007.
GeoPEARL bestaat uit verschillende componenten, waaronder het rekenhart (de ‘kernel’) en een grafische gebruikersinterface (GUI). Het model kan zowel met als zonder GUI worden gebruikt; het rapport beschrijft beide mogelijkheden.
Het eerste deel van het rapport beschrijft stap voor stap hoe het model via de GUI dient te worden gebruikt. De GUI is zodanig opgezet dat standaardtoepassingen ten behoeve van de toelatingsprocedure gemakkelijk kunnen worden uitgevoerd. De GUI geeft toegang tot de benodigde data, genereert invoerbestanden voor het rekenhart, voert de berekeningen uit en genereert rapporten en kaarten. De gegenereerde kaarten en rapporten kunnen direct gebruikt worden in een toelatingsdossier. De meeste gebruikers zullen het model via de GUI benade-ren.
Het tweede deel van het rapport gaat in op het gebruik van de het model zonder de GUI. Ge-bruik van het model zonder GUI biedt een aantal extra mogelijkheden. Zo is het mogelijk een andere ruimtelijke schematisatie in te voeren en is toepassing van het model op een grid mo-gelijk. Toepassingen zonder de GUI vergen echter meer kennis van de gebruiker. Deze versie is daarom uitsluitend geschikt voor gebruikers die vertrouwd zijn met toepassing van com-plexe numerieke modellen.
Summary
Recently, the Netherlands have adopted a new decision tree for the evaluation of the leaching potential of pesticides. In this decision tree, it is evaluated whether the concentration in groundwater exceeds the EU drinking water limit, which is 0.1 µg/L. The new decision tree contains a spatial criterion: the long-term average concentration of a pesticide or its relevant metabolites should not exceed the drinking water limit across at least 90% of the area of use of the pesticide. To scientifically test the above spatial criterion, a spatially distributed pesti-cide leaching model, referred to as ‘GeoPEARL’, has been developed. GeoPEARL calculates the leaching of a pesticide and its metabolites to the uppermost groundwater for the area of use. The most important result for the Dutch pesticide registration procedure is the 90th areal percentile of the median leaching concentration over a period of 20 years. This report gives a guidance on the use of GeoPEARL, with special emphasis on the Dutch registration proce-dure. It should be used in combination with RIVM report 601450019, which describes the new decision tree and the role of GeoPEARL in this new decision tree. Background informa-tion on GeoPEARL, including theory, can be found in the earlier RIVM report 716601007. GeoPEARL consists of a computation kernel and a Graphical User Interface. The model can be used with or without the Graphical User Interface. The manual describes both routes. For standard applications, both model versions will give the same results.
The first part of the manual gives a stepwise description of the Graphical User Interface. The Graphical User Interface is set-up to facilitate the Dutch registration procedure; summary re-ports generated by the Graphical User Interface can directly be used in a registration dossier. The GUI gives easy access to the most important components of GeoPEARL, like the genera-tion of input files, model execugenera-tion, output processing and generagenera-tion of reports and maps. For most modelers, this part of the manual will be sufficient.
The second part of the manual describes how the model can be used without the graphical user interface. When the model is applied in this way, the user will have more possibilities. It is for example possible to import a different spatial schematisation or run the model on a grid. The command-line version, however, is also more difficult to use. This version should there-fore only be used by those modelers that are familiar with complex numerical simulation models.
1
Introduction
Recently, the Netherlands have adopted a new decision tree for the evaluation of the leaching potential of pesticides. In this decision tree, it is evaluated whether the concentration in groundwater exceeds the EU drinking water limit, which is 0.1 µg/L. The new decision tree contains a spatial criterion: the long-term average concentration of a pesticide or its relevant metabolites should not exceed the drinking water limit across at least 90% of the area of use of the pesticide. To scientifically test the above spatial criterion, a spatially distributed pesti-cide leaching model, referred to as ‘GeoPEARL’, has been developed. GeoPEARL calculates the leaching of a pesticide and its metabolites to the uppermost groundwater for the area of use. The most important result for the Dutch pesticide registration procedure is the 90th areal
percentile of the median leaching concentration over a period of 20 years. Further background information on the new decision tree on leaching can be found in RIVM report 601450019 (Van der Linden et al., 2004).
This report contains a user-manual of GeoPEARL 1.1.1., with special emphasis on the Dutch registration procedure. Background information on GeoPEARL, including the theory, can be found in the earlier RIVM report 716601007 (Tiktak et al., 2003). In some parts of this document, reference is also made to the manual of FOCUS PEARL 1.1.1. (Tiktak et al., 2000). This pertains particularly to the guidance on the derivation of pesticide properties. It is therefore essential that both documents are available. All documents are available at the RIVM website (http://www.rivm.nl) and the PEARL website (http://www.pearl.alterra.nl). The manual consists of two parts. In section 2, the Graphical User Interface is described. The Graphical User Interface gives easy access to the most important components of GeoPEARL, like the generation of input files, model execution, output processing and generation of the most important output maps and tables. Most users will use the GUI version of GeoPEARL only.
Section 3 contains a description of the command line version of GeoPEARL. The command line version of GeoPEARL is more flexible, but is also more difficult to use. Reasons to use the command line version of GeoPEARL may be:
− implementation of GeoPEARL on a grid computing system;
− import of a different spatial schematization, so that the model can be used for other coun-tries.
The command-line version of GeoPEARL should only be used by experienced modelers. In contrast to the GUI version, the user can change all model inputs and this can more easily give rise to errors.
Background documentation to be used in combination with the manual
1. The FOCUS PEARL Manual: Tiktak, A., F. van den Berg, J.J.T.I Boesten, M. Leistra, A.M.A. van der Linden and D. van Kraalingen. 2000. Pesticide Emission Assessment at Regional and Local Scales: User Manual of FOCUS PEARL version 1.1.1. RIVM report 711401008, RIVM, Bilthoven, the Netherlands.
2. The GeoPEARL background document: Tiktak, A., A.M.A. van der Linden and J.J.T.I. Boesten. 2003. The GeoPEARL model. Model description, applications and manual. RIVM report 716601007, RIVM, Bilthoven, the Netherlands.
3. Scientific publication on GeoPEARL: Tiktak, A., D.S. de Nie, A.M.A. van der Linden and R. Krui-jne. 2002. Modelling the leaching and drainage of pesticides in the Netherlands: The GeoPEARL model. Agronomie (22):373-387.
4. The new decision tree on leaching: Van der Linden, A.M.A., J.J.T.I. Boesten, A.A. Cornelese, R. Kruijne, M. Leistra, J.B.H.J. Linders, J.W. Pol, A. Tiktak and A.J. Verschoor. 2004. New decision tree for the evaluation of pesticide leaching from soil. RIVM report 601450019, RIVM, Bilthoven, the Netherlands.
2
User’s guide of the GeoPEARL User Interface
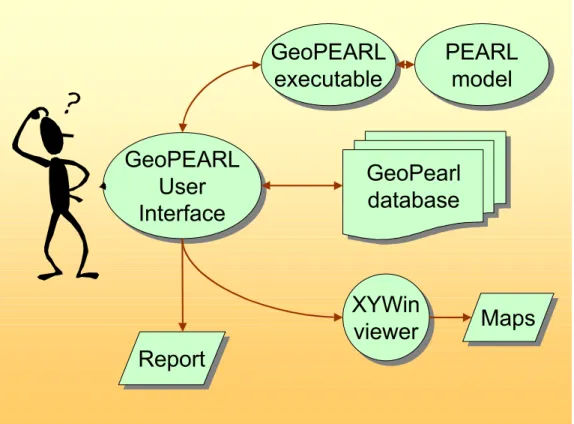
This chapter gives an overview of the GeoPEARL user interface, which is an integrated envi-ronment for data storage and data retrieval, model control and viewing the output data (Fig-ure 1). The user communicates with the GeoPEARL modeling system through the graphical user interface. This interface is linked with a relational database. It also generates the input files for the GeoPEARL executable. GeoPEARL in its turn calls the PEARL model. It does so for each unique combination of soil type, climate district, etc. These unique combinations are called plots. The output of GeoPEARL is transferred back to the user interface, from where it is stored in the database.
GeoPEARL
User
Interface
GeoPEARL
User
Interface
GeoPEARL
executable
GeoPEARL
executable
XYWin
viewer
XYWin
viewer
GeoPearl
database
GeoPearl
database
Report
Report
Maps
Maps
PEARL
model
PEARL
model
Figure 1. Overview of the GeoPEARL modeling system.
With the user interface, the following tasks can be carried out: − organize and edit substance and application data;
− access the standardized model runs, which should be used for the Dutch pesticide registra-tion procedure;
− control the model;
− view maps of major input variables; − run the model;
− display a summary report, containing percentiles of the leaching concentration; − display output maps;
2.1 Database structure
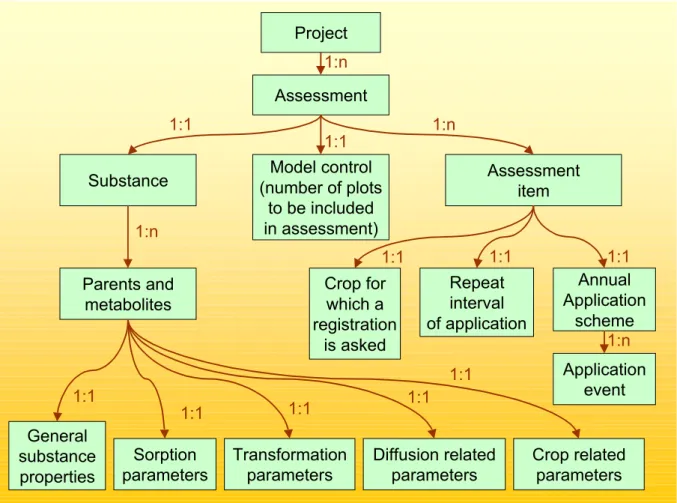
In order to organize the data efficiently, the data are stored in a relational database. Figure 2 shows how the data are organized in this database. Notice that the structure of the database has much in common with the structure of the FOCUS PEARL database (see Tiktak et al., 2000 figure 19). As shown in later sections of this manual, the screens of the GeoPEARL GUI have the same set-up as the database.
Project
Assessment
Substance (number of plotsModel control Assessmentitem to be included in assessment) Crop for which a registration is asked Annual Application scheme Parents and metabolites Application event Repeat interval of application General substance properties Sorption parameters Transformation parameters Crop related parameters Diffusion related parameters 1:n 1:n 1:1 1:1 1:1 1:1 1:1 1:n 1:n 1:1 1:1 1:1 1:1 1:1
Figure 2.Overview of the GeoPEARL database. Only parameters that can be changed by the user are included in the diagram.
Like the FOCUS PEARL database, the GeoPEARL database has a hierarchy. The highest level of the database is the project level. Here, the user can group several assessments, based on a common criterion (e.g. all assessments related to a particular registration dossier). The second highest level is the assessment level. An assessment is the basic entity in GeoPEARL. A GeoPEARL assessment is carried out for a single substance, but may consist of several so-called assessment items. Assessment items are combinations of a crop for which a registration is asked and an application scheme. This implies that different crops can have different appli-cation schemes.
The GeoPEARL database also contains the data of the spatial schematization, such as soil type, climate district and drainage system. These data are locked and cannot be changed by the user; for this reason they are not shown in figure 2.
2.2 Installation of the GeoPEARL User Interface
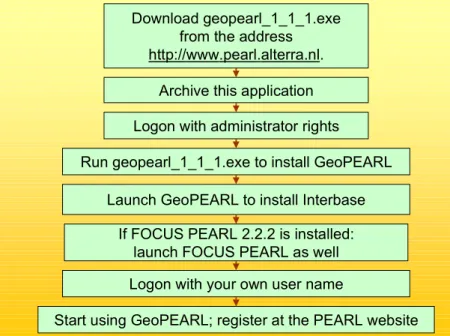
Before using GeoPEARL, you have to install the model. The model comes in a self-extracting archive, called geopearl_1_1_1.exe. This archive is available at the download page of the PEARL website, which is at the address http://www.pearl.alterra.nl. The size of this archive is approximately 150 Mbytes, so you need a fast internet connection for downloading (ADSL or better). The very first step of the installation procedure is to run the GeoPEARL self extractor application (figure 3). Running this application will automatically install the installation files to a directory of your choice (to be specified in the dialog ‘destination folder’). It is advised to archive the installation files, as these may later be required to remove GeoPEARL.
Download geopearl_1_1_1.exe from the address http://www.pearl.alterra.nl.
Archive this application Logon with administrator rights
Run geopearl_1_1_1.exe to install GeoPEARL Launch GeoPEARL to install Interbase
Logon with your own user name
Start using GeoPEARL; register at the PEARL website If FOCUS PEARL 2.2.2 is installed:
launch FOCUS PEARL as well
Figure 3. Installation procedure of GeoPEARL 1.1.1.
During the setup procedure, you will see the license agreement and the contents of the file ReadmeDuringInstallation.rtf. We strongly recommend reading the information in these files; particularly if you already have a GeoPEARL database, it is important that you read the in-structions. They can be found back in the GeoPEARL directory. You should at least be aware of the following:
− the operation system must be Windows NT4 or higher. Windows 95 and Windows 98 are no longer supported by the PEARL team.
Assessments versus assessment items
Assessments are the central entity in the GeoPEARL GUI. For each assessment, the GUI calculates the area of usage and summary statistics like the 90th percentile of the leaching concentration at the area of usage, the latter being the target variable in the Dutch registration procedure (see Tiktak et al., 2003, page 28). As mentioned above, an assessment can consist of various items. For example, a company might wish to request a registration for maize, potatoes and cereals. In that case, the as-sessment must contains three items. For each item, a GeoPEARL run is carried out and the 90th per-centile of the leaching concentration is calculated for the total area of maize, potatoes and cereals.
− you must have full administration rights during the installation procedure and during the first time that you start using GeoPEARL. If you don’t have full administration rights, logon to your computer with a user name that has administrator rights. It may be neces-sary to contact your systems operator.
− if a FOCUS PEARL 2.2.2. installation is present at your computer, start FOCUS PEARL with administration rights to restore the connection with Interbase. If you don’t do this, FOCUS PEARL will not start anymore.
2.3 Getting started with the GeoPEARL User Interface
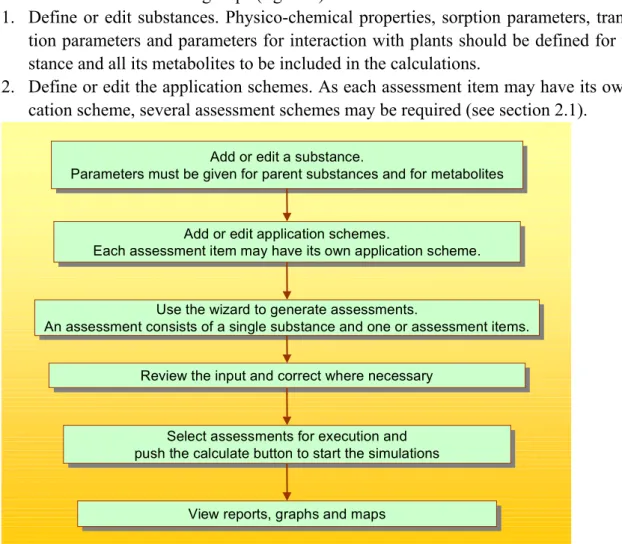
As in FOCUS PEARL, the user should first define the building-blocks of an assessment (see figure 2). This implies that first the substances and application schemes must be defined. This comes down to the following steps (figure 4):
1. Define or edit substances. Physico-chemical properties, sorption parameters, transforma-tion parameters and parameters for interactransforma-tion with plants should be defined for the sub-stance and all its metabolites to be included in the calculations.
2. Define or edit the application schemes. As each assessment item may have its own appli-cation scheme, several assessment schemes may be required (see section 2.1).
Add or edit a substance.
Parameters must be given for parent substances and for metabolites
Add or edit a substance.
Parameters must be given for parent substances and for metabolites
Add or edit application schemes.
Each assessment item may have its own application scheme.
Add or edit application schemes.
Each assessment item may have its own application scheme.
Use the wizard to generate assessments.
An assessment consists of a single substance and one or assessment items.
Use the wizard to generate assessments.
An assessment consists of a single substance and one or assessment items.
Review the input and correct where necessary
Review the input and correct where necessary
Select assessments for execution and push the calculate button to start the simulations
Select assessments for execution and push the calculate button to start the simulations
View reports, graphs and maps
View reports, graphs and maps
Figure 4. Major steps of a GeoPEARL assessment.
Deployment licenses
GeoPEARL and FOCUS PEARL 2.2.2. both use an InterBase database. The use of this database requires the installation of a database engine, the so-called InterBase server. Each user must have a so-called deployment license for using this software. This deployment license can be obtained free of charge from Alterra. You need only one deployment license for GeoPEARL and FOCUS PEARL. Only registered users can get a deployment license, so please register at the PEARL website.
3. Use the assessment wizard to define an assessment.
4. Check the settings within the assessment and correct if necessary.
5. Perform the calculations by selecting the assessments and push the calculate button to start the calculations.
6. Review the results.
The five steps are elaborated in a little bit more detail below.
Step 1. Add or edit a substance.
To create a new substance, do the following:
− from the main screen, select View Substances from the drop down menu at the top to go to the Substances form;
− click + on the navigator to add the parent substance;
− the following properties must always be specified by the user:
− in the General tab, specify a unique code, a name, the molar mass, the saturated vapor pressure and the solubility in water;
− in the Freundlich sorption tab, specify the coefficient for sorption on organic matter; − in the Transformation tab, specify the substance half-life;
− if necessary, repeat the last two steps for the metabolites; − if metabolites are involved, build the transformation scheme; − Click Close when all done to return to the main screen.
More information on editing substance properties can be found in section 2.6.
Step 2. Add or edit one or more application scheme(s)
To create a new application scheme, do the following:
− from the main screen, select View Application Schemes from the drop down menu at the top to go to the Application Schemes form;
− click + on the navigator of the Application Schemes box (left-hand side of form) to add an application scheme;
− fill in a unique code and a name;
− click + on the navigator of the Applications box to add an application; − Select the type of application and fill-in the other application parameters; − repeat the last two steps if a substance is applied multiple times a year; − Click close when all done to return to the main scheme.
More information on editing application schemes can be found in section 2.7.
Step 3. Run the wizard
Press the Wizard button on the main screen to start a GeoPEARL assessment. Absolute applications only
Unlike in FOCUS PEARL 2.2.2, in GeoPEARL it is not possible to specify pesticide applications rela-tive to crop emergence (so-called relarela-tive applications). The reason is that in GeoPEARL the crop emergence dates are part of a fixed spatial schematization, which cannot be manipulated by the user.
− Specify a name, the spatial detail wanted (i.e. the number of plots) and the substance for which GeoPEARL should be run. In order to get a reliable estimate of the 90th percentile of the leaching concentration, the number of plots should be at least 250. When done, se-lect Next;
− Select a crop, an application scheme and the application interval. Then select Add.
− Repeat the last step for all combinations of crops and application schemes to be included in the assessment;
− Select Finish to go back to the main form.
Step 4. Refinement
GeoPEARL has now created an assessment. This assessment has already been selected for execution. Before actually running the model, it is advisable to review the most important model inputs. Where necessary, changes can be made.
Step 5. Running GeoPEARL
Press the Calculate button on the main screen to actually run the model. The actual run-time for the model is hard to predict, as it depends on the hardware, the number of assessment items and the number of plots that you have included. Anyhow, a typical GeoPEARL assess-ment will take at least five hours. We therefore recommend to use state-of-the-art hardware only. When an assessment is ready, you will see the ‘Results’ column changing to Yes. If something has gone wrong, the Error button will become active.
Step 6. Review results
− Press the Report button to review the summary report. This report contains, amongst oth-ers, the 90th percentile of the leaching concentration at the area of use, which is the target variable in the Dutch registration procedure;
− Press the Graphs and Maps button to view maps of the leaching concentration, maps of terms of the substances balances, etcetera.
.
2.4 The projects form
The project form can be accessed from the main screen (see section 2.5). The projects form allows you to organize your data. Existing projects can be selected in the browse box (upper part of form). The navigator allows you to create or delete projects. An appropriate descrip-tion can be added in the edit part.
2.5 The main screen
This form (figure 5) is the central point from where you can access the different tables of the database, run the wizard and review model inputs and model outputs. Most of the steps de-scribed in section 2.3 will be carried out from the main screen. You can use buttons, the main menu or shortcut keys to navigate through the GeoPEARL User Interface.
The main menu
− Use File submenu to open another database (Key combination: Alt-F-O) or to exit GeoPEARL (Alt-F-X);
− Use the View submenu to directly jump to the projects form (Alt-V-P), the substances form (Alt-V-S) or the applications form (Alt-V-A);
− Use the Calculate submenu to start the calculations (Alt-C-C) or to select/unselect all as-sessments for execution;
− Use the Assessment submenu to run the Wizard (Alt-A-W), to move an assessment to another project (Alt-A-M) or to archive an assessment (Alt-A-A);
− Use the Help submenu to activate the help function.
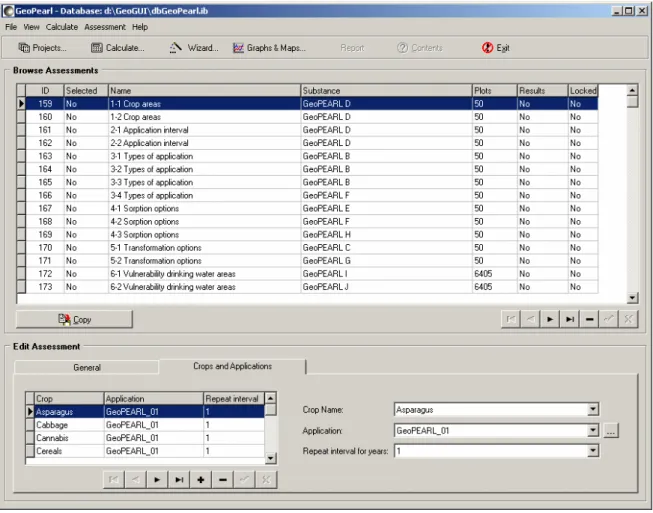
Figure 5. The main form of the GeoPEARL User Interface.
The lower part of the screen gives information on browsed assessments. Furthermore you can indicate here the amount of information that will be shown on the screen during the calcula-tion. When you check ‘detailed screen output’ more information will be shown on the screen during the calculations. This will, however, slow down the simulations.
2.6 Editing substances
The substances form is accessible from the main form of GeoPEARL. GeoPEARL can simu-late the fate of a parent pesticide and its formation products (metabolites) in soil. This implies that both the properties of the individual compounds, and the transformation scheme have to
be parameterized. Both are accessible from the pesticides form. Input must be carried out in the following order:
− definition of the properties of the individual compounds;
− definition of the transformation scheme. This step can be ignored if only one compound is simulated.
At least one compound, the parent compound, must be introduced. This compound will be applied, deposited, etcetera. The user can make a compound a parent compound by checking the ‘parent’ check box in the general tab of the substances screen (see next section).
2.6.1 Editing individual compounds
The substances form consists of five tabs. These tabs are described below.
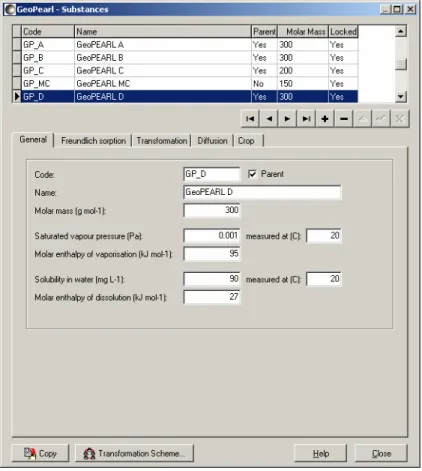
Figure 6.The substances form General tab
In this tab, the user enters the general compound properties. A unique code and the compound name must be introduced into the code and name fields. The maximum length of the code is five alphanumerical characters. The following parameter to be introduced is the molar mass. Data on molecular masses of compounds are reported in Tomlin (1994). GEOPEARL then
needs the saturated vapor pressure (PreVapRef), the temperature at which this parameter is determined (TemRefVap), the molar enthalpy of vaporization MolEntVap, the solubility of pesticide (SlbWatRef), the temperature at which the water solubility is obtained (TemRefSlb) and the molar enthalpy of dissolution (MolEntSlb). These properties can be taken from a
handbook on chemical properties of pesticides (e.g. Tomlin, 1994, Hornsby et al., 1996). See section 3.2.8 of the FOCUS PEARL manual for further guidance.
Freundlich sorption tab
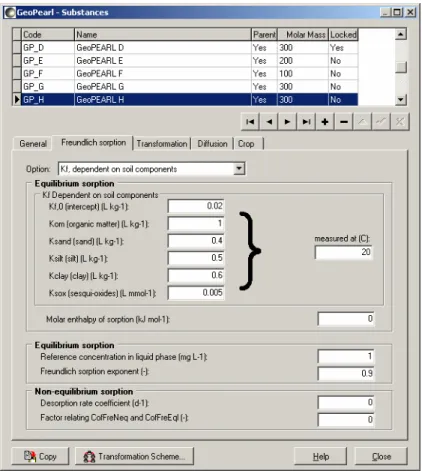
The sorption of compounds is described with a Freundlich equation (eqn. 41). See section 3.2.6 of the FOCUS PEARL manual for guidance and backgrounds. The Freundlich tab con-sists of three parts:
− the first part contains parameters describing the Freundlich coefficient;
− the second part contains the reference concentration and the Freundlich exponent; − the third part deals with non-equilibrium sorption.
In the first part of the Freundlich tab, the user must make a choice between one of the three options that GeoPEARL has available to calculate the Freundlich coefficient (OptCofFre). The most common approach (OptCofFre is ‘Kom, pH-independent’) is to calculate the Freundlich coefficient from the organic matter content and the coefficient for sorption on or-ganic matter (eqn. 42). If OptCofFre is set to ‘Kom, pH-dependent’, the Freundlich coeffi-cient is calculated with eqn. 43. This equation applies to the sorption of weak-acids. In some cases the sorption of pesticides is dependent on other soil properties than the organic matter content (e.g. oxide content or clay content). Therefore, an option is included in GeoPEARL to relate the sorption to other soil characteristics than organic matter (‘KF, dependent on soil components’).
For the moment this option is restricted to parameters that are available in the soil database distributed with GeoPEARL (i.e. soil texture, soil organic matter and sesqui-oxide content). The Freundlich coefficient is now calculated with eqn. 45.
If OptCofFre is set to ‘Kom, pH-independent’, only one additional parameter has to be intro-duced, i.e. the coefficient for sorption on organic matter, Kom,eq (KomEql).
If OptCofFre is set to ‘Kom, pH-dependent’, two coefficients for sorption on organic matter must be specified (section 3.2.8 of FOCUS PEARL manual), i.e. KomEqlAcid (Kom,eq,ac) and
KomEqlBase (Kom,eq,ba). In addition, the negative logarithm of the dissociation constant (pKa)
and a pHCorrection are required.
If OptCofFre is set to ‘Kom, soil dependent’, you can relate the Freundlich sorption coeffi-cient to one or more soil components, i.e. organic matter, sand, silt and sesqui-oxides. The overall sorption coefficient is a linear combination of the contributions of the components (eqn. 45). For each soil component, you must specify a sorption coefficient, i.e. KomEql for sorption on organic matter, KSandEql for sorption on sand, KSiltEql for sorption on silt, KClayEql for sorption on clay and KOxEql for sorption on sesquioxides. You also must spec-ify the contribution not accounted for by any soil component (the constant of the linear re-gression equation, KFEql0). You must enter a value in each of the boxes; enter a value of zero if there is no contribution of that particular soil component. The Kom on this screen is stored at
the same location in the database as the Kom possibly entered via the screen of the option Kom,
pH-independent; that value will be overwritten.
The second part of the Freundlich tab contains two parameters. The reference concentration in the liquid phase (ConLiqRef) must be within the concentration range of the simulation study. Its default value is 1 mg L-1. The Freundlich sorption exponent, n (ExpFre) is also required. Non-equilibrium sorption is described with equation (47). This equation requires two addi-tional parameters, i.e. the desorption rate coefficient, kd, and the factor describing the ratio
KF,ne/KF,eq, where KF,ne is the Freundlich coefficient at the non-equilibrium site and KFe,eq is
the Freundlich coefficient at the equilibrium site (FacSorNeqEql).
The desorption rate coefficient should be specified in the CofRatDes record. Please notice that non-equilibrium sorption will not be simulated if CofRatDes is set equal to zero. See further section 3.2.7 of FOCUS PEARL manual.
The transformation tab
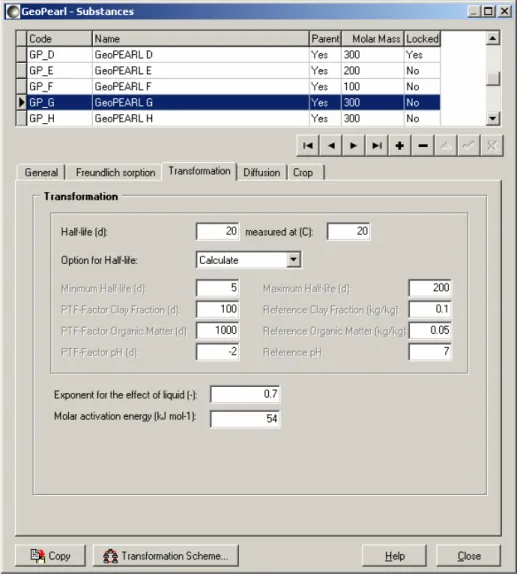
In this tab, the user has to specify parameters that affect the transformation rate of the com-pound. The transformation half-life time must be input in the half-life field (DT50Ref). This half-life should refer to the half-life in the top soil (plough layer) under optimal moisture con-ditions (pF = 2). The temperature reflecting the experimental concon-ditions during the incubation study (TemRefTra) must also explicitly be introduced.
An important difference with the transformation form in FOCUS PEARL is the presence of a half-life option field (OptDT50). This field can have two values, i.e. ‘input’ and ‘calculate’. If set to ‘input’ GeoPEARL uses one DT50 value for the entire country. This value is equal to the
value introduced in the half-life field. When choosing ‘Calculate’, pedotransfer functions are applied to relate the transformation half-life to soil components (see eqn. 62). The result is a spatially distributed half-life value. When choosing this value, you need to specify the pa-rameters of the pedotransfer function.
Figure 8. Input screen for soil dependent transformation parameters.
The pedotransfer function for transformation contains parameters for the dependence on the clay fraction (FacDT50Clay), the organic matter fraction (FacDT50Om) and the pH of the soil (FacDT50pH). The overall DT50, under reference conditions, is taken to be a linear
com-bination of the three components. Notice that the factors in the pedotransfer function have a unit, namely day. All fields must be filled, enter zero when the transformation is independent of a particular soil component. The user must also specify reference conditions for each of the three components (see eqn. 62), i.e. FraClayDT50Ref, CntOmDT50Ref and pHDT50Ref. Be careful that the reference conditions are entered as fractions for clay and organic matter con-tent, not as percentages. Finally, you may specify the minimum (DT50Min) and the maximum
values (DT50Max) for the half-life; the model will use these values if the results of the calcu-lations are beyond the range of these limits. In this way you can prevent GeoPEARL from extrapolating outside the range for which the pedotransfer function is valid.
In the lower part of the tab, the user must specify whether the incubation experiment has been carried out under optimum moisture conditions (OptCntLiqTra). As shown in eqn. 61, opti-mum moisture conditions are conditions wetter than field capacity (i.e. wetter than pF 2). If the incubation experiments have been carried out at moisture contents dryer than field capac-ity (i.e. dryer than pF 2), the optimum conditions checkbox must not be marked, and the user must additionally specify the moisture content during incubation (CntLiqTraRef). The tem-perature dependence of transformation is described with eqn. 60; the molar activation energy must be given (MolEntTra). The effect of soil water on the rate coefficient is described with eqn. 61, this equation requires an exponent (ExpLiqTra). See section 3.2.9 of FOCUS PEARL manual for further information on transformation parameters.
The diffusion tab
The diffusion coefficients of pesticides in pure water (CofDifWatRef) and air (CofDifAirRef) are compound properties and must be specified in the diffusion tab. Parameters for the rela-tive diffusion coefficient are soil dependent and cannot be manipulated by the user. The diffu-sion coefficients are temperature dependent. The user can specify one reference temperature, which applies to both the diffusion coefficient in air and the diffusion coefficient in pure wa-ter (TemRefDif).
The crop tab
GeoPEARL has modules to simulate canopy processes and root uptake. Both modules have to be parameterized in this tab.
As the transformation scheme (Figure 31) applies to products formed in soil, the canopy proc-esses module considers the parent compound only. Procproc-esses that occur at the plant canopy Example input for a substance with a spatially distributed half-life
Suppose you have a substance for which the transformation is dependent on soil organic matter, with a half-life (pF = 2, top soil, 20 °C) of 60 days in a soil with an organic matter fraction of 0.05 and a regression coefficient of 500 days. Furthermore, the range of the organic matter fractions in the meas-urements is between 0.005 and 0.10, corresponding with a range of half-lives from 37.5 days to 85 days. Suppose you want to use this range to define a minimum and maximum half-life. In this case you enter:
− 60 days for the reference half-life, DT50,r
− select calculate
− 37.5 days for the minimum half-life − 85 days for the maximum half-life
− 500 days for the PTF-factor for organic matter, fom
− 0.05 kg kg-1 for the reference organic matter, m
om,r
− 0 for the other PTF factors and reference conditions, fl, ml,r, fpH and pHr
In a soil containing with an organic matter content of 0.01, GeoPEARL will use a half-life of 40 days for the top soil at 20 °C and pF = 2, according to eqn. 62: (40 = 60 + 500 *(0.01 – 0.05)).
are volatilization, penetration into the plant and (photochemical) transformation (page 67). These processes are described with first-order rate reactions. The user can make a choice be-tween a lumped description of the processes at the crop canopy, or a full description of dissi-pation (canopy processes combo box; OptDspCrp). If set to ‘Specified’, the user must specify the half-life due to penetration (DT50PenCrp), volatilization (DT50VolCrp) and transforma-tion (DT50TraCrp). If set to ‘Lumped’. an overall half-life (DT50DspCrp) is sufficient. The wash-off of pesticides is described with a zero-order equation with one parameter (FacWasCrp).
The only parameter in the equation for uptake of pesticides (eqn. 63) is the coefficient for the uptake by plant roots, FacUpt. See further section 3.2.11 of FOCUS PEARL manual.
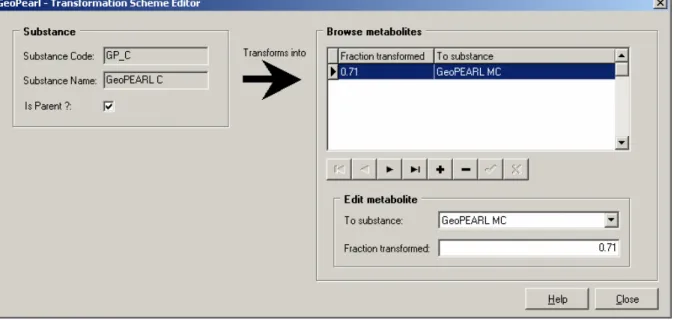
2.6.2 The transformation scheme form
After the user has defined the properties for all individual compounds (section 2.6.1) to be considered in the simulation, the transformation scheme (table FraPrtDau) can be build. The transformation scheme form can be accessed from the substances form, using the ‘transforma-tion scheme’ button. Before proceeding, read sec‘transforma-tion 3.2.1 of FOCUS PEARL manual for guidance on deriving transformation fractions and look at Figure 31 for an example of a trans-formation scheme.
Information about formation products and fractions must be entered for each compound con-sidered. If, for example, the user has defined one parent product (PEST) and two metabolites (e.g. MET1 and MET2), the transformation scheme form must be entered three times, i.e. one time from the PEST form, one time from the MET1 form and one time from the MET2 form.
Figure 9. The transformation scheme form
Start with the definition of the transformation scheme of the parent (PEST). Go to the PEST form and press ‘transformation scheme’. The left part of the form shows the parent product and some of its main properties. You cannot edit this part of the screen. To the right you will see the metabolites. By default, no metabolites are specified. If you leave these parameters
unchanged, PEARL will not simulate metabolites. Extra metabolites can be added using the +
button in the browse toolbar. Pick a metabolite from the ‘to substance’ list. If you want to add more metabolites, repeat the preceding two steps. After you have selected all metabolites, enter the transformation fractions.
Repeat the steps in the last paragraph for the two other metabolites. To achieve this, first go to the MET1 and MET2 forms, then press ‘transformation scheme’.
2.7 Editing application schemes
2.7.1 Application schemes
The application schemes form is accessible from the main menu of the main screen (View-Application Schemes). The entire events scheme can be repeated annually, biennially or tri-ennially using the ‘application interval’ option at the main screen.
Event schemes (Events) can be added with the + button of the navigator. You can also copy an existing event scheme. Event schemes should be given a unique code for reference and a description. Use the ‘Events’ button to define the individual events.
Figure 10. The application schemes form
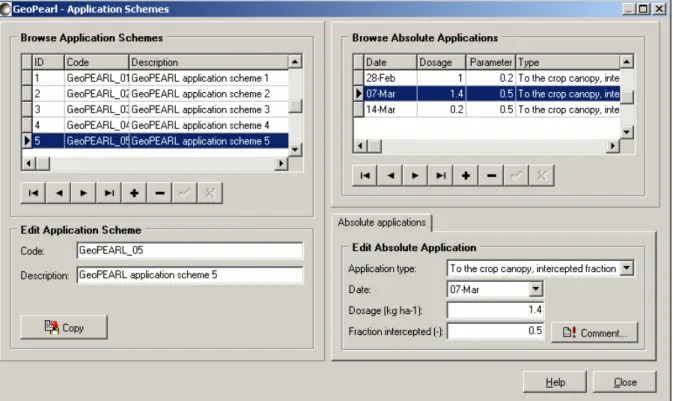
2.7.2 Applications
Add a new event with the + button of the navigator or copy an existing event. In the lower half of the screen, the event has to be further defined. First define the application type: ‘appli-cation to the soil surface’ (AppSolSur), ‘injection’ (AppSolInj), ‘incorporation’ (AppSolTil) or ‘application to the crop canopy, interception fraction supplied by the user’ (AppCrpUsr). Then enter the date and the dosage. Normal date format can be used. The year is not required
as GeoPEARL always repeats the entire application scheme annually, biennially or trienni-ally. In the case of injection or incorporation, you must additionally supply the incorporation or injection depth.
2.8 Composing an assessment with the Assessment Wizard
As described in section 2.1, an assessment is the basic entity of GeoPEARL. An assessment is carried out for a single substance and for one or more assessment items, which are combina-tions of crops and application schemes. Assessments are composed using the Wizard button on the main screen. You can compose an assessment after the substance and the application schemes that you want to use in your GeoPEARL calculations are defined. After selecting the assessment wizard, the following screen appears:
Figure 11. First screen of the assessment wizard.
Type the name of the assessment and define the number of plots to be included in the assess-ment. You can enter a number between 2 and 6405. However, for a reliable calculation of the 90th percentile of the leaching concentration, at least 250 plots should be used (see chapter 4); use a lower number only for test runs. If the given number of plots is larger than the number of plots available for a certain crop, then GeoPEARL calculates for the maximum number available.
Subsequently select a substance (defined earlier) and click the Next button. The screen shown in figure 12 will appear. Select a crop (see text box), an application scheme (defined earlier) and a repeat interval for the application scheme (i.e. annually, biennially or triennially) and click the Add button. Repeat this step for every crop you want to be included in the assess-ment. It is not possible to select a crop twice (with different application schemes) in a single assessment. Press the Finish button after having selected all combinations for the assessment. You return to the main screen, from where you can work further.
Figure 12. Second screen of the assessment wizard.
2.9 Checking assessment definitions
Back at the main screen you can check the definitions of the assessments. If necessary, you can make changes immediately by editing an assessment in the main screen. The main screen gives an overview of the most important items of the assessment, in two tabs. All the assess-ment items can be changed in the respective tabs.
2.10 Running the model
An assessment can be selected for execution by double clicking the respective assessment. Multiple assessments can be selected; all selected assessments are executed by pressing the ‘Calculate’ button on the main screen. In the main menu, you can select or deselect all as-sessments in a project at once (menu item Calculate).
Crops
Crops are used in GeoPEARL to identify the area of use of a plant protection product. You can choose from 26 entries. Most of the entries consist of a single crop or a crop group and it will be quite clear from the name what is meant. For example, the entry ‘potatoes’ stands for all potato crops, so includ-ing seed potatoes, starch potatoes and potatoes for consumption. The followinclud-ing entries need explana-tion:
− Fallow: agricultural area, indicated not to be used for production of crops for some period; − Plants for commercial purposes: caraway, flax, poppy seed and rapeseed;
− Remaining agricultural crops: crops not identified by other entries, usually these crops individually have an acreage up to a few hundred hectares;
− Total agricultural area: area of all crops (including fallow) together;
− Total non-urban area: total non-built-up area, i.e. agricultural area and nature area.
The 24 crops / crop groups (including fallow) can be combined in an assessment. For example, it is possible to select both sugar beets and potatoes in an assessment. It is, however, impossible to com-bine individual crops with the total agricultural area or the non-urban area; this would lead to overlap in areas. Likewise it is impossible to combine the agricultural area and the total area.
After starting the calculations, a GeoPEARL progress screen will appear. This screen roughly indicates the progress of the execution at the bottom of the screen. On the right side of the progress bar you see a Suspend button (figure 13). This button can be used to temporarily stop the execution. This button is active only in the calculation phase; it is not active when GeoPEARL is preparing the input for the calculations and when GeoPEARL is preparing out-put. Caution: the suspend button stops all PEARL and GeoPEARL calculations on a machine, not only the calculations that were started from the GeoPEARL window from which you started the calculations for this assessment. A warning appears after pushing the button; you have to confirm that you want to suspend the calculations. You can resume the calculations by clicking ‘Calculate’ again; GeoPEARL will continue with the first unfinished plot.
Figure 13. Screen indicating the progress of model execution.
2.11 Reports showing the target variable for registration
When GeoPEARL has terminated successfully, you will see that the Results column is set to Yes. Also, the Reports button will become highlighted. You can use this button to view a summary report, which shows the 90th percentile of the leaching concentration for the area of usage. As described in the text box in section 2.8, this area is represented by the total area of the crops selected when composing an assessment. See also section 2.5 of the GeoPEARL report for explanation of the area of usage. The reports contain information on the leaching concentration of all substances, including metabolites.
The target variable
The 90th percentile of the leaching concentration is calculated in a number of steps:
1. For each plot average leaching concentrations are calculated for 20 calculation periods. The length of the calculation periods is one year in the case of annual applications, two years in the case of biennial applications and three years in the case of triennial applications (conform FO-CUS, 2000).
2. From these 20 values, the median value is taken. The result is considered the leaching concentra-tion of a plot.
3. The 90th percentile in space is calculated using the median values of all plots.
Notice that in the Dutch registration procedure, the target variable is the median concentration in time and the 90th percentile in space. This is different from the FOCUS procedure, where the 80th percentile in time is combined with an approximate 80th percentile in space.
2.12 Viewing maps and graphs
By clicking the Graphs and Maps button, the user has fast access to all spatially distributed model inputs and model outputs. This option is extremely powerful when analyzing the be-havior of the model bebe-havior. Three major groups of variables can be accessed:
1. Spatially distributed model input parameters, which fall apart into two categories, i.e. soil parameters and crop areas. These parameters can be accessed through the ‘Echo of Input’ tab. As mentioned in section 2.8, crop areas are used as a proxy for the area of usage. 2. Output parameters that are available for the total area of use; i.e. for the area of all crops
included in the assessment.
3. Output parameters that are available for assessment items, i.e. for specific combinations of crops and application schemes included in an assessment.
It is always possible to review the model inputs, the other two tabs are only visible if an as-sessment has run successfully.
Some of the maps are prepared automatically after finishing the calculations. It will take only a few moments to present these maps on the screen. Other maps are prepared only upon re-quest of the user. The preparation of these maps, i.e. the selection of appropriate results, may take several minutes.
2.12.1 Viewing input parameters
Maps of input parameters and maps of crop areas are available in the ‘Echo of Input’ tab (fig-ure 14). For viewing input parameters, check ‘Map – Soil properties’ and select the appropri-ate parameter from the drop-down box and the depth for which you want the parameter to be visualized. To view the crop areas, check ‘Map – Crop area’ and select the crop from the drop-down box.
2.12.2 Viewing output parameters for the total area of usage
If you want to graph results for the total area of usage, select the ‘Area of usage’ tab (figure 15). This tab is only visible if results are available. You can choose between two graphs: − the first graph shows the cumulative frequency distribution of the median leaching
− the second graph shows the cumulative frequency distribution of the 20th, 50th and 80th
percentiles of each plot. This graph is an extension of the first graph; it shows the variabil-ity of the leaching concentration due to variabilvariabil-ity in weather conditions.
Both graphs can be shown for all substances in an assessment; i.e. the parent and, if applica-ble, the metabolites.
Figure 14. Screen for reviewing the input parameters
2.12.3 Viewing output parameters for individual crops within an assessment
If you want to graph results for the total area of usage, select the ‘Area of crop’ tab (fig-ure 16). This tab is only visible if results are available. First select the substance for which you want to view the output You can choose between the following type of graphs:
− cumulative frequency distribution of the median leaching concentration. In contrast to the graph in previous section, this graph pertains to a single crop only;
− cumulative frequency distribution of the 20th, 50th and 80th percentile in time of the
leach-ing concentration;
− maps of the leaching concentration;
− maps of terms of the water balance. A schematic overview of the water balance is pre-sented in figure 20;
− maps of terms of the substance balance. A schematic overview of the substance balance is presented in figure 21.
All maps are presented with five classes, all classes have the same area (automatic legend scaling). In the case of the leaching concentration, it is also possible to create a map with pre-set classes. The advantage of a map with prepre-set classes is that the trigger concentration of 0.1 µg L-1 is clearly visible.
Figure 16. Screen for viewing output for individual crops within an assessment.
2.12.4 The viewer
GeoPEARL uses the graphical program XYWIN (Van Heerden and Tiktak, 1994) for all graphs and maps. Functions that are available within XYWIN are:
− Zooming: click the left mouse button to select a rectangle. Warning: this function is only intended to analyze the map; it should not be used to ‘read’ the leaching concentration in your ‘backyard’.
− Statistics: you can use XYWIN to create frequency diagrams of maps. Warning: if used for maps of the leaching concentration, this function may give different results than the
cumulative frequency distribution generated by GeoPEARL itself. The reason is that blanks are threated in another way.
− Printing: Graphs can be printed by pressing CNTRL-P or by selecting print from the file menu.
− Export of graphics files: Use the File menu select Output. You can specify different out-put formats, like jpg, png, tiff and emf. If you want to incorporate a graph in a word proc-essor like Word, we advise to use png format.
2.13 Archiving your assessment
The GeoPEARL User Interface has the possibility to export the information that is required to run the assessment to ASCII files. The structure of these files is described in chapter 3. This functionality can be accessed by selected Archive from the Assessment submenu at the main screen (or press Alt-A-A). The obtained files can be used:
− to archive your run;
− as input for the stand-alone version of GeoPEARL.
Please notice that it is currently not possible to import the obtained files into another GeoPEARL database. You must also archive the GeoPEARL database.
2.14 Directory structure for the GeoPEARL User Interface
The communication between the GeoPEARL User Interface and the GeoPEARL executables is through ASCII files. These files can also be used in combination with the stand-alone ver-sion of GeoPEARL, as described in chapter 3. Figure 17 shows the directory structure used by the GeoPEARL User Interface:
− The GeoPEARL root directory is the directory that you have specified during the installa-tion
− The bin directory contains all executables
− The database directory contains the GeoPEARL database. The default name of the data-base is DbGeoPearl.ib.
− All ASCII files required by the GeoPEARL executable are stored in the DBGeoPEARL directory. The actual name of this directory depends on the name of the database. If, for example, the name of the database is bentazone.ib, the name of this directory would also have the name ‘bentazone’. The number of data directories is equal to the number of GeoPEARL databases.
− The next level is the Assessment directory. For each assessment that has been carried out with GeoPEARL, a directory is created. Directories are given numbers; the numbers cor-respond with the assessment number.
− Parallel to the Assessment directory, you will find the Schematisation directory. This di-rectory contains all the ASCII files of the spatial schematisation (represented by an orange color in figure 18) and the output control file (ctr file).
− The Temp directory contains temporary files generated by the GeoPEARL executable. − Within the assessment directory, you will find one or more assessment item directories. In
this directory, you will find back the geo, cmp and app files (see section 3.2 for explana-tion).
− The output of an assessment item is written to the output subdirectory (the files with a blue color in figure 18).
GeoPEARL root directory Bin directory Database directory Help directory XY directory DBGeoPEARL directory Assessment directory Schematisation directory Temp directory Assessment Item directory Output directory
Figure 17. Directory structure for the GeoPEARL User Interface
2.15 Using another database
You can use multiple database with GeoPEARL. To do so, follow this procedure:
− goto the database directory and copy the database (i.e. the file with extension .ib). The name of this database should be different from the name of the original database;
− From the main menu, select File – and then ‘Open GeoPEARL database’ to open another database;
− GeoPEARL will now open the other database;
3
User’s guide of the command-line version of GeoPEARL
This section describes the command-line version. It is described how the model can be ap-plied to applications in which the user primarily wants to change the substance properties and the application schedule. You will see that the steps for running the stand-alone version of GeoPEARL are almost the same as the steps to be followed when using the GeoPEARL User Interface. This manual is dedicated to the Dutch application. If you want to use GeoPEARL for other countries, you first have to create a new spatial schematisation. Once done, the steps are exactly the same as in the Dutch application.3.1 Performing an assessment with the stand-alone version
1 Install GeoPEARL according to the instructions in section 2.2.
2 Download the ‘geopearl_1_1_1_ascii.exe’ self-extracting archive from the PEARL web-site to get the input files for the stand-alone version of GeoPEARL. Put the files prefera-bly into a directory without spaces.
3 Copy the contents of the Example directory to a new directory. Assign a unique directory to each assessment. You can, alternatively, copy assessments from the GeoPEARL User Interface (see section 2.14 for directory structure). Files generated by the GUI do, how-ever, not have comment lines and are more difficult to understand.
4 Add a new substance to the compounds file and edit the substance properties (page 41). 5 Add a new application schedule to the applications file and edit it (page 44).
6 Edit the geo file.
a Specify the directory structure (page 46).
b Specify the control options of GeoPEARL (page 46).
c Specify the required spatial resolution and the crop for which a registration is re-quested (i.e. plot selection; page 47).
d Specify the substance and application schedule (page 49). e Request additional (detailed) output (optional, page 50). 7 Run the model (page 50).
8 GeoPEARL creates a number of output files, containing the substance and water balances and percentiles of the leaching concentration (page 51).
9 Use the ‘percentiles.exe’ executable to calculate the 90th percentile of the leaching
con-centration and generate maps.
10 The tables can be imported in EXCEL for additional calculation or in a Geographic In-formation System to generate maps and regional-scale substance and water balances (page 57).
3.2 File structure
Figure 18 gives an overview of all files types. Each file type has its own extension, the exten-sion may not be changed. There are three groups of files:
- Files that need to be edited in standard applications. These files are given a green color in
figure 18 and are stored in the example directory.
- Files that contain the spatially distributed parameters. These files should not be changed,
unless a new spatial schematisation is set-up by the user. These files are given an orange color in figure 18 and stored in the schematisation directory.
- Output files (blue color), which are stored in the output directory.
The position of all files can be changed (see further page 46). This report describes the green and blue files only, as these are the files that are relevant for standard applications. A descrip-tion of the other files can be found at the PEARL website (http://www.pearl.alterra.nl).
Figure 18. File structure of GeoPEARL. Files with a green color are stored in the assessment direc-tory, files with an orange color in the schematisation directory. Only files with a green color need edit-ing.
3.3 Creating an assessment with multiple assessment items
As described in section 2.1, a GeoPEARL assessment is carried out for a single substance, but may consist of several so-called assessment items. Assessment items are combinations of a crop for which a registration is asked and an application scheme. This implies that different
crops can have different application schemes. To carry out an assessment with more items, do the following:
1) After having created the geo file for the first crop, copy this file as many times as there are items in your assessment. If, for example, you have to do an assessment for maize, pota-toes and cereals, create a file maize.geo, potapota-toes.geo and cereals.geo
2) In each geo file, assign the appropriate crop in the Crops table and the appropriate applica-tion schedule in the applicaapplica-tions table. Warning: these two variables are the only vari-ables that can be different within an assessment! You can only use one substance within an assessment.
3) Run the model for all items.
4) Use the percentiles.exe program to:
a) calculate the overall 90th percentile of the leaching concentrations at the total area of usage;
b) calculate the 90th percentile of the leaching concentrations for each assessment item
individually; c) generate maps.
The percentiles program should be run one time in an assessment. The entire procedure is described in figure 19.
Create a directory for an assessment and copy the examples Add a substance to the cmp file Add application schemes to the app file
Edit the geo file and make it OK for the first crop in your assessment Make as many copies of the geo files as there are crops in the assessment Run GeoPEARL for each assessment item
Prepare the input file for the percentiles program - refer to all the items Run the percentiles program once to get
the 90th percentile of the leaching concentration
at the area of usage
Figure 19. Performing an assessment with multiple assessment items with the stand-alone version of GeoPEARL.
3.4 Adding and editing substances
Substance properties must be specified in the file with extension cmp (step 4 of ‘Getting Started’). The substances file contains exactly the same information as the ‘compound proper-ties’ section of the PEARL input file as described in section 4.2.9. of the FOCUS PEARL
user manual. For detailed information on substance properties, the reader is referred to this manual.
The substances file consists of two sections:
- A section containing generic substance properties. This section contains default
parame-ters. These defaults can be overwritten by including them in the second, substance spe-cific, section.
- A section with substance specific properties.
Below follows a listing of the generic part of the substances file. Please note that the sub-stance properties in this section do not have subsub-stance extensions.
*--- * Default substance parameters
* Parameters can be overwritten by including them into the compound section * of the relevant pesticide
*--- * Gas/liquid partitioning parameters
20.0 TemRefVap (C) .. measured at [0|40]
95.0 MolEntVap (kJ.mol-1) Molar enthalpy of vaporization [-200|200] 20.0 TemRefSlb (C) .. measured at [0|40]
27.0 MolEntSlb (kJ.mol-1) Molar enthalpy of dissolution [-200|200] 0.0 MolEntSor (kJ.mol-1) Molar enthalpy of sorption [-100|100] 20.0 TemRefSor (C) .. measured at [0|40]
*--- * Uptake parameters
0.5 FacUpt (-) Coefficient for uptake by plant [0|10] *--- * Diffusion of solute in liquid and gas phases
4.3d-5 CofDifWatRef (m2.d-1) Diff. coeff. in water [10e-5|3e-4] 0.43 CofDifAirRef (m2.d-1) Diff. coeff. in air [0.1|3]
20.0 TemRefDif (C) ... measured at [10|30]
*--- * Transformation rate parameters
20.0 TemRefTra (C) Temperature at which DT50 is measured [5|30] 0.70 ExpLiqTra (-) Exponent for the effect of liquid [0|5] OptimumConditions OptCntLiqTraRef OptimumConditions or NonOptimumConditions 1.0 CntLiqTraRef (kg.kg-1) Liq. content at which DT50 is measured [0|1] 54.0 MolEntTra (kJ.mol-1) Molar activation energy [0|200]
*--- * Sorption parameters
0.9 ExpFre (-) Freundlich sorption exponent [0.1|1.3] 1.0 ConLiqRef (mg.L-1) Reference conc. in liquid phase [0.1|-] 0.0 pHCorrection (-) pH correction [-2|1]
*--- * Non-equilibrium sorption
0.00 CofDesRat (d-1) Desorption rate coefficient [0|0.5] 0.5 FacSorNeqEql (-) CofFreNeq/CofFreEql [0|-]
For each substance to be simulated, the user must specify a substance specific section. Each of these sections starts with [substance_name] and ends with [end_substance_name], where substance_name should be replaced with the actual name of the substance. Parameters in the