National Institute for Public Health and the Environment
P.O. Box 1 | 3720 BA Bilthoven www.rivm.com
PM
2.5monitoring strategy
RIVM Letter report 680704018/2012 E. van der Swaluw | R. Hoogerbrugge
Colophon
© RIVM 2012
Parts of this publication may be reproduced, provided acknowledgement is given to the 'National Institute for Public Health and the Environment', along with the title and year of publication.
van der Swaluw, E., Hoogerbrugge, R
Contact:
Eric van der Swaluw
RIVM
Eric.van.der.Swaluw@rivm.nl
This investigation has been performed by order and for the account of Directorate-General for Environmental Protection, within the framework of 680704 Reporting Air Quality
Abstract
PM2.5 monitoring strategy
By order of the Ministry of Infrastructure and the Environment, RIVM has set up a PM2.5 monitoring strategy in order to measure the fine fraction of particulate matter, PM2.5, within the Dutch National Air Quality Monitoring Network (NAQM). According to the European legislation from 2008, member states are required to measure PM2.5. The EU Directive 2008/50/EC prescribes measurements at 20 locations in the Netherlands. However, RIVM recommends the implementation of 28 monitoring stations in order to obtain a network which yields results with the same accuracy as the operational PM10 network in the Netherlands. The EU legislation for PM2.5 is aimed at the protrection of human health.
During the whole process of the implementation of PM2.5 measurements in the NAQM, a few crucial decisions needed to be made like buying the monitoring equipment and the set-up of the infrastructure. This whole process had a duration of a few years. This strategy is based on information which has been collected to make the above decisions.
Rapport in het kort
PM2.5 monitoring strategie / Brief rapport
In opdracht van het ministerie van IenM heeft het RIVM een strategie op gezet om metingen naar de fijnere fracties van fijn stof, PM2,5, uit te voeren binnen het Landelijk Meetnet Luchtkwaliteit (LML). De Europee richtlijn voor
luchtkwaliteit heeft dat in 2008 voorgeschreven. Deze richtlijn, 2008/50/EC, vereist dat in Nederland op minimaal 20 locaties wordt gemeten. Het RIVM geeft aan dat 28 locaties nodig zijn om voor PM2.5 gelijksoortige evaluaties te kunnen maken als voor fijn stof (PM10). De Europese normen voor PM2.5 zijn er
voornamelijk op gericht om de volksgezondheid te beschermen.
De inrichting van het LML voor PM2.5-metingen kende een aantal cruciale beslissingsmomenten, zoals voor de hoeveelheid aan te schaffen
meetapparatuur en voor de inrichting van de infrastructuur. Dit proces heeft enkele jaren geduurd. Deze strategie is gebaseerd op de informatie die gebruikt is om bovenstaande keuzes te kunnen maken.
Contents
1 Introduction—7
2 Background of PM2.5—9
2.1 Concentrations of PM2.5 in the Netherlands—9 2.2 Emissions of PM2.5 in the Netherlands—9
3 Constructing a PM2.5 monitoring programme—11 3.1 The number of monitoring stations—11
3.1.1 Number of monitoring stations according to EU Directive 2008/50/EC—11 3.1.2 Number of monitoring stations as recommended by RIVM—11
3.2 Implementation of the measuring sites—11
4 The number of sites for the PM2.5 monitoring programme—13 4.1 Type of sites in the Netherlands—13
4.2 The approach of the strategy—13 4.3 Rural background sites—15 4.4 Urban background sites—16 4.5 Traffic-related sites—16 4.6 Summary of the results—17
5 Proposal implementation of sites—19 5.1 Scenario GCN—20
5.2 Scenario Hot-Spots—21 5.3 Scenario No-History—22 5.4 Scenario Health—23 5.5 Scenario Balance—25
5.6 Scenarios for LML in collaboration with DCMR and GGD—26 5.7 Conclusion scenarios—27
6 Conclusion—29
References—31
Appendix A Current PM2.5 monitoring stations—33
Appendix B Number of monitoring sites for particulate matter(PM)— 36
Appendix C Results of the 4 scenarios—38 Appendix D Uncertainties in trend analysis—43
Appendix E Consequences of the number of rural and urban background stations on GCN—46
1
Introduction
This PM2.5 measurement strategy has been used over a period of several years (starting in 2007) to guide intermediate decisions on locations, infrastructure and investments. Due to this historical context, at some places information is presented as was available at the time that intermediate decisions were necessary.
The Member States of the European Union are required to measure the finer fraction of particulate matter (PM2.5) in accordance with EU Directive
2008/50/EC of the European Parliament and of the Council of 21 May 2008 that became effective on 11June 2008. In order to meet up with this new EU
directive, the Ministry of Housing, Spatial Planning and the Environment (VROM) has asked the National Institute for Public Health and the Environment (RIVM) to construct a monitoring strategy for PM2.5 in the Netherlands.
The main objective of the monitoring strategy for PM2.5 presented in this report is the initiation of a long-term monitoring network. Once the PM2.5 network is operational, its results are reported to the European Commission to assess the ambient air quality with respect to PM2.5. Next to meeting Limit Values, the Directive also includes reduction targets for the average national PM2.5 levels in the urban background.
On a different level the results of the PM2.5 network will also be used to inform the Dutch public with real time hourly concentrations of PM2.5. The measurement data of PM2.5 will also be used for the validation and calibration of models. These model calculations are crucial in the Dutch system of demonstrations of
compliance with air quality limit values and objectives. Currently air quality concentrations of critical components (PM10 and NO2) are calculated in the ―NSL-monitoring tool.
2
Background of PM2.5
2.1 Concentrations of PM2.5 in the Netherlands
Measurements of the concentration of PM2.5 in the Netherlands have started in 2004 in the Netherlands. The indicative concentrations for yearly averaged PM2.5 values over the period 2004-2006 in the Netherlands in regional, urban and traffic areas are respectively 12-16 μg/m3; 16-19 μg/m3; and 18-21 μg/m3 as indicated in Figure 2.1 (from Matthijsen & ten Brink, 2007). The highest concentrations of PM2.5 occur in the urban areas in ‗De Randstad‘ and the Southern part of the Netherlands according to the latest calculations of the background concentrations for 2008 (GCN) as shown in the map of the
Netherlands in Figure 2.1 (from Velders et al., 2009). The lowest values in the background concentration map of 2008 occur in the Northern part of the Netherlands.
Figure 2.1 The concentrations of PM2.5 in the Netherlands. Left panel: yearly averaged concentrations. Right panel: background concentration -map of PM2.5 in the Netherlands.
2.2 Emissions of PM2.5 in the Netherlands
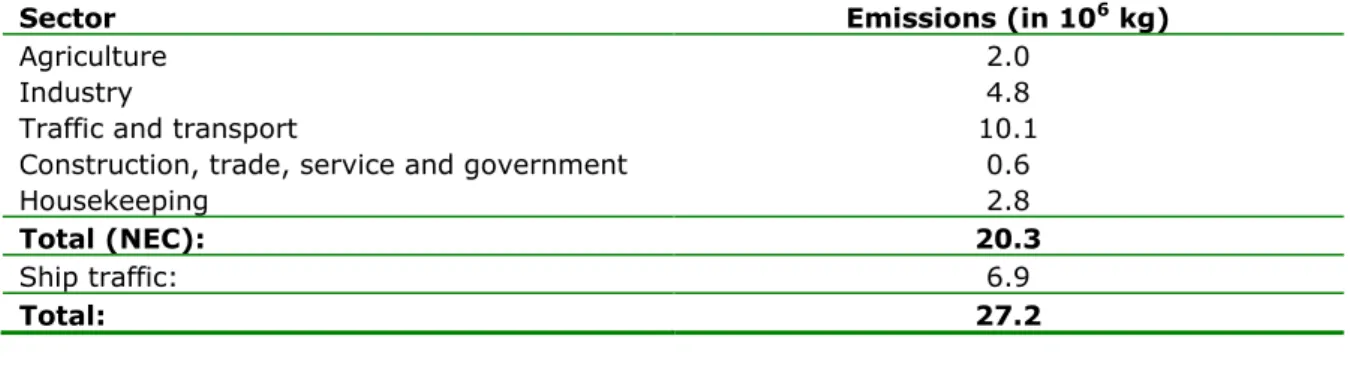
The current emissions (in 2006) in the Netherlands are given in Table 2.1 (from Velders et al., 2009). In 2006 the total emission in the Netherlands equalled 27.2 million kilogram. 37% of the emission comes from traffic & transport, 25% comes from ship traffic, 18% comes from industry and 20% comes from the other sources. In the report by Matthijsen and ten Brink (2007), it is stated that
about 20% of the origin of PM2.5 is from national emitted sources. The other 80% comes from abroad and other sources. An explicit overview is given in Table 2.2
Table 2.1 Emissions of PM2.5 in the Netherlands
Sector Emissions (in 106 kg)
Agriculture 2.0
Industry 4.8
Traffic and transport 10.1
Construction, trade, service and government 0.6
Housekeeping 2.8
Total (NEC): 20.3
Ship traffic: 6.9
Total: 27.2
Table 2.2 Source of the PM2.5 in the Netherlands
Source Contribution
The Netherlands 19%
Foreign sources 49%
3
Constructing a PM2.5 monitoring programme
3.1 The number of monitoring stations
3.1.1 Number of monitoring stations according to EU Directive 2008/50/EC
From the EU Directive 2008/50/EC the number of required monitoring stations for PM2.5 can be calculated for each zone and agglomeration separately in the Netherlands. This minimum number scales directly with the number of
inhabitants in a zone or agglomeration (see Table B1 in Appendix B). In this way a total number of 60 monitoring stations for PM in the Netherlands are obtained. European legislation prescribes that the ratio of PM10:PM2.5 has to be in between 2:1 and 1:2. In this way one obtains a minimum number of 20 monitoring stations for PM2.5. From these 20 stations, a minimum number of 8 stations need to be located at urban background sites (see Table B2 in Appendix B).
3.1.2 Number of monitoring stations as recommended by RIVM
The recommended size of the monitoring network first of all has to fulfil the minimum number of sites required by European legislation as explained in section 3.1.1. Secondly the Ministry of Housing, Spatial Planning and the Environment (VROM) has asked the National Institute for Public Health and the Environment (RIVM) to construct a monitoring strategy for PM2.5 in the
Netherlands which has the same accuracy as the network for PM10
measurements. In order to achieve this same accuracy, several arguments have resulted in a recommended size of the monitoring network of 28 measuring stations. These stations are split up into 12 urban background sites, 8 rural background sites and 8 traffic-related sites. A summary of the reasoning behind the result mentioned above are given in section 4 of this report.
3.2 Implementation of the measuring sites
The recommended size of the monitoring network in the Netherlands equals 28 sites. An algorithm has been developed at RIVM which calculates the most efficient configuration of an air quality network in the Netherlands, given the number of measuring locations needed. In this way the algorithm selects the most appropriate sites of the Dutch National Air Quality Monitoring Network
(LML). The algorithm also allows to take into account the measuring sites of GGD Amsterdam, DCMR or new sites. In section 5 of this report several scenarios are presented which result in a network configuration.
4
The number of sites for the PM2.5 monitoring programme
4.1 Type of sites in the Netherlands
The Dutch National Air Quality Monitoring Network (LML) performs measurements of air quality at three different types of monitoring sites:
o Rural background; o Urban background; o Traffic-related locations.
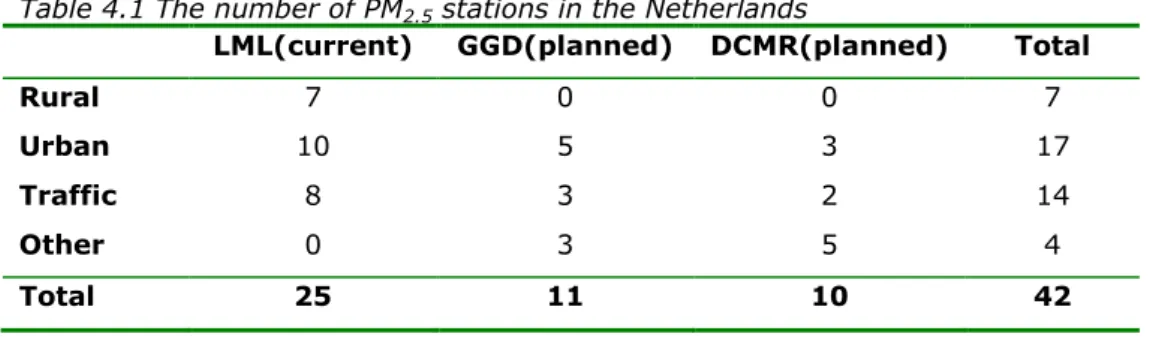
The number of current monitoring stations for PM2.5 within the LML is given in the table 4.1 in column 2. The measurements within the LML are performed with the reference method NEN-EN 14907 and are based on daily sampling and weighting the samples at the RIVM laboratory. The new monitoring programme will be equipped with automatic measurements with sampling times of an hour. For completeness sake the planned number of monitoring stations of PM2.5 at GGD (in both Amsterdam and Zaandam) and DCMR are given in the table below in the columns 3 and 4. The fifth column indicates the total number of
monitoring stations for each type of monitoring site obtained in this way if
nothing is changed in the current LML network. The exact locations of the
different stations are given in Appendix A.
Table 4.1 The number of PM2.5 stations in the Netherlands
LML(current) GGD(planned) DCMR(planned) Total
Rural 7 0 0 7
Urban 10 5 3 17
Traffic 8 3 2 14
Other 0 3 5 4
Total 25 11 10 42
4.2 The approach of the strategy
o In determining the number of sites for PM2.5 necessary for the new network, the aim will be to achieve the same accuracy with the PM2.5 network as is currently achieved with the PM10 network. The PM10 network consists of 40 measuring stations. The number of stations required for PM2.5 to achieve the same accuracy as in the case of PM10 is less than 40 sites because, PM2.5 is dominated even more by secondary
inorganic aerosols (SIAs) than PM10 and these SIA are long transport components without steep gradients. The main difference between PM10 and PM2.5 are the ―course particles‖ that consist mainly of crustal material, road particles (elevated by traffic) and sea salt. The first two have important local contributions and therfore much steeper
gradients.Due to the gradual difference in composition it can be expected that the modelling of PM2.5 with a relative uncertainty
comparable to PM10 will presumably be easier, as the components which are particularly difficult to model dominate the coarse fraction. This observation coincides with the general assumption that PM2.5 gradients are smaller than PM10 gradients. Therefore the objective of achieving similar relative uncertainty presumably requires fewer measurements for model calibration. Quantification of the optimal ratio is difficult in
scientific terms, but also because the modelling calibration should be robust for fall out of instruments and possible changes in locations, etc. As an expert judgement, a ratio #PM2.5/#PM10 = 0.6 - 0.8 seems reasonable. To evaluate the above general considerations with some measurements, the following results in the Netherlands are available. The first two results argue in favour of smaller PM2.5 gradients compared to PM10 gradients, the last one argues against this assumption:
o BOP: local gradients in the Rotterdam area for PM2.5 are about 50% of the local gradients for PM10;
o The correlation distance for PM2.5 (170 km) is nearly twice as large as the correlation distance for PM10 (90km);
o In the calibration of the GCN-maps the residual standard deviation of PM10 (2.3 μg/m3) is comparable with the standard deviation of PM2.5 in the GCN-maps (2.1 μg/m3).It should be stressed that the above three considerations are all marked with large uncertainties.Apart from the aim to achieve the same accuracy for PM2.5 as for PM10 other applications also have requirements for the number of stations to be chosen for the PM2.5 strategy. These applications are:
o the production of large-scale concentration maps (GCN);
o the calculation of air pollution from road traffic model (CAR);the ability to determine trends over long time intervals
Table 4.2 Number of measuring stations for PM10 and NO2 (source LML website)
Rural Urban Traffic Sum
PM10 17 8 16 41
NO2 22 8 13 43
For the first two applications, the data from the LML are used for calibrating the models. Expert advice give a minimum number of 8 rural measuring stations for the calibration of the GCN-maps and 8 street stations for the calibration of the CAR-model. For the last application, i.e. the ability to determine trends over long time intervals, we observe a minimum number of 8 stations, which is the current minimum number used in the LML (see table 4.2) for NO2 and PM10. The last years trend analyses has become very important for both NO2 and PM10. Experience with such trend analysis shows that small data sets are very
sensitive for local changes that influence the results from a single measurement station. For example in the last years stations were removed due to building activities (Wittevrouwen en Bibliotheek in Utrecht, road restructuring (Cabeljauw straat Amsterdam) replaced due to road restructuring (Amsterdamse veerkade) etc. Also changes in traffic or other local sources Florapark Amsterdam due to Noord Zuid lijn activities,.. ), local buildings (Utrecht Erzeystraat), trees (various statiosn) can severely influence concentrations at single stations. Such events are very likely to cause the loss or change of stations in periods for 10 -15 years and the representativeness of the trend observed will be critically dependent of the initial number of stations. Trends for 8 stations (currently NO2 and PM10 at Urban Background locations) are already conspicuous, lower numbers will be rather useless for trend analysis.
Below we will argue for the number of sites required for each type of measuring site. As a starting hypothesis we take the ratio of PM2.5:PM10 like 1:2 unless there is clear evidence from the other three applications mentioned above, i.e. calibration of GCN and CAR and the determination of trends, that the ratio should be higher.
4.3 Rural background sites
Currently there are 17 rural background sites for PM10. Taking the ratio of PM2.5 to PM10 monitoring stations like 1:2, a total of 8 monitoring stations for the measurement of PM2.5 at rural background sites is obtained. This number is in line with the minimum number of stations needed at rural sites to calibrate the GCN-maps for PM2.5 (according to expert judgement). Furthermore a number of 8 stations is the minimum number currently used in the Dutch National Air
Quality Monitoring Network in order to monitor long-term trends for other crucial components like NO2 and PM10.
4.4 Urban background sites
Taking the ratio of PM2.5 to PM10 monitoring stations like 1:2, a total of 4 monitoring stations for the measurement of PM2.5 at urban background sites is obtained. This number is already smaller than the 8 monitoring stations
operational in the LML (as required by EU legislation) at the 1st of January 2008. The extension of this number of urban background stations to 12 sites was necessary in order to fill up the gap which existed before that in the Northeast part of the Netherlands. The emphasis of the EU directive is currently on
monitoring background values of PM2.5 at urban backgrounds. A reduction target value in between 10%-20% in 2020 as compared to 2010 is prescribed by European legislation. The exact value of the reduction depends on the average exposure indicator (AEI), which is the three-year (2009-2011) averaged PM2.5 level measured at urban background locations in the Netherlands. The reduction target value equals 15% if the AEI is in between 13-18μg/m3, 10% when the AEI is in between 8,5-13μg/m3 and 20% when the AEI is larger than 18μg/m3 (see Matthijsen et al., 2007). In order to measure these type of trends one needs sufficient monitoring stations. In appendix D it is argued that at least 12 stations are needed in order to allow for the trend determinations as required by European legislation. Finally this suggested increase from 9 to 12 urban
background sites would also increase the quality of the GCN-maps: the maps are calibrated with the observed values of PM2.5 concentrations at rural and urban background sites in the Netherlands: i.e. the uncertainty in the concentrations of the GCN-maps scales as
rural urban
n
n
1
.
Notice that in the case of PM2.5 n=nurban+nrural would equal 20 in the current proposal, whereas for PM10 there are currently n=nurban+nrural=24 stations. This ratio matches quite well with the earlier mentioned ratio of #PM2.5:#PM10 = 0.6-0.8. Further consequences of the choice for the number of rural and urban background stations are discussed in Appendix E.
4.5 Traffic-related sites
Currently there are 16 traffic-related sites for PM10. Taking the ratio of PM2.5 to PM10 monitoring stations like 1:2, a total of 8 monitoring stations for the
with the number of street stations needed to calibrate the CAR calculations for PM2.5 according to expert judgement. Furthermore a number of 8 stations is the minimum number used in the current Dutch National Air Quality Monitoring Network in order to monitor long-term trends for components like NO2 and PM10.
4.6 Summary of the results
Table 4.3 summarizes the proposal for the number of monitoring sites for the new PM2.5 monitoring programme. The choice for these number of monitoring stations at the different measuring sites guarantee:
1. The requirements for EU directive 2008/50/EC are fulfilled;
2. The accuracy of the PM2.5 monitoring network has a similar quality as the current PM10 monitoring network;
3. The number of rural and urban background stations allow for a sound calibration of the GCN-maps for PM2.5;
4. The number of traffic-related sites allow for a check on the calibration of the CAR model;
The long-term trends at rural background, urban background and traffic-related sites of PM2.5 can be traced with the same accuracy as other components in the LML.
Table 4.3 Summary of the strategy
Current PM2.5 network New PM2.5 network
Rural background 7 8
Urban background 10 12
Traffic-related 8 8
5
Proposal implementation of sites
The proposal is to implement 28 sites within the Dutch National Air Quality Monitoring Network. A template has been developed at RIVM to calculate the optimal measuring configuration.
The core of the template consists of objectives which have been formulated. The objectives should be ranked by a weighting factor such that the weighting factors of all objectives sum up to unity. Apart from the objectives, the template allows for a separate ranking of weighting factors (typically in between 0 and 100) for ―The Dutch and European Requirements‖, ―Areas in the Netherlands‖ and ―Homogeneous distribution over the Netherlands‖.
The objectives for individual stations which have been selected are: o large-scale concentration maps (GCN);
o measurement of PM2.5 and PM10 at same sites (PM);
o CAR, input for dispersion model Calculation of Air pollution from Road traffic;
o trend;
o LML Processes, sites where black smoke, inorganics and metals are measured;
o Health, sites important for the health sector.
As stated above the core of the template are the formulated objectives. Each objective obtains a ranking between zero and unity. Next for each individual objective all stations considered for the measuring strategy are ranked in the following category: o not important (0); o very low (5); o low (10); o high (15); o very high (20) o extremely high (50).
For each objective an expert1 in the field was consulted to rank the considered stations.
1 The experts consulted are working in their field of expertise and using observations from the LML measurement locations for various components and all type of air quality data analysis tools: trends, wind roses, model/measurement consistencies, component/component consistencies, local complexity etc.
The objective ―GCN‖ differs from the option ―Homogeneous distribution over the Netherlands‖: the latter constructs the total number of stations in order to have the most homogeneous distribution over the Netherlands. The GCN objective selects individual stations according to their individual score for their ranking. A calculation of a measuring strategy starts with selecting those stations with a non-zero rating for the sum of the objectives. The number of stations which have been selected in this way is Nstart. The other important parameter for the algorithm is the total number of stations, Ntot, of which the configuration has to exist. Next the algorithm will calculate which station of the total of Nstart stations contributes slightest to the total score: this station will be dropped from the list of selected measuring stations, so (Nstart-1) stations are left. This procedure will be continued until the number of stations left equals the total number of stations required for the network configuration, i.e. Ntot.
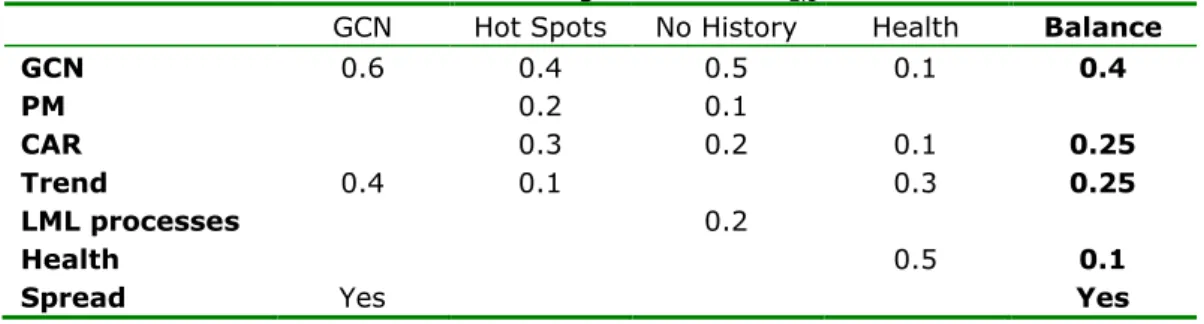
Five different strategies have been calculated of which the ranking are mentioned in the table below. The last scenario ―Balance‖ is the one recommended by RIVM since it satisfies exactly the division into 8 rural background, 12 urban background and 8 traffic stations. Furthermore this scenario fits in best with the current LML network for PM2.5. Each strategy is discussed separately in the sections 5.1-5.5. Appendix C listst the stations which have been selected for each scenario.
Table Scenarios: Calculations of the configuration for PM2.5
GCN Hot Spots No History Health Balance
GCN 0.6 0.4 0.5 0.1 0.4 PM 0.2 0.1 CAR 0.3 0.2 0.1 0.25 Trend 0.4 0.1 0.3 0.25 LML processes 0.2 Health 0.5 0.1
Spread Yes Yes
5.1 Scenario GCN
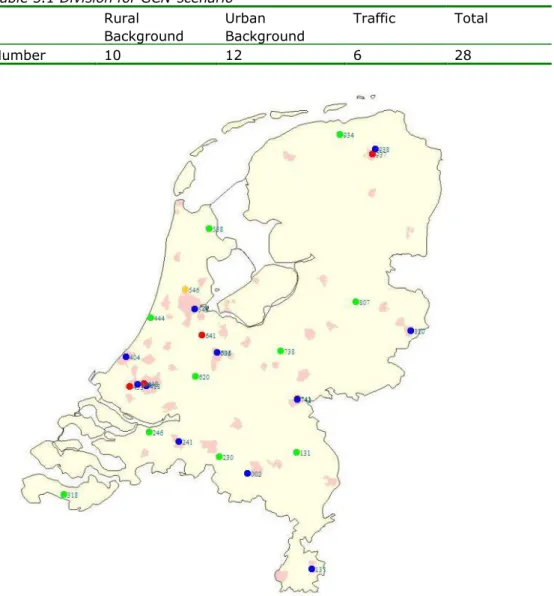
The scenario puts the emphasis on the selected number of stations which are needed for constructing GCN-maps. Furthermore the scenario attaches importance to the trend history and a homogeneous spreading over the Netherlands. Table 5.1 states the division of the selected stations into rural background, urban background and traffic stations, whereas Figure 5.1 shows
the spatial distribution. The biggest gap where no station is found equals 62 kilometres. With respect to the current PM2.5 configuration 2 stations are removed. Table C1 in appendix C gives all selected stations in the 2nd column.
Table 5.1 Division for GCN-scenario
Rural Background Urban Background Traffic Total Number 10 12 6 28
Figure 5.1 Configuration of the GCN-scenario
5.2 Scenario Hot-Spots
The scenario puts the emphasis on the selected number of stations which are needed for selecting the hot spots in the Netherlands: traffic stations and stations where currently PM10 is measured. Furthermore the scenario attaches importance to the construction of the GCN-map and the trend history. Table 5.2 states the division of the selected stations into rural background, urban
background and traffic stations, whereas Figure 5.2 shows the spatial distribution. The biggest gap where no station is found equals 97 kilometres.
With respect to the current PM2.5 configuration 5 stations are removed. Table C2 in appendix C gives all selected stations in the 2nd column
Table 5.2 Division for Hot-Spots scenario
Rural Background Urban Background Traffic Total Number 7 6 15 28
Figure 5.2 Configuration of the Hot-Spots scenario
5.3 Scenario No-History
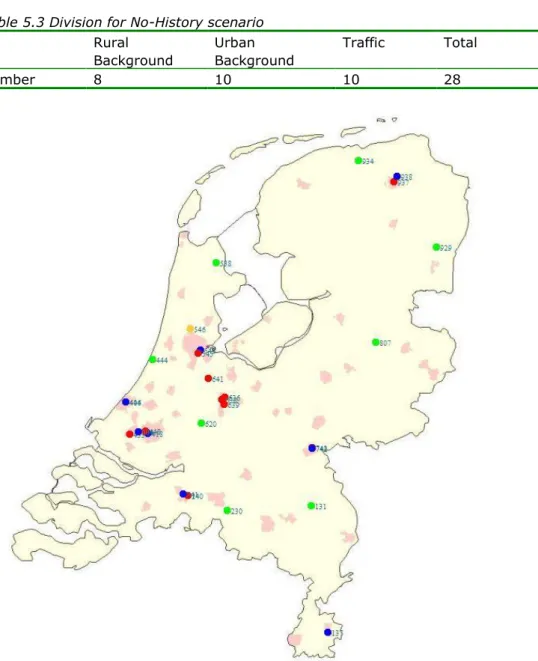
The scenario puts the emphasis on the selected number of stations which are needed for the construction of GCN-maps and the determination of Hot Spots without taking into account the stations with a long history. Table 5.3 states the division of the selected stations into rural background, urban background and traffic stations, whereas Figure 5.3 shows the spatial distribution. The biggest gap where no station is found equals 97 kilometres. With respect to the current PM2.5 configuration 6 stations are removed. Table C3 in appendix C gives all selected stations in the 2nd column.
Table 5.3 Division for No-History scenario Rural Background Urban Background Traffic Total Number 8 10 10 28
Figure 5.3 Configuration of the No-history scenario
5.4 Scenario Health
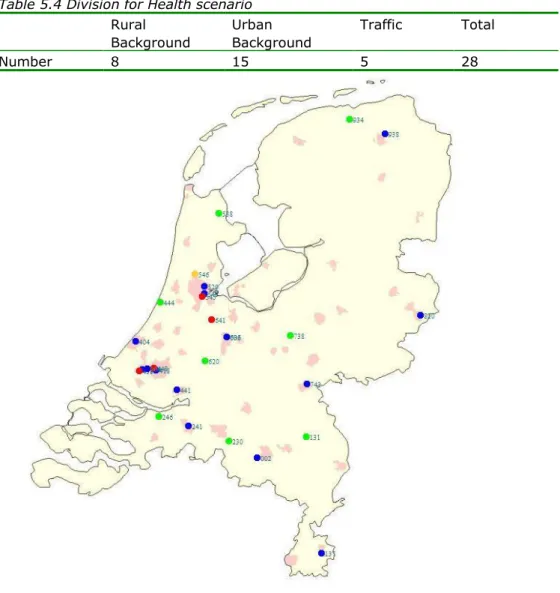
The scenario puts the emphasis on selecting stations for the health sector. Furthermore the scenario attaches importance to GCN, CAR and Trend. Table 5.4 states the division of the selected stations into rural background, urban background and traffic stations, whereas Figure 5.4 shows the spatial distribution. The biggest gap where no station is found equals 89 kilometres. With respect to the current PM2.5 configuration 4 stations are removed. Table C4 in appendix C gives all selected stations in the 2nd column.
Table 5.4 Division for Health scenario Rural Background Urban Background Traffic Total Number 8 15 5 28
5.5 Scenario Balance
The scenario takes into account all important objectives. Furthermore the scenario has been fine-tuned such that one obtains 8 rural background stations, 12 urban background stations and 8 traffic stations (see Table 5.5). Figure 5.5 shows the spatial distribution. The biggest gap where no station is found equals 62 kilometres. With respect to the current PM2.5 configuration 2 stations are removed. Table C5 in appendix C gives all selected stations in the 2nd column.
Table 5.5 Division for Balance scenario
Rural Background Urban Background Traffic Total Number 8 12 8 28
5.6 Scenarios for LML in collaboration with DCMR and GGD
Next we repeat all scenarios from 5.1-5.5 but this time it is assumed that the monitoring activities from DCMR and GGD Amsterdam suffice to cover the agglomerations of Amsterdam and Rotterdam such that no sites need to be
selected in these areas for LML stations. Below we give the tables which yield
the resulting number of LML stations required to monitor with the same accuracy and details as prescribed in the previous sections. This time however the
presence of the networks of DCMR and GGD Amsterdam are taken into account. Table 5.5 shows the resulting number of monitoring stations from LML which are required.
Table 5.6 LML stations with same scenarios as before but with the help of DCMR and GGD Rural Background Urban Background Traffic Total Scenario GCN: 10 8 4 22 Scenario Hot-Spots: 7 2 11 20 Scenario No-History: 8 6 7 21 Scenario Health: 8 9 2 19 Scenario Balance 8 8 6 22
It is obvious that if one makes use of the monitoring results from monitoring network of the GGD Amsterdam and DCMR that there needs to be an additional effort in tuning in the results from these two networks into the network of the LML.
Finally we present a specific example of how the monitoring networks of GGD Amsterdam and DCMR can be used in the case of scenario Balance (section 5.5). In this scenario two monitoring positions are located in the agglomeration of Amsterdam: Amsterdam-Overtoom and Zaanstad. Both stations are already covered by the monitoring network of the GGD.
Four stations are located in the agglomeration Rotterdam: 418 Rotterdam-Schiedamseveste (urban background); 433 Vlaardingen-Floreslaan (traffic);
448 Rotterdam-Bentinckplein (traffic); 1119 Schiedam-DCMR (urban background).
The above four stations could be covered by the following DCMR stations: HGV Hoogvliet (urban background);
RDO-Overschie A13 (traffic); RID-Ridderkerk A16 (traffic;
SDM Schiedam (urban background).
It should be emphasized that the monitoring stations RDO and RID are located at highways, furthermore SDM is the same station as 1119 in the LML network.
5.7 Conclusion scenarios
PM2.5 measurements can be performed with different objectives. Using the algorithme described policymakers can judge scenarios with respect to the weighing of the different objectives. Using the number of stations that were indicated by the various experts on their field of expertise a balanced scenario is developed using a set of weighing factors that correspond with the ministries priorities.
6
Conclusion
By mutual agreement between RIVM and VROM it has been decided to take configuration Balance (subsection 5.5) as the configuration to be implemented into LML for the PM2.5 monitoring network. A few changes have been implemented in this scenario explained below.
The PM2.5 monitoring network will be exploited by a collaboration between RIVM, GGD Amsterdam and DCMR. Therefore a few LML stations as chosen in the scenario Balance are implemented by monitoring stations of one of these partners (indicated in Table 6.1).
Table 6.1 shows the chosen monitoring stations for the PM2.5 monitoring network with the station which is replaced in column 3 and in column 4 the name of the partner.
The following stations have been replaced from ‗Scenario Balance‘ to the final adopted configuration:
Station 433 was replaced by station 445, because a second independent check on the scenario Balance showed that the EU legislation was otherwise not fulfilled
Station 418 was replaced by Hoogvliet2 since DCMR is monitoring PM 2.5 at this station which is representative for the location of LML station 418 Official agreements on the equivalence and quality of measurements exist between RIVM, DCMR and GGD-Amsterdam (see Agreements RIVM, DCMR and GGD-Amsterdam, 2009). In the implementation of this measurement strategy official agreement between the Ministry of VROM, DCMR, GGD-Amsterdam and Provincie Noord-Brabant on the continuity of the measurements and monitoring stations is strongly recommended.
2 PM
Table 6.1 The advised configuration for monitoring PM2.5 in the Netherlands
Current Proposed Stations Clarification Partner
131 Vredepeel 131 Vredepeel 136 Heerlen 136 Heerlen 137 Heerlen 137 Heerlen 230 Biest Houtakker 240 Breda 240 Breda 241 Breda 241 Breda 246 Fijnaart 247 Veldhoven 247 Veldhoven 318 Philipinne
404 Den Haag 404 Den Haag
418 Rotterdam Hoogvliet (DCMR) Replaces 418 Rotterdam DCMR 433 Vlaardingen 445 Den Haag 444 De Zilk 444 De Zilk
448 Rotterdam 448 Rotterdam Comparison station DCMR 538 Wieringerwerf 538 Wieringerwerf 620 Cabauw 620 Cabauw 636 Utrecht 636 Utrecht 641 Breukelen 641 Breukelen 643 Utrecht 643 Utrecht 738 Wekerom 738 Wekerom 741 Nijmegen 741 Nijmegen 742 Nijmegen 742 Nijmegen 821 Enschede 821 Enschede3 934 Kollumerwaard 934 Kollumerwaard 937 Groningen 937 Groningen 938 Groningen 938 Groningen
543 Amsterdam 543 Amsterdam Comparison
station GGD Amsterdam GGD Zaanstad GGD Zaanstad GGD Amsterdam 1119 Schiedam 1119 Schiedam DCMR
References
Agreements RIVM, DCMR and GGD-Amsterdam (2009)
http://www.dcmr.nl/nl/actueel/_/content/gemeenschappelijk/nl/documents/nieu ws/2009/02/DCMR-en-RIVM-werken-samen-voor-betere-gegevens-luc.html Arkel, F.Th. van, Kummu, P.J., Loon van, J.P.L., Meulen, A. van der, Severijnen, M., Visser, J.H., 2007. Overzicht van onderzoek naar automatische
meetmethoden voor het vaststellen van fijn stof. Stand der techniek PM2.5-meetmethoden. RIVM 680708004 [Dutch].
Arkel, F.Th. van, Hafkenscheid, Th.L., Ingen Housz, F.C., Jonge, D. de, Kummu, P.J., Meulen, A. van der, 2008. PM2.5 Performancetest. Vergelijk automatische PM2.5-meetapparatuur. RIVM rapport 680709001 [Dutch].
Diggle, P.J. and Ribeiro Jr, P.J. (2006). Model-based Geostatistics. Series: Springer Series in Statistics. Springer, New York.
Directive 2008/50/EC of the European Parliament and of the Council of 21 May 2008 on ambient air quality and cleaner air for Europe.
EC Working Group on Guidance for the Demonstration of Equivalence (2005) Demonstration of equivalence of ambient air monitoring methods. Published on Internet 28 February 2007: http://ec.europa.eu/environment/air/ambient.htm EN-EN 14907: 2004. Ambient air quality: Reference gravimetric measurement method for the determination of the PM2.5 mass fraction of suspended particulate matter.
Groot de, G.M., et al., 2008. Vergelijking luchtkwaliteitsmetingen en emissiecijfers van Nederland en omringende landen. RIVM Rapport 680177002/2008 [Dutch].
Hartigan, J. A. and Wong, M. A., 1979. A K-means clustering algorithm. Applied
Statistics 28, 100–108.
Kassteele, J. van de, 2006. Statistical air quality mapping. Doctoral Thesis Wageningen University.
Matthijsen, J., Visser, H., 2006. PM10 in Nederland. Rekenmethodiek, concentraties en onzekerheden. MNP Rapport 5000093005 [Dutch].
Matthijsen, J., Brink, ten H.M., 2007. PM2.5 in the Netherlands. Consequences of the new European air quality standards.
NTA 8019. Nederlandse Technische Afspraak. Ambient air quality. Requirements for
Particulate Matter measurements.
Velders, G.J.M., Matthijsen, J., Aben, J.M.M., De Vries, W.J., 2007. Grootschalige PM2.5-concentratiekaarten van Nederland. Een voorlopige analyse. MNP rapport 500088003 [Dutch].
Velders, G.J.M., Matthijsen, J. Meteorological variability in NO2 and PM10 concentrations in the Netherlands and its relation with EU limit values, Atmospheric Environment (2009). Article in press.
Wesseling, J.P, Mooibroek, D., van Pul, W.A.J., 2007. Een vergelijking tussen met CAR II versie 5.0 berekende concentraties en metingen van het LML. RIVM680600003/2007 [Dutch].
Appendix A
Current PM
2.5monitoring stations
Table A1 Current official PM2.5 monitoring stations of LML (September 2009)
Station number
Name station Type
131 Vredepeel-Vredeweg Rural background
136 Heerlen-Looierstraat Traffic
137 Heerlen-Nicolayestraat Urban background
240 Breda-Tilburgseweg Traffic
241 Breda-Bastenakenstraat Urban background
246* Fijnaart-Zwingelspaansedijk Rural background 2474 Veldhoven-Europalaan Urban background
404 Den Haag-Rebecquestraat Urban background 418 Rotterdam-Schiedamsevest Urban background
433 Vlaardingen-Floreslaan Traffic
444 De Zilk-Vogelaarsdreef Rural background 448 Rotterdam-Bentinckplein Traffic
538 Wieringerwerf- Medemblikkerweg Rural background 543*** Amsterdam-Overtoom Urban Background
620 Cabauw-KNMI Rural background
636 Utrecht-de Jongweg Traffic
641 Breukelen-A2 Traffic
643 Utrecht, Griftpark Urban background
738 Wekerom-Riemterdijk Rural background
741 Nijmegen-Graafseweg Traffic
742 Nijmegen-De Ruyterstraat Urban background 820 Enschede-Espoortstraat Urban background
934 Kollumerwaard-Hooge Zuidwal Rural background
937 Groningen-Europaweg Traffic
938 Groningen-Nijesteinheerd Urban background 018*** Amsterdam-Ringweg A10 zuid Traffic
701*** Zaandam Urban Background
1119** Schiedam-Alphons Ariënsstraat Urban Background *Provincie Noord-Brabant; **DCMR; ***GGD Amsterdam
Table A2 Current plans for PM2.5 monitoring stations of DCMR
Station number
Name station Type
1145 Maassluis-Kwartellaan Urban
Background/Industry
1191 Hoogvliet-Leemkuil Urban Background
1119 Schiedam-Alphons Ariënsstraat Urban Background 1043 Overschie-Oost-Sidelinge Traffic
2069
Rotterdam-Statenweg/Bentinckplein
Traffic/Urban Background
1987 Ridderkerk Traffic
5151* Hoek van Holland-Berghaven Industry
1083 Rotterdam-Pleinweg Traffic/Urban Background 1081 Rotterdam-Zwartewaalstraat Urban Background
Rotterdam-Maasboulevard Traffic/Urban Background
*
Table A3 Current plans for PM2.5 monitoring stations of GGD Amsterdam (January 2010)
Station number
Name station Type
007 Amsterdam-Einsteinweg Traffic
012 Amsterdam-van diemenstraat Traffic
014* Amsterdam-Overtoom Urban Background
016 Amsterdam-Westerpark Urban Background
017 Amsterdam-Stadhouderskade Traffic
701 Zaandam Urban Background
703 Spaarnwoude Urban Background
704 Hoogtij Industry
553 Wijk aan Zee Industry
551 IJmuiden Industry
570 Beverwijk Urban Background
Appendix B
Number of monitoring sites for
particulate matter(PM)
Table B1 Minimum number of sampling points per agglomeration/zone for concentrations above the upper assessment threshold, according to 2008/50/EC
Agglomeration/Zone Inhabitants (×1000) Number sites PM Number sites PM2.5 LML sites PM2.5 Amsterdam 1500 -1999 7 2 0 Utrecht 250 - 749 3 1 1 The Hague/Leiden 1000 -1499 6 2 1 Rotterdam 1000 -1499 6 2 3 Eindhoven 250 - 749 3 1 1 Heerlen 0 - 249 2 1 2 Zone North 2750 - 3749 10 3 3 Zone Middle 4750 - 5999 13 5 6 Zone South 2750 - 3749 10 3 4 Total 60 At least 20 21
Table B2 Calculation of the minimum number of urban background sites
Number of sites Zone Inhabitants Per 1-1-2008 Per 1-1-2009
Ede Midden 107274 Emmen Noord 108711 Zwolle Noord 113857 Zoetermeer Zuid 117502 Leiden Midden 117777 Maastricht Zuid 119607 's-Hertogenbosch Zuid 135183 Amersfoort Midden 138026 Arnhem Midden 142382 Enschede Noord 154427 1 Apeldoorn Midden 155807 Nijmegen Midden 160215 1 Breda Zuid 170029 1 1 Almere Noord 179695 Groningen Noord 181171 1 1 Tilburg Zuid 200819 Kerkrade/Heerlen Heerlen 240326 1 1 Eindhoven Eindhoven 427000 1 Utrecht Utrecht 453619 1
The Hague/Leiden The Hague 1061200 1 1
Rotterdam/Dordrecht Rotterdam 1279364 2 2
Amsterdam/Haarlem Amsterdam 1538435 2 2
Total 7302426 8 12
The air quality directive prescribes a minimum number of 1 station for each 1000.000 inhabitants in agglomerations and other urban area‘s > 100.000 inhabitants. To calculate this number of inhabitants the number of inhabitants in the agglomerations and all > 100.000 municipalyties are summed. This defined a minimum strategy which was applied on 1/1/2008 to start the ERT analysis. This strategy was limited by the availabilty of urban background locations. In this strategy the number of locations out site of the western part of the country was rather low and therefor new urban background stations were introduced in the cause of 2008 in the agglomerations of Utrecht and Eindhoven and the municipalities of Enschede and Nijmegen.
Appendix C
Results of the 4 scenarios
Table C1 Scenario GCN Current LML 131 Vredepeel 131 Vredepeel 136 Heerlen 137 Heerlen 137 Heerlen 230 Biest-Houtakker 240 Breda 241 Breda 241 Breda 246 Fijnaart 246 Fijnaart 247 Veldhoven 247 Veldhoven 318 Philipinne404 Den Haag 404 Den Haag
418 Rotterdam 418 Rotterdam 433 Vlaardingen 433 Vlaardingen 444 De Zilk 444 De Zilk 448 Rotterdam 448 Rotterdam 538 Wieringerwerf 538 Wieringerwerf 620 Cabauw 620 Cabauw 636 Utrecht 636 Utrecht 641 Breukelen 641 Breukelen 643 Utrecht 643 Utrecht 738 Wekerom 738 Wekerom 741 Nijmegen 741 Nijmegen 742 Nijmegen 742 Nijmegen 807 Hellendoorn 820 Enschede 820 Enschede 934 Kollumerwaard 934 Kollumerwaard 937 Groningen 937 Groningen 938 Groningen 938 Groningen 543 Amsterdam 543 Amsterdam 546 Zaanstad 546 Zaanstad 1119 Schiedam 1119 Schiedam
Table C2 Scenario Hot Spots Current LML 131 Vredepeel 131 Vredepeel 136 Heerlen 136 Heerlen 137 Heerlen 137 Heerlen 230 Biest-Houtakker 240 Breda 240 Breda 241 Breda 241 Breda 246 Fijnaart 247 Veldhoven
404 Den Haag 404 Den Haag
418 Rotterdam 418 Rotterdam 433 Vlaardingen 433 Vlaardingen 444 De Zilk 444 De Zilk 448 Rotterdam 448 Rotterdam 537 Haarlem 538 Wieringerwerf 538 Wieringerwerf 544 Amsterdam 545 Amsterdam 620 Cabauw 620 Cabauw 636 Utrecht 636 Utrecht 639 Utrecht 641 Breukelen 641 Breukelen 643 Utrecht 738 Wekerom 741 Nijmegen 741 Nijmegen 742 Nijmegen 742 Nijmegen 807 Hellendoorn 820 Enschede 934 Kollumerwaard 934 Kollumerwaard 937 Groningen 937 Groningen 938 Groningen 938 Groningen 543 Amsterdam 543 Amsterdam 546 Zaanstad 546 Zaanstad 1119 Schiedam 1119 Schiedam
Table C3 Scenario No-history Current LML 131 Vredepeel 131 Vredepeel 136 Heerlen 137 Heerlen 137 Heerlen 230 Biest-Houtakker 240 Breda 240 Breda 241 Breda 241 Breda 246 Fijnaart 247 Veldhoven
404 Den Haag 404 Den Haag
418 Rotterdam 418 Rotterdam 433 Vlaardingen 433 Vlaardingen 444 De Zilk 444 De Zilk 446 Den Haag 448 Rotterdam 448 Rotterdam 538 Wieringerwerf 538 Wieringerwerf 545 Amsterdam 620 Cabauw 620 Cabauw 636 Utrecht 636 Utrecht 638 Utrecht 639 Utrecht 641 Breukelen 641 Breukelen 643 Utrecht 738 Wekerom 741 Nijmegen 741 Nijmegen 742 Nijmegen 742 Nijmegen 807 Hellendoorn 820 Enschede 929 Valthermond 934 Kollumerwaard 934 Kollumerwaard 937 Groningen 937 Groningen 938 Groningen 938 Groningen 543 Amsterdam 543 Amsterdam 546 Zaanstad 546 Zaanstad 1119 Schiedam 1119 Schiedam
Table C4 Scenario Health Current LML 131 Vredepeel 131 Vredepeel 136 Heerlen 137 Heerlen 137 Heerlen 230 Biest-Houtakker 240 Breda 241 Breda 241 Breda 246 Fijnaart 246 Fijnaart 247 Veldhoven 247 Veldhoven
404 Den Haag 404 Den Haag
416 Vlaardingen 418 Rotterdam 418 Rotterdam 433 Vlaardingen 433 Vlaardingen 441 Dordrecht 444 De Zilk 444 De Zilk 448 Rotterdam 448 Rotterdam 520 Amsterdam 538 Wieringerwerf 538 Wieringerwerf 545 Amsterdam 620 Cabauw 620 Cabauw 636 Utrecht 636 Utrecht 641 Breukelen 641 Breukelen 643 Utrecht 643 Utrecht 738 Wekerom 738 Wekerom 741 Nijmegen 742 Nijmegen 742 Nijmegen 820 Enschede 820 Enschede 934 Kollumerwaard 934 Kollumerwaard 937 Groningen 938 Groningen 938 Groningen 543 Amsterdam 543 Amsterdam 546 Zaanstad 546 Zaanstad 1119 Schiedam 1119 Schiedam
Table C5 Scenario Balance Current LML 131 Vredepeel 131 Vredepeel 136 Heerlen 136 Heerlen 137 Heerlen 137 Heerlen 230 Biest-Houtakker 240 Breda 240 Breda 241 Breda 241 Breda 246 Fijnaart 247 Veldhoven 247 Veldhoven 318 Philipinne
404 Den Haag 404 Den Haag
418 Rotterdam 418 Rotterdam 433 Vlaardingen 433 Vlaardingen 444 De Zilk 444 De Zilk 448 Rotterdam 448 Rotterdam 538 Wieringerwerf 538 Wieringerwerf 620 Cabauw 620 Cabauw 636 Utrecht 636 Utrecht 641 Breukelen 641 Breukelen 643 Utrecht 643 Utrecht 738 Wekerom 738 Wekerom 741 Nijmegen 741 Nijmegen 742 Nijmegen 742 Nijmegen 820 Enschede 820 Enschede 934 Kollumerwaard 934 Kollumerwaard 937 Groningen 937 Groningen 938 Groningen 938 Groningen 543 Amsterdam 543 Amsterdam GGD Zaanstad GGD Zaanstad 1119 Schiedam 1119 Schiedam
Appendix D Uncertainties in trend analysis
A reduction target value of in between 10%-20% in 2020 as compared to 2010 is prescribed by European legislation for the PM2.5 concentrations at urban background stations. This implies an annual reduction of in between 1%-2% per year. In the BOP research program an estimate was made of the uncertainty in the trend analysis of time series for the annual mean value of PM10. For this analysis 8 monitoring stations were available, the length of the period (in years) of the time series was varied. Figure D1 shows the plot taken from the BOP report, which shows that the uncertainty decreases as the period of the time series increases. Furthermore one can see that the uncertainty in the trend is in between 1%-2% for a period of 10 years. The latter implies that the reduction target value over 10 years as prescribed by European legislation would not be observed in the case of PM10 since the uncertainty is of the same order of magnitude as the trend which needs to be detected. However, the trend can be detected if the length of the time series is more than 15 years.
y = 0.65x
-1.550.0%
1.0%
2.0%
3.0%
4.0%
5.0%
0
5
10
15
20
# years
U
n
ce
rt
ai
n
ty (
%)
PM10
PM10* meteo corr
Power (PM10)
Figure D1 Relation between the expected uncertainty in the trend of a PM10 time series as function of the length of the time series.
The figure also shows data which have been meteo-corrected: it is seen that this reduces the number of monitoring years in order to detect a certain uncertainty.
Apart from the length of the time series, the number of stations will also decrease the uncertainty in the measured trend of a time series. Figure D2 shows the time series of PM10 concentrations for individual stations. From this figure it is clear that there is a distinct variation in the time series for each station (left panel). An increase of the number of stations will hence decrease the uncertainty in the overall mean value of the measured component (right panel). Hence we have performed a more detailed calculation on the same data series, which allows for the calculation of how many years one needs to measure in order to detect a certain trend when the number of stations is varied as well
0 10 20 30 40 50 1990 1995 2000 2005 2010 PM10 annual mean regional background (µg/m3) 131 133 230 235 318 437 444 538 540 631 633 722 724 738 807 818 918 928 929 934
Figure D2 Annual mean PM10 concentrations ( g/m3) in the Netherlands (1992-2007) for rural stations, left panel. Average annual mean PM10 concentrations (thick blue line), right panel. The thin blue line signify the lower estimate for the average concentration on rural stations for the years 1992-2003
Taking the dependency of the variation into account for the uncertainty in the mean value one can calculate the number of years which need to be detected in order to measure a certain reduction: a summary of the results are shown in Table D1.
Table D1 The minimum number of years required to measure data in order to detect a statistical significant (95%) trend in the time series
Raw data Meteo-corrected
Number of stations: 12 8 4 12 8 4 1.0% reduction/year 16 16 18 12 13 15 1.5% reduction/year 12 13 13 9 10 11 2.0% reduction/year 10 10 11 8 8 9
The results from the calculations shown in Table A2 suggest that at least 12 monitoring stations are required in order to allow for a detection of trends which are prescribed by European legislation. It should be emphasised that the current calculation is an order-of-magnitude calculation. There are uncertainties in this estimation, for example the additional uncertainty due to monitor replacement is not included. However it is shown that the number of monitors need to be at least 12 in order to detect trends which have to satisfy the reduction target values. Of course this only proves that a trend significantly deviation from zero is present. To prove that the reduction target is obtained with a statistical significance of 95 % both a larger reduction and a larger number of stations is necessary.
Appendix E Consequences of the number of rural and
urban background stations on GCN
PM2.5in µg/m3 < 15 15 - 20 > 20 Annual PM2.5 concentration in 200 8 PM2.5in µg/m3 < 15 15 - 20 > 20 Annual PM2.5 concentration in 2008 (n=20)
Figure E.1 The GCN-map of 2008 (left panel) and the upper limit of the 95 % confidence interval for 20 stations (right panel).
The influence of the number of stations n=nurban+nrural on the GCN-map can be easily illustrated with the GCN-results of PM2.5 for 2008. The concentration in a GCN-map equals Cgcn±2σ, where 2σ is the estimated expended uncertainty (95% confidence level) which scales with n=nurban+nrural as mentioned above. Figure E.1 left panel shows the distribution of Cgcn where values higher than 20μg/m3 (=limit value for the AEI in 2015) are red-shaded, the right panel shows Cgcn+2σ with n=20. The two panels clearly illustrate that when one takes into account the uncertainty that the size of the critical areas (red-shaded) are increased and that the rate of increase is directly proportional with the number of background stations n=nurban+nrural. Table E.1 shows the size of the red-shaded area for the two maps in Figure E.1plus a map (not shown) with n=14 instead of n=20.
Table E.1 The size of the critical areas for PM2.5 (in km2) in 2008
Cgcn Cgcn+2σ(n=20) Cgcn+2σ(n=14)
Area > 20 μg/m3 11 36 46
The number of background stations additionally influences the possibility for determining the presence model inconsistencies. As an example of such a inconsistency a potential east west bias in the model calculation is studied. Figure E.2 shows the difference between calculated and observed values as a function of longitude. The figure seems to implies the existence of such a gradient over the east-west direction in the Netherlands. Already the possible gradient is dominated by only two locations and is difficult to determine. With a lower number of stations effective determination of model inconsistencies will be hampered. y = 0.024x + 4.1654 R2 = 0.36 0.0 2.0 4.0 6.0 8.0 10.0 12.0 0 20 40 60 80 100 120 140 160 180 X-coordinate (in km) O B P (i n u g /m 3 )
Figure E.2 The difference between observed and calculated annual mean value of PM2.5 as a function of longitude in the Netherlands. Blue dots indicate urban background sites and green dots indicate rural background sites.
National Institute for Public Health and the Environment
P.O. Box 1 | 3720 BA Bilthoven www.rivm.com