RIVM Report 717101001
Biodiversity Trends & Threats in Europe
development and test of a species trend indicator
M. de Heer, V. Kapos and B. J. E. ten BrinkMarch 2005
UNEP World Conservation Monitoring Centre - Cambridge, UK
The body text of this report is also published as a peer-reviewed scientific paper in the Philosophical Transactions of the Royal Society B: Biological Sciences (De Heer et al. 2005). The Royal Society has granted permission to reprint the text in this report (some minor modifications are made).
For more information, please conta c t :
Mireille de Heer, project coordinator (mireille. d e. h e e r @ r i v m.nl), or UNEP WCMC information desk (information@unep- w c m c. o r g )
This project was sponsored by the UK Depart m e nt for the Environment, Food and Rural Affairs (DEFRA; project nr. CRO296), the Swiss Agency for the Environment, Fo r e s ts and Landscape (SAEFL) and the Netherlands Environmental Assessment Agency (RIVM MNP). The cont e nts of this report do not necessarily reflect the views or policies of UNEP-WC M C, s p o n s o r s, cont r i b u t o ry organizations, editor(s) or publisher(s).
P r e f a c e
At the global level, Heads of State and Go v e r n m e nt have agreed to significantly reduce the rate of biodiversity loss by 2010. Within Europe, they have decided on an even more ambitious target of halting biodiversity loss in the same period. These 2010 ta r g e ts will require strong will and focussed action across a wide range of human activities and resulting pressures on biodiversity to ensure that they are reached successfully. They will also require b e tter quality data and information to help achieve and to monitor progress.
Indicators are increasingly recognised as one of the most importa nt forms of information for tracking progress and showing where action is required. They need to be scientifically sound with a clear and simple message that can be readily appreciated by experts, lay- p e o p l e, politicians and decision-makers alike.
S i g n i f i c a nt progress has been made during 2004 in agreeing the first sets of indicators to assess progress to the 2010 ta r g e ts; firstly within the Convention on Biological Diversity for the global target then, on the basis of the Convention set, at the pan-European and European Union level. Each set recognises the need for an indicator on the trends in the abundance and distribution of selected species.
This report provides a major contribution to the development of such an indicator by reviewing available data within Europe and showing how these data can be aggregated to produce an index (or composite indicator) for a range of species for which good data are already available. The report clearly sets out requirements for the indicator, the methodology for producing it and the data available. It then provides a step- b y-step example of how data can be aggregated to produce the composite indicator and hence how the indicator can be decomposed into its constituent parts. Those interested in the overall picture can appreciate and respond to the composite indicator whereas those concerned with action on specific t h r e a ts affecting individual species in different regions can make use of the relevant c o n s t i t u e nt parts.
As summarised in the report, further work is required to improve monitoring, the i n v o l v e m e nt of the many non- g o v e r n m e ntal organisations active in this field and data handling procedures and hence improve the quality of this key indicator. The pilot study p r e s e nted in this report will provide a very useful contribution to the upcoming process on the implementation of the 2010 indicators at the European, EU and national levels. It can also provide the basis to sta rt monitoring trends and for taking action to meet the ta r g e ts. There is not a moment to lose! We can improve the indicator as we proceed but if we lose b i o d i v e r s i ty we lose it for a long time, if not forever.
Gordon McInnes Deputy Director
C o nt e nts
S u m m a ry 71 . I nt r o d u c t i o n 9
2 . M e t h o d s 1 1
2 . 1 Geographical scope and classification of the study area 1 1 2 . 2 L o c a t i n g, mobilising and compiling data 1 2
2 . 3 Calculation and agg r e g a t i o n 1 5
3 . R e s u l ts 1 7
3 . 1 Evaluation of the available data 1 7 3 . 2 A first trial of the indicator 1 8
4 . Discussion and recommendations 2 3 4 . 1 D a ta mobilisation 2 3
4 . 2 H a b i ta ts and biogeographical regions 2 3 4 . 3 Composition and agg r e g a t i o n 2 4 4 . 4 R e l i a b i l i ty and sensitivity 2 5
4 . 5 Relation between the indicator and biodiversity loss 2 5 4 . 6 Po t e ntial for use at the national scale 2 6
4 . 7 Thematic indicators 2 6
4 . 8 Towards a European biodiversity monitoring framework 2 7
A c k n o w l e d g e m e nts 2 9
R e f e r e n c e s 3 1
Appendix 1 EU NIS habitat ty p e s 3 5
Appendix 2 Species- o r i e nted NGOs 3 8
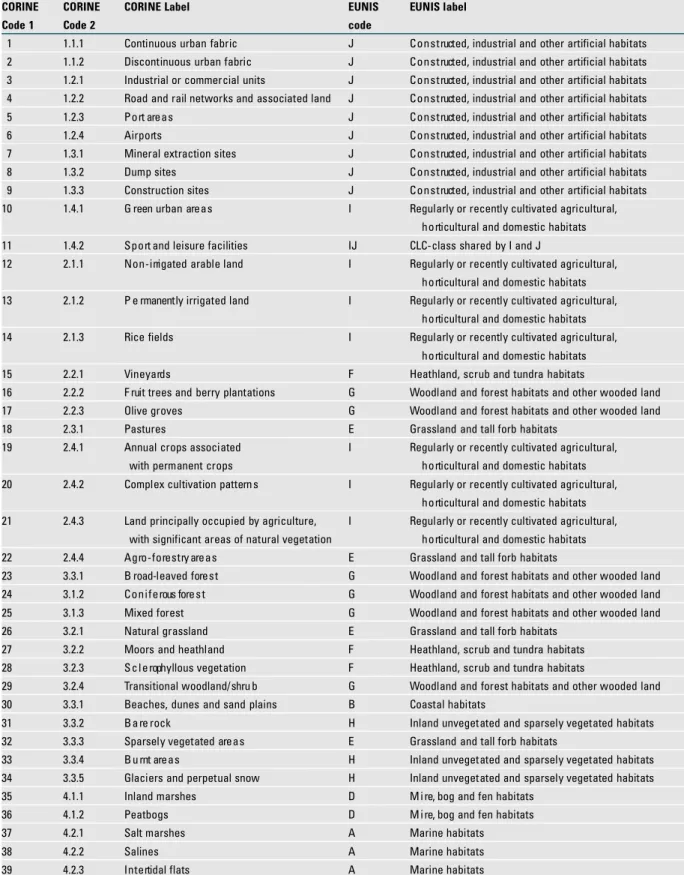
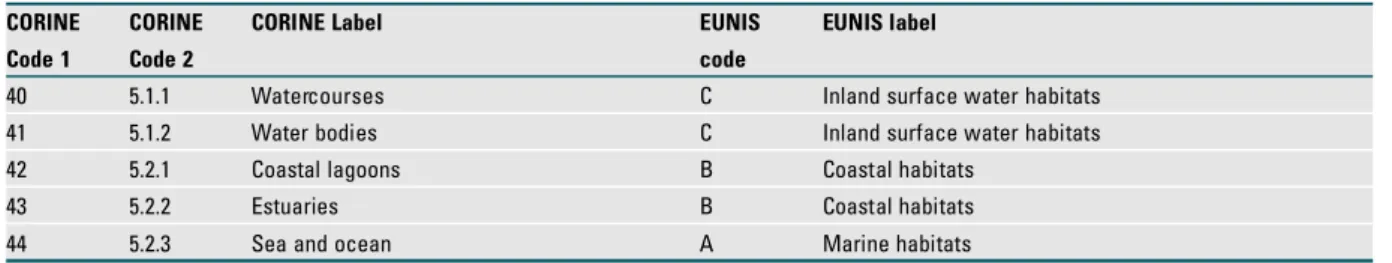
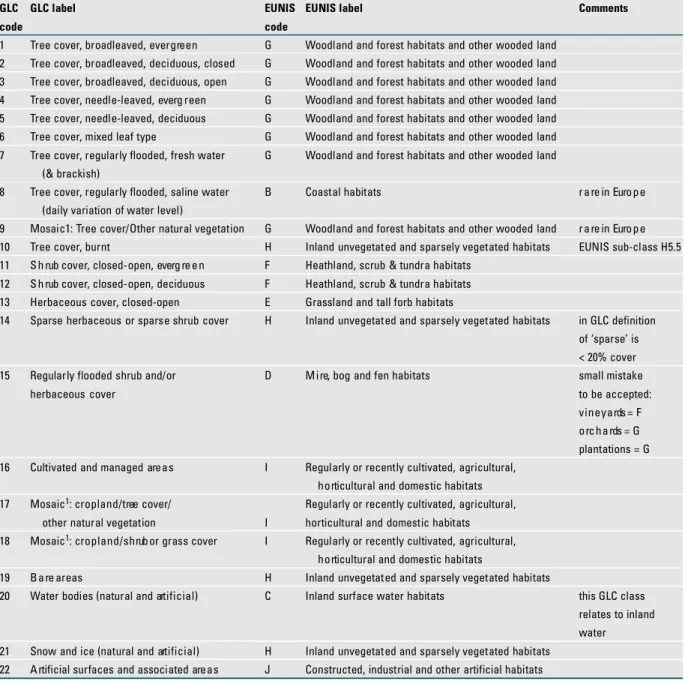
Appendix 3 Remap tables land cover – ecosystems 4 0
Appendix 4 Calculation and aggregation example 4 3
Appendix 5 Species sets 4 4
Appendix 6 Distribution of time series 5 2
Appendix 7 Evaluation of species sets 5 4
Appendix 8 Details on the UK index 6 5
Appendix 9 Causes of change 6 7
Appendix 10 Recommended actions 6 9
S u m m a ry
This report presents a trial of a species population trend indicator for evaluating progress towards the 2010 biodiversity target in Europe, using existing data. The indicator int e g r a t e s trends on different species (groups), and can be aggregated across habita ts and count r i e s. T h u s, the indicator can deliver both headline messages for high-level decision making and d e tailed information for in-depth analysis, using data from different sources, collected with d i f f e r e nt methods.
I nternational NGOs mobilised data on over 2800 historical trends in national populations of b i r d s, butt e rflies and mammals, for a total of 273 species. These were combined by habita t and biogeographical region to generate a pilot Pa n-European scale indicator. The trial indicator sugg e s ts a decline of species populations in nearly all habita ts, the largest being in f a r m l a n d, where species populations declined by an average of 23% between 1970 and 2000.
The indicator is potentially useful for monitoring progress towards 2010 biodiversity ta r g e ts, but constraints include: the limited sensitivity of the historical data, which leads to
c o n s e rvative estimates of species decline; a potential danger of ambiguity because increases in opportunistic species can mask the loss of other species; and failure to account for pre-1970 population declines. We recommend mobilising additional existing data, part i c u l a r l y for plants and fish, and elaborating further the criteria for compiling representative sets of s p e c i e s. For a frequent, reliable update of the indicator, sound, sensitive and harmonised b i o d i v e r s i ty monitoring programmes are needed in all countries across Pa n- E u r o p e.
1.
I n t r o d u c t i o n
In response to global concern over the rapid loss of the world’s biodiversity, the 6t h Conference of the Pa rties of the Convention on Biological Diversity (CBD) adopted a global target to reduce the rate of biodiversity loss by 2010 (CBD 2002). This ta r g e t, which was later endorsed by the World Summit on Sustainable Development (United Nations 2002), has also been adopted by a number of regional scale policies and processes. The European Union S u s tainable Development Strategy (2001a) and various other European Union policies (EC 1998, 2001b, c) set similar or even more ambitious biodiversity goals. The Pa n- E u r o p e a n Ministerial ‘E n v i r o n m e nt for Europe’ process adopted a resolution on halting the loss of b i o d i v e r s i ty by 2010 (UN/ECE 2003).
This widespread adoption of ta r g e ts for reducing the rate of biodiversity loss has highlighted a need for indicators that will allow policy makers to track progress towards these ambitious g o a l s. Recognising this need, the CoP of the CBD identified a series of biodiversity indicators for immediate testing (UNEP 2004). Such indicators are needed at national, regional and global levels. In June 2004 the Environment Council of the EU adopted a set of 15 headline indicators for biodiversity to evaluate progress towards the 2010 target (Council of the European Union 2004). This set was recommended by the EU Biodiversity Expert Group and i ts Ad Hoc Working Group on Indicators, Monitoring and Assessment, and the Malahide s takeholder conference (Anonymous 2004).
Both the CBD decision and the European documents recommend, among other indicators for immediate testing, indicators of trends in abundance and distribution of selected species. Species trend indicators are considered a sensitive measure of biodiversity change (Balmford et al. 2003; Ten Brink et al. 1991; Ten Brink 2000), and one such approach, composite species trend indicators, has been increasingly widely applied. In addition to the global-scale Living Planet Index (Loh 2002; Loh et al. 2005) there are several instances of the successful
i m p l e m e ntation of such indicators, principally at national scales (Jenkins et al. 2004). The UK Headline indicator of wild bird populations (Gr e g o ry 2003a) is one example. The European Bird Census Council (EBCC) has used a similar approach to develop the Pa n- E u r o p e a n Common Bird Index for farmland and woodland birds (Gr e g o ry 2003b; Gr e g o ry et al. 2005).
To address the need for regional scale biodiversity indicators in (Pa n-) Europe, this study set out to ident i fy suitable data and build upon existing methods to develop an appropriate indicator of trends in species abundance and distribution for use at the Pa n-European scale (the whole of Europe west of the Ural mountains and including the Anatolian part of Tu r k e y ; i. e. the European Union plus 18 other European countries). The target audience for the indicator is policy makers on the Pa n-European and national levels, who will use the indicator to support high-level decision-making on the environment and biodiversity-related sectoral a c t i v i t i e s. The indicator should also be suitable for informing the general public on b i o d i v e r s i ty trends. It should match the set of requirements as listed in the CBD general guidelines and principles for developing national-level biodiversity monitoring programmes and indicators (UNEP 2003a). These principles require that an indicator be, among other c h a r a c t e r i s t i c s: policy and biodiversity relevant; scientifically sound; broadly accepted; affordable to produce and update; sensitive; representa t i v e; flexible and amenable to a gg r e g a t i o n.
In this paper, we present a proposed method for calculating such a composite indicator to evaluate progress towards the 2010 target for terrestrial biodiversity in Europe, an evaluation of the existing data available for the purpose and our experience of mobilising them, and the r e s u l ts of a trial application of the proposed method to some of the available data. We also offer recommendations as to how the data and the methodology can be improved based upon this pilot experience.
2.
M e t h o d s
The challenges in developing an indicator on the trends in abundance and distribution of selected species lie in finding appropriate data, and in ident i fying how best to select the c o m p o n e nt trends and how to combine them in a way that is representative of the system and trends of interest. These require choices on the classification of the study area, selection of the species, and the procedure for calculation and agg r e g a t i o n.
2.1 Geographical scope and classification
of the study area
This study focused on the whole of Europe west of the Urals, including the Anatolian part of Tu r k e y. The area was categorised (Table 1) by combining the 11 Pa n- E u r o p e a n
biogeographical regions (Figure 1; Roekaerts 2002) with the 10 top-level habitat types from the EU NIS habitat classification adopted by the European Environment Agency (Appendix 1; Davies and Moss 2002). The EU NIS classes ‘Grassland and tall forb habita ts’ and ‘Regularly or r e c e ntly cultivated agricultural, horticultural and domestic habita ts’ have been merged into a single class, called ‘Fa r m l a n d’. By combining the biogeographical regions and the major h a b i tat types we aimed to cover the main variation in Europe’s biodiversity. We have termed the combination of a habitat type and a biogeographical region an ecoregion.
Biogeographical re g i o n A l p i n e A n a t o - A rc t i c A t l a n - Black B o re a l C o n t i - M a c a ro - M e d i t e r- P a n n o - S t e p p i c To t a l l i a n t i c S e a n e n t a l n e s i a n r a n e a n n i a n
EUNIS Habitat type
Marine habitats ? ? ? ? ? ? ? ? ? ? ? ?
Coastal habitats < 1 ? < 1 2 < 1 < 1 1 < 1 2 < 1 < 1 6
Inland surface
water habitats 1 5 ? 3 8 < 1 6 1 1 7 < 1 6 2 3 1 1 6
M i re, bog and
fen habitats 2 6 ? 6 1 8 1 2 3 4 < 1 2 1 2 8 3
Heathland, scrub and
tundra habitats 2 1 ? 1 3 5 3 < 1 1 1 6 2 1 3 6 2 2 2 4 6
Woodland and forest habitat
and other wooded land 3 3 6 ? 1 0 1 3 3 9 6 6 9 5 3 4 1 2 9 9 2 7 1 1 2 , 0 2 8
Inland unvegetated or
sparsely vegetated habitats 1 0 7 ? 6 2 1 3 < 1 2 1 3 1 9 < 1 1 6 2 2 2
C o n s t ructed, industrial and
other artificial habitats 6 ? < 1 4 1 < 1 8 6 6 < 1 1 5 8 3 1 4 8
F a rm l a n d 1 4 6 ? 3 0 5 3 9 8 1 7 7 1 , 1 9 8 2 5 8 1 1 2 1 1 0 1 2 , 9 0 9
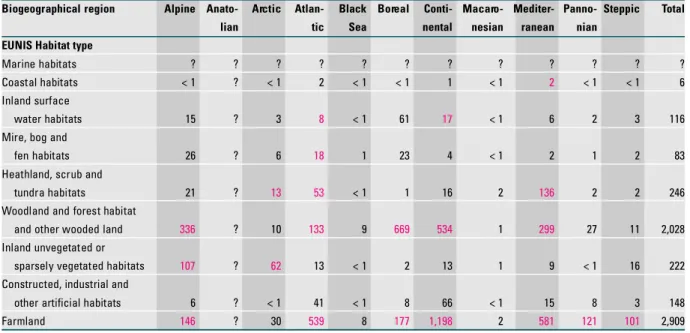
Table 1. The approximate areas (in thousands of km2) of the Pan-European ecoregions defined for this study by combining
biogeographical regions with EUNIS habitat types. Those ecoregions selected for the pilot study are in red. Note that the EUNIS classes ‘grasslands’ and ‘cultivated habitats’ have been merged into a new category: ‘farmland ’. The approximate area of each e c o region was calculated from GIS overlays of biogeographi cal regions (Roekarts 2002) with habitat maps derived from the CORINE land cover map (ETC/TE 2000) and the Global Landcover 2000 map (Batholome 2002). Parts of Russia, Ukraine and Turkey were not included in these statistics.
In this pilot study we have focussed on the 22 ecoregions in red in Table 1, which were selected based on an a priori estimation of the availability of relevant data, their size and their perceived importance for biodiversity.
2.2 L o c a t i n g, mobilising and compiling data
*
The various studies that have investigated ongoing biodiversity monitoring in Europe have concluded that the many monitoring activities existing at int e r n a t i o n a l, national and local scales are patchy and scattered among places and organisations, and there is litt l e
coordination among them (Delbaere & Nieto in prep.; ETC/NPB 2003; Fischer 2002). Moreover, with some exceptions, most of the monitoring programmes have been running for only a limited number of years. Compiling a European database of long-term trends is therefore a s i g n i f i c a nt challenge.
Much of the coordination that does exist is provided by species- o r i e nted non- g o v e r n m e nta l organisations (NGOs), which mostly have wildlife conservation as their main objective. To help direct their conservation activities, these NGOs rely on networks of experts and organisations from (nearly) all Pa n-European count r i e s, which are involved to varying degrees in
F i g u re 1. Biogeographical regions and countries in Pan-Europe (Roekaerts 2002)
* For any queries regarding the use of the data by third part i e s, please contact the project coordinator
( m i r e i l l e. d e. h e e r @ r i v m. n l; tel. 00 31 (0)30 274 21 27) or
monitoring and surveying programmes. The NGOs help to coordinate monitoring activities and to bring together the resulting data. In many countries the NGOs have access to
information that can not easily be obtained from more formal focal points for e. g. the CBD or the EEA. This is because the information has often not been collected in the framework of a formal governmental biodiversity monitoring programme. Thus these NGOs are European nodes that, with their netw o r k s, can provide a unique overview of, and access to large a m o u nts of data on status and trends in their focal species groups.
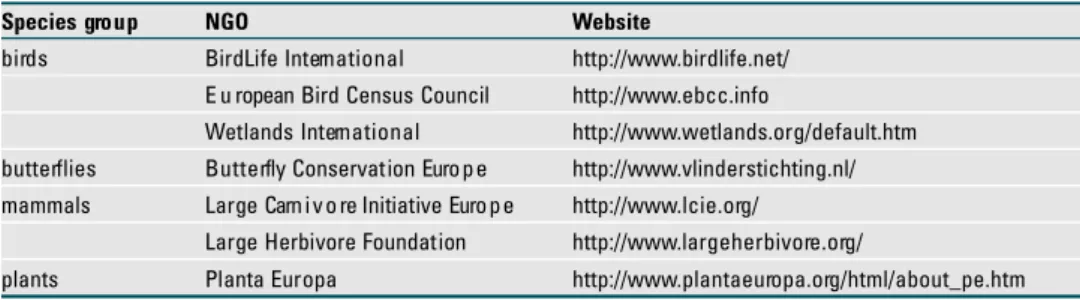
For this study, seven of largest and best established NGOs involved in species trend data collection throughout Europe were identified as the most promising providers of species trend data (Table 2, Appendix 2). These NGOs work with a broad range of partners (local NGOs, research institutes and universities, herbaria and botanical gardens, hunt e r s’ organisations, f o r e s t ry organisations, etc.) and accordingly draw on data collected in many different c o nt e x ts (conserv a t i o n, research, game management, policy support, public information, etc. ) .
The NGOs made available a number of major data sources (Table 3; Burfield et al. 2004; Va n S w aay 2004; Van de Vlasakker Eisenga 2004; LC IE 2004), including both existing European d a ta b a s e s, where data from many sources in many countries had already been brought t o g e t h e r, and data that were still held by the original researchers and brought together for this project. For breeding birds and butt e rflies in Pa n- E u r o p e, population trend data were available for a l l species and a l l c o u nt r i e s. For mammals, data availability was best for 5 species of large carnivores and 7 species of large herbivores in most of the relevant count r i e s. H o w e v e r, for mammals in quite a few countries the data are available for only one point in time and no trends can be calculated. For all three species groups data were mobilised for as many species as was possible within the context of this project, with the exception of invasive species and species with highly fluctuating populations that would hide long-term trends. The principal source of bird data, the European Bird Database has its own definition for this c a t e g o ry, and the NGOs and experts applied similar filters for the other taxonomic groups. In the context of this (pilot) project it was not feasible to collect data on plants and wint e r i n g water birds.
The original data were obtained by a wide variety of methods, including: • s tandardised monitoring schemes with fixed sampling sites
• estimates of total population size, either by direct observation or indirectly, e. g. inferred from the total number of shot animals
• c o u nts of number of populations or meta- p o p u l a t i o n s
• repeated distribution atlases (especially for butt e rflies) which were used to obtain a proxy of population decline (see also Thomas et al. 2004)
• e x p e rt judgement.
Table 2. The seven large NGOs used as the principal data providers for this study and their focal taxonomic gro u p s .
Species gro u p N G O We b s i t e
b i rd s B i rdLife Intern a t i o n a l h t t p : / / w w w. b i rd l i f e . n e t / E u ropean Bird Census Council h t t p : / / w w w. e b c c . i n f o
Wetlands Intern a t i o n a l h t t p : / / w w w. w e t l a n d s . o rg / d e f a u l t . h t m b u t t e rf l i e s B u t t e rfly Conservation Euro p e h t t p : / / w w w. v l i n d e r s t i c h t i n g . n l / m a m m a l s L a rge Carn i v o re Initiative Euro p e h t t p : / / w w w. l c i e . o rg /
L a rge Herbivore Foundation h t t p : / / w w w. l a rg e h e r b i v o re . o rg /
T h e r e f o r e, the original data were expressed in different units and were associated with v a rying degrees of uncerta i nty.
The two largest data sources for butt e rflies and birds, as well as the earliest mammal, counts date back to the 1970s. Ve ry few data are available for the 1980s, while data collection became far more common practice in the 1990s. Trends are therefore often given for a larger time int e rval of two or three decades, i. e. without intermediate years.
To address this variability, all data were re-expressed as the proportional change between a pragmatic baseline, the year 1970, and an approximation of the present, around the year 2000. In most cases the data were provided in classes (e. g. 30-50% decline), or indicated as ‘greater than’ or ‘less than’ (e. g. > 50% increase). In these cases the index was assigned respectively as the middle of the class (e. g. 40% decline) or the specified boundary value
Table 3. The principal data sources used by the NGOs to provide time series data for this study. Data derived from these sources were s t a n d a rdised as indices of population change between 1970 and 2000.
G ro u p Data sourc e ( s ) Number Lowest spatial C o v e r a g e Time interv a l R e f e re n c e of species re s o l u t i o n for which trends
a re available
b i rd s E u ropean Bird 5 1 5 c o u n t ry all Pan-Euro p e a n 1 9 7 0 - 1 9 9 0 , B i rdLife Intern a t i o n a l / E u ro p e a n
Database I and II c o u n t r i e s 1 9 9 0 - 2 0 0 0 B i rd Census Council (2000),
(EBD), incorporating B i rdLife International (2004)
data from the P a n - E u ropean Common Bird Monitoring Scheme
b u t t e rf l i e s Red Data Book of 5 7 6 c o u n t ry all Pan-European 1 9 7 0 - 2 0 0 0 Van Swaay & Wa rren (1999)
E u ropean butterflies c o u n t r i e s
(and underlying d a t a b a s e )
national and m a n y c o u n t ry or region many Pan-Euro p e a n varies by country see re f e rences in
regional atlases within country c o u n t r i e s Van Swaay (2004)
national monitoring m a n y c o u n t ry or re g i o n Finland, varies by country; see re f e rences in
s c h e m e s within country The Netherlands, f rom a few years Van Swaay (2004)
Spain, UK, Ukraine to since 1976 (UK)
mammals, Species Action Plans 5 c o u n t ry all Pan-Euro p e a n varies by species see re f e re n c e s
l a rge and many data c o u n t r i e s and by country ; in LCIE (2004)
c a rn i v o re s s o u rces residing since 1960-70
with individual re s e a rchers and i n s t i t u t e s
mammals, many data sources 7 c o u n t ry all Pan-Euro p e a n varies by species see re f e rences in
l a rge residing with individual c o u n t r i e s and by country ; Van de Vlasakker Eisenga
h e r b i v o re s re s e a rchers and since 1960-70 ( 2 0 0 4 )
( e. g. 50%). The value 1 was added to all indices to avoid calculation problems generated by zero values when taking logarithms.
The NGOs also supplied an indication of the data quality for each of the time series according to a standard set of categories developed for this project and provided autecological
information for each of the species.
Ideally the data on species trends would be collected at the level of ecoregions within c o u nt r i e s, but nearly all the data provided by the NGOs were available only at the level of c o u ntries (Table 3). Therefore, for each ecoregional index we included the national trends of those species using
the focal habitat within the biogeographical region (the ecoregion) as their primary habitat.
This approach is similar to that used for the European indicators of farmland and woodland birds (Gr e g o ry et al. 2 0 0 3 b, 2005). For breeding birds the link between species and ecosystems was made through the use of existing databases on the habitat preferences of the species, in combination with expert judgement from the international NGO (Burfield et al. 2004). Fo r b u t t e r f l i e s the link between species and habita ts was made through the judgement of national experts and the international NGO (Van Swaay, 2004). For those bird and butt e rf l y species considered to be specific for a certain habita t, but occurring in more than one biogeographical region in a count ry, the same national trend was assigned to all biogeographical regions. For m a m m a l s the link between the species and the habita ts was based on the information provided by the NGOs (LC IE 2004; Van de Vlasakker Eisenga 2004) and additional expert judgement. The mammal species were assigned to the habita ts and biogeographical regions where the majority of the populations occur.
2.3 Calculation and agg r e g a t i o n
For each ecoregion, species population trend data are incorporated for each count ry. The combination of an ecoregion and a count ry is termed a building block and is the lowest level for the data of this indicator. For each of the building blocks the indicator is calculated as the geometric mean of the trends (indices) of the selected species. Species from all species groups are taken together; every species has equal weight. The results can then be aggregated on an a r e a-weighted basis. Thus, for a given ecoregion, the index is the average of each of the building block indices in the ecoregion, weighted by the area of the building block. Fo r e x a m p l e:
A t l a ntic Forest (AF) Ecoregion Index =
∑ [(AF index Ireland)(area AF in Ireland)] + [(AF index UK)(area AF in UK)] + . . .
To tal area of AF
The resulting ecoregional indices can then be similarly aggregated towards the habita ts. T h u s, a European Forest species trend indicator would be obtained by averaging all of the forest ecoregion indices on an area-weighted basis.
The data on area of the building blocks were obtained from GIS overlays of countries with biogeographical regions (Roekaerts 2002; downloaded from EEA website) and habita ts.
H a b i tat maps were derived from the CORINE land cover map (ETC/TE 2000; coverage: EU 2 5 , with the exception of Sweden, Cyprus, Malta and Bulgaria, Romania) or from the Global La n d Cover 2000 map (Bartholome 2002) for those countries not included in the CORIN E
a s s e s s m e nt (see Appendix 3 for remap ta b l e s ) .
Finally, the results can be aggregated towards an index for Europe as a whole, by a ggregating across the habita ts. All habita ts are given equal weight, by applying a non-weighted averaging of the values per habitat. The results can also be aggregated by individual countries or clusters of count r i e s. Appendix 4 p r e s e nts an example of the calculation and aggregation procedure.
3 .
R e s u l t s
3.1 Evaluation of the available data
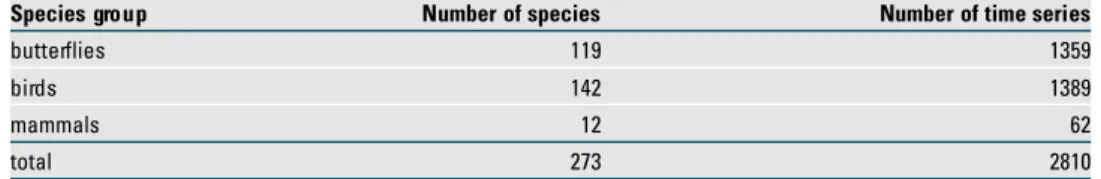
In total the NGOs mobilised data on 2810 time series for 273 unique species, which are mostly birds and butt e rf l i e s, but also include some large mammals (Table 4). The number of species per ecoregion ranged from 6 in Atlantic mires, bogs and fens to 38 for Mediterranean farmlands (Table 5, see Appendix 5 for species lists), with an average of 22 species per eco-r e g i o n. The data come feco-rom 43 count eco-r i e s, with an aveeco-rage of aeco-round 5 ecoeco-regions peeco-r c o u nt ry (Appendix 6).
Generally the data are well distributed across the habita ts, biogeographical regions and c o u nt r i e s. Countries with a large area of a given ecoregion usually have a fairly large number of time series for that ecoregion. There are more than 50 time series available for most h a b i ta ts, with the exception of the EU NIS class ‘M i r e s, bogs & fens’ for which only 8 time series are available. Over 900 time series were available for farmland. Over 100 time series were available for all but three biogeographical regions, the Steppic, Arctic and Pa n n o n i a n. Only very few data could be obtained for Bosnia and Herzegovina, Yugoslavia (Serbia and M o ntenegro) and some of the very small count r i e s.
The autecological information provided by the NGOs showed that the species set, both as a whole and for most ecoregions, includes representatives of most guilds (herbivores, c a r n i v o r e s, piscivores, insectivores, omnivores), species with a wide range of dispersal d i s tances and area requirements, and migratory as well as sedenta ry species (Appendix 7) . Both rare and common species, and both threatened and non-threatened species were included in the data for all count r i e s, and some endemic species were included for all e c o r e g i o n s. The NGOs’ assessments of the causes of change indicate that the dataset includes species with different sensitivities to all major human pressures as well as species that seem not to be very sensitive to human activities.
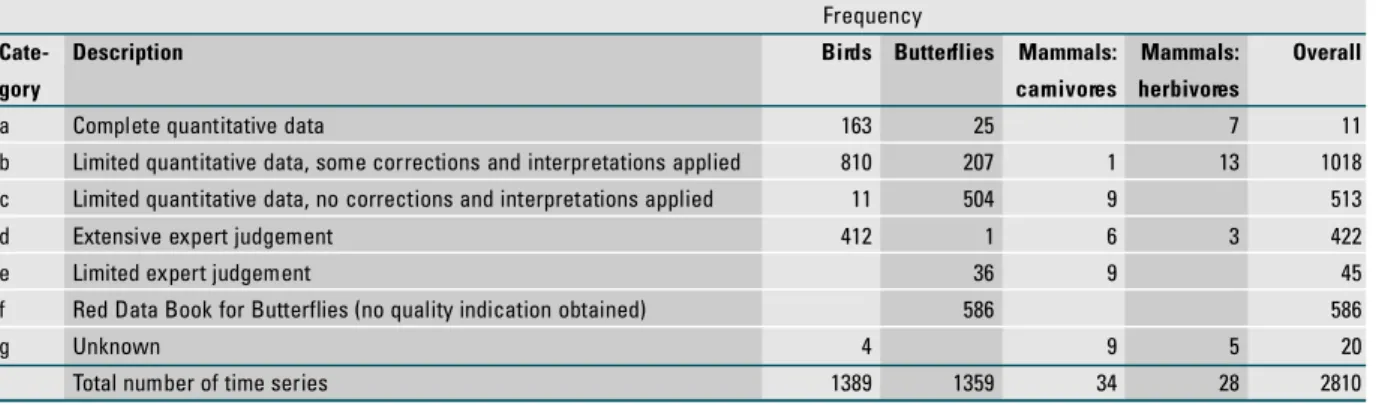
The categorisation of data quality provided by the NGOs (Table 6) shows that the majority were based on limited quant i tative data with some corrections and int e r p r e tation by experts. Especially for butt e rf l i e s, these include measures of change in distribution, which are oft e n relatively conservative measures of overall change. A minority of the time series were based on complete quant i tative data.
Table 4. The total number of unique species and the total number of time series obtained
Species gro u p Number of species Number of time series
b u t t e rf l i e s 1 1 9 1 3 5 9
b i rd s 1 4 2 1 3 8 9
m a m m a l s 1 2 6 2
3.2 A first trial of the indicator
The data described above were the basis for the first trial of the indicator. From the total of 2810 time series, we excluded the 513 time series with class c quality (Limited quant i ta t i v e d a ta, no corrections and int e r p r e tations applied). These were mainly butt e rfly data, derived from repeated atlases but without corrections for changes in recording int e n s i ty, and therefore potentially misleading. Most of the remaining 2297 time series showed either sta b l e or decreasing populations within a building block (Figure 2), while a minority (19%)
r e p r e s e nted increasing populations. About 1% of the time series showed local extinction of the species within a building block.
A further 60 time series were excluded because they related to building blocks of unknown area (small and fragmented habita ts not detected by the land cover maps). La s t, European Russia (72 time series) was excluded, to avoid the indicator being dominated by one single c o u nt ry. Thus, 2165 time series were used for this first analysis.
When calculated for each major habitat type at Pa n-European scale, the indicator shows that populations declined in nearly all habita ts between 1970 and 2000. Farmland showed the largest decrease in population index, 23%; all of the natural habita ts had much smaller calculated changes (Figure 3). The population index for natural habita ts collectively showed a decline of only 2%, which cont r a s ts strongly with the index for farmland (Figure 4) .
Table 6. The quality of the data included in the pilot indicator, shown as the number of time series belonging to each data quality c a t e g o ry for each taxonomic group.
F re q u e n c y
C a t e - D e s c r i p t i o n B i rd s B u t t e rf l i e s M a m m a l s : M a m m a l s : O v e r a l l
g o ry c a rn i v o re s h e r b i v o re s
a Complete quantitative data 1 6 3 2 5 7 1 1
b Limited quantitative data, some corrections and interpretations applied 8 1 0 2 0 7 1 1 3 1 0 1 8
c Limited quantitative data, no corrections and interpretations applied 1 1 5 0 4 9 5 1 3
d Extensive expert judgement 4 1 2 1 6 3 4 2 2
e Limited expert judgement 3 6 9 4 5
f Red Data Book for Butterflies (no quality indication obtained) 5 8 6 5 8 6
g U n k n o w n 4 9 5 2 0
Total number of time series 1 3 8 9 1 3 5 9 3 4 2 8 2810
Table 5. The number of (unique) species incorporated into the pilot indicator per ecoregion. Only those habitat types and biogeographical regions addressed in the pilot indicator are included.
Biogeographical re g i o n A l p i n e A rc t i c A t l a n t i c Black B o re a l C o n t i - M a c a ro - M e d i t e r- P a n n o - S t e p p i c S e a n e n t a l n e s i a n r a n e a n n i a n
Coastal habitats 2 7 1 6
Inland surface water habitats 2 0 2 1
M i re, bog and fen habitats 6
Heathland, scrub and tundra habitats 1 2 1 7 1 7
Woodland and forest habitat and
other wooded land 3 1 2 3 3 6 3 5 2 3
Inland unvegetated or sparsely
vegetated habitats 1 5 3
F i g u re 2. Distribution of the direction of change among the 2297 time series obtained. Those classed as stable showed no net change in population between 1970 and 2000 (0 was the midpoint of the range of possible change). Those classed as decreasing or increasing had non-zero change, and a few time series showed the species becoming extinct within the building block.
F i g u re 3. The percentage change in the species population index of each EUNIS habitat between 1970 and 2000. The number of time series included in the index for each habitat is shown in brackets as (bird s , b u t t e rflies, mammals).
F i g u re 4. The percentage change in species population index between 1970 and 2000 for natural and f a rmland habitats at Pan-European scale (43 countries). Number of time series in brackets.
F i g u re 5. The percentage change in species population index of farmland species between 1970 and 2000, showing that declines were much larger in the 15 European Union Countries than in the 10 countries that acceded to the EU in May 2004 or the non-EU countries. Number of time series in brackets.
F i g u re 6. The average percentage change in bird species population index between 1970, 1990 and 2000. Little evidence of change in the rate of decline is visible for most habitats. Number of time series for each habitat in brackets.
F i g u re 7. Example of the indicator for a single country. The graph shows the percentage change in species population index per habitat, for the United Kingdom. Number of time series (in this case equal to the number of unique species) in brackets. For details on species, time series and sources for the UK i n d i c a t o r, see Appendix 9.
Given the strong decline in farmland species at Pa n-European scale, it is of interest to examine the indicator in a form that may be more directly policy- r e l e v a nt, for example in relation to the European Union’s Common Agricultural Po l i cy. Figure 5 shows that farmland species have experienced much greater population declines over the past three decades in the fifteen member countries of the European Union than in the ten recently (May 2004) acceded countries or in the remaining 18 countries in Europe. The indicator can potent i a l l y be calculated for other policy- r e l e v a nt clusters of count r i e s.
This application shows one way in which the indicator can have strong policy relevance. H o w e v e r, in order for it to be useful in evaluating progress towards policy ta r g e ts relating to rates of biodiversity loss (e. g. the 2010 target) it would be necessary to calculate average index changes over different time int e rv a l s. At a minimum, three points in time would be needed to determine whether the rates of loss of biodiversity were changing as needed. Within the scope of this project, birds were the only group for which data could be mobilised for an intermediate point in time. The addition of a 1990 data point for the birds (Figure 6) gives some indication of changes in the rate of species decline for some habita ts, but with the data available it is difficult to say whether the changes in the rate of loss are s i g n i f i c a nt.
Although this pilot project focused on testing the indicator at the European level, the indicator method has also been designed to be suitable for use on the national level, using the same types of data. For example, applying the method at national scale in the United Kingdom (Figure 7, Appendix 8) makes it possible to see clearly the national trends in species within particular habita ts; the UK, like the rest of Europe, has experienced major declines in farmland species over the past three decades. Individual countries may find it useful to adopt this approach. Using consistent indicators at different scales can provide insights into trends that may require special att e ntion at particular scales of policy and decision- m a k i n g.
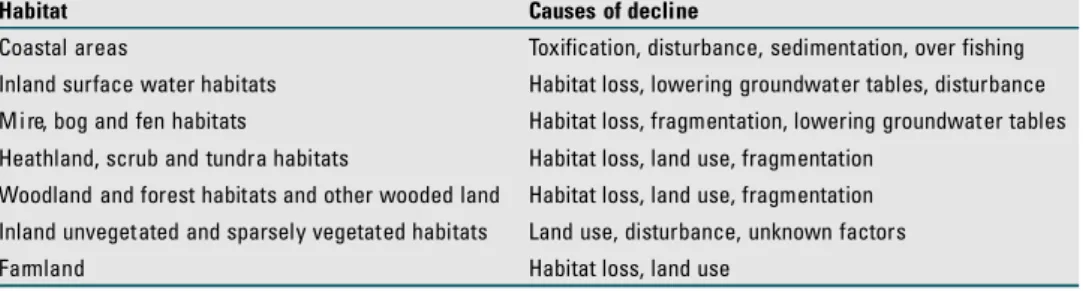
La s t, policy-makers do not only need to know about the status and trends of biodiversity, but also about the causes of the indicated changes. Causes of change can best be analysed using ecological models which quant i tatively relate species to pressures. At the moment on the European scale such models are available for some pressures (e. g. climate; Bakkenes et al. 2001), but models which calculate the overall impacts of all major pressures on species on this scale are still under development. Therefore, in this study we used an alternative approach to make a first, preliminary analysis of the causes of change in the indicator (Appendix 9). This analysis shows that causes of species decline vary per habita t, with habita t loss and land use being the most frequent factors across the habita ts, followed by
4.
Discussion and recommendations
*
In this study we have piloted a species trend indicator, which integrates trends of different species and species groups and can make use of data coming from different sources, collected with different methods. The indicator can be aggregated from its building blocks towards h a b i ta ts on the European level, biogeographical regions and also towards (clusters of) c o u nt r i e s. Thus, the indicator can deliver both headline messages for awareness raising and h i g h-level decision making and detailed information for in-depth analysis. The method is p o t e ntially suitable for evaluating progress towards the 2010 target; the data compiled in this study make it possible to establish a first estimate of the rate of biodiversity loss in the period 1970-2000, with which subsequent estimates for later periods can be compared.
4.1 D a ta mobilisation
We have demonstrated that int e r n a t i o n a l, species- o r i e nted NGOs, with their European- w i d e n e tw o r k s, are effective mechanisms for mobilising the substa ntial quant i ty of existing data on species trends, at least for breeding birds, butt e rflies and large mammals. Within the
taxonomic groups and ecoregions covered in this trial, data are available for nearly all s p e c i e s, covering a broad range of ecological characteristics, and making it possible for the indicator to represent a broad cross-section of biodiversity in Europe. Targeted efforts are now needed to ident i fy and mobilise historical trend data for other taxonomic groups, and for those ecoregions not included in this (pilot) study. Species groups that have not been covered in this pilot study but for which substa ntial amounts of data are probably available include vascular plants, freshwater and marine fish, water birds (Gilissen et al. 2002), and marine m a m m a l s. In addition, specific efforts are needed to obtain data from countries and regions, such as European Russia and the arctic region, which were not effectively targeted by the d a ta mobilisation strategy of this study. Additional data from intermediate points in time (e. g. 1990) would increase the utility of the indicator for monitoring progress towards the 2010 target. International NGOs and national sources both have vital roles to play in mobilising existing data.
4.2 H a b i ta ts and biogeographical regions
The top-level of the EU NIS habitat classification, has generally proven to be a useful basis for s t r a t i fying the species trend indicator. We adopted the farmland category because it was difficult to link species data clearly to either of its component classes (‘g r a s s l a n d’ and
‘cultivated area’). This category will continue to be useful for future work. Additional merging b e tween EU NIS classes may be advisable in the future because some classes have few, if any, species strictly limited to them. This is especially the case for the class ‘M i r e s, bogs and fens’ . In addition, an improved approach is needed for handling habitat associations for those s p e c i e s, especially large mammals, which usually use more than one habita t .
F u rther difficulties in aggregation arose because of the limited precision of habitat maps derived from landcover mapping, which made it difficult to obtain areas for relatively f r a g m e nted habita ts and ecoregions such as mires, bogs and fens, and those which are less easily detected via remote sensing. The use of biogeographical regions, though ecologically and politically useful added to the demands on the data; working with only habita ts and c o u ntries would be more straightf o rward and is recommended for future work.
4.3 Composition and agg r e g a t i o n
The degree to which the index is representative of overall biodiversity trends is obviously a function of the species composition and the way the data are agg r e g a t e d. In this trial application the lack of inclusion of taxonomic groups other than mammals, birds and b u tt e rflies has implications that vary by major habitat ty p e. For example, incorporating data on freshwater fish or amphibians would increase the validity of the indicator for inland s u rface water habita ts. The addition of data on plants would potentially improve the r e p r e s e ntation of all habita ts. Furt h e r m o r e, at present the species are combined without regard to whether particular taxonomic groups are represented by greater numbers of time series than others. This could mean that a particular group dominates the indicator and leads d e c i s i o n-makers to draw conclusions that are more applicable to it than to other groups. A solution to this might be to adopt a staged aggregation procedure, whereby species are first averaged across their species groups (e. g. plants, invertebrates and vertebrates) and the groups are then combined with equal (or potentially other) weightings applied between the g r o u p s. However this approach is dependent on having sufficient data for each species group for each building block to produce a meaningful average. Problems of the same type are discussed by Loh et al. ( 2 0 0 5 ).
The composition of the indicator with respect to the ecological characteristics of the species is also importa nt. At present no quant i tative criteria are applied to specify the balance among species with different characteristics, e. g. how many sedenta ry species versus how many m i g r a t o ry species and how many threatened (red list) species versus how many non-threatened species. The linking of species to habitat types may have in some cases effectively excluded habitat generalist species. Rare species are included alongside common ones and only species with widely fluctuating populations are excluded. The inclusion of data on rare species cont r a s ts with the approach taken by others, for other purposes, for example in the UK bird indicator (Gr e g o ry et al. 2 0 0 3 a,b). Excluding data on fluctuating species is common p r a c t i c e. While reducing noise in the data s e t, it risks failing to detect and incorporate any l o n g-term trend in these species.
All of these factors suggest that it would be useful to devote more effort to developing f u rther the criteria for building the set of species included in the indicator and to considering how best to combine species within the indicator. Such criteria could usefully include guidelines for the minimum number of species within a building block for which the indicator generally can be considered robust, and should also address alternative approaches for aggregation and weighting. We used area-weighted aggregation in this pilot because weighting building blocks by the proportion of the total population size within them is not feasible across all taxonomic groups. It is more rigorous than applying no weighting during a ggregation from one spatial scale to another.
4.4 R e l i a b i l i ty and sensitivity
The pilot indicator covers such a large number of species and time series over such a long p e r i o d, that it is likely to be fairly robust. For the ecoregions covered by the pilot study, we do not believe that the patterns shown by the indicator would be altered significantly by the inclusion of additional species or time series from the same taxonomic groups. A sta t i s t i c a l analysis of the reliability and sensitivity of the indicator has yet to be carried out. It should include the calculation of confidence int e rv a l s, which would best be done using boots t r a p p i n g.
The limited sensitivity of many of the data included limits the sensitivity of the indicator. Not only are many of the estimated trends relatively conservative (e. g. those derived from distribution changes), but they are provided in relatively coarse classes so that they will tend not to pick up changes less than 15%. This limitation can best be overcome by esta b l i s h i n g monitoring programmes that will generate consistent quant i tative data (see below).
The different categories of data quality have different implications for the different ta x a. The exclusion of time series based on limited quant i tative data without correction (data quality c) has eliminated the most uncertain data for butt e rf l i e s, and also significantly reduced the q u a nt i ty of carnivore data that could be included. It had little effect on the bird or herbivore d a ta included. For these ta x a, expert judgement contributed a significant proportion of the time series data, and the implications of this may need to be explored furt h e r.
4.5 Relation between the indicator and
b i o d i v e r s i ty loss
The basic assumption behind this indicator is that, in addition to telling the user something about the trends in the component species, it represents wider trends in biodiversity. These are of interest in the context of policy and decision-making that affect progress towards the 2010 target on biodiversity loss.
B i o d i v e r s i ty loss is characterised by the decrease in abundance of many species and the increase of some – often opportunistic – species, as a result of the environmental impacts of human activities (McKinney & Lockwood 1999; UNEP 2003a, 2003b). In this pilot indicator, increases in species populations since 1970 contribute to higher values of the indicator; and decreases to lower values. However, this simplistic approach raises two issues:
1 . An increase in population of a species since 1970 cannot always be considered a biodiversity g a i n, and a decrease cannot always be considered a loss. This can even be the case for species that are considered characteristic of a certain habitat. Examples include the increase of freshwater birds due to eutrophication of their habita t, the increase of Molinia sp. due to eutrophication of heathlands and the increase of many bird species in marshes and dune areas which have become overgrown by shrubs due to nutrient enrichment. Thus, with the approach used, the message of the indicator is potentially ambiguous, which conflicts with the requirement of being meaningful and simple to understa n d.
2 . B i o d i v e r s i ty changes before 1970 (often large losses) are not addressed by the indicator. Changes since 1970 might be very small in comparison to these losses (see also Hutchings & Baum 2005; Pauly et al. 2005), and may differ significantly among countries and habita ts. T h e r e f o r e, change relative to the year 1970 provides incomplete information that will not necessarily be appropriately interpreted by policymakers and the public.
Modelling species abundance under reference (e. g. low human impact) conditions could be used to help resolve ambiguity in the indicator and put recent changes into meaningf u l c o ntext. Building such a scenario would require information on historical and geographical trends and qualitative and quant i tative ecological knowledge.
4.6 Po t e ntial for use at the national scale
As demonstrated using the United Kingdom as an example, the indicator method and the European database can potentially be used to calculate species trend indicators for individual c o u nt r i e s. These may complement biodiversity data and indicators already in use at national l e v e l, which in turn could also contribute to European scale indicators. For example, in the UK several species (trend) indicators in use include: the UK headline indicator for wild bird populations (Gr e g o ry et al. 2003a); trends for butt e rflies (Asher et al. 2001); and trends for p l a nts (Preston et al. 2003). Also, trend indicators are available on Biodiversity Action Plan ( BAP) priority species. However, there is no indicator in use that combines the trends across species groups. Additional differences in approach, for example regarding habita t
c l a s s i f i c a t i o n, species selection criteria (selecting all species vs. focusing on habita t - s p e c i a l i s ts ) and different sources for species- h a b i tat associations mean that no direct comparison of indicator results can be made. In some cases different data sources were used; in those cases usually the European project had access to less precise data. Working towards furt h e r harmonisation of indicator methodologies and exchange of data, would enhance the synergy b e tween national and European work on indicators.
4.7 Thematic indicators
A further application of this indicator method and the data available is to generate trend indicators for different subsets of species that address particular issues. Such subsets can for example be based on taxonomy, policies, ecological characteristics, or related to part i c u l a r p r e s s u r e s. Examples are:
• species of the Habita ts and Birds Directives
• Red List species or Species of European Conservation Concern (SPEC) • species for which species action plans are in place, e. g. large carnivores • species which are hunted or otherwise exploited
• species with particular ecological characteristics, such as water birds with feeding strategies that might be related to their reaction to eutrophication of freshwaters, or s e d e nta ry versus migratory species.
• b u tt e rflies with northern distribution versus butt e rflies with a southern distribution, to explore a potential relation with climate change.
The analysis of the population trends of subsets of species, and comparison with the overall-trends or overall-trends in contrasting groups, will have a value on its own for assessments and c o n s e rvation planning, and will also help to obtain a better understanding of the overall-indicator and the causes of change.
4.8 Towards a European biodiversity monitoring
f r a m e w o r k
With the current level of ad hoc and structural data collection in Europe we estimate that it will be possible to update this indicator meaningfully and reliably only after approximately another 3 decades. This is due to the lack of sensitive and frequent data on species trends. To allow more frequent and reliable updating of the indicator, implementation of long- t e r m monitoring will be needed under a common European biodiversity monitoring framework. Such a framework would provide guidelines and manuals to help countries implement national monitoring schemes that meet their own national needs. The only requirement would be that the design of the monitoring schemes would be such that the results (indices, not raw data) could feed into the European picture. The Pa n-European Common Birds Monitoring Scheme (PEC BMS) is a good example of such an approach (Gr e g o ry et al. 2 0 0 5 ) . The guidelines should for example consider stratification, suitable measuring methods, selection of species and dimensions of monitoring schemes (number of plots and frequency of recording).
The monitoring schemes should be built as far as possible on existing initiatives. They should preferably use direct measures of changes in population size rather than less sensitive p r o x i e s, such as changes in distribution area. Furt h e r m o r e, the number of plots and f r e q u e n cy of measuring (dimensions of the scheme) should be high enough to allow the production of sensitive indices of change. The final decisions on the dimensions of
monitoring programmes will of course be based on the balance between costs and benefits at both national and European scales. Int e r n a t i o n a l, species- o r i e nted NGOs, with their n e tworks of experts and organisations in all European count r i e s, can potentially play a unique and essential role in the design and implementation of European biodiversity m o n i t o r i n g.
Appendix 11 p r e s e nts a summary of recommendations for the development of monitoring programmes per species groups, based on recommendations of the NGOs.
A c k n o w l e d g e m e nts
We would like to thank the funders of this study: the Swiss Agency for the Environment, Fo r e s ts and La n d s c a p e, the UK Depart m e nt for Environment, Food and Rural Affairs (DE F R A ) and the Netherlands Environmental Assessment Agency (RIV M-MNP).
The following individuals and NGOs were instrumental in providing data: Chris van Swaa y (Dutch Butterfly Conservation), Ian Burf i e l d, Rob Pople and Ward Hagemeijer (BirdLife and E B C C), Luigi Boitani and Agnieszka Olszanska (Large Carnivore Initiative Europe), Joep van de Vlasakker and Fred Baerselman (Large Herbivore Foundation). A vast army of experts and o r g a n i s a t i o n s, who are partners of these NGOs, collected the data in the field agreed to their use in this project. GIS analyses for the project were performed by Michel Bakkenes (RIV M-M N P ) .
The conceptual framework of the indicator was developed in collaboration with the project on the development of a European Biodiversity Index (OLI28) by the European Topic Cent r e for Nature Protection and Biodiversity (lead by Vibeke Horlyck).
Andrew Stott and Rocky Harris (both DEFRA), James Williams (UK Joint Nature Conservation C o m m i t t e e), Jos Notenboom (European Environment Agency) and Arco van Strien (S t a t i s t i c s N e t h e r l a n d s) provided advice and stimulating discussions.
R e f e r e n c e s
A n o n y m o u s. 2004. Final message from Malahide. Halting the loss of biodiversity. Priority objectives and targets for 2010. htt p: / / www. e u 2 0 0 4 . i e / t e m p l a t e s / d o c u m e nt _ f i l e.asp? id=17810 (downloaded 1 Oct. 2004).
A s h e r, J, Wa r r e n, M., Fo x, R., Harding, P., Jeffcoate, G. & Jeffcoate, S. 2001. The millennium atlas of butterflies in Britain and Ireland. Oxford University Press, Oxford.
B a k k e n e s, M, Alkemade, J. R. M., Ihle, F., Leemans, R. & La t o u r, J. B. 2001. Assessing effects of forecasted climate change on the diversity and distribution of European higher plants for 2050. Global Change Biology 8: 390-407.
B a l m f o r d, A., Gr e e n, R. E., and Jenkins, M. 2003. Measuring the changing state of nature. Trends in Ecology and Evolution 18: 326-330.
B a rtholome E., Belward, A. S., Achard, F., Barta l e v, S., Carmona- M o r e n o, C., Eva, H., Fritz, S. , Gr e g o i r e, J- M., Mayaux, P., & Stibig H- J. 2002. GLC 2000 Global Land Cover mapping for the year 2 0 0 0. European Commission Joint Research Centre Institute for Environment and
S u s ta i n a b i l i ty. EUR 20524 EN, Ita l y.
BirdLife Int e r n a t i o n a l. 2004. Birds in Europe 2: population estimates, trends and conservation s t a t u s. BirdLife Int e r n a t i o n a l, Wa g e n i n g e n, The Netherlands.
BirdLife International/European Bird Census Council. 2000. European bird populations: estimates and trends. BirdLife Conservation series no. 10. BirdLife Int e r n a t i o n a l, Cambridge, U K .
B u rf i e l d, I. J. Po p l e, R. G., Hagemeijer, E. J. M., & Nagy, S. P. 2004. Bird population trends and threats in Europe. Unpublished report by BirdLife International & European Bird Census C o u n c i l. BirdLife Int e r n a t i o n a l, Wa g e n i n g e n, The Netherlands.
C BD. 2002. Decision VI/26 Strategic Plan for the Convention on Biological Diversity.
( h tt p: / / www. b i o d i v.org/decisions/ default.aspx?lg=0&dec=VI/26 Accessed 1 October 2004).
Council of the European Union. 2004. Halting the loss of biodiversity by 2010 – Council c o n c l u s i o n s. 10997/04, unofficial information note. (htt p: / / www. i b o t . c a s. c z / b i o p / t e x ts / C o u n c i l _ C o n c l u s i o n s _ 3 0 _ J u n e _ 2 0 0 4 % 5 B 1 % 5 D.doc Accessed 1 October 2004).
De Heer, M., Kapos, V., Ten Brink, B. J. E. 2005. Biodiversity Trends in Europe: development and testing of a species trend indicator for evaluating progress towards the 2010 target . Ph i l. Tr a n s. R. S o c. Lond. B.
D a v i e s, C. E. & Moss, D. 2002. EUNIS habitat classification. 2001 work programme, final report. CEH Monks Wo o d, Hunt i n g d o n, UK.
D e l b a e r e, D. and Nieto, A. in prep. National Biodiversity Monitoring Networks in Europe.
EC. 1998. Communication of the European Commission to the Council and to the Parliament on a European Community Biodiversity Strategy. Brussels. (htt p: / / e u r o p a. e u. i nt / c o m m /
EC. 2001a. A Sustainable Europe for a Better World: A European Union Strategy for Sustainable D e v e l o p m e n t. COM(2001)264 final – Brussels. (htt p: / / www. e u r o p a. e u. int / e u
r-lex/en/com/cnc/2001/com2001_0264en01.pdf Accessed 1 October 2004)
EC. 2001b. Communication from the Commission to the Council and the European Parliament -Biodiversity Action Plans in the areas of Conservation of Natural Resources, Agriculture, Fisheries, and Development and Economic Co-operation. Brussels. (htt p: / / b i o d i v e r s i
ty-c h m. e e a. e u. i nt / ty-c o n v e nt i o n / ty-c b d _ e ty-c / s t r a t e gy / BAP_html Aty-cty-cessed 1 Oty-ctober 2004).
EC. 2001c. E nvironment 2010: Our future, Our choice – the Sixth Environment Action Programme. COM(2001) 31 final – Brussels.
ETC / N P B. 2003. An inventory of European site-based biodiversity monitoring networks. Final draft r e p o rt, prepared by B. Delbaere, European Centre for Nature Conserv a t i o n. Copenhagen, European Environmental Agency.
ETC / T E. 2000. CORINE land cover database ( Version 12/2000 extended coverage). Barcelona.
F i s c h e r, R. 2002. Feasibility study for future contributions in the field of forest biodiversity a s s e s s m e n t s. Federal Research Centre for Fo r e s t ry and Forest Products, Hamburg.
Gi l i s s e n, N., Haa n s t r a, L., Delany, S., Boere, G. and Hagemeijer, W. 2002. Numbers and distribution of wintering water birds in the Western Palearctic and Southwest Asia in 1997, 1998 and 1999. Results from the International Water bird Census. Wetlands International Global Series No. 11, Wa g e n i n g e n, The Netherlands.
Gr e g o ry, R. D., Eaton, M. A., Noble, D. G., Robinson, J. A., Pa r s o n s, M., Baker, H., Austin, G. and H i l t o n, G. M. 2003a. The state of the UK’s birds 2002. The RSP B, BTO, WWT and JNCC, Sandy, UK.
Gr e g o ry, R. D., Vo r i s e k, P., Van Strien, A. J., Eaton, M. and Wo tt o n, S. R. 2003b. From bird monitoring to policy-relevant indicators. A report to the European Topic Centre on Nature Protection and Biodiversity.
Gr e g o ry, R. D., van Strien, A., Vo r i s e k, P., Meyling, A. W. G., Noble, D. G., Fo p p e n, R. P. B. & Gi b b o n s, D. W. 2005 Developing indicators for European birds Phil. Trans. R. Soc. B 3 6 0, xxxx-xxxx
H u t c h i n g s, J. A. & Baum, J.K. 2005 Measuring marine fish biodiversity: temporal changes in a b u n d a n c e, life history, and demography Phil. Trans. R. Soc. B 3 6 0, xxxx-xxxx
J e n k i n s, M, Kapos, V. & Loh, J. 2004. Rising to the biodiversity challenge. Draft discussion paper for CBD CoP7. World Bank, UNEP-WCMC and WWF.
LC IE. 2004. Status and trends for large carnivores in Europe. Institute of Nature Conserv a t i o n PAS, Krakow, Po l a n d.
L o h, J. 2002. Living Planet Report 2002. World Wide Fund for Nature, Gl a n d, Switz e r l a n d.
L o h, J., Gr e e n, R. E., Ricketts, T., La m o r e u x, J., Jenkins, M., Kapos, V. & Randers, J. 2005 The Living Planet Index: using species population time series to track trends in biodiversity P h i l . Trans. R. Soc. B 3 6 0, xxxx-xxxx
McKinney, M. L. & Lockwood, J. L. 1999. Biotic homogenisation: a few winners replacing many losers in the next mass extinction. Trends in Ecology and Evolution 14: 450-453.
P r e s t o n, C. D., Te l f e r, M. G., Roy, D. B., Carey, P. D., Hill, M. O., Meek, M. R., Rothery, P., Smart, S. M. , S m i t h, G. M. & Wa l k e r, K.J. 2003. The changing distribution of the flora of the United Kingdom: Technical report. CEH, Hunt i n g d o n, UK.
Pauly, D. & Wa ts o n, R. 2005 Background and int e r p r e tation of the 'Marine Trophic Index' as a measure of biodiversity Phil. Trans. R. Soc. B 3 6 0, xxxx-xxxx
R o e k a e rts, M. 2002. The biogeographical regions map of Europe. Basic principles of its creation and overview of its development. European Environment Agency, Copenhagen.
Ten Brink, B. J. E, Hosper, H. and Colijn, F. 1991. A Quantitative Method for Description and Assessment of Ecosystems: the AMOEBA - a p p r o a c h. Marine Pollution Bulletin 3: 65-70.
Ten Brink, B. J. E., 2000. Biodiversity indicators for the OECD Environmental Outlook and Strategy; A feasibility study. RIVM report 402001014, Bilthoven.
T h o m a s, J. A., Te l f e r, M. G., Roy, D. B., Preston, C. D., Gr e e n w o o d, J. J. D., Asher, J., Fo x, R., Clarke, R. T. & La wt o n, J. H. 2004. Comparative losses of British butterflies, birds, plants and the global extinction crisis. Science 303, 1879-1881.
U N / EC E. 2003. Declaration by the environment Ministers of the region of the United Nations Economic Commission for Europe (UNECE). Fifth Ministerial Conference ‘E n v i r o n m e nt for E u r o p e’ Kiev, Ukraine, 21-23 May 2003. EC E / C E P / 9 4 / R e v. 1 .
( h tt p: / / www. r u s r e c. r u / h o m e p a g e / d a ta b a s e s / i nt _ l a w / e c e. c e p. 9 4 . r e v. 1 . e.pdf Accessed 1 October 2 0 0 4 )
U N E P. 2003a. Monitoring and indicators: designing national-level monitoring programmes and i n d i c a t o r s. UNEP/CBD / S BSTTA/9/10. Mont r e a l.
U N E P. 2003b. Proposed biodiversity indicators relevant to the 2010 target. U N E P / C BD / S BSTTA / 9 / INF/26. Mont r e a l.
U N E P, 2004. Strategic Plan: future evaluation of progress. UNEP/CBD / COP / V II/30. Mont r e a l.
United Nations. 2002. Report of the World Summit on Sustainable Development, Johannesbu rg, South Africa, 26 August - 4 September 2002. A/CON F. 1 9 9 / 2 0 .
h tt p: / / www. u n c ta d. o r g / e n / d o c s / a c o n f 1 9 9 d 2 0 & c 1 _ e n.pdf Accessed 27 September 2004
Van de Vlasakker Eisenga, J. W. G. 2004. Population Trends for Large Herbivores. LHF report 2004.001. The Large Herbivore Fo u n d a t i o n, Vo o r s c h o t e n, The Netherlands.
Van Swaay, C. A.M & Wa r r e n, M. S. 1999. Red Data book of European butterflies (Rhopalocera). Nature and Environment, No. 99, Council of Europe Publishing, Strasbourg.
Van Swaay, C. A. M. 2004. Trends for butterfly species in Europe. Rapport VS2003.07. De V l i n d e r s t i c h t i n g, Wa g e n i n g e n, The Netherlands.
Appendix 1
EU NIS habitat ty p e s
Descriptions are derived from Davies & Moss (2002)An extensive description, including keys, of these and of the habitat types lower in the hierarchy, can be found on htt p: / / e u n i s. e e a. e u. i nt / h a b i ta ts. j s p
A Marine habitats
Marine habitats are directly connected to the oceans,i.e.part of the continuous body of water which covers the greater part of the earth ‘s surface and which surround its land masses. Marine waters may be fully saline,brackish or almost fresh. Marine habitats include those below spring high tide limit (or below mean water level in non-tidal waters)and enclosed coastal saline or brackish waters, without a permanent surface connection to the sea but either with intermittent surface or sub-surface connections (as in lagoons). Rockpools in the supralittoral zone are considered as enclaves of the marine zone. Includes marine littoral habitats which are subject to wet and dry periods on a tidal cycle including tidal saltmarshes;marine littoral habitats which are normally water-covered but intermittently exposed due to the action of wind or atmospheric pressure changes; freshly deposited marine strandlines characterised by marine invertebrates. Waterlogged littoral zones above the mean water level in non-tidal waters or above the spring high tide limit in tidal waters are included with marine habitats.Includes constructed marine saline habitats below water level as defined above (such as in
marinas,harbours,etc)which support a semi-natural community of both plants and animals. The marine water column includes bodies of ice.
B Coastal habitats
C o a s tal habita ts are those above spring high tide limit (or above mean water level in non-tidal waters) occupying coastal features and characterised by their proximity to the sea, including coastal dunes and wooded coastal dunes,beaches and cliffs. Includes free- d r a i n i n g s u p r a l i ttoral habita ts adjacent to marine habita ts which are normally only affected by spray or splash, strandlines characterised by terrestrial invertebrates and moist and wet coasta l dune slacks. Excludes dune slack pools and rockpools.
C Inland surface water habitats
Inland surface water habita ts are non- c o a s tal above-ground open fresh or brackish water-bodies (e. g. rivers, s t r e a m s,lakes and pools,springs), including their littoral zones. Also includes dune slack pools. Includes constructed inland freshwater, brackish or saline waterbodies (such as canals, ponds,etc)which support a semi-natural community of both plants and animals; normally wet habita ts which may be dry seasonally (temporary or int e r m i tt e nt rivers and lakes and their littoral zones). Freshwater littoral zones include those parts of banks or shores which are sufficiently frequently inundated to prevent the formation of closed terrestrial v e g e ta t i o n. Excludes permanent snow and ice. Note that habita ts which intimately combine w a t e r l o gged habita ts with pools of open water are considered as complexes.
D Mire, bog and fen habitats
H a b i ta ts which are saturated, with the water table at or above ground level for at least half of the year, dominated by herbaceous or ericoïd vegetation e. g. bogs, marshes. Includes
w a t e r l o gged habita ts where the groundwater is frozen. Excludes waterlogged habita ts dominated by trees or large shrubs.
Note that habita ts which intimately combine waterlogged habita ts with pools of open water are considered as complexes.
E Grassland and tall forb habitats
N o n- c o a s tal habita ts which are dry or only seasonally wet (with the water table at or above ground level for less than half of the year) with greater than 30% vegetation cover. The d o m i n a nt vegetation is grasses and other non-woody vegetation (including moss-, lichen- , f e r n- and sedge-dominated communities). Includes sparsely wooded grassland areas with canopy cover of 5 - 10%. Includes successional weedy communities and managed grasslands such as recreation fields and lawns. Does not include regularly tilled habita ts dominated by cultivated herbaceous vegetation such as arable fields. Includes agricultural grasslands (Moss, pers comm. ) .
F Heathland,scrub and tundra habitats
N o n- c o a s tal habita ts which are dry or only seasonally wet (with the water table at or above ground level for less than half of the year) with greater than 30% vegetation cover. The d o m i n a nt vegetation is shrubs or dwarf shrubs. Includes regularly tilled shrub orchards, hedges (which may have occasional tall trees) and habita ts characterised by the presence of permafrost. Also includes dwarf trees and scrub (under 50cm, such as occur in extreme alpine conditions).
G Woodland and forest habitats and other wooded land
H a b i ta ts where the dominant vegetation is, or was until very recently, trees, typically single-s t e m m e d, and with a canopy cover of at leasingle-st 10%. Includesingle-s linesingle-s of treesingle-s, coppicesingle-s,and very r e c e ntly clear-felled areas with pre-existing ground cover, not yet re-stocked and with no succession to weedy vegeta t i o n. Trees are normally able to reach a height of 5m at maturity but this height may be lower at high latitudes or altitudes. Tall shrubs such as hazel (Cory l u s ) and some willows (Salix) with a woodland- type structure are treated as woodland. Includes regularly tilled tree nurseries and tree-crop planta t i o n s. Excludes dwarf trees and scrub (under 50cm) such as occur in extreme alpine conditions and sparsely wooded grassland areas with canopy cover 5 -10%, including parkland.
H Inland unvegetated and sparsely vegetated habitats
N o n- c o a s tal habita ts with less than 30% vegetation cover (other than where the vegetation is c h a s m o p h ytic or on scree and or cliff) which are dry or only seasonally wet (with the water table at or above ground level for less than half of the year). Subterranean non-marine caves and passages including underground waters. Habita ts characterised by the presence of p e r m a n e nt snow and surface ice other than marine ice bodies.
I
Regularly or recently cultivated agricultural,
horticultural and domestic habitats
H a b i ta ts maintained solely by frequent tilling or arising from recent abandonment of previously tilled ground such as arable land and gardens. Includes tilled ground subject to i n u n d a t i o n. Excludes shrub orchards,tree nurseries and tree-crop planta t i o n s.
J
Constructed,industrial and other artificial habitats
Primarily human sett l e m e nts, buildings, industrial developments, the transport netw o r k, waste dump sites. Includes highly artificial saline and non-saline waters with wholly constructed beds or heavily contaminated water (such as industrial lagoons and saltw o r k s ) which are virtually devoid of plant and animal life.