Sustainability Monitor
for the Netherlands 2011
Sustainability Monitor
for the Netherlands 2011
This brochure sums up the main results of the Sustain-ability Monitor for the Netherlands 2011. The Monitor illustrates how our actions affect the quality of life here and now, but also quality of life elsewhere in the world, and quality of life in the future. It describes the areas in which the Netherlands is doing well in terms of sustain-ability, and the areas of concern.
The monitor is a contribution to the current debate among politicians, policymakers and scientists about the long-term development of Dutch society.
The Monitor is compiled by Statistics Netherlands, the CPB Netherlands Bureau for Economic Policy Analysis, the PBL Netherlands Environmental Assessment Agency and the Netherlands Institute for Social Research.
Statistics Netherlands
CPB Netherlands Bureau for Economic Policy Analysis PBL Netherlands Environmental Assessment Agency Netherlands Institute for Social Research
Sustainability Monitor
for the Netherlands 2011
Foreword
Together with the Netherlands Institute for Social Research, the Nether lands Environmental Assessment Agency and the Nether lands Bureau for Economic Policy Analysis, Statistics Netherlands has devel oped the Sustainability Monitor for the Netherlands. This mon itor shows where the Netherlands is doing well from the point of view of sustainability, and where there is cause for concern. The mon itor is a contribution to the current debate among politicians, policymakers and scientists about the longterm development of Dutch society.
This brochure presents a summary of the main results of the Sustain ability Monitor for the Netherlands 2011. The statistics and visualisa tions can also be found on Statistics Netherlands’ website (www.cbs.nl) and are updated annually.
Gosse van der Veen DirectorGeneral Statistics Netherlands The Hague/Heerlen Coen Teulings Director
Netherlands Bureau for Economic Policy Analysis The Hague
Maarten Hajer Director
Netherlands Environmental Assessment Agency Bilthoven/The Hague
Paul Schnabel Director
Netherlands Institute for Social Research The Hague
4
The Netherlands: sustainable?
Concerns about sustainable development
From the perspective of sustainable development, there are four areas of concern in the Netherlands:
Environment and nature:
• climate change is a global threat to the
environment and to nature. Biodiversity is declining across the world, and thus also in the Netherlands. Added to this, the Nether lands indirectly uses relatively large amounts of natural resources such as agricultural land in other parts of the world.
Financial sustainability:
• the Dutch government debt is substan
tial, and costs of health care and social security are increasing. This may put these provisions at risk for future generations.
Knowledge level:
• knowledge is prerequisite for lasting welfare. In the Netherlands, however, relatively little is invested in research and development (R&D). In addition, the education level of the Dutch population is not very high compared with other countries in Europe. Moreover, relatively many pupils leave school without a basic qualification.
Disadvantaged position of non-westerners:
• people with a non
western foreign background in the Netherlands are at a disadvan tage in a number of respects. Relatively more of them are unem ployed and have a low income.
Policy decisions
Policymakers will have to address these four problem areas. The five main aspects for which policy decisions must be made are:
Greening the economy:
• economic growth should be accompanied
by a minimum use of fossil energy and depletion of natural re sources. This requires a global approach. Strongly growing econo
mies like those of China and India use a lot of natural resources, leading to more scarcity and higher prices. The threat to the cli mate and to biodiversity should be tackled globally.
Public or private funding:
• costs of public and semipublic provi
sions such as pensions and care continue to increase. Investment is also necessary in other areas such as knowledge and education. Particularly in times of crisis, the questions arise: to what extent is the government completely responsible for financing these areas? And is it possible or desirable to let households and businesses foot the bill directly?
Consequences of the shrinking labour force:
• the Dutch population
will continue to age in the coming decades. Welfare can be main tained by increasing labour participation and increasing produc tivity. Quality of education plays an important part in this respect. The decrease in the population will also have consequences for spatial planning.
Prevention and freedom of choice:
• it is easier to manage care
spending if people remain healthy to older ages; i.e. if they eat healthily, smoke less and exercise more. People can change their consumption behaviour to reduce the detrimental effects of some forms of consumption on biodiversity and the climate. The govern ment will have to decide on the level of intervention in the life style and consumption pattern of its citizens.
Distribution and inequality:
• education is an important factor in
improving the disadvantaged position of people with a nonwest ern foreign background. People with higher education levels have a higher income, have more healthy years to live, and are more satisfied than those with lower education levels.
6
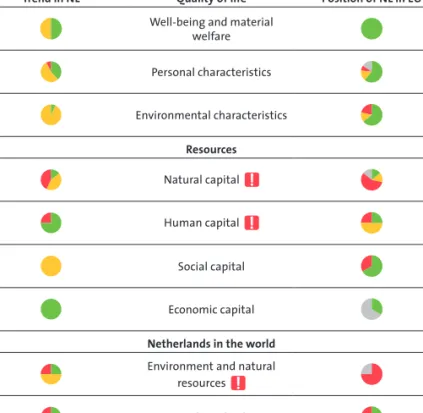
Figure 1 Scores on main dimensions
Trend in NL Quality of life Position of NL in EU Well-being and material
welfare Personal characteristics Environmental characteristics Resources Natural capital Human capital Social capital Economic capital Netherlands in the world Environment and natural
resources Trade and aid
trend with negative effect on sustainability, or low international ranking
trend with neutral or unknown effect on sustainability, or average international ranking trend with positive effect on sustainability, or high international ranking
Sustainability
in the Netherlands
‘Sustainable development is development that meets the needs of the present without compromising the ability of future generations both here and in other parts of the world to meet their own needs.’ (based on Our Common Future, Brundtland Commission, 1987) Three goals are central in the pursuit of sustainability: guaranteeing a sufficient quality of life (1), that is not at the expense of the ability of future generations to meet their needs (2), and that does not have a detrimental effect on the quality of life in other countries (3). Figure 1 illustrates these three aspects of sustainability for a number of themes. The circles show how they score on a number of indica tors. The column ‘Trend in NL’ indicates whether the development in the Netherlands since 2000 has been positive (green), negative (red) or neutral (yellow). The column ‘Position of NL in EU’ compares the Dutch scores with those of the other 26 countries in the European Union. If an indicator is green, the Netherlands is one of the nine highest scoring countries. Red indicates that the Netherlands is one of the nine lowest scoring countries. Yellow means that the Nether lands is in the middle category. An exclamation mark denotes that the theme is an area of concern, i.e. the score is low compared with the past, or compared with other countries.
High quality of life, but depletion of natural resources
The scores on how sustainable the Netherlands is paint the follow ing picture:
By European standards, quality of life in the Netherlands is very •
high. Material welfare has even increased in the last ten years. There are indications that the realisation of welfare in Nether •
lands is depleting stocks of natural resources, leaving future gener ations to deal with the problems this will cause. Only the economic indicators show a predominantly positive trend, al though the credit crisis has slowed down economic growth and government debt has increased substantially.
Compared with other European countries, the Netherlands indi •
8
especially in the poorest developing countries. Substantial im ports of raw materials and biomass are examples of this. Pressure on the environment has increased continually in recent years. Loss of biodiversity and emission of greenhouse gases are important negative effects of production. On the other hand, the Nether lands is relatively generous in terms of development aid and in come transfers to poor countries.
Present situation
Prosperous and content
The indicators show that the Dutch are a prosperous and content people. Material welfare, in terms of per capita consumption, is high in the Netherlands compared with other countries in Europe. More over, welfare has increased noticeably in recent decades. Wellbeing is measured by asking people how satisfied they are with their lives; and people in the Netherlands report a high level of satisfaction. The figures on satisfaction have been quite stable for thirty years now. Other indicators, too, point towards a high quality of life: the Dutch feel healthy and safe, they have a lot of social contacts and are satis fied with how they spend their free time. Surprisingly, the Dutch per ceive their quality of life to be better than the scores on the welfare indicators suggest.
There is also some inconsistency, however. Selfreported health has been stable for a long time now, whereas healthy life expectancy has increased. And although income inequality between men and wom en is decreasing, it is still large compared with other countries. Trust-based society
The Dutch have a relatively high level of trust in people as well as institutions such as the police and parliament. Together with the Scandinavian countries, the Netherlands is one of the high-trust
societies. In spite of this, nearly 8 percent of Dutch people say they
are discriminated against. Moreover, this percentage has increased slightly in the last ten years.
Nature under pressure from shortage of space
The Netherlands is one of the most densely populated countries in the world, it has a relatively high level of welfare, relatively large numbers of livestock and cars, and a relatively large sector of heavy industry. This is one of the main reasons the country has depleted its natural resources quickly in the course of time. Agriculture, housing, work and infrastructure use up a lot of land. The demand for space to live and work in is still rising and this is putting more and more pres sure on nature and biodiversity. No less than 85 percent of the origi nal biodiversity of the Netherlands has already been lost.
High energy intensity
The trends for energy and climate in the Netherlands are negative. At the present rate of use, Dutch natural gas reserves will be exhaust ed in about twenty years’ time. Although the proportion of renew able energy has been growing in recent years, the percentage pro duced is still low compared with other countries in Europe. The Netherlands also has a relatively energy intensive economy. This means that a lot of CO2 is emitted per euro produced.
Cleaner air, cleaner water
The quality of soil, water and air in the Netherlands has improved. In spite of this, soil and water quality are not very high by European standards. Because of the high population density and the intensive use of the environment by agriculture, industry and traffic, it will not be easy to turn this around.
High labour participation, short working week
Working hours are relatively short in the Netherlands. The main rea sons for this are the low number of hours per fulltime job and the large number of parttime workers. In no other EU country do so many people work parttime as in the Netherlands. This is offset by a high labour participation rate, however.
Welfare growth result of higher production per hour worked Just as in other western countries, the number of hours worked per capita will come under increasing pressure from population ageing. The increase in the labour force has slowed down in recent years. This may lead to wage increases, which in turn may lead to more in vestment in capital goods such as machines and infrastructure.
10
An increase in welfare in the coming decades will therefore have to be realised through higher production per hour worked.
Knowledge development essential
Maintaining the level of investment in knowledge will be an impor tant factor in raising productivity. The knowledge economy has ex panded enormously in the last fifty years, but since 1995 the growth rate has slowed down.
R&D investment has amounted to no more than 1.8 percent of the gross domestic product (GDP) for years now. This percentage puts the Netherlands only in the middle group in the EU rankings. The structure of the Dutch economy is the main reason for the nation’s relatively low R&D intensity. Industry sectors that invest extensively in knowledge are relatively small in the Dutch economy, or they be long to the services sector where this investment is not counted. Another crucial factor for the increase in labour productivity is edu cation. The education level in the Netherlands has increased steadily. Again, its education level puts the Netherlands in the middle group in the European Union.
Government finances deteriorated
Before the credit crisis Dutch government finances were in good shape. In 2007 the Netherlands had a slight budget surplus and gov ernment debt was 45 percent of GDP. These figures meant that the Netherlands scored favourably within Europe. Because of the credit crisis the Dutch government had to come to the aid of a number of banks, while its revenues were decreasing. In 2010 the surplus on the budget turned into a deficit of 5.4 percent, and the debt rose to 62.7 percent of GDP. In many other European countries the consequences of the crisis were much more severe, however.
Exhaustion of global stocks of natural resources
Within the European Union the Netherlands is one of the largest im porters of natural resources. This trade provides developing countries with income that is partly reinvested in the economy. But these im ports also mean that the Netherlands contributes to the exhaustion of global stocks of nonrenewable natural resources and to the de cline of biodiversity.
This is especially a problem for many African countries which are highly dependent on these exports of natural resources for their in come.
Development aid relatively high
The amount of money the Dutch spend on development aid has been stable in the last ten years, and is high compared with that of other EU countries.
Income transfers in the form of money remitted by migrant workers to family and friends in their home country are also increasing. These amounts, too, are high compared with the rest of the EU.
Knowledge development
essential
12
economic capital
social capital
human capital
natural capital
Sources of welfare
2.0 3.0 4.0 5.0 6.0 7.0 8.0 9.0 mark out of 10 Bulgaria Hungary Portugal Latvia Greece Romania Estonia France Slovakia Poland Slovenia Germany Cyprus United Kingdom Belgium Spain Netherlands Sweden Finland Denmark
Well-being
The Dutch are content with their lives. This level of satisfaction is •
also high by international standards.
They are also positive about their homes and how they spend •
their free time.
The Dutch are more satisfied with their education than ten years •
ago. However, this puts them no higher than in the middle of the European rankings.
Healthy life expectancy has increased in the past ten years. The •
level of perceived health has not changed though.
In many aspects, the Dutch perceive their wellbeing to be higher •
than objective scores would suggest.
14 160 120 80 40 0 1990 1995 2000 2005 2010 2015 2020 megatonnes of CO2 equivalents
Confidence interval EU target Estimate
History
Climate and energy
The emission of greenhouse gases in the Netherlands has de •
creased since 2005. The EU target of a 20 percent reduction in greenhouse gas emission by 2020 seems feasible.
To limit the rise in temperature to 2 degrees, emission reductions •
of 80 to 90 percent will have to be realised for greenhouse gases by 2050. This requires a followon policy, aimed at among other things increasing energy efficiency and increasing the share of re newable energy.
As a result of the consumption of its own energy stocks, the •
Nether lands will become increasingly dependent on other coun tries, unless alternative energy sources are deployed.
Although the share of renewable energy in the Netherlands has •
tripled since 2000, it is still small compared with other countries. Under current policy, the share of renewable energy will probably not increase by enough to meet the European requirement of 14 percent in 2020.
40 30 20 10 0 400 300 200 100 0 1995 1997 1999 2001 2003 2005 2007 2009
phosphorus kg/ha nitrogen kg/ha
Phosphorus surplus Nitrogen surplus
Quality of local environment
Levels of air, water and soil pollution have decreased considerably •
in the last few decades. This has improved the quality of the envi ronment. Air quality in particular has improved. In spite of this, pressure on the environment is high compared with other Euro pean countries and the current exposure to environmental pollu tion still affects health.
As less and less manure and artificial fertilisers are used, smaller •
amounts of nitrogen and phosphorus are deposited in the soil. However, because of its relatively large livestock sector, the Nether lands still has the highest level of nitrogen surplus and the second highest level of phosphorus surplus per hectare of agricultural land in Europe.
Since 2000 the improvement of water quality has been stagna •
ting in both the Netherlands and Europe. In 2009, less than 5 per cent of Dutch waters complied with the ‘Good status’ norm of the Water Framework Directive.
16 160 120 80 40 0 1997 1999 2001 2003 2005 2007 2009
Non-Red list species Red list species
index (1997=100)
All species
Classes included: butterflies, mammals, reptiles, amphibians, breeding birds, dragonflies and mushrooms
Biodiversity and landscape
The Netherlands has only small areas of forest and nature com •
pared with other countries in Europe. The decline of biodiversity has not come to and end, but has slowed down in recent years. The main reasons for this are the creation of new natural areas, targeted nature management and the improved quality of the en vironment.
In natural areas, the quality of two in five ecosystems has not de •
clined further in the last ten years. In agricultural areas, on the other hand, the quality does seem to be decreasing.
Populations of threatened species on the Red List have been de •
creasing further in the last ten years. Other species are doing well though: their populations are increasing.
The mark given for Dutch landscape is increasing slightly, but the •
8outof10 target for 2020 will probably not be realised. Part of the food eaten in the Netherlands is produced abroad. The •
Dutch therefore indirectly use land in other countries, and thus also contribute to the decline of global biodiversity.
80 60 40 20 0 11 10 9 8 0 Absolute % of GDP euro (bn.) % of GDP 1995 1997 1999 2001 2003 2005 2007 2009
Health
Life expectancy is high in the Netherlands. For men it is even one •
of the highest in European Union. For women it is around the EU average.
In terms of mental health (depression), the Netherlands ranks rel •
atively well within the European Union.
The cost of health care has risen in recent years. It will probably •
continue to rise as a result of population ageing and a further in crease in life expectancy.
To keep care expenditure at a manageable level, it is important •
that people stay healthy as long as possible. A healthy lifestyle is essential for this. One important aspect in this respect is the dis couragement of unhealthy habits such as smoking, getting too little exercise, and excessive and unhealthy food intake.
18
Housing and residential
environment
The Dutch are very positive about the quality of their homes. •
Indeed the quality of housing is high compared with that in other countries in the European Union. Relatively many people experi ence neighbourhood nuisance, though.
The number of people moving from rented accommodation to •
buy their own home has decreased since 1988. People starting out on the housing market are finding it tough because of high prop erty prices, highincome tenants staying on in cheap rented dwell ings, and a slump in new construction.
It has become more affordable to live in the Netherlands, although •
the cost of living is high. The Dutch do not perceive their living expenses as high, however.
In spite of the slight increase in the number of available homes, •
there is still a shortage on the housing market. In the large cities in particular, waiting lists for accommodation in the social rent sector remain a serious problem.
Dwellings and occupation rate
8 7 6 5 4 3 0 4.0 3.5 3.0 2.5 2.0 1.5 0 Number of dwellings (x million, left-hand scale) Persons per dwelling (right-hand scale)
Mobility
The mobility of the Dutch population is increasing, although at a •
slower and slower rate. Commuting from home to work in partic ular has increased in the last ten years.
The Dutch spend more time commuting than any other popula •
tion in Europe.
Air pollution caused by road traffic has decreased substantially in •
recent decades. However, three in ten people experience nuisance from road traffic.
Road traffic deaths have decreased in the last ten years. The Nether •
lands has one of the lowest road traffic fatality rates in Europe.
Commuting times 60 50 40 30 20 10 0
Percentage of commuters wih journey time of: Austria Italy France Spain Luxembourg Greece Belgium Ireland Germany Great Britain Netherlands
commuting times in minutes per day
20 60 50 40 30 20 10 0 0 Latvia Greece Slovenia Finland Netherlands France Germany Estonia Cyprus 100 200 300 400 500 600 700
number of police officers per 100,000 inhabitants % who do not feel safe
Safety
Crime rates have been decreasing overall in recent years. The num •
ber of cases involving assault and threatening behaviour is increas ing, however. Compared with other countries in Europe, the Nether lands is about average in terms of crime, although the number of underage suspects is relatively high.
The number of people who say they do not feel safe has fallen in •
the Netherlands in recent years.
The government has been spending more on safety since 2002. •
Spending on this area in the Netherlands is around the EU average. The level of trust in the police and in the justice system has in •
creased.
8.0 7.5 7.0 6.5 6.0 2002 2004 2006 2008 %
Percentage of people who describe themselves as belonging to a discriminated group
Social participation and trust
The level of social participation in the Netherlands is very high. •
Nine out of ten Dutch people contact family and friends more than once a month, and the Dutch have the highest rate of volun teer work in Europe.
The Dutch also have a high level of trust in each other and in so •
cial and political institutions compared with other countries in Europe. This level of trust has not changed in the last few years, although trust in institutions is fluctuating more than in the past.
A relatively large part of the population feels discriminated •
22 3.0 2.5 2.0 1.5 1.0 0.5 0 2002 2003 2004 2005 2006 2007 2008 2009 % of GDP
Private sector Institutions for higher education Other intstitutions
target: total 3%
0.2
0.9
1.9
Education and knowledge
The Netherlands is not in the top group of knowledge economies. •
In spite of this Dutch universities are renowned for their high qual ity of education and research, the quality of regular education is high and lifelong learning is high on the agenda.
Although the education level in the Netherlands continues to in •
crease, the country is only in the middle group in the European Union. At the bottom of the Dutch education ladder, in particular, problems are caused by the relatively high school dropout rate. Scores of Dutch pupils in internationally comparable tests indicate •
that the quality of primary and secondary education is declining. The European target for R&D spending to account for 3 percent of •
GDP in 2010 was not achieved in the Netherlands. An important reason for this was the country’s economic structure. The rela tively low level of private sector investment in knowledge is surprising given the very high level of Dutch achievement in academic re search. A mismatch between university research and its application in the private sector may be the cause of this.
180 160 140 120 100 0 1980 1985 1990 1995 2000 2005 2010 1980 = 100
GDP per capita Labour productivity Labour years per capita
Material welfare
and the economy
The level of material welfare in the Netherlands is high and still •
growing. Since 2000, average annual GDP growth has been 1.3 percent (2000–2010, in euro per capita), and consumption expend iture per capita rose by 1.2 percent per year in the same period. The Netherlands is high in the European rankings in terms of both GDP and consumption per capita.
Welfare will come under pressure in future decades as a conse •
quence of the limited growth of labour volume compared with total population growth. Labour participation is relatively high in the Netherlands, but the number of hours worked per person is relatively low. Population ageing will slow down the increase in labour volume, but this slower growth can be counteracted by a further increase in productivity.
Unemployment is low in the Netherlands compared with that in •
other countries.
The Dutch are optimistic about their future financial situation. •
24 5 0 –5 –10 –15 –20 –25 –30 –35 0 20 40 60 80 100 120 140 160 government debt as % of GDP government deficit (-) / surplus (+) as % of GDP
Ireland Greece Italy United Kingdom Netherlands Estonia Luxembourg
Government deficit and government debt (2010)
Financial sustainability
With the enormous increase in crossborder capital flows and the •
conversion from the guilder to the euro, the Netherlands has become increasingly interwoven in the global and European financial system. Financial discipline and trust in institutions are prer equisite for the sustainable functioning of this system. By European standards, the Dutch have saved up a large amount •
of capital for their pensions. In spite of this, present interest rates will render these savings insufficient to pay out entitlements. Without tax increases, future generations will probably not be •
able to enjoy the same level of social security and government provisions as the present generation.
share in kg, 1999-2009 France Spain Italy Portugal Germany United Kingdom Netherlands 8% Other
Trade and aid
Compared with other countries in Europe, the Netherlands im •
ports a lot of natural resources from developing countries. Dutch imports from developing countries have increased strongly •
since 2000, more strongly than imports by other European coun tries.
The Netherlands spends a relatively large sum on development •
aid. This expenditure is also high by EU standards. The same is true for the amounts of money immigrants remit to family and friends in their countries of origin.
26 7.4 18,200 euro 59% 24% 3.9 % 52% 49% 7.7 25,200 euro 62% 20% 1.2 % 70% 66% Satisfaction with life
(mark out of 10) Income differences (annual income) Trust in institutions (enough trust) Feelings of unsafety (does not feel safe) Long-term unemployment (long-term unemployed) Education level (basic qualification) Generalised trust (enough trust)
non-western foreign background native Dutch
Inequality between native Dutch people
and people with a non-western foreign background (2008/2009)
Inequality
People in the Netherlands with a nonwestern foreign background •
are lagging behind the native Dutch in terms of all measured as pects of welfare and in terms of the options for increasing this welfare in the future.
There is no great social inequality between men and women in •
the Netherlands. Men and women are equally content with their lives and live equally long in good health. Women do earn less men on average however, and relatively more of them do not feel safe.
While women previously lagged behind men in education, they •
have now taken the lead.
Education is a very important factor in reducing inequality and in •
creasing welfare. People with higher levels of education score bet ter on nearly all welfare aspects than those with lower education levels. They enjoy more healthy years of life and are more satisfied than people with low education levels.
Government debt in the countries of the European Union (2009)
Total government debt (EMU debt) as a percentage of gross domestic product (GDP)*
European Union 80% Lithuania 38.2% Malta 68% Italy 119% Bulgaria 16.2% Austria 72.3% Czech Republic 38.5% Denmark 43.6% Greece 142.8% Cyprus 60.8% Ireland 96.2% Poland 55% Sweden 39.8% Belgium 96.8% France 81.7% Spain 60.1% Slovakia 41% Germany 83.2% Finland 48.4% Luxembourg 18.4% Estonia 6.6% Portugal 93% Slovenia 38% Netherlands 62.7% Romania 30.8% Latvia 44.7% United Kingdom 80% Hungary 80.2%
Welfare growth also has positive
effects on the environment
The Netherlands is a large importer of goods. The production of these goods often results in damage to the environment and depletion of stocks of natural resources.
These negative effects occur mainly in developing countries. But by exporting their goods to the Netherlands, developing countries also contribute to the growth of their own welfare in. Growing welfare also has positive effects on the environment. In practice, it turns out that as welfare increases, the need for clean surroundings also in creases. More welfare leads to investment in better sanitary provisions, stricter environmental regulations for companies and thus cleaner produc tion methods. Moreover, rising welfare means higher education levels. In nearly all countries this is accompanied by lower fertility levels. While women had five children on average some fifty years ago, this figure has now almost halved. In a large number of countries, fertility is already below in some countries well below the replacement rate.
This will probably eventually lead to a decrease in the world popula tion and pressure on the environment will thus ease step by step.
Number of children and income
Green energy in ten EU countries
8 7 6 5 4 3 2 1 0 0 10,000 20,000 30,000 40,000 50,000 60,000 70,000
average per capita income in US$ children per woman
Niger Angola Pakistan
China
Argentina Saudi Arabia
South Korea
Netherlands Hong Kong
United States Norway
Green energy Target 2020
0 10 20 30 40 50 60 United Kingdom Netherlands Belgium Italy Germany Spain France Denmark Portugal Sweden
Towards a low-carbon society
The realisation of a lowcarbon society will help to curb climate change and make the Netherlands less dependent on imports of fos sil energy – particularly oil – from politically unstable areas. Increas ing energy efficiency, switching to an energy system that also com prises nuclear energy, and the application of renewable sources such as solar and wind energy will contribute to both goals. Opting for clean fossil fuels will only limit climate change.
To realise a lowcarbon society, polluting production processes will have to be made more expensive, and cleaner technology cheaper. This can be achieved by, for example, passing on the cost of environ mental damage to consumers and encouraging investment in green technologies. Subsequently, if people do not change their consump tion and behaviour and hardly respond to price signals, legislation is an option. Setting requirements for the energy use of appliances is a possibility in this respect.
A number of strategic choices will have to be made in the coming years about how to realise a lowcarbon society. Ultimately, it will mostly be up to politicians to choose a course and the instruments required to take it.
Competition versus
coordination
Many stubborn environmentrelated problems that have yet to be solved are global –climate change, loss of biodiversity and scarcity of natural resources. Opinions on how best to tackle these problems are strongly divided.
Two extremes in this respect are global coordination and competi tion. In the case of global coordination, all countries work together in the approach to environmental problems. This is diffi cult in practice, however, because of confl icting interests. In the second scenario, the solution is sought in global competition for cleaner technology, focusing on the economic opportunities afforded by environment oriented innovation. The risk here is that this will contribute insuffi ciently to the solution of the global environmental problem. Therefore, an ideal mix of competition and coordination will have to be found for Europe and the Netherlands. For the climate, this means that in addition to opting for global cooperation, more attention should be paid to the economic opportunities of, for example, invest ment in renewable energy. For resources, the Netherlands and Europe could advocate the setting of environmental preconditions for the global competition for resources, for example through international certifi cation of chains.
32
Sources of data used in the graphs
Page 15: European Social Survey (ESS)
Page 16: Netherlands Environmental assessment Agency
Page 18: Netherlands Environmental assessment Agency, Netherlands Ecological Monitoring Network, Statistics Netherlands Page 19: World Health Organisation (WHO)
Page 21: OECD Economic Survey: Netherlands 2010 (OECD) Page 23: European Social Survey (ESS)
Page 30(I): World Bank (World Development Indicators), CIA (World Factbook 2010) and Lutz, W. and S. KC, 2010. “Dimensions of Global population projections: What do we know about future population trends and structures?”, Philosophical Transactions of the Royal Society, 365 (1554), p. 27792791
Page 22, 24, 26,
27, 29, 30(II): Eurostat
Other pages: Statistics Netherlands
Publisher Information
Statistics Netherlands Tel. + 31 88 570 70 70
Henri Faasdreef 312 Fax + 31 70 337 59 94
2492 JP The Hague Via contact form:
www.cbs.nl/infoservice:
Translation
Lieneke Hoeksma How to order
Email: verkoop@cbs.nl
Design and DTP Fax + 31 45 570 62 68 Teldesign, Rotterdam
Internet
Printed by www.cbs.nl
Tuijtel, HardinxveldGiessendam
Price: € 3.50 (excl. administration and postage) ISBN: 9789035717589
Print run: 3,000
© Statistics Netherlands The Hague/Heerlen, 2011 Reproduction is permitted.
Sustainability Monitor
for the Netherlands 2011
Sustainability Monitor
for the Netherlands 2011
This brochure sums up the main results of the Sustain-ability Monitor for the Netherlands 2011. The Monitor illustrates how our actions affect the quality of life here and now, but also quality of life elsewhere in the world, and quality of life in the future. It describes the areas in which the Netherlands is doing well in terms of sustain-ability, and the areas of concern.
The monitor is a contribution to the current debate among politicians, policymakers and scientists about the long-term development of Dutch society.
The Monitor is compiled by Statistics Netherlands, the CPB Netherlands Bureau for Economic Policy Analysis, the PBL Netherlands Environmental Assessment Agency and the Netherlands Institute for Social Research.
Statistics Netherlands
CPB Netherlands Bureau for Economic Policy Analysis PBL Netherlands Environmental Assessment Agency Netherlands Institute for Social Research