Total greenhouse gas (GHG) emissions from the Netherlands in 2013 decreased by approximately 0.2%, compared with 2012 emissions. This decrease was mainly the result of decreased fuel combustion in the transport sector and in the petrochemical industry.
In 2013, total direct GHG emissions (excluding emissions from Land use, land use change and forestry (LULUCF)) in the Netherlands amounted to 195.8 Tg CO2 eq. This is approximately 12% below the emissions in the base year (221.1 Tg CO2 eq).
This report documents the Netherlands’ 2015 annual submission of its GHG emissions inventory in accordance with the guidelines provided by the United Nations Framework Convention on Climate Change (UNFCCC) and the European Union’s Greenhouse Gas Monitoring Mechanism. Implementation of the 2006 IPCC Guidelines for National Greenhouse Gas Inventories (IPCC, 2006) meant the presentation of the emissions data changed in comparison with previous submissions.
The report includes explanations of observed trends in emissions; an assessment of the sources with the highest contribution to the national emissions (key sources) and the uncertainty in their emissions; an itemization of methods, data sources and emission factors (EFs) applied; and a description of the
quality assurance system and the verification activities performed on the data.
Greenhouse
Gas Emissions
in the Netherlands
1990-2013
National Inventory Report 2015
Published by:National Institute for Public Health and the Environment
P.O. Box 1 | 3720 BA Bilthoven The Netherlands
www.rivm.nl/en December 2015
RIVM Report 2015-0188
M. Weststrate | P.W.H.G. Coenen | C.W.M. van der Maas | P.J. Zijlema | E.J.M.M. Arets | K. Baas | A.C.W.M. van den Berghe | M.M. Nijkamp | E.P. van Huis | G. Geilenkirchen | C.W. Versluijs | R. te Molder | R. Dröge | J.A. Montfoort | C.J. Peek | J. Vonk | S. Oude Voshaar
in the Netherlands
1990-2013
Greenhouse gas emissions in
the Netherlands 1990–2013
National Inventory Report 2015
RIVM Report 2015-0188Colophon
© RIVM 2015
National Institute for Public Health and the Environment (RIVM), P.O. Box 1, 3720 BA Bilthoven, Netherlands; Tel: +31-30-274 91 11; Fax: +31-30-278 75 31; www.rivm.nl/en.
Parts of this publication may be reproduced, provided acknowledgement is given to the ‘National Institute for Public Health and the Environment’, along with the title and year of publication.
P.W.H.G. Coenen1, C.W.M. van der Maas, P.J. Zijlema2, E.J.M.M. Arets6,
K. Baas3, A.C.W.M. van den Berghe7, M.M. Nijkamp, E.P. van Huis4,
G. Geilenkirchen5, C.W. Versluijs, R. te Molder, R. Dröge1, J.A.
Montfoort, C.J. Peek, J. Vonk, S. Oude Voshaar
1 Netherlands Organisation for Applied Scientific Research (TNO),
P.O. Box 80015, NL-3508 TA Utrecht
2 Netherlands Enterprise Agency (RVO.nl), P.O. Box 8242, NL-3503
RE Utrecht
3 Statistics Netherlands (in Dutch: ‘Centraal Bureau voor de
Statistiek’, CBS), P.O. Box 24500, NL-2490 HA Den Haag
4 Dutch Emissions Authority (NEa), P.O. Box 91503, NL-2509 EC
Den Haag
5 Netherlands Environmental Assessment Agency (PBL), P.O. Box
303 NL-3720 AH Bilthoven
6 Alterra Wageningen UR, P.O. Box 47 NL-6700 AA Wageningen 7 Rijkswaterstaat, P.O. Box 8242, NL-3503 RE Utrecht
Contacts:
Wim van der Maas (RIVM) (Wim.van.der.Maas@rivm.nl)
Peter Zijlema (NIE / Netherlands Enterprise Agency(RVO.nl)) (Peter.Zijlema@rvo.nl)
This report has been compiled by order and for the account of the Directorate-General for the Environment of the Dutch Ministry of
Infrastructure and the Environment, within the framework of the project Emission Registration M/240037/15/NI, ‘Netherlands Pollutant Release & Transfer Register’.
Report prepared for submission in accordance with the United Nations Framework Convention on Climate Change (UNFCCC) and the European Union’s Greenhouse Gas Monitoring Mechanism [including electronic Common Reporting Format (CRF) Excel spreadsheet files containing the data for 1990 to 2013].
This is a publication of:
National Institute for Public Health and the Environment
P.O. Box 1 | 3720 BA Bilthoven The Netherlands
Acknowledgements
Many colleagues from a number of organizations (Statistics Netherlands, EC-LNV, LEI, Alterra, Netherlands Enterprise Agency (RVO.nl) (formerly NL Agency), Plan Bureau voor de Leefomgeving (PBL), RIVM and TNO) have been involved in the annual update of the Netherlands Pollutant Release & Transfer Register (PRTR), also called the Emission
Registration (ER) system, which contains emissions data on about 350 pollutants. The emissions calculations, including those for greenhouse gas (GHG) emissions, are performed by members of the ER Task Forces. This is a major task, since the Netherlands’ inventory contains details of many emissions sources.
The emissions and activity data of the Netherlands’ inventory were converted into the IPCC1 source categories contained in the Common
Reporting Format (CRF) tables, which form a supplement to this report. The description of the various sources, the analysis of trends and the uncertainty estimates (see Chapters 3 to 8) were made in co-operation with the following emissions experts: Eric Arets (KP), Guus van den Berghe (Rijkswaterstaat; Waste), Kees Versluijs, Jan-Peter Lesschen, Geerten Hengeveld and Peter Kuikman (Alterra; Land use), Gerben Geilenkirchen (Transport), Romuald te Molder (key sources), Monique Nijkamp (Product use), Rianne Dröge (Energy), Johanna Montfoort (Fugitive emissions), Kees Peek (Industrial processes, data control, chart production), Kees Baas (Statistics Netherlands; Wastewater handling) and Jan Vonk and Stephanie Oude Voshaar (Agriculture). In addition, Bas Guis of Statistics Netherlands provided pivotal information on CO2 emissions related to energy use. This group also provided
activity data and additional information for the CRF tables in cases where these were not included in the data sheets submitted by the ER Task Forces. We are particularly grateful to Bert Leekstra, Jack Pesik and Dirk Wever for their contributions to data processing, chart production and quality control.
We greatly appreciate the contributions of each of these groups and individuals to this National Inventory Report and supplemental CRF tables, as well as those of the external reviewers who provided comments on the draft report.
Synopsis
Total greenhouse gas (GHG) emissions from the Netherlands in 2013 decreased by approximately 0.2%, compared with 2012 emissions. This decrease was mainly the result of decreased fuel combustion in the transport sector and in the petrochemical industry.
In 2013, total direct GHG emissions (excluding emissions from Land use, land use change and forestry (LULUCF)) in the Netherlands amounted to 195.8 Tg CO2 eq. This is approximately 12% below the emissions in the
base year2 (221.1 Tg CO 2 eq).
This report documents the Netherlands’ 2015 annual submission of its GHG emissions inventory in accordance with the guidelines provided by the United Nations Framework Convention on Climate Change
(UNFCCC)3 and the European Union’s Greenhouse Gas Monitoring
Mechanism. Implementation of the 2006 IPCC Guidelines for National Greenhouse Gas Inventories (IPCC, 2006) meant the presentation of the emissions data changed in comparison with previous submissions. The report includes explanations of observed trends in emissions; an assessment of the sources with the highest contribution to the national emissions (key sources) and the uncertainty in their emissions; an itemization of methods, data sources and emission factors (EFs) applied; and a description of the quality assurance system and the verification activities performed on the data.
Keywords: greenhouse gases, emissions, trends, methodology, climate
2 1990 for CO
2, CH4 and N2O and 1995 for the F-gases.
3 As the UNFCCC software that should be used for the reporting of emissions and removals under the Kyoto Protocol did not function adequately, it was not possible for the Netherlands, like all other EU Member States, to report these emissions and removals. It is foreseen that the next report will contain the supplementary information.
Publiekssamenvatting
In 2013 is de totale broeikasgasemissie van Nederland met ongeveer 0,2 procent gedaald ten opzichte van de emissie in 2012. Deze daling komt vooral door de afname van brandstofgebruik in de transportsector en de petrochemische industrie.
De totale broeikasgasemissie in 2013 bedraagt 195,8 teragram
(megaton of miljard kilogram) CO2 equivalenten. Ten opzichte van het
basisjaar (221,1 Tg CO2 equivalenten) is dit een afname van ongeveer
11,5 procent. Beide getallen zijn exclusief de emissies afkomstig uit het soort landgebruik en de verandering daarin, zoals natuurontwikkeling of ontbossing (land use, land use change and forestry, LULUCF).
Dit blijkt uit een inventarisatie van broeikasgasemissies die het RIVM op verzoek van het ministerie van Infrastructuur en Milieu (IenM) heeft opgesteld. Met deze inventarisatie voldoet Nederland aan de nationale rapportageverplichtingen voor 2015 van het Klimaatverdrag van de Verenigde Naties (UNFCCC)4 en van het Bewakingsmechanisme
Broeikasgassen van de Europese Unie. De emissiecijfers zijn in absolute zin gewijzigd ten opzichte van eerdere rapportages omdat de nu
gerapporteerde cijfers berekend zijn conform de nieuwste UNFCCC 2006 Guidelines.
De inventarisatie bevat verder trendanalyses voor de emissies van broeikasgassen in de periode 1990-2013, een analyse van belangrijkste emissiebronnen (sleutelbronnen) evenals de onzekerheid in hun
emissies. Daarnaast biedt de inventarisatie documentatie van de gebruikte berekeningsmethoden, databronnen en toegepaste emissiefactoren. Ten slotte bevat het een overzicht van het kwaliteitssysteem en de validatie van de emissiecijfers door de Nederlandse Emissieregistratie.
Kernwoorden: broeikasgassen, emissies, trends, methodiek, klimaat
4 Doordat de UNFCCC software die gebruikt moet worden voor de rapportage onder het Kyoto protocol nog niet aan alle eisen voldeed, kon Nederland, net als alle landen in de Europese Unie, niet rapporteren over emissies onder het Kyoto Protocol. De verwachting is dat in de eerstvolgende rapportage ook de emissies onder het Kyoto Protocol weer gerapporteerd kunnen worden.
Contents
Samenvatting — 13 Executive summary — 17 1 Introduction — 29
1.1 Background information on greenhouse gas inventories and climate change — 29
1.1.3 Background information on supplementary information under Article 7 of the Kyoto Protocol — 32
1.2 A description of the national inventory arrangements — 32 1.2.1 Institutional, legal and procedural arrangements — 32
1.2.2 Overview of inventory planning, preparation and management — 32 1.2.3 Reporting, QA/QC, archiving and overall co-ordination — 33
1.3 Inventory preparation; data collection, processing and storage — 40
1.3.1 GHG and KP-LULUCF inventory — 40
1.3.3 Data processing and storage — 42
1.4 General description of methodologies (including tiers used) and data sources used — 44
1.4.1 GHG inventory — 44
1.4.2 KP-LULUCF inventory — 47
1.5 Brief description of key categories — 47
1.5.1 GHG inventory — 47
1.5.2 KP-LULUCF inventory — 47
1.6 General uncertainty evaluation, including data on the overall uncertainty of the inventory totals — 47
1.6.1 GHG inventory — 47
1.6.2 KP-LULUCF inventory — 52
1.7 General assessment of completeness — 52
1.8.1 GHG inventory — 52
1.8.2 KP-LULUCF inventory — 52
2 Trends in GHG emissions — 53
2.2 Emissions trends by gas — 53
2.2.1 Carbon dioxide — 53
2.2.2 Methane — 54
2.2.3 Nitrous oxide — 55 2.2.4 Fluorinated gases — 56
2.2.5 Uncertainty in emissions specified by greenhouse gas — 56 2.3 Emissions trends by source category — 57
2.3.1 Uncertainty in emissions by sector — 57
2.4 Emissions trends for indirect greenhouse gases and SO2 — 58 3 Energy (CRF sector 1) — 59
3.1 Overview of sector — 59
3.1.1 GHG emissions from the Energy sector — 61
3.2 Fuel combustion (1A) — 65
3.2.1 Comparison of the sectoral approach with the Reference Approach — 65 3.2.2 International bunker fuels — 69
3.2.3 Feed stocks and non-energy use of fuels — 69 3.2.4 Energy industries (1A1) — 70
3.2.6 Transport (1A3) — 88 3.2.7 Other sectors (1A4) — 105
3.2.8 Other (1A5) — 111
4 Industrial processes and product use (CRF sector 2) — 119
4.1 Overview of sector — 119
5 Agriculture (CRF sector 3) — 151
5.1 Overview of the sector — 152
5.2 Enteric fermentation (3A) — 156
5.2.1 Source category description — 156
5.2.2 Overview of shares and trends in emissions — 157 5.2.3 Activity data and EFs — 157
5.2.4 Methodological issues — 160
5.2.5 Uncertainty and time series consistency — 161 5.2.6 Source-specific QA/QC and verification — 161 5.2.7 Source-specific recalculations — 161
5.2.8 Source-specific planned improvements — 162
5.3 Manure management (3B) — 162
5.3.1 Source category description — 162
5.3.2 Overview of shares and trends in emissions — 162 5.3.3 Activity data and (implied) EFs — 164
5.3.4 Methodological issues — 167
5.3.5 Uncertainty and time series consistency — 167
5.3.6 Source-specific QA/QC — 168
5.3.7 Source-specific recalculations — 168
5.3.8 Source-specific planned improvements — 168 5.4 Agricultural soils (3D) — 168
5.4.1 Source category description — 168
5.4.2 Overview of shares and trends in emissions — 169
5.4.3 Key sources — 169
5.4.4 Activity data and (implied) EFs — 170 5.4.5 Methodological issues — 175
5.4.6 Uncertainty and time series consistency — 176
5.4.7 Source-specific QA/QC — 177
5.4.8 Source-specific recalculations — 177
5.4.9 Source-specific planned improvements — 177
5.5 Liming (3G) — 177
5.5.1 Source category description — 177 5.5.2 Activity data and (implied) EFs — 177
5.5.3 Overview of shares and trends in emissions — 177 5.5.4 Activity data and EFs — 178
5.5.5 Methodological issues — 178
5.5.6 Uncertainty and time series consistency — 178 5.5.7 Source-specific QA/QC and verification — 178 5.5.8 Source-specific recalculations — 178
5.5.9 Source-specific planned improvements — 179
6.1 Overview of sector — 181
6.2 Land use definitions and the classification systems used and their correspondence to the land use, land use change and forestry categories — 187
6.3 Information on approaches used to representing land areas and on land use databases used for the inventory preparation — 189
6.5 Cropland (4.B) — 199
6.6 Grassland (4C) — 201
6.7 Wetlands (4D) — 202
6.8 Settlements (4E) — 203
6.9 Other land (4F) — 204
7.3 Biological treatment of organic waste (5B) — 212 8 Other (CRF sector 6) — 227
9 Indirect CO2 and NO2 emissions — 229
9.1 Description of sources — 229 9.2 Methodological issues — 229
9.3 Uncertainties and time series consistency — 229 9.4 Category-specific QA/QC and verification — 229 9.5 Category-specific recalculations — 229
9.6 Category-specific planned improvements — 229 10 Recalculations and improvements — 231
10.1 Explanation of and justification for the recalculations — 231 10.1.1 GHG inventory — 231
10.1.2 KP-LULUCF inventory — 232
10.2 Implications for emissions levels in GHG inventory — 232 10.2.1 GHG inventory — 232
10.2.2 KP-LULUCF inventory — 233
10.3 Implications for emissions trends, including time series consistency — 233
10.3.1 GHG inventory — 233 10.3.2 KP-LULUCF inventory — 233
10.4 Recalculations, response to the review process and planned mprovements — 233
10.4.1 GHG inventory — 233 10.4.2 KP-LULUCF inventory — 238
Annex 1 Key categories — 239
Annex 2 Assessment of uncertainty — 255
Annex 3 Detailed methodological descriptions of individual source or sink categories — 263
Annex 4 CO2 The national energy balance for the most recent
inventory year — 264
Annex 5 The Netherlands’ fuels and standard CO2 EFs, version
2015 — 265
Annex 6 Assessment of completeness and (potential) sources and sinks — 270
Annex 7 Chemical compounds, GWPs, units and conversion factors — 272
Samenvatting
Het National Inventory Report (NIR) 2015 bevat de rapportage van broeikasgasemissies (CO2, N2O, CH4 en de F-gassen) over de periode
1990 tot en met 2013. De emissiecijfers in de NIR 2015 zijn berekend volgens de methoderapporten behorend bij het ‘National System’ dat is voorgeschreven in het Kyoto Protocol. In de methoderapporten zijn de berekeningswijzen vastgelegd voor zowel het basisjaar (1990 voor CO2,
CH4 en N2O en 1995 voor de F-gassen) als voor de emissies in de
periode tot en met 2013. De methoderapporten zijn beschikbaar op de website www.rvo.nl/nie
National Inventory Report (NIR)
Dit rapport over de Nederlandse inventarisatie van broeikasgasemissies is op verzoek van het ministerie van Infrastructuur en Milieu (IenM) opgesteld om te voldoen aan de nationale rapportageverplichtingen in 2015 van het Klimaatverdrag van de Verenigde Naties (UNFCCC)5 en het
Bewakingsmechanisme Broeikasgassen van de Europese Unie.
Belangrijk is te vermelden dat in de emissies in dit rapport zijn berekend conform nieuwste definities en richtlijn van de UNFCCC 2006. In het verleden werden de emissies volgens richtlijnen uit 1996 berekend. Door de definitieverschillen zijn de cijfers uit eerdere rapportages en deze NIR niet vergelijkbaar.
Dit rapport bevat de volgende informatie:
• trendanalyses voor de emissies van broeikasgassen in de periode 1990-2013;
• een analyse van zogenaamde sleutelbronnen en de onzekerheid in hun emissies volgens de ‘Tier 1’-methodiek van de IPCC Good Practice Guidance;
• documentatie van gebruikte berekeningsmethoden, databronnen en toegepaste emissiefactoren;
• een overzicht van het kwaliteitssysteem en de validatie van de emissiecijfers voor de Nederlandse EmissieRegistratie;
• de wijzigingen die in de methoden voor het berekenen van broeikasgasemissies zijn aangebracht na de review van het Nationaal Systeem broeikasgassen vanuit het Klimaatverdrag. Op basis van de methoden die in de NIR en de Nederlandse
protocollen broeikasgassen zijn vastgelegd, is de
basisjaaremissie bepaald en de hoeveelheid broeikasgassen die Nederland in de periode 2008 t/m 2012 (volgens het Kyoto Protocol) mag uitstoten.
De NIR bevat dit jaar niet de informatie die voorgeschreven is volgens artikel 7 van het Kyoto protocol (deel 2 van dit rapport). Doordat de UNFCCC software die gebruikt moet worden voor de rapportage onder het Kyoto protocol nog niet aan alle eisen voldeed, kon Nederland, net
5 Doordat de UNFCCC software die gebruikt moet worden voor de rapportage onder het Kyoto protocol nog niet aan alle eisen voldeed, kon Nederland, net als alle landen in de Europese Unie, niet rapporteren over emissies onder het Kyoto Protocol. De verwachting is dat in de eerstvolgende rapportage ook de emissies onder het Kyoto Protocol weer gerapporteerd kunnen worden.
als alle landen in de Europese Unie, niet rapporteren over emissies onder het Kyoto Protocol. De verwachting is dat in de eerstvolgende rapportage ook de emissies onder het Kyoto Protocol weer
gerapporteerd kunnen worden.
Een losse annex bij dit rapport bevat elektronische data over emissies en activiteit data in het zogenaamde Common Reporting Format (CRF), waar door het secretariaat van het VN-Klimaatverdrag om wordt
verzocht. In de bijlagen bij dit rapport is onder meer een overzicht van sleutelbronnen en onzekerheden in de emissie opgenomen.
De NIR gaat niet specifiek in op de invloed van het gevoerde
overheidsbeleid op de emissies van broeikasgassen; meer informatie hierover is te vinden in de Balans van de Leefomgeving (opgesteld door het Planbureau voor de Leefomgeving, PBL) en de zesde Nationale Communicatie onder het Klimaatverdrag, die eind 2013 is verschenen.
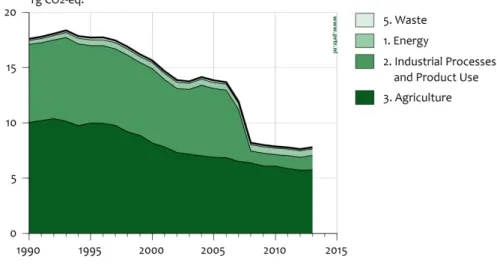
Figuur ES.1 Broeikasgassen: emissieniveaus en emissietrends (exclusief LULUCF), 1990-2013.
Ontwikkeling van de broeikasgasemissies
De emissieontwikkeling in Nederland wordt beschreven en toegelicht in dit National Inventory Report (NIR 2015). Figuur ES.1 geeft het
emissieverloop over de periode 1990-2013 weer. De totale emissies bedroegen in 2013 circa 195,8 Tg (Mton ofwel miljard kg) CO2
equivalenten en zijn daarmee circa 11,5 procent afgenomen in
vergelijking met de emissies in het basisjaar (221,1 Tg CO2 eq). De hier
gepresenteerde emissies zijn exclusief de emissies van landgebruik en bossen (LULUCF).
De emissie van CO2 is sinds 1990 met circa 3 procent toegenomen,
terwijl de emissies van de andere broeikasgassen met circa 49 procent zijn afgenomen ten opzichte van het basisjaar.
In 2013 daalde de CO2 emissie met circa 1,7 procent (ten opzichte van
transport sector, de petrochemische industrie. De emissie van CH4
daalde in 2013 licht ten opzichte van 2012, met ongeveer 0,1 procent. De N2O emissie steeg in 2013 met circa 2 procent ten gevolge
verhoogde emissies in de chemische industrie. De emissie van F-gassen daalden in 2013 met circa 2,5 procent ten opzichte van 2012. De totale emissie van broeikasgassen in 2013 ligt daarmee 0,2 procent lager dan het niveau in 2012.
Box ES.1 Onzekerheden
De emissies van broeikasgassen kunnen niet exact worden gemeten of berekend. Onzekerheden zijn daarom onvermijdelijk. Het RIVM schat de onzekerheid in de jaarlijkse totale broeikasgasemissies op circa 3 procent. Dit is geschat op basis van informatie van emissie-experts in een
eenvoudige analyse van de onzekerheid (volgens IPCC Tier 1). De totale uitstoot van broeikasgassen ligt daarmee met 95 procent betrouwbaarheid tussen de 189 en 200 Tg (Mton). De onzekerheid in de emissietrend tussen het basisjaar (1990/1995) en 2013 is geschat op circa 2 procent; dat wil zeggen dat de emissietrend in die periode met 95 procent betrouwbaarheid ligt tussen de -8 en -12 procent.
Methoden
De methoden die Nederland hanteert voor de berekening van de broeikasgasemissies waren tot en met 2014 vastgelegd in protocollen voor de vaststelling van de emissies. Ten gevolge van de implementatie van de 2006 IPCC Guidelines zijn de protocollen in 2015 vervangen door zogenaamde methoderapporten. De methoderapporten geven een gedetailleerde beschrijving van alle emissie schattingsmethoden voor alle stoffen in de EmissieRegistratie. Deze rapporten zijn opgesteld door deskundigen van de EmissieRegistratie (voor wat betreft de beschrijving en documentatie van de berekeningsmethoden) in nauwe samenwerking met de Rijksdienst voor Ondernemend Nederland (voorheen Agentschap NL)
De methoden rapporten omvatten alle informatie die tot voorheen was opgenomen in de protocollen en zijn te vinden op www.rvo.nl/nie.
Executive summary
ES1 Background information on greenhouse gas (GHG) inventories and climate change
This report documents the Netherlands’ 2015 annual submission of its greenhouse gas (GHG) emissions inventory in accordance with the guidelines provided by the United Nations Framework Convention on Climate Change (UNFCCC)6 and the European Union’s Greenhouse Gas
Monitoring Mechanism. These guidelines, which relate to the 2006 IPCC Guidelines for National Greenhouse Gas Inventories (IPCC, 2006), provide a format for the definition of source categories and for the calculation, documentation and reporting of emissions. The Guidelines are aimed at facilitating verification, technical assessment and expert review of the inventory information by the independent Expert Review Teams (ERTs) of the UNFCCC. The inventories should, therefore, be transparent, consistent, comparable, complete and accurate, as
specified in the UNFCCC Guidelines for reporting, and be prepared using good practice.
This National Inventory Report 2015 (NIR 2015), therefore, provides explanations of the trends in GHG emissions, activity data and (implied) emission factors (EFs) for the period 1990–2013. It also summarizes the methods and data sources used in Tier 1 assessments of uncertainty in annual emissions and in emissions trends; it presents an assessment of key sources of emissions following the Tier 1 and Tier 2 approaches of the 2006 IPCC Guidelines and describes quality assurance and quality control (QA/QC) activities.
This report provides no specific information on the effectiveness of government policies for reducing GHG emissions. This information can be found in Environmental balance (biennial edition; in Dutch: ‘Balans van de Leefomgeving’) prepared by the Netherlands Environmental Assessment Agency (PBL) and the 6th National Communication (NC6) prepared by the Government of the Netherlands.
The Common Reporting Format (CRF) spreadsheet files, containing data on emissions, activity data and implied emission factors (IEFs),
accompany this report. The complete set of CRF tables, as well as the NIR in PDF format, can be found on the website
http://english.rvo.nl/nie.
Please note that the presentation of the figures in this report differs from that of earlier NIRs as a result of the implementation of the 2006 IPCC Guidelines in this submission. Previous NIRs were based on the Revised 1996 IPCC Guidelines (IPCC, 1997).
6 As the UNFCCC software that should be used for the reporting of emissions and removals under the Kyoto Protocol did not function adequately, it was not possible for the Netherlands, like all other EU Member States, to report these emissions and removals. It is foreseen that the next report will contain the supplementary information.
Climate Convention and Kyoto Protocol
This NIR is prepared as part of the Netherlands’ commitment under the UNFCCC and under the Kyoto Protocol. One of its obligations is
establishment of a National System for GHG emissions (Art. 5.1 of the Protocol). This National System, developed in the period 2000–2005, was reviewed by an ERT of the UNFCCC in April 2007 and found to be in compliance with the requirements.
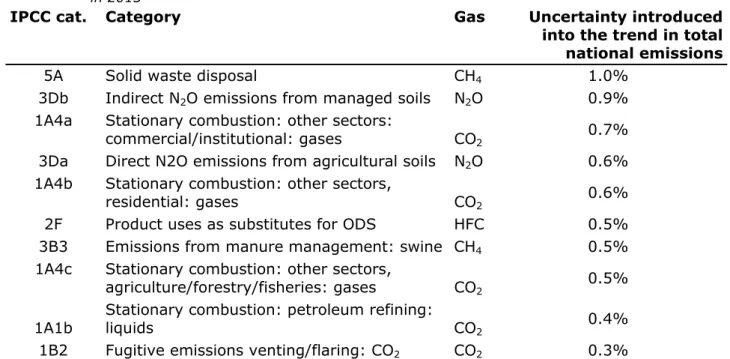
Key categories
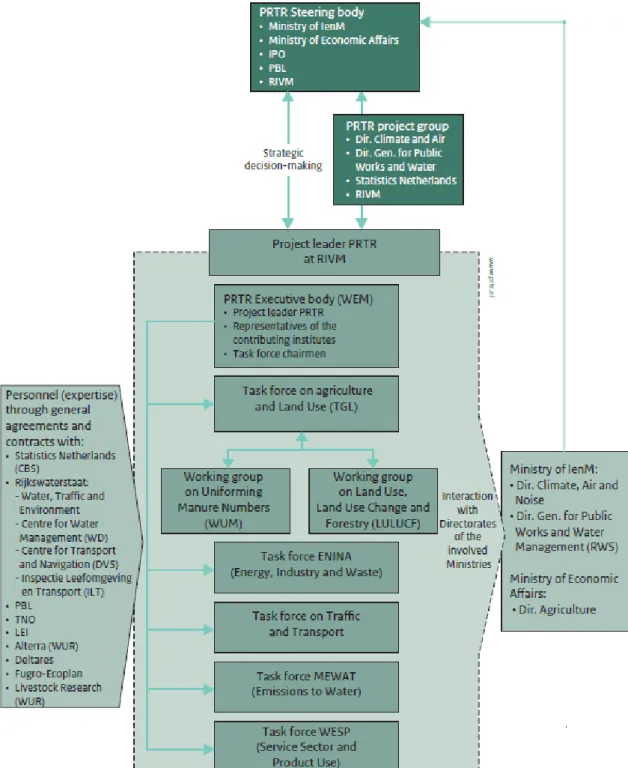
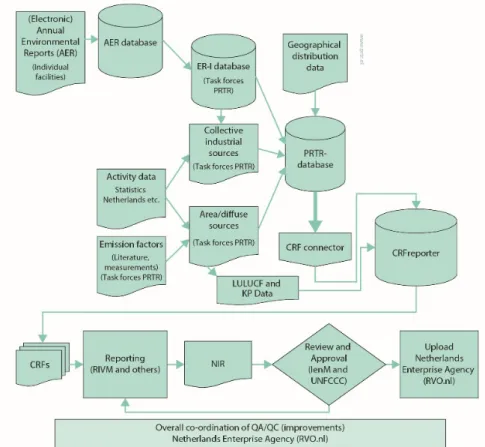
To identify the ‘key categories’ (the source categories which constitute 95% of the national emissions) according to the definition of the 2006 IPCC Guidelines, national emissions are categorized according to the IPCC potential key category list wherever possible. The IPCC Tier 1 method consists of ranking this list of source categories according to their contribution to both national total annual emissions and the national total trend. The results of this ranking are presented in Annex 1: 95% of the national total annual emissions derive from 33 sources and 95% of the national total trend is due to 34 sources, out of a total of 72 sources. The two lists can be combined to give an overview of sources that meet either or both of these two criteria. Next, the IPCC Tier 2 method for identifying the key sources is used; this requires incorporating the uncertainty in the emission estimate of each of these sources before ranking them in relation to their share of total emissions. The result is a list of 45 source categories from the total of 72 that are identified as ‘key sources’. Finally, after inclusion of ten Land use, land use change and forestry (LULUCF) sub-categories in the key category analysis, four more key sources are found in the LULUCF sector. Institutional arrangements for inventory preparation The GHG inventory of the Netherlands is based on the national Pollutant Release and Transfer Register (PRTR). The inventory is compiled annually in accordance with a procedure that has been in operation since 2000, when the process of compiling the GHGs inventory was transformed into a National System, in accordance with the requirements of Article 5.1 of the Kyoto Protocol, under the leadership of the Netherlands Enterprise Agency (RVO.nl) (formerly NL Agency).
The National Institute for Public Health and the Environment (RIVM) has been contracted by the Ministry of Infrastructure and the Environment (IenM) to compile and maintain the PRTR and to co-ordinate the
preparation of the NIR and the completion of the CRF tables (see Figure ES.2). RVO.nl is designated by law as the National Inventory Entity (NIE) and co-ordinates the overall QA/QC activities and the
support/response to the UNFCCC review process. Methodology reports
Under the National System, in accordance with Article 5.1 of the Kyoto Protocol, the methodologies for calculating GHG emissions in the Netherlands were reassessed in 2005 and compared with UNFCCC and IPCC requirements. For all sources and for sinks, the methodologies and processes were elaborated into (about 40) monitoring protocols. These protocols, which described the methodologies according to Revised 1996 IPCC Guidelines (IPCC, 1997), were annually revised, where necessary, and were used until 2014. Revisions to the protocols required an official announcement in the Government gazette (Staatscourant). This
requirement was laid down in the Act on the Monitoring of Greenhouse Gases, which took effect in December 2005.
From 2015 onwards, emissions data must be reported according to the 2006 IPCC Guidelines (IPCC, 2006), implemented in accordance with the UNFCCC Reporting Guidelines. Therefore, the methodologies have been
efficiency, the monitoring protocols have been replaced by five methodology reports, one for each PRTR Task Force. The present CRF/NIR is based on these methodology reports, which are part of the National System. The reports are available at the National System website http://english.rvo.nl/nie. The update of five methodology
reports is simpler than the update of about 40 protocols. In addition, the administrative procedure is simplified because the updated methodology reports do not require an official announcement in the Government
gazette. For this reason, the Act on the Monitoring of Greenhouse Gases
was updated in 2014. The methodology reports are now checked by the National Inventory Entity and approved by the chairperson of the PRTR Task Force concerned.
Organization of the report
This report is organised in line with the prescribed NIR format, starting with an introductory chapter, Chapter 1, which contains background information on the Netherlands’ process of inventory preparation and reporting; key categories and their uncertainties; a description of methods, data sources and emission factors (EFs); and a description of the quality assurance system, along with verification activities applied to the data. Chapter 2 provides a summary of trends in aggregated GHG emissions by gas and by principal source. Chapters 3 to 9 present detailed explanations of emissions in the different CRF sectors. Chapter 10 presents information on recalculations, improvements and responses to issues raised in former reviews and the UNFCCC centralised review of the NIR 2014. In addition, the report provides detailed information on key categories and methodologies and other relevant reports in eight annexes.
This year’s report does not include the usual Part II, containing the supplementary information required under Article 7, paragraph 1 of the Kyoto Protocol, as the UNFCCC CRF reporter software that should be used for reporting of emissions and removals did not function
adequately. It is expected that next year’s report will contain the supplementary information.
ES2 Summary of trends in national emissions and removals In 2013, total direct GHG emissions (excluding emissions from LULUCF) in the Netherlands were estimated at 195.8 Tg CO2 equivalents (CO2
eq). This is approximately 11.5% below the emissions in the base years (221.1 Tg CO2 eq). In the Netherlands, the base year for emissions of
CO2, CH4 and N2O is 1990, and the base year for emissions of
fluorinated gases (F-gases) is 1995. CO2 emissions (excluding LULUCF)
increased by about 3.5% from 1990 to 2013, mainly due to an increase in emissions in the Public Electricity and Transport) categories. CH4
emissions in 2013 decreased by 42% compared with 1990 levels, mainly due to decreases in emissions from the Waste sector and the
Agricultural sector and in fugitive emissions from the Energy sector. N2O
emissions decreased by 56% in 2013 compared with 1990, mainly due to decreases in emissions from Agriculture and from Industrial
processes, which partly compensated for N2O emissions increases from
fossil fuel combustion (mainly from Transport). The emissions of F-gases (HFCs, PFCs and SF6) decreased in the period 1995 (chosen as the base
year) to 2013 by 70%, 94% and 52%, respectively. Total emissions of all F-gases were approximately 75% lower than in 1995.
Between 2012 and 2013, CO2 emissions (excluding LULUCF) decreased
by 2.9 Tg. Emissions of CH4 also showed a decrease – of just under 0.2
Tg – between 2012 and 2013. In the same period, N2O emissions
increased by nearly 0.2 Tg CO2 eq. Emissions of HFCs, PFCs and SF6 did
not change significantly in 2013. Total F-gas emissions decreased by 0.05 Tg CO2 eq.
Overall, total GHG emissions decreased by about 0.24% in comparison with 2012.
Total CO2-eq emissions including LULUCF decreased between 2012 and
2013 by 0.4 Tg to the level of 202.0 Tg CO2 eq.
ES3 Overview of source and sink category emissions estimates and trends
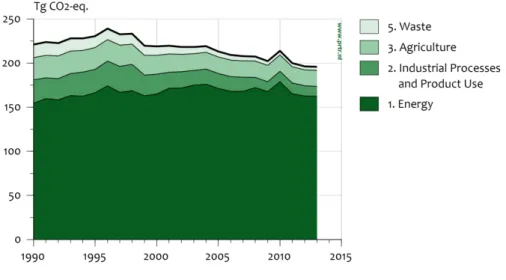
Tables ES.1 and ES.2 provide an overview of the emissions trends (in CO2 equivalents) per gas and per IPCC source category. The Energy
sector is by far the largest contributor to national total GHG emissions. Emissions from this sector were substantially higher than in 1990. In contrast, emissions from the other sectors were lower than in the base year, the largest decreases being in Industrial processes, Waste and Agriculture.
Categories showing the largest increase in CO2-equivalent emissions
since 1990 are Transport (1A3) and Energy industries (1A1) (+34% and +18%, respectively). It should be noted that half the increase of almost 30% in the Public electricity category (1A2) between 1990 and 1998 was caused by a shift of cogeneration plants from Manufacturing industries to the Public electricity and heat production sector due to a change of ownership (joint ventures), which simultaneously caused a 15% decrease in Industry emissions in the early 1990s.
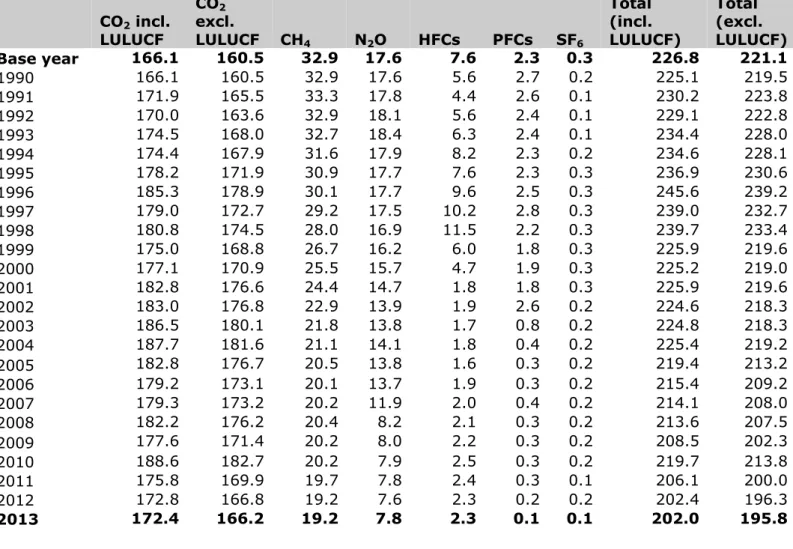
Table ES.1 Summary of emissions trends per gas (Tg CO2 equivalents) CO2 incl. LULUCF CO2 excl. LULUCF CH4 N2O HFCs PFCs SF6 Total (incl. LULUCF) Total (excl. LULUCF) Base year 166.1 160.5 32.9 17.6 7.6 2.3 0.3 226.8 221.1 1990 166.1 160.5 32.9 17.6 5.6 2.7 0.2 225.1 219.5 1991 171.9 165.5 33.3 17.8 4.4 2.6 0.1 230.2 223.8 1992 170.0 163.6 32.9 18.1 5.6 2.4 0.1 229.1 222.8 1993 174.5 168.0 32.7 18.4 6.3 2.4 0.1 234.4 228.0 1994 174.4 167.9 31.6 17.9 8.2 2.3 0.2 234.6 228.1 1995 178.2 171.9 30.9 17.7 7.6 2.3 0.3 236.9 230.6 1996 185.3 178.9 30.1 17.7 9.6 2.5 0.3 245.6 239.2 1997 179.0 172.7 29.2 17.5 10.2 2.8 0.3 239.0 232.7 1998 180.8 174.5 28.0 16.9 11.5 2.2 0.3 239.7 233.4 1999 175.0 168.8 26.7 16.2 6.0 1.8 0.3 225.9 219.6 2000 177.1 170.9 25.5 15.7 4.7 1.9 0.3 225.2 219.0 2001 182.8 176.6 24.4 14.7 1.8 1.8 0.3 225.9 219.6 2002 183.0 176.8 22.9 13.9 1.9 2.6 0.2 224.6 218.3 2003 186.5 180.1 21.8 13.8 1.7 0.8 0.2 224.8 218.3 2004 187.7 181.6 21.1 14.1 1.8 0.4 0.2 225.4 219.2 2005 182.8 176.7 20.5 13.8 1.6 0.3 0.2 219.4 213.2 2006 179.2 173.1 20.1 13.7 1.9 0.3 0.2 215.4 209.2 2007 179.3 173.2 20.2 11.9 2.0 0.4 0.2 214.1 208.0 2008 182.2 176.2 20.4 8.2 2.1 0.3 0.2 213.6 207.5 2009 177.6 171.4 20.2 8.0 2.2 0.3 0.2 208.5 202.3 2010 188.6 182.7 20.2 7.9 2.5 0.3 0.2 219.7 213.8 2011 175.8 169.9 19.7 7.8 2.4 0.3 0.1 206.1 200.0 2012 172.8 166.8 19.2 7.6 2.3 0.2 0.2 202.4 196.3 2013 172.4 166.2 19.2 7.8 2.3 0.1 0.1 202.0 195.8
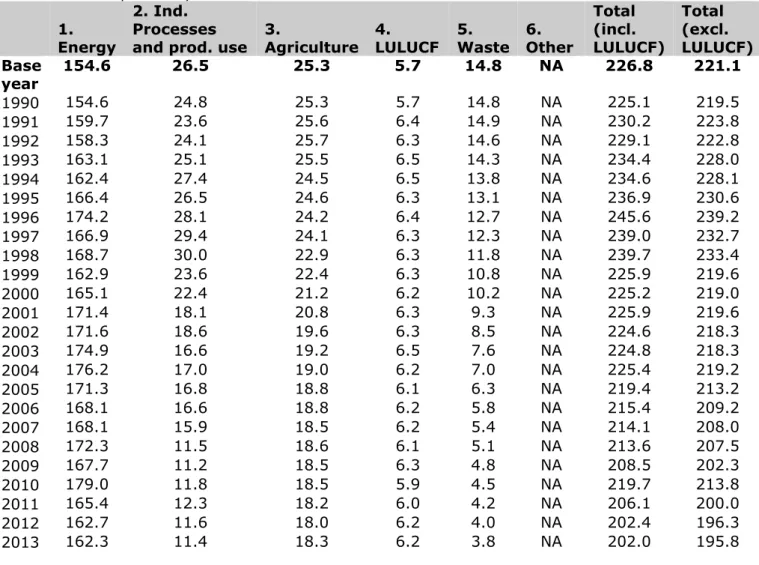
Table ES.2 Summary of emissions trends per source category (Tg CO2 equivalents) 1. Energy 2. Ind. Processes
and prod. use 3. Agriculture 4. LULUCF 5. Waste 6. Other
Total (incl. LULUCF) Total (excl. LULUCF) Base year 154.6 26.5 25.3 5.7 14.8 NA 226.8 221.1 1990 154.6 24.8 25.3 5.7 14.8 NA 225.1 219.5 1991 159.7 23.6 25.6 6.4 14.9 NA 230.2 223.8 1992 158.3 24.1 25.7 6.3 14.6 NA 229.1 222.8 1993 163.1 25.1 25.5 6.5 14.3 NA 234.4 228.0 1994 162.4 27.4 24.5 6.5 13.8 NA 234.6 228.1 1995 166.4 26.5 24.6 6.3 13.1 NA 236.9 230.6 1996 174.2 28.1 24.2 6.4 12.7 NA 245.6 239.2 1997 166.9 29.4 24.1 6.3 12.3 NA 239.0 232.7 1998 168.7 30.0 22.9 6.3 11.8 NA 239.7 233.4 1999 162.9 23.6 22.4 6.3 10.8 NA 225.9 219.6 2000 165.1 22.4 21.2 6.2 10.2 NA 225.2 219.0 2001 171.4 18.1 20.8 6.3 9.3 NA 225.9 219.6 2002 171.6 18.6 19.6 6.3 8.5 NA 224.6 218.3 2003 174.9 16.6 19.2 6.5 7.6 NA 224.8 218.3 2004 176.2 17.0 19.0 6.2 7.0 NA 225.4 219.2 2005 171.3 16.8 18.8 6.1 6.3 NA 219.4 213.2 2006 168.1 16.6 18.8 6.2 5.8 NA 215.4 209.2 2007 168.1 15.9 18.5 6.2 5.4 NA 214.1 208.0 2008 172.3 11.5 18.6 6.1 5.1 NA 213.6 207.5 2009 167.7 11.2 18.5 6.3 4.8 NA 208.5 202.3 2010 179.0 11.8 18.5 5.9 4.5 NA 219.7 213.8 2011 165.4 12.3 18.2 6.0 4.2 NA 206.1 200.0 2012 162.7 11.6 18.0 6.2 4.0 NA 202.4 196.3 2013 162.3 11.4 18.3 6.2 3.8 NA 202.0 195.8
ES4 Other information
General uncertainty evaluation
The results of the uncertainty estimation according to the IPCC Tier 1 uncertainty approach are summarized in Annex 2 of this report. The Tier 1 estimation of annual uncertainty in CO2-eq emissions results in an
overall uncertainty of 3%, based on calculated uncertainties of 2% for CO2 (excluding LULUCF), 18% for CH4, 43% for N2O and 40–42% for
F-gases.
However, these figures do not include the correlation between source categories (e.g. cattle numbers for enteric fermentation and animal manure production), nor a correction for non-reported sources.
Therefore, the actual uncertainty of total annual emissions per gas and of the grand total will be somewhat higher; it is currently estimated by the RIVM at:
CO2 ± 3% HFCs ± 50%
CH4 ± 25% PFCs (incl NF3) ± 50%
Annex 2 summarizes the estimates of the trend uncertainties 1990– 2013 calculated according to the IPCC Tier 1 approach set out in the 2006 IPCC Guidelines. The result is a trend uncertainty in total CO2-eq
emissions (including LULUCF) for 1990–2013 (1995–2013 for F-gases) of ± 2%. This means that the trend in total CO2-eq emissions between
1990 and 2013 (excluding LULUCF), which is calculated to be a 10% decrease, will be between a 12% decrease and an 8% decrease. Per individual gas, the trend uncertainties in total emissions of CO2, CH4,
N2O and the total group of F-gases have been calculated at ± 2%,
± 6%, ± 7% and ± 13%, respectively. More details of the trend uncertainty assessment can be found in Annex 2.
Completeness of the national inventory
The Netherlands’ GHG emissions inventory includes almost all sources identified by the 2006 IPCC Guidelines. The following very minor sources are not included in the inventory:
• CO2 from Asphalt roofing (2D3), due to missing activity data;
• CO2 from Road paving (2D3), due to missing activity data;
• CH4 from Enteric fermentation of poultry (3A4), due to missing
EFs;
• N2O from Industrial wastewater (5D2), due to negligible
amounts;
• Part of CH4 from Industrial wastewater (5D2 sludge), due to
negligible amounts.
Precursor emissions (carbon monoxide (CO), nitrogen oxide (NOx),
non-methane volatile organic compounds (NMVOC) and sulphur dioxide (SO2)) from memo item ‘International bunkers’ (international transport)
are not included.
Methodological changes, recalculations and improvements This NIR (2015) is based on the National System of the Netherlands, in accordance with Article 5.1 of the Kyoto Protocol. In past years, the results of various improvement actions have been implemented in the methodologies and processes of compiling the GHG inventory of the Netherlands. Compared with the NIR 2014 and based on the results of the UNFCCC reviews, some improvements of the inventory (including minor recalculations) have been undertaken in the last year. The main changes in this submission are the adoption of the 2006 IPCC Guidelines (including new GWPs and an updated list of fuels) and a methodology change in the Agricultural sector (manure management). The rationale behind the recalculations is documented in Chapters 3–10.
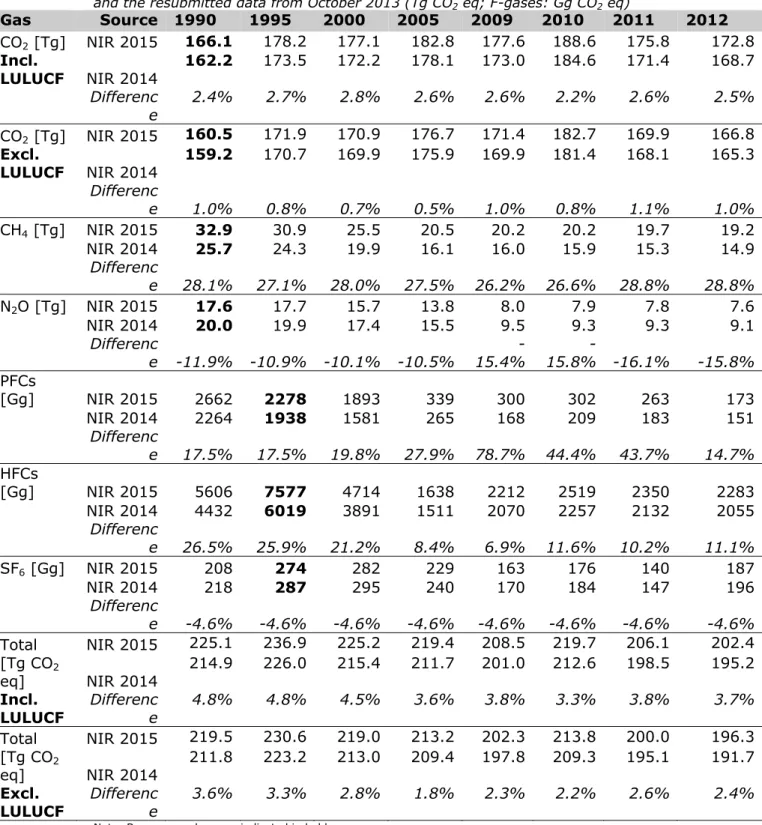
Table ES.3 shows the results of recalculations in the NIR 2015 compared with the NIR 2014.
Table ES.3 Differences between NIR 2015 and NIR 2014 due to recalculations and the resubmitted data from October 2013 (Tg CO2 eq; F-gases: Gg CO2 eq)
Gas Source 1990 1995 2000 2005 2009 2010 2011 2012 CO2 [Tg] NIR 2015 166.1 178.2 177.1 182.8 177.6 188.6 175.8 172.8 Incl. LULUCF NIR 2014 162.2 173.5 172.2 178.1 173.0 184.6 171.4 168.7 Difference 2.4% 2.7% 2.8% 2.6% 2.6% 2.2% 2.6% 2.5% CO2 [Tg] NIR 2015 160.5 171.9 170.9 176.7 171.4 182.7 169.9 166.8 Excl. LULUCF NIR 2014 159.2 170.7 169.9 175.9 169.9 181.4 168.1 165.3 Difference 1.0% 0.8% 0.7% 0.5% 1.0% 0.8% 1.1% 1.0% CH4 [Tg] NIR 2015 32.9 30.9 25.5 20.5 20.2 20.2 19.7 19.2 NIR 2014 25.7 24.3 19.9 16.1 16.0 15.9 15.3 14.9 Difference 28.1% 27.1% 28.0% 27.5% 26.2% 26.6% 28.8% 28.8% N2O [Tg] NIR 2015 17.6 17.7 15.7 13.8 8.0 7.9 7.8 7.6 NIR 2014 20.0 19.9 17.4 15.5 9.5 9.3 9.3 9.1 Difference -11.9% -10.9% -10.1% -10.5% 15.4% - 15.8% -16.1% - -15.8% PFCs [Gg] NIR 2015 2662 2278 1893 339 300 302 263 173 NIR 2014 2264 1938 1581 265 168 209 183 151 Difference 17.5% 17.5% 19.8% 27.9% 78.7% 44.4% 43.7% 14.7% HFCs [Gg] NIR 2015 5606 7577 4714 1638 2212 2519 2350 2283 NIR 2014 4432 6019 3891 1511 2070 2257 2132 2055 Difference 26.5% 25.9% 21.2% 8.4% 6.9% 11.6% 10.2% 11.1% SF6 [Gg] NIR 2015 208 274 282 229 163 176 140 187 NIR 2014 218 287 295 240 170 184 147 196 Difference -4.6% -4.6% -4.6% -4.6% -4.6% -4.6% -4.6% -4.6% Total NIR 2015 225.1 236.9 225.2 219.4 208.5 219.7 206.1 202.4 [Tg CO2 eq] NIR 2014 214.9 226.0 215.4 211.7 201.0 212.6 198.5 195.2 Incl. LULUCF Difference 4.8% 4.8% 4.5% 3.6% 3.8% 3.3% 3.8% 3.7% Total NIR 2015 219.5 230.6 219.0 213.2 202.3 213.8 200.0 196.3 [Tg CO2 eq] NIR 2014 211.8 223.2 213.0 209.4 197.8 209.3 195.1 191.7 Excl. LULUCF Difference 3.6% 3.3% 2.8% 1.8% 2.3% 2.2% 2.6% 2.4%
Note: Base year values are indicated in bold. Improving the QA/QC system
The QA/QC (quality assurance/quality control) programme is up to date and all procedures and processes meet National System requirements (as part of the annual activity programme of the Netherlands’ PRTR). QA/QC activities needing to be undertaken as part of the National
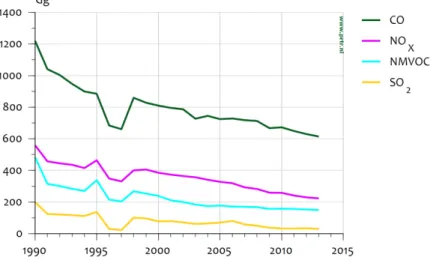
Emissions trends for indirect GHGs and SO2
Compared with 1990, CO and NMVOC emissions were reduced in 2013 by 56% and 69%, respectively. For SO2, the reduction was 83%; for
NOx, the 2012 emissions were 59% lower than the 1990 level. Table
ES.4 provides trend data. In contrast to the direct GHGs, precursor emissions from road transport have not been corrected in relation to fuel sales as recorded in national energy statistics (compiled by Statistics Netherlands), but are directly related to transport statistics on vehicle-km – a method that differs to some extent from the IPCC approach. Recalculations (due to changes in methodologies and/or allocation) have been performed only for 1990, 1995, 2000, 2005 and 2010 to 2012 for all sources.
Table ES.4 Emissions trends for indirect GHGs and SO2 (Gg)
1990 1995 2000 2005 2010 2011 2012 2013 Total NOX 559 463 384 328 319 293 282 260 Total CO 1,219 885 810 724 728 718 714 668 Total NMVOC 483 339 238 178 171 169 167 157 Total SO2 198 138 77 69 80 59 49 37
1 Introduction
1.1 Background information on greenhouse gas inventories and climate change
1.1.1 Background information on climate change
The United Nations Framework Convention on Climate Change
(UNFCCC) was ratified for the European part of the Netherlands in 1994 and took effect in March 1994. One of the commitments made by the ratifying Parties to the Convention was to develop, publish and regularly update national emissions inventories of greenhouse gases (GHGs). This National Inventory Report (NIR), together with the Common Reporting Format (CRF) tables, represents the 2013 national emissions inventory of GHGs under the UNFCCC (Part 1 of this report) The Kyoto Protocol reporting (normally Part 2 of this report) is not included in the NIR this year.
Geographical coverage
The reported emissions are those that derive from the legal territory of the Netherlands. This includes a 12-mile zone out from the coastline and inland water bodies. It excludes Aruba, Curaçao and Sint Maarten, which are constituent countries of the Kingdom of the Netherlands. It also excludes Bonaire, Saba and Sint Eustatius, which since 10 October 2010 have been public bodies (openbare lichamen) with their own legislation that is not applicable to the European part of the Netherlands. Emissions from offshore oil and gas production on the Dutch part of the continental shelf are included.
1.1.2 Background information on GHG inventory
As indicated, this NIR documents the 2013 Greenhouse Gas Emission Inventory for the Netherlands under the UNFCCC and under the Kyoto Protocol. The estimates provided in the report are consistent with the Intergovernmental Panel on Climate Change (IPCC) 2006 Guidelines for National Greenhouse Gas Inventories (IPCC, 2006). The methodologies applied to the Netherlands’ inventory are also consistent with the guidelines under the Kyoto Protocol and the European Union’s Greenhouse Gas Monitoring Mechanism.
For detailed assessments of the extent to which changes in emissions are due to the implementation of policy measures, see the
Environmental Balance (PBL, 2009; in Dutch), the Sixth Netherlands national communication under the United Nations Framework
Convention on Climate Change (IenM, 2013) and the Netherlands’ report on demonstrable progress under Article 3.2 of the Kyoto Protocol
(VROM, 2006).
The Netherlands also reports emissions under other international agreements, such as the United Nations Economic Commission for Europe (UNECE), the Convention on Long Range Transboundary Air Pollutants (CLRTAP) and the EU’s National Emission Ceilings (NEC) Directive. All emission estimates are taken from the Netherlands’ Pollutant Release and Transfer Register (PRTR), which is compiled by a
special project in which various organizations co-operate. The GHG inventory and the PRTR share underlying data, which ensures
consistency between the inventories and other internationally reported data. Several institutes are involved in the process of compiling the GHG inventory (see also Section 1.3).
The NIR covers the seven direct GHGs included in the Kyoto Protocol: carbon dioxide (CO2), methane (CH4), nitrous oxide (N2O),
hydrofluorocarbons (HFCs), perfluorocarbons (PFCs) and sulphur
hexafluoride (SF6) (the last three are called the F-gases; NF3 is included
in the figure for PFCs but cannot be reported separately due to the confidentiality of the data). Emissions of the following indirect GHGs are also reported: nitrogen oxides (NOx), carbon monoxide (CO), and
non-methane volatile organic compounds (NMVOCand sulphur oxides (SOx).
This report provides explanations of the trends in GHG emissions per gas and per sector for the 1990–2013 period and summarizes the methods used and data sources for: (a) Tier 1 assessments of the uncertainty in annual emissions and in emissions trends; (b) key source assessments following the Tier 1 and Tier 2 approaches of the 2006 IPCC Guidelines; (c) quality assurance and quality control (QA/QC) activities.
Under the National System, in accordance with Article 5.1 of the Kyoto Protocol, the methodologies for calculating GHG emissions in the Netherlands were reassessed in 2005 and compared with UNFCCC and IPCC requirements. For the key sources and for sinks, the
methodologies and processes were elaborated into (about 40) monitoring protocols. These protocols, which described the
methodologies according to the Revised 1996 IPCC Guidelines (IPCC, 1997), were annually revised, where necessary, and used until 2014. Adjustments to the protocols required an official announcement in the
Government gazette (Staatscourant).
From 2015 onwards, emissions data must be reported according to the 2006 IPCC Guidelines (implemented in accordance with the UNFCCC Reporting Guidelines). Therefore, the methodologies have been aligned with those Guidelines. At the same time, for reasons of efficiency, the monitoring protocols have been replaced by five methodology reports, one for each PRTR Task Force. The present NIR is based on the
methodogies described in these methodology reports, which should be considered as part of the National System. The reports are available at the National System website http://english.rvo.nl/nie. The maintenance of five methodology reports is easier than the update of 40 protocols. In addition, the administrative procedure is simplified because the
methodology reports do not require an official announcement in the
Government gazette. For this reason, the Act on the Monitoring of
Greenhouse Gases was updated in 2014. The methodology reports are reviewed by the National Inventory Entity and approved by the
chairperson of the PRTR Task Force concerned.
In 2007, the UN performed an in-country initial review under the Kyoto Protocol. The review concluded that the Netherlands’ National System had been established in accordance with the guidelines and that it met
the requirements. This was confirmed by later reviews, such as the review of the NIR 2014.
Since then, the following two changes to the National System have been implemented:
On 1 January 2010, co-ordination of the aforementioned PRTR (emissions registration) project shifted from the PBL
(Netherlands Environmental Assessment Agency) to the RIVM (National Institute for Public Health and the Environment). In 2010, institutional arrangements were made to ensure the quality of the products of the PRTR project in the new setting. From the NIR 2015 onwards, the system of monitoring protocols
(including methodology descriptions) has been replaced by the production of five methodology reports. As a result, the official announcement in the Government gazette of revised monitoring protocols has been replaced by the approval of the methodology reports by the National Inventory Entity (NIE).
The structure of this report complies with the format required by the UNFCCC (outline and general structure of the national inventory report as described in UNFCCC Decision 24/CP.19). As a result of the
inadequate functioning of the reporter software this years submission does not includes supplementary information under Article 7 of the Kyoto Protocol (normally reported inPart 2 of the report).
Greenhouse gas (GHG) emissions are given in gigagrams (Gg) and teragrams (Tg) in this report. Global warming potential (GWP) weighted emissions of the GHGs are also provided (in CO2 equivalents), using
GWP values based on the effects of GHGs over a 100-year horizon, in accordance with UNFCCC Decision 24/CP.19 Annex III. The GWP of each individual GHG is given in Annex 7.
The Common Reporting Format (CRF) spreadsheet files accompany this report as electronic annexes. The CRF tables contain detailed
information on GHG emissions, activity data and (implied) emission factors (EFs) by sector, source category and GHG. The complete set of CRF tables and this report comprise the NIR, which is published on the website http://english.rvo.nl/nie.
Chapter 10 provides details of the extent to which the CRF data files for 1990–2013 have been completed and of improvements made since the last submission.
According to Decision 13/CP.20 of the Conference of the Parties to the UNFCCC, CRF Reporter version 5.0.0 was usedin order to enable Annex I Parties to submit their CRF tables for the year 2015. In the same
Decision, the Conference of the Parties reiterated that Annex I Parties in 2015 may submit their CRF tables after 15 April, but no later than the end of the corresponding delay in the CRF Reporter availability.
‘Functioning’ software means that the data on GHG emissions/removals is reported accurately in terms of both reporting format tables and XML format.
therefore does not yet allow submission of all the information required under the Kyoto Protocol.
Bearing in mind the Conference of Parties’ invitation to submit as soon as practically possible, and considering that CRF Reporter 5.10 allows sufficiently accurate reporting under the UNFCCC (even if minor
inconsistencies may still exist in the reporting tables, as per the Release Note accompanying CRF Reporter 5.10), the present report is the official submission for the year 2015 under the UNFCCC. The present report is not an official submission under the Kyoto Protocol, even though some of the information included may relate to the requirements under the Kyoto Protocol.
1.1.3 Background information on supplementary information under Article 7 of the Kyoto Protocol
Part 2 of this report should provide the supplementary information under Article 7 of the Kyoto Protocol, as the UNFCCC software that should be used for reporting of emissions and removals did not function
completely. It is exptected that next year’s report will contain the supplementary information.
1.2 A description of the national inventory arrangements
1.2.1 Institutional, legal and procedural arrangements
The Ministry of Infrastructure and the Environment (IenM) bears overall responsibility for climate change policy issues, including the preparation of the national GHG inventory.
In December 2005, the Netherlands Enterprise Agency (RVO.nl, formerly NL Agency) was designated by law as the National Inventory Entity (NIE), the single national entity required under the Kyoto Protocol. In addition to the co-ordination of the establishment and maintenance of a National System, the tasks of RVO.nl include overall co-ordination of improved QA/QC activities as part of the National System and co-ordination of the support/response to the UNFCCC review process. The National System is described in greater detail in the Sixth Netherlands
national communication under the United Nations Framework Convention on Climate Change (IenM, 2013).
The RIVM has been assigned by the IenM as the institute responsible for co-ordinating the compilation and maintainance of the pollutants
emission register/inventory (PRTR system), which contains data on approximately 350 pollutants, including the GHGs. The PRTR project system is used as the basis for the NIR and for the completion of the CRF tables.
1.2.2 Overview of inventory planning, preparation and management
The Dutch PRTR system has been in operation in the Netherlands since 1974. This system encompasses data collection, data processing and the registering and reporting of emissions data for approximately 350
policy-relevant compounds and compound groups that are present in air, water and soil. The emissions data is produced in an annual (project) cycle (RIVM, 2014). This system also serves as the basis for
the national GHG inventory. The overall co-ordination of the PRTR is outsourced by the IenM to the RIVM.
The main purpose of the PRTR is to help in the production of an annual set of unequivocal emissions data that is up to date, complete,
transparent, comparable, consistent and accurate. In addition to the RIVM, various external agencies contribute to the PRTR by performing calculations or submitting activity data. These include Statistics
Netherlands, PBL (Netherlands Environmental Assessment Agency), TNO (Netherlands Organization for Applied Scientific Research),
Rijkswaterstaat Environment, Centre for Water Management, Deltares and several institutes related to the Wageningen University and Research Centre (WUR).
1.2.2.1 Responsibility for reporting
The NIR Part 1 is prepared by the RIVM as part of the PRTR project. Most institutes involved in the PRTR also contribute to the NIR (including Statistics Netherlands and TNO). In addition, RVO.nl is involved in its role as NIE. As such, RVO.nl also normally prepares the NIR Part 2 and is responsible for submission to the UNFCCC. Submission to the UNFCCC takes place only after approval by the IenM.
1.2.2.2 Overview of the inventory preparation and management under Article 7 of the Kyoto Protocol
Following the annotated outline, the supplementary information, as required according to Article 2 of the Kyoto Protocol, is usually reported in the NIR Part 2. This information is prepared by RVO.nl using
information from various other organizations involved, such as the NEa (Dutch Emissions Authority), the WUR and the IenM.
KP-LULUCF is not reported in this NIR.
1.2.3 Reporting, QA/QC, archiving and overall co-ordination
The NIR is prepared by the RIVM with input from the relevant PRTR Task Forces and from RVO.nl. The preparation of the NIR also includes the documentation and archiving of statistical data for the estimates and QA/QC activities. The IenM formally approves the NIR before it is submitted; in some cases, approval follows consultation with other ministries. RVO.nl is responsible for co-ordinating QA/QC and responses to the EU and for providing additional information requested by the UNFCCC after the NIR and the CRF have been submitted. RVO.nl is also responsible for co-ordinating the submission of supporting data to the UNFCCC review process.
1.2.3.1 Information on the QA/QC plan
The National System, in line with the Kyoto requirements, was finalized and established by the end of 2005. As part of this system, the Act on the Monitoring of Greenhouse Gases also took effect in December 2005. This Act requires the establishment of the National System for the monitoring of GHGs and empowered the Minister for Infrastructure and Environment to appoint an authority responsible for the National System and the National GHG Inventory. In a subsequent regulation, the
Minister appointed RVO.nl as the NIE (National Inventory Entity, the single national entity required under the Kyoto Protocol).
As part of its National System, the Netherlands has developed and implemented a QA/QC programme. This programme is assessed annually and updated, if necessary. The key elements of the current programme (RVO.nl, 2014) are summarized in this chapter, notably those related to the current NIR.
1.2.3.2 QA/QC procedures for the CRF/NIR 2015
The system of methodology reports was elaborated and implemented in order to increase the transparency of the inventory (including
methodologies, procedures, tasks, roles and responsibilities with regard to inventories of GHGs). Transparent descriptions of all these aspects are included in the methodology reports for each gas and sector and in process descriptions for other relevant tasks in the National System. The methodology reports are assessed annually and updated, if necessary. Several QC issues relate to the NIR:
The ERT recommended providing more information in the NIR report, which is now included in the background information. As most of the background documentation is in English and is available for review purposes, this background information is not included in the methodology reports. This does not diminish the constant attention given by the Task Forces to further improve the quality and transparency of the methodology reports. The ERT recommended providing more detailed information on
sector-specific QC activities. In 2009 and early 2010, a project was performed to reassess and update both the information on uncertainties and the information on sector-specific QC activities (Ecofys, 2010). The PRTR Task Forces continued to work on the implementation of the recommendations from this report in 2015, especially in relation to the documentation of uncertainties in the PRTR database.
The Netherlands continues its efforts to include the correct notation keys in the CRF tables.
For the NIR 2015, changes were incorporated in and references were updated to the National System website (http://english.rvo.nl/nie), providing additional information on the methodology reports and relevant background documents.
To facilitate the general QC checks, a checklist was developed and implemented. A number of general QC checks have been introduced as part of the annual work plan of the PRTR and are also mentioned in the methodology reports. The QC checks included in the work plan are aimed at covering issues such as the consistency, completeness and correctness of the CRF data. The general QC for the present inventory was largely performed at the institutes involved as an integrated part of their PRTR work (Wever, 2011). The PRTR Task Forces fill in a standard-format database with emissions data for 1990–2013 (with the exception of LULUCF). After a first check of the data by the RIVM and TNO for completeness, the (corrected) data is made available to the relevant Task Forces for consistency checks and trend analyses (comparability, accuracy). The Task Forces have access to the national emissions database. Several weeks before the dataset was fixed, a trend
verification workshop was organized by the RIVM (December 2014; see Box 1.1). The conclusions of this workshop, including the actions for the Task Forces to resolve the identified clarification issues, is documented at the RIVM. Required changes to the database are then made by the Task Forces.
Basic LULUCF data (e.g. forest inventories, forests statistics and land use maps) has a different routing compared with the other basic data (see Figure 1.1). QA/QC for this data are elaborated in the description of QA/QC of the outside agencies (Wever, 2011).
Quality assurance for the current NIR includes the following activities:
Due to the late availability of the CRF tables, the NIR was delayed, with the result that the usual peer and public reviews did not take place. Next year, a peer and public review are planned again.
In the preparation of this NIR, the results of former UNFCCC reviews were taken onboard and used to improve the NIR (see Chapter 10.4 for an overview).
The QA/QC system must operate within the available means (capacity, finance). Within those means, the focal points of the QA/QC activities are:
The QA/QC programme (RVO.nl, 2014) that has been developed and implemented as part of the National System. This
programme includes quality objectives for the National System, the QA/QC plan and a schedule for the implementation of the activities. It is updated annually as part of an ‘evaluation and improvement cycle’ for the inventory and National System and is kept available for review.
The adaptation of the PRTR project to the quality system of the RIVM (ISO 9001:2008 system), completed in 2012;
The annual work plan of the RIVM (RIVM, 2014). The work plan describes the tasks and responsibilities of the parties involved in the PRTR process, such as products to be delivered, scheduling (planning) and emissions estimation (including the methodology reports on GHGs), as well as those of the members of the Task Forces. The annual work plan also describes the general QC activities to be performed by the Task Forces before the annual PRTR database is fixed (see section 1.6.2).
Responsibility for the quality of data in annual environmental
reports (AER) and validation of the data. The former lies with the
companies themselves, the latter with the competent authorities. It is the responsibility of the institutes involved in the PRTR to judge whether or not to use the validated data of individual companies to be used in the calculation of the national total emissions. (CO2 emissions, however, are based on energy
statistics and standard EFs, and only approved specific EFs from AERs are used.)
Agreements/covenants between the RIVM and other institutes involved in the annual PRTR process. The general agreement is that, by accepting the annual work plan, the institutes involved commit themselves to deliver capacity for the work/products
institute have been described (and agreed upon) within the framework of the PRTR work plan.
Specific procedures that have been established to fulfil the QA/QC requirements of the UNFCCC and Kyoto Protocol. General agreements on these procedures are described in the QA/QC programme as part of the National System. The following specific procedures and agreements have been set out and described in the QA/QC plan and the annual PRTR work plan:
o QC on data input and data processing, as part of the annual trend analysis and consolidation of the database following approval of the involved institutions.
o Documentation of the consistency, completeness and correctness of the CRF data (also see Section 1.6.2). Documentation is required for all changes in the historical dataset (recalculations) and for emissions trends that exceed 5% at the sector level and 0.5% at the national total level. In doing so the Netherlands are strict, as, according to the IPCC 2006, only changes in trend greater than 10% need to be checked.
o Peer reviews of the CRF tables and NIR by RVO.nl and institutions not directly involved in the PRTR process;
o Public review of the draft NIR: Every year, RVO.nl organizes a public review (via the internet). Relevant comments are incorporated in the final NIR.
o Audits: In the context of the annual work plan, it has been agreed that the institutions involved in the PRTR will inform the RIVM about forthcoming internal audits. Furthermore, RVO.nl is assigned the task of organizing audits, if needed, of relevant processes or organizational issues within the National System.
o Archiving and documentation: Internal procedures are agreed (in the PRTR annual work plan,) for general data collection and the storage of fixed datasets in the RIVM database, including the documentation/archiving of QC checks. Since 2012, the RIVM database has held storage space where the Task Forces can store the data needed for their emissions calculations. The use of this storage space is optional, as the storage of essential data is also guaranteed by the quality systems at the outside agencies.
o The methodology reports have been documented and will be published on the website http://english.rvo.nl/nie. To improve transparency, the implemented QC checklists have also been documented and archived. As part of the QA/QC plan, the documentation and archiving system has been further
upgraded. RVO.nl (as the NIE) maintains the National System website and a central archive of relevant National System documents.
o Their own QA/QC procedures apply whenever a contributing institution cite or quote data from the annually fixed database in their own reports.
Annual inventory improvement: Within the inventory project, resources are available to keep the total inventory up to the latest standards. In an annual cycle, the Task Forces are invited to draft proposals for the improvement of their emissions estimates. The