RIVM report 260601002/2005
Potential health benefits and cost effectiveness of tobacco tax increases and school intervention programs targeted at adolescents in the
Netherlands
PHM van Baal, SMC Vijgen, WJE Bemelmans, RT Hoogenveen, TL Feenstra
This investigation has been performed by order and for the account of the Ministry of Public Health, within the framework of project V/260601, “Tobacco control”
RIVM, P.O. Box 1, 3720 BA Bilthoven, telephone: 31 - 30 - 274 91 11; telefax: 31 - 30 - 274 29 71 Contact: PHM van Baal
Department for Prevention and Health Services Research (PZO) Pieter.van.Baal@rivm.nl
Rapport in het kort
Potentiële gezondheidswinst en kosten effectiviteit van accijnsverhogingen op tabaksproducten en interventieprogramma’s op scholen gericht op jongeren in Nederland
Bij jongeren kan veel gezondheidswinst behaald worden door te voorkomen dat ze beginnen met roken. Een prijsverhoging van 20% op tabaksproducten verlaagt het aantal jeugdige rokers met bijna 20.000 op de korte termijn. De kosten effectiviteit van accijnsverhogingen wordt geschat op ongeveer 4.500 per gewonnen QALY. Dit is inclusief medische kosten in gewonnen levensjaren en exclusief een eventuele toename in accijnsopbrengsten. De
gezondheidseffecten en kosten effectiviteit van diverse schoolprogramma’s zijn nog onzeker. Bijna 90% van de volwassen (ex-)rokers is gestart met roken voor hun 18e. Vanuit het oogpunt van volksgezondheid is het daarom belangrijk om roken bij jongeren te
ontmoedigen. Het doel van dit onderzoek was om de gezondheidswinst en kosteneffectiviteit te bepalen van twee maatregelen om tabaksgebruik onder jongeren te ontmoedigen, namelijk een accijnsverhoging en interventieprogramma’s op scholen. De effecten na 1 jaar op het aantal rokers zijn vastgesteld op basis van literatuuronderzoek. Het RIVM Chronische Ziekten Model (CZM) is gebruikt om de lange termijn effecten op de volksgezondheid te schatten.
Voor de schoolprogramma’s zijn drie voorbeeldinterventies onderzocht, waarvan de kosten werden bepaald op 20 tot 75 per leerling. De schattingen van de gezondheidswinst en kosten effectiviteit als gevolg van de drie school interventies dienen voorzichtig te worden geïnterpreteerd, vanwege grote onzekerheid over de precieze effecten van deze programma’s op het rookgedrag van de jeugd. De conclusie van scenario analyses met het CZM is dat bij jongeren veel gezondheidswinst behaald kan worden door te voorkomen dat ze starten met roken. Een accijnsverhoging draagt hieraan bij en is een zeer doelmatige vorm van preventie.
Trefwoorden: kosten effectiviteit analyse; tabaksontmoediging; roken; modellering; primaire preventie; jongeren
Abstract
Potential health benefits and cost effectiveness of tobacco tax increases and school intervention programs targeted at adolescents in the Netherlands
Increasing tobacco taxes is a cost effective measure to reduce smoking among youth. A price increase on tobacco products reduces the number of young smokers by almost 20,000 in the short run. Although, in the end, effects of current price increases on smoking behaviour will fade away, tobacco taxes still are a good strategy to gain health effects since no intervention costs are involved. Cost effectiveness ratios for tobacco tax increases amount to 4,500 per QALY gained including medical costs in life years gained, but excluding tobacco tax revenues.
This report presents estimates of health gains and cost effectiveness of two types of interventions targeted at smoking reduction among adolescents in the Netherlands: school interventions and tobacco tax increases. Effects in terms of smokers averted were determined from the literature. To translate these effects into health gains and cost effectiveness the RIVM Chronic Disease Model (CDM) is used. This dynamic population model allows estimating effects on smoking related diseases, gains in (quality adjusted) life years and differences in health care costs.
For the school interventions, three different programs were investigated. The intervention costs per participant ranged from 20 to 75. Since there is much uncertainty about the effectiveness of the school interventions with regard to daily smoking among adolescents, results of the scenario analyses should be interpreted with caution. The conclusion that can be drawn from the scenario analyses with the CDM is that much health gains can be attained by preventing adolescents from smoking initiation and that tobacco tax increase may contribute to this in a cost effective way.
Key words: cost effectiveness analysis; tobacco control; modelling; primary prevention; adolescents
Voorwoord
Het onderzoek dat in dit rapport is beschreven is uitgevoerd in het kader van het RIVM onderzoeksprogramma ‘Beleidsondersteuning Volksgezondheid en Zorg’ (Programma 2). Het is een deelonderzoek binnen het project ‘Tabaksontmoediging’(V/260601). Het doel van dit project is om de gezondheidswinst van verschillende interventies te bepalen met het RIVM Chronische Ziekten Model en de kosteneffectiviteit daarvan te evalueren. Interventies gericht op jongeren zoals lesprogramma’s en accijnzen staan in dit rapport centraal.
Diverse mensen binnen en buiten het RIVM hebben een belangrijke bijdrage bij het tot stand komen van dit rapport geleverd. We willen als eerste onze dank uitspreken aan de mensen die hebben geparticipeerd in een expertpanel. Over de beschreven interventieprogramma’s op scholen hebben de auteurs vaak overleg gevoerd met Nederlandse inhoudsdeskundigen. Onze bijzondere dank gaat daarom uit naar Prof. Dr. Hein de Vries, Dr. Marlein Ausems en Dr. Ilse Mesters (allen werkzaam bij de vakgroep GVO Universiteit Maastricht). Tevens willen we Lany Slobbe en Ardine de Wit van het RIVM bedanken voor het kritisch lezen en
Contents
Samenvatting 7
1. Introduction 17
2. Smoking among youth in the Netherlands 19
2.1 Smoking prevalences and trends among youth 19
2.2 Potential health benefits of prevention 21
3. Description of the interventions 23
3.1 Tobacco taxes and its’ price elasticity 23
3.2 School interventions 24
3.2.1 The in-school intervention 24
3.2.2 The out-of-school intervention 25
3.2.3 The booster intervention 25
4. Modeling interventions 27
4.1 The RIVM Chronic Disease Model 27
4.2 Smoking in the CDM 27
4.3 Estimating health effects and cost effectiveness 28
5. Scenarios 29
5.1 Introduction 29
5.2 Tobacco taxes scenario 29
5.3 School scenarios 30
6. Results 33
6.1 Introduction 33
6.2 Effects on never, current and former smokers 33
6.3 Health gains 35
6.4 Effects on health care costs 36
6.5 Cost utility ratios 37
7. Conclusion and discussion 41
Appendix A: Summary of expert opinions 47
Appendix B: Selection of school interventions 49
Appendix C: Calculation of intervention costs 51
Samenvatting
Introductie
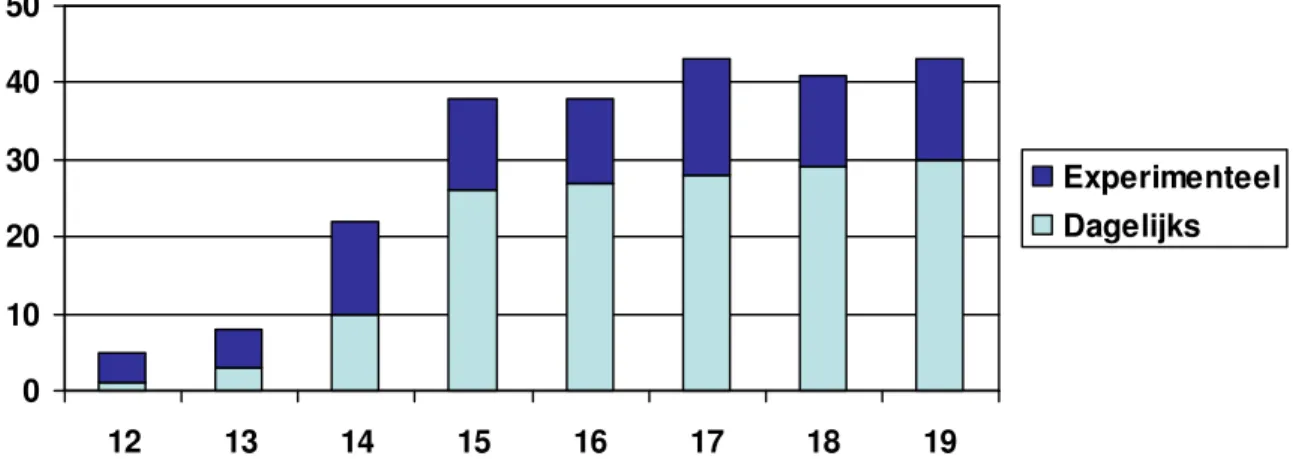
Ongeveer 30% van de jongeren in de leeftijd tussen 15 en 19-jaar geeft aan dagelijks te roken. Daarnaast bestaat een groep jongeren die aan het experimenteren is met roken. Dit zijn jongeren die in de afgelopen vier weken ten minste éénmaal gerookt hebben. Figuur 1 laat zien dat het experimenteren met roken begint bij 12- en 13-jarigen. Onder 14-jarigen geeft ruim 20% aan te experimenteren met roken, waarvan bijna de helft dagelijks rookt. Zowel het percentage dagelijkse rokers als het percentage experimentele rokers onder jongeren is min of meer stabiel gebleven gedurende de afgelopen tien jaar.
Figuur 1: Ppercentage dagelijkse en experimentele rokers onder Nederlandse jongeren in 2004, naar leeftijd (Bron: NIPO-gegevens, STIVORO)
De schadelijke gezondheidseffecten van roken zijn onomstotelijk aangetoond. Daarnaast is bekend dat deze negatieve gezondheidseffecten grotendeels niet acuut optreden, maar pas op de langere termijn. Het aantal jaren dat gerookt is speelt hierbij een rol. Onder volwassenen van middelbare leeftijd is de sterfte onder rokers hoger bij vroege starters, vergeleken met latere starters. Bijna 90% van de volwassen (ex-)rokers is gestart met roken voor hun 18e. Vanuit het oogpunt van volksgezondheid is het dus belangrijk om roken bij jongeren te ontmoedigen.
Het doel van dit rapport is de potentiële gezondheidswinst en kosteneffectiviteit te schatten van tabaksontmoedigingsbeleid gericht op jongeren. Van twee typen maatregelen wordt de gezondheidswinst geschat, de gevolgen voor de zorgkosten en de kosteneffectiviteit, namelijk:
- accijnsverhogingen op tabaksproducten; - schoolprogramma’s.
Bij de accijnsverhoging is uitgegaan van de recent in Nederland ingevoerde accijnsverhoging van 20%. Als voorbeeld voor schoolprogramma’s op scholen werden drie Nederlandse projecten geselecteerd. Met behulp van het RIVM Chronische Ziekten Model (CZM) zijn de effecten op de korte termijn, in termen van veranderingen in het aantal rokers, vertaald naar gezondheidseffecten die optreden op de langere termijn.
0 10 20 30 40 50 12 13 14 15 16 17 18 19 Experimenteel Dagelijks
Effectiviteit interventies
Het verhogen van accijnzen op rookwaren leidt tot prijsverhogingen die op drie manieren kunnen leiden tot veranderingen in rookgedrag:
- minder niet-rokers starten met roken; - rokers minderen met roken;
- rokers stoppen met roken.
Het is vrij zeker dat prijsverhogingen leiden tot vermindering van het aantal verkochte sigaretten, maar de opsplitsing van dit effect over deze drie mechanismen is minder goed bekend. Empirische schattingen van de effecten van prijsverhogingen op het rookgedrag van jongeren lopen nogal uiteen.
Van de volgende drie school interventies zijn de gezondheidseffecten en kosteneffectiviteit geschat:
1. In-school interventie: drie klassikale lessen over onder andere de effecten van roken op de gezondheid, normen over roken en het leren om te gaan met invloeden vanuit de
omgeving. De kosten van deze interventie werden geschat op 18,- per deelnemer. 2. Out-of-school interventie: drie op de leerling aangepaste brieven met informatie over
stoppen of niet starten met roken. De brieven waren aangepast aan persoonlijke
kenmerken van de leerling. De kosten van deze interventie werden geschat op 50,- per deelnemer.
3. Booster interventie: vijf lessen gegeven door een niet rokende medeleerling in kleine groepen. De lessen richtten zich onder andere op de volgende aspecten: redenen om (niet) te roken, de effecten van roken en het leren om te gaan met invloeden vanuit de
omgeving. Verder werd er een niet roken afspraak gemaakt en ontvingen de leerlingen drie tijdschriften (boosters). De kosten van deze interventie werden geschat op 75,- per deelnemer.
Omschrijving scenario’s
Voor de accijnsverhogingen en de drie schoolinterventies geldt dat de effectiviteit op korte termijn, in termen van aantal vermeden rokers, omgeven is door een grote mate van
onzekerheid. Daarom hebben we voor alle interventies meerdere scenario’s geformuleerd die verschillen in de grootte van het veronderstelde effect op het aantal rokers. Die zijn te vinden in de hoofdtekst van het rapport. Voor de schoolprogramma’s is een belangrijke aanname dat de interventies even effectief zijn bij alle typen rokers, zowel dagelijkse als experimentele rokers. Voor de accijnsscenario’s zijn de effecten van een éénmalige prijsverhoging op jongeren van 10-19 jaar geschat.
Voor elke interventie hebben we een zogenaamd ‘best guess’ scenario geformuleerd. In deze ‘best guess’ scenario’s zijn er als gevolg van de interventies meer jongeren gestopt met roken en/of minder jongeren gestart met roken. De gezondheidswinst en het verschil in zorgkosten zijn geschat door de uitkomsten van het CZM (levensjaren, QALY’s1 en zorgkosten) in de ‘best guess’ scenario’s te vergelijken met een referentiescenario waarin geen aanpassingen zijn gemaakt.
1 QALY’s (Quality Adjusted Life Years) staan voor het aantal levensjaren die zijn gecorrigeerd voor de
kwaliteit van leven. Een QALY waarde van 0 is gelijk aan dood en 1 aan volledig gezond. Waarden van een QALY tussen 0 en 1 betekenen dat een levensjaar is doorgebracht in niet volledige gezondheid.
Hier volgt een korte omschrijving van de vier verschillende ‘best guess’ scenario’s:
1. Accijns scenario: Een éénmalige accijnsverhoging van 20% veroorzaakt in het eerste jaar een daling van de prevalentie van roken van 7% (is gelijk aan ongeveer 1 procentpunt van alle rokende jongeren) onder jongeren. De helft van de daling is veroorzaakt door een toename van het aantal stoppers en de andere helft door een daling van het aantal starters. In de volgende jaren neemt het effect van de prijsverhoging op rookgedrag onder
jongeren langzaam af;
2. In-school scenario: Alle brugklassen in Nederland krijgen 10 jaar lang de in-school interventie aangeboden. Dat veroorzaakt ieder jaar een daling van de prevalentie van roken van 2 procentpunt onder brugklassers. Deze daling wordt veroorzaakt door een stijging in het aantal stoppers als gevolg van de interventie;
3. Out-of school scenario: Alle brugklassen in Nederland krijgen 10 jaar lang de out-of-school interventie aangeboden. Dat veroorzaakt ieder jaar een daling van de prevalentie van roken van 6 procentpunt onder brugklassers. Deze daling wordt veroorzaakt door een daling in het aantal jongeren dat begint met roken als gevolg van de interventie;
4. Booster-scenario: Alle tweede klassen van de middelbare scholen krijgen 10 jaar lang de out-of-school interventie aangeboden. Dat veroorzaakt ieder jaar een daling van de prevalentie van roken van 7 procentpunt onder 14-15 jarigen. De helft van de daling is veroorzaakt door een toename van het aantal stoppers en de andere helft door een daling van het aantal starters.
Door de schoolinterventies 10 jaar lang aan te bieden aan alle brugklassen of tweede klassen van de middelbare school zijn de cumulatieve effecten van de schoolinterventie scenario’s vergelijkbaar met de accijnsscenario’s omdat de aantallen jongeren blootgesteld aan de schoolinterventies ongeveer even groot zijn als het aantal jongeren dat de prijsverhoging heeft meegemaakt. In gevoeligheidsanalyses is bekeken in hoeverre de resultaten gevoelig zijn voor aannames die zijn gemaakt in de ‘best guess’ scenario’s.
Resultaten
Figuur 2 geeft de verschillen in het aantal rokers weer tussen het referentiescenario en de verschillend ‘best guess’ scenario’s. Het aantal rokers daalt door de interventies. Na afloop van de interventies neemt het verschil in het aantal rokers langzaam af, doordat of gestopte jongeren later weer opnieuw beginnen of niet-rokers later alsnog beginnen met roken.
2020 2040 2060 2080 2100 Jaar
40000 30000 20000 10000
Verschillen in aantal rokers
Booster Out of school In school Accijns
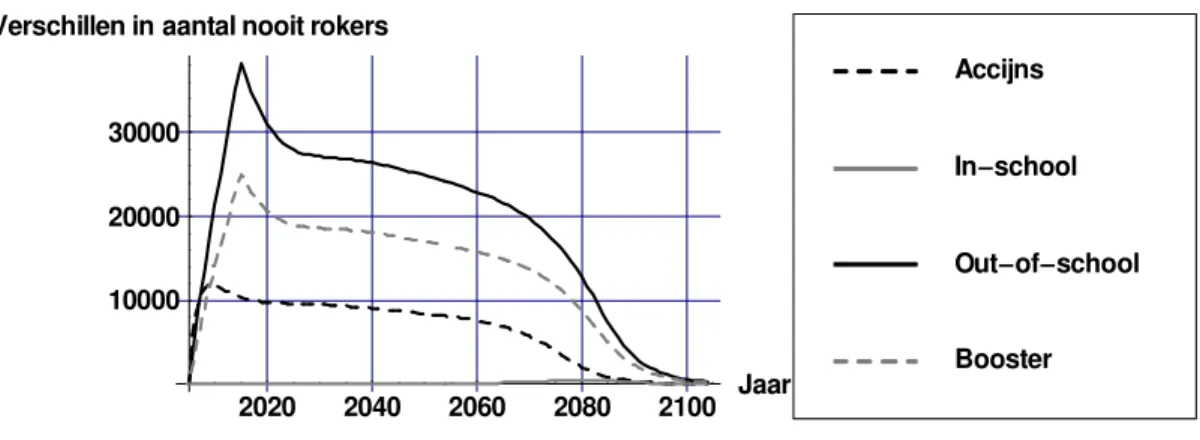
Verschillen in het aantal rokers worden veroorzaakt door een toename van het aantal nooit-rokers (omdat minder jongeren beginnen met roken) en/of toename van het aantal ex-nooit-rokers (omdat meer jongeren stoppen met roken). Figuren 3 en 4 geven de verschillen in
respectievelijk het aantal nooit-rokers en ex-rokers weer. Bij het out-of-school scenario wordt het verschil in aantal rokers veroorzaakt door minder starters oftewel een stijging in het aantal nooit-rokers (Figuur 3). Omdat in dit scenario minder jongeren beginnen met roken kunnen er dus minder rokers stoppen wat resulteert in een daling van het aantal ex-rokers (Figuur 4). Het in-school scenario heeft geen invloed op het aantal nooit-rokers (Figuur 3) omdat deze interventie uitsluitend resulteert in meer stoppers (Figuur 4). Het accijns- en boosterscenario resulteren in meer stoppers én minder starters.
2020 2040 2060 2080 2100 Jaar 10000
20000 30000
Verschillen in aantal nooit rokers
Booster Out of school In school Accijns
Figuur 3: Verschil in het aantal nooit-rokers ‘best guess’ scenario’s t.o.v. het referentiescenario
2020 2040 2060 2080 2100 Jaar 10000
10000 20000
Verschillen in aantal ex rokers
Booster Out of school In school Accijns
Figuur 4: Verschil in het aantal ex- rokers ‘best guess’ scenario’s t.o.v. het referentiescenario
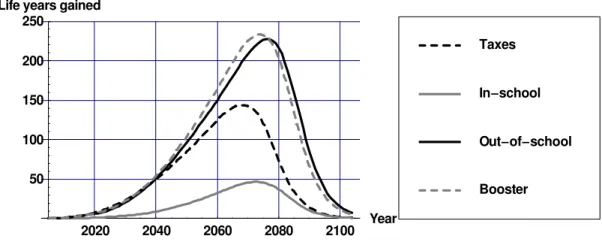
De gezondheidswinst als gevolg van de interventies wordt geschat door het aantal levensjaren/QALY’s in het referentie scenario af te trekken van het aantal
levensjaren/QALY’s in het ‘best guess’ scenario. Figuren 5 en 6 geven de geschatte
gezondheidswinst in gewonnen levensjaren en QALY’s weer.2 Door de interventies daalt het aantal rokers, wat zorgt voor een daling in rookgerelateerde ziekten na een aantal jaren. Dit zorgt ervoor dat de kwaliteit van leven en levensverwachting toeneemt. Vergelijking van Figuur 5 en 6 laat zien dat op korte termijn meer winst in kwaliteit van leven wordt geboekt door het vermijden van rookgerelateerde ziekten: mensen worden niet ziek. Dat vertaalt zich pas op iets langere termijn in een winst in levensjaren: mensen overlijden later. De winst in levensjaren is op langere termijn hoger dan de winst in kwaliteit van leven, omdat ook bij niet- en ex-rokers op oudere leeftijd de kwaliteit van leven afneemt, door het optreden van vervangende ziektes. 2020 2040 2060 2080 2100 Year 50 100 150 200 250
Life years gained
Booster Out of school In school Taxes
Figuur 5: Gewonnen levensjaren ‘best guess’ scenario’s t.o.v. het referentiescenario
2020 2040 2060 2080 2100 Jaar 50 100 150 200 250 Gewonnen QALYs Booster Out of school In school Taxes
Figuur 6: Gewonnen QALY’s ‘best guess’ scenario’s t.o.v. het referentiescenario
2 In alle figuren zijn effecten die optreden in de toekomst met 4% per jaar gedisconteerd. Disconteren houdt in
Figuur 7 geeft het verschil in zorgkosten van rookgerelateerde ziekten ten opzichte van het referentiescenario weer. De daling in rookgerelateerde ziekten zorgt voor een daling in de zorgkosten daarvan. Omdat sommige rookgerelateerde ziekten (bijvoorbeeld hart en
vaatziekten) ook sterk van de leeftijd afhangen, nemen de kosten naar verloop van tijd weer toe. Voor alle kosten rekenen we in euro’s en met het prijsniveau van 2004.
2020 2040 2060 2080 2100 Jaar 800 600 400 200 200 1000 Booster Out of school In school Accijns
Figuur 7: Verschil in kosten van rookgerelateerde ziekten‘best guess’ scenario’s t.o.v. het referentiescenario
Figuur 8 geeft de kosten van de overige ziekten weer. Doordat de levensverwachting toeneemt, stijgen de kosten van niet aan roken gerelateerde ziekten.
2020 2040 2060 2080 2100 Jaar 500 1000 1500 2000 2500 1000 Booster Out of school In school Accijns
Figuur 8: Verschil in kosten van niet aan roken gerelateerde ziekten in gewonnen levensjaren ‘best guess’ scenario’s t.o.v. het referentiescenario
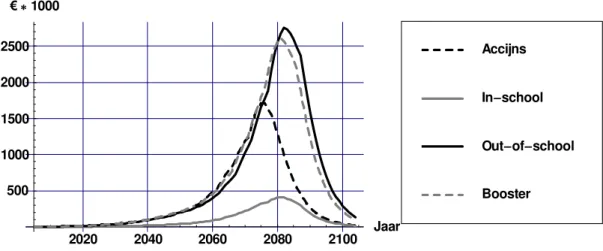
Figuur 9 laat zien dat het verschil in totale zorgkosten uiteindelijk wordt gedomineerd door de kosten van niet aan roken gerelateerde ziekten in gewonnen levensjaren. Dat komt vooral door hoge kosten in de verre toekomst. Tot ongeveer 60-70 jaar na implementatie van de interventies zijn de totale zorgkosten lager in het interventiescenario vergeleken met het referentiescenario. De interventiekosten voor de schoolprogramma’s over hun looptijd van tien jaar staan niet in deze figuur. Bij de accijnsinterventie zijn deze kosten er niet.
2020 2040 2060 2080 2100 Jaar 500 500 1000 1500 2000 2500 3000 1000 Booster Out of school In school Accijns
Figuur 9: Verschil in totale zorgkosten ‘best guess’ scenario’s t.o.v. het referentiescenario (exclusief interventiekosten)
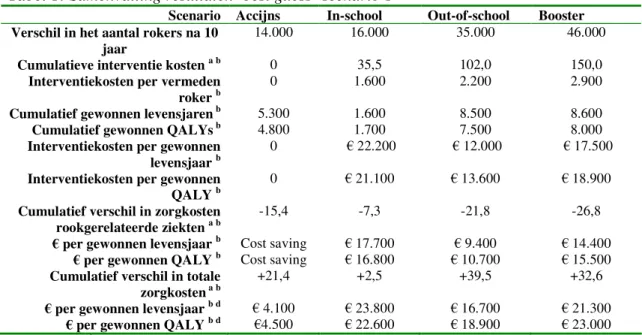
Tabel 1 geeft een samenvatting van de resultaten voor de verschillende ‘best guess’ scenario’s weer.
Tabel 1: Samenvatting resultaten ‘best guess’ scenario’s
Scenario Accijns In-school Out-of-school Booster Verschil in het aantal rokers na 10
jaar 14.000 16.000 35.000 46.000
Cumulatieve interventie kosten a b 0 35,5 102,0 150,0
Interventiekosten per vermeden
roker b 0 1.600 2.200 2.900
Cumulatief gewonnen levensjaren b 5.300 1.600 8.500 8.600
Cumulatief gewonnen QALYs b 4.800 1.700 7.500 8.000
Interventiekosten per gewonnen
levensjaar b 0 22.200 12.000 17.500
Interventiekosten per gewonnen
QALY b 0 21.100 13.600 18.900
Cumulatief verschil in zorgkosten
rookgerelateerde ziekten a b -15,4 -7,3 -21,8 -26,8
per gewonnen levensjaar b Cost saving 17.700 9.400 14.400
per gewonnen QALY b Cost saving 16.800 10.700 15.500
Cumulatief verschil in totale
zorgkosten a b +21,4 +2,5 +39,5 +32,6
per gewonnen levensjaar b d 4.100 23.800 16.700 21.300
per gewonnen QALY b d 4.500 22.600 18.900 23.000
a 1.000.000 b gedisconteerd met 4% c Interventie kosten en besparingen in kosten van rookgerelateerde ziekten
Op basis van de ‘best guess’ scenario’ s is de in-school interventie het minst doelmatig te noemen als we kijken naar de kosten per gewonnen levensjaar of QALY. Echter, bij het in-school scenario zijn de interventiekosten per vermeden roker het laagst. Dit komt omdat op lage leeftijden er nog weinig jongeren dagelijks roken en we in het in-school scenario hebben verondersteld dat de interventie alleen effect heeft op het aantal stoppers. Omdat veel
stoppers later opnieuw beginnen met roken, wordt er weinig gezondheidswinst geboekt waardoor in termen van kosten per levensjaar/QALY dit scenario minder doelmatig is te noemen dan in termen van interventie kosten per vermeden roker.
Interventies die effect hebben op het aantal beginnende rokers een grotere doelgroep bereiken. Omdat aan accijnzen geen interventiekosten zijn verbonden is dit de doelmatigste interventie. Bij de berekeningen hebben we geen rekening gehouden met een eventuele toename in accijnsopbrengsten. Dit zou de doelmatigheid van accijnsverhogingen nog verder verhogen.
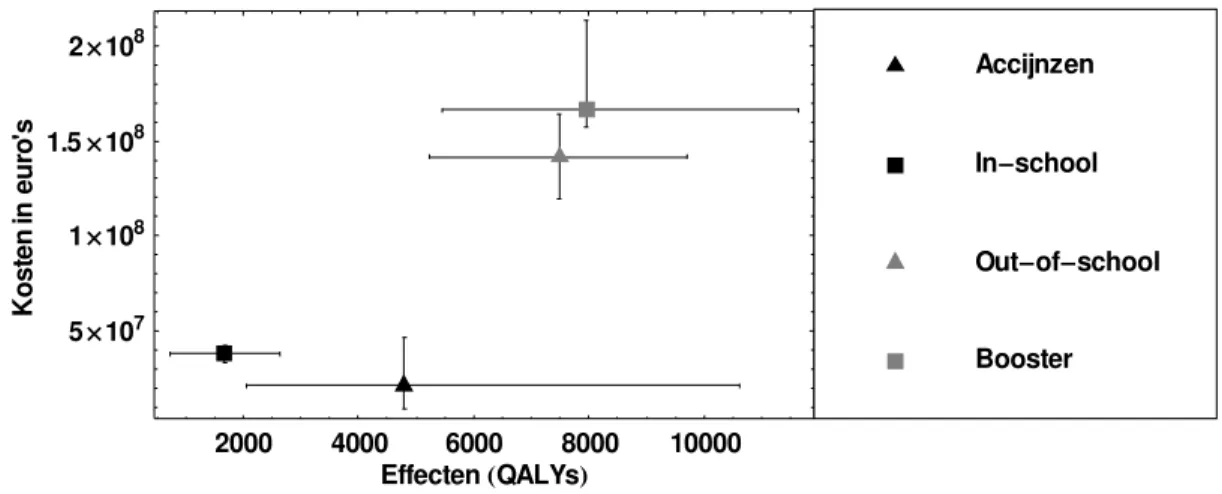
Figuur 10 laat de cumulatieve kosten en gezondheidseffecten voor de verschillende scenario’ s zien, samen met de onzekerheidsmarges rondom de kosten en effecten. De onzekerheid omtrent de veronderstelling over de effectiviteit van de schoolinterventies is moeilijk te kwantificeren en is daarom niet weergegeven in Figuur 10. Die onzekerheid zal de onbetrouwbaarheid van de resultaten voor de schoolinterventies doen toenemen, zodat er eigenlijk bredere intervallen rondom de effecten zouden moeten staan.
2000 4000 6000 8000 10000 Effecten QALYs 5 107 1 108 1.5 108 2 108 net so K ni or ue 's Booster Out of school In school Accijnzen
Figuur 10: Cumulatieve kosten en effecten met onzekerheidsmarge
Conclusie
In dit rapport hebben we de gezondheidswinst en kosten effectiviteit geschat van accijnsverhogingen en drie schoolinterventies als middel om roken te ontmoedigen bij jongeren. Omdat de effectiviteitcijfers van de schoolinterventies alle betrekking hadden op experimenteel roken en de schattingen van de effectiviteit van accijnsverhogingen nogal uiteenlopen hebben we diverse aannamen moeten maken om de gezondheidswinst te
schatten. Hierdoor zijn de gepresenteerde resultaten niet ‘hard’ maar eerder indicatief voor de potentiële gezondheidswinst die valt te behalen als deze interventies worden
Met het CZM konden we niet alleen korte termijn effecten op het aantal rokers bepalen, maar ook de lange termijn gezondheidswinst en effecten op de kosten van zorg. Daarmee konden we de kosteneffectiviteit van de maatregelen in euro’ s per gewonnen levensjaar en QALY bepalen. Op basis van onze scenario analyses met het CZM trekken we de conclusie dat accijnsverhoging een doelmatige interventie is om het aantal rokende jongeren te laten dalen. De kosten effectiviteit van een accijnsverhoging komt neer op ongeveer 4.500 per
gewonnen QALY. Dit is inclusief medische kosten in gewonnen levensjaren en exclusief een eventuele toename in accijnsopbrengsten. Zonder medische kosten in gewonnen
levensjaren mee te rekenen bespaart deze interventie medische kosten. Concluderend kunnen we stellen dat accijnsverhogingen een zeer doelmatige vorm zijn van preventie. Tevens hebben de scenario’ s laten zien dat preventie van roken tot grotere gezondheidswinst leidt dan stoppen met roken bij jongeren.
1. Introduction
This report describes the potential health gains, and the implications thereof for future health care costs, of implementation of tobacco control interventions targeted at adolescents (10-to-19-year old). The aims are to describe the potential importance of interventions in adolescents in terms of health gains and to estimate the cost-effectiveness of several tobacco control interventions targeted at adolescents. A separate report for interventions targeted at adults is scheduled for the end of 2005. There are three reasons why the effects of tobacco cessation interventions are estimated separately for adolescents:
- Interventions targeted at preventing initiation of smoking can be analyzed in adolescents, but not in adults since most people start smoking before the age of 20. Thus, scenarios can be created that have effect on the start rates in never-smokers, instead of quit rates in current smokers;
- In general, since smoking behaviour among adolescents is dynamic and unstable, effectiveness figures of tobacco cessation interventions in adolescents will have a larger uncertainty range than interventions in adults;
- The time horizon for assessing public health impact needs to be longer, since health gains in adolescents will become visible only a long period after the implementation of the intervention. This adds to the uncertainty of modeling (health) effects in this population. At the start of this project we presented our main assumptions and our selection of
interventions to several experts, and asked their opinion about these assumptions, our selection of interventions and their effectiveness. Appendix A summarizes the opinions of experts that are relevant for this report. To sketch a background Chapter 2 describes trends in smoking among youth in the Netherlands and potential health benefits of not-smoking are discussed. Chapter 3 discusses the effectiveness of tobacco tax increases and the selected school interventions. In Chapter 4, the RIVM Chronic Disease Model (CDM) and the
methods to estimate health gains and cost effectiveness are described. Chapter 5 discusses the assumptions used to set up the scenarios modeled with the CDM. Chapter 6 discusses the results of the different scenarios. Finally, Chapter 7 concludes with a discussion of our results.
2. Smoking among youth in the Netherlands
2.1 Smoking prevalences and trends among youth
In 2004, prevalence rates of daily smokers were about 3% among the 13-year-old, 10% among the 14-year-old, 26% among the 15-year-old and 30% among the 19-year-old
according to TNS/NIPO research [1]. Besides daily smoking, a relatively high percentage of the youth does smoke occasionally or is experimenting with tobacco only. In the international literature, this group is referred to as ‘experimenters’ or ‘puffers’ . This group can be
identified by the question ‘did you smoke in the past four weeks?’ . In 2004, this question was answered positively by 8% of the 13-year-old, by 38% of the 15-year-old and by 43% of the 19-year-old [1] (Figure 2.1).
Figure 2.1: Prevalence rates of daily smoking and experimenting for Dutch adolescent in 2004 (Source: STIVORO. Roken, de harde feiten: Jeugd 2004)
The prevalence rates of daily smoking are almost identical for boys and girls. Among the 10- to-12-year-old less than 10% is experimenting with smoking, while 89% of the adult (ex-)smokers report that they tried their first cigarette before the age of 18. Hence, most people start smoking or experimenting with smoking between the ages of 13 and 18 years. Among the 17-to-19-year-old, about 70% reports that they ‘ever’ smoked a cigarette. This shows that experimenting with cigarettes in youth does not necessarily lead to continued daily smoking in later adult life. Among the 20-to-24-year old, the prevalence rates of daily smoking are 32% in men and 23% in women. Hence, for men these are similar to the 19-year-old, but for women the prevalence rates are decreased.
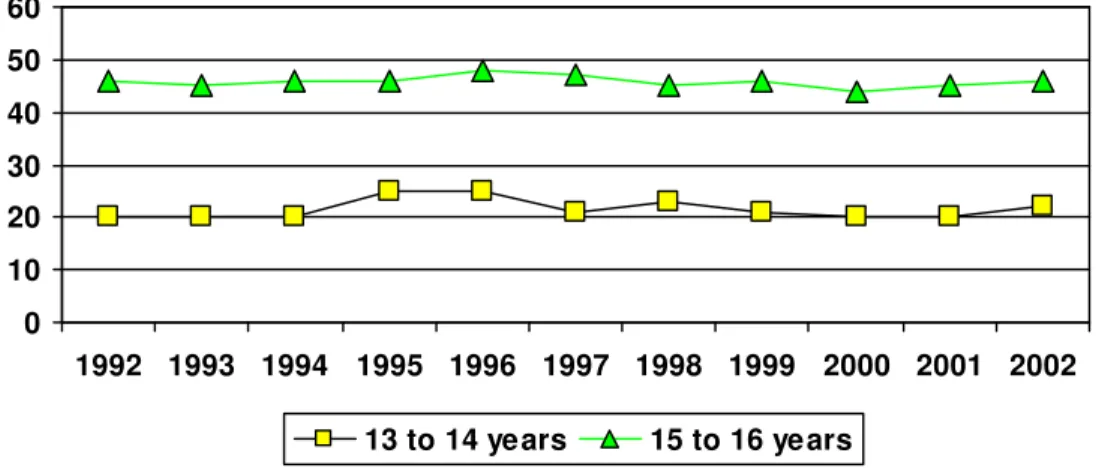
There is no clear downward or upward trend in daily smoking among youth since 1992. The highest prevalence of daily smoking seems to have occurred in 1996, and prevalence rates in 2002 are equal to the prevalence rates in 1992 (Figure 2.2).
0 10 20 30 40 50 12 13 14 15 16 17 18 19 experimenters daily
Figure 2.2: Prevalence rates of daily smoking among adolescents since 1992
Figure 2.3 shows prevalence rates for ‘experimenting with smoking’ since 1992. Just like ‘daily smoking’ there is no clear downward or upward trend in ‘experimental smoking’ .
Figure 2.3: Prevalence rates of experimental smoking among adolescents since 1992
Compared to other countries the smoking behavior of the Dutch 15-year-old seems to be quite similar. A WHO cross-national study investigated the prevalence rates of smoking among youth in several countries in 2001 and 2002. Table 2.1 presents the prevalence rates among the 15-year old. Smoking is defined as ‘tobacco smoking at least once a week’ . Table 2.1 shows that the prevalence rate is higher than in Denmark, lower than in Germany, and similar to Belgium and the United Kingdom. In this research, the prevalence rate for The Netherlands (23.4%) seems to be low when compared to the TNS/NIPO data for the same age group in the same year. According to TNS/NIPO data the percentage of daily, instead of weekly, smokers is 28% in this age group.
0 10 20 30 40 50 60 1992 1993 1994 1995 1996 1997 1998 1999 2000 2001 2002 13 to 14 years 15 to 16 years 0 10 20 30 40 50 60 1992 1993 1994 1995 1996 1997 1998 1999 2000 2001 2002 13 to 14 years 15 to 16 years
Table 2.1: Prevalence rates of smokers1 among 15-year old (in 2001/2002)
Boys Girls Total
Belgium 23.1 23.8 22.8
Denmark 16.7 21.0 18.9
Germany 32.2 33.7 33.0
Netherlands 22.5 24.3 23.4
United Kingdom 20.3 27.4 24.1
Source: Health behaviour in school-aged children: a WHO cross-national study (HBSC), 2002 (www.who.dk).
1: defined as ‘tobacco smoking 1 time a week’
2.2 Potential health benefits of prevention
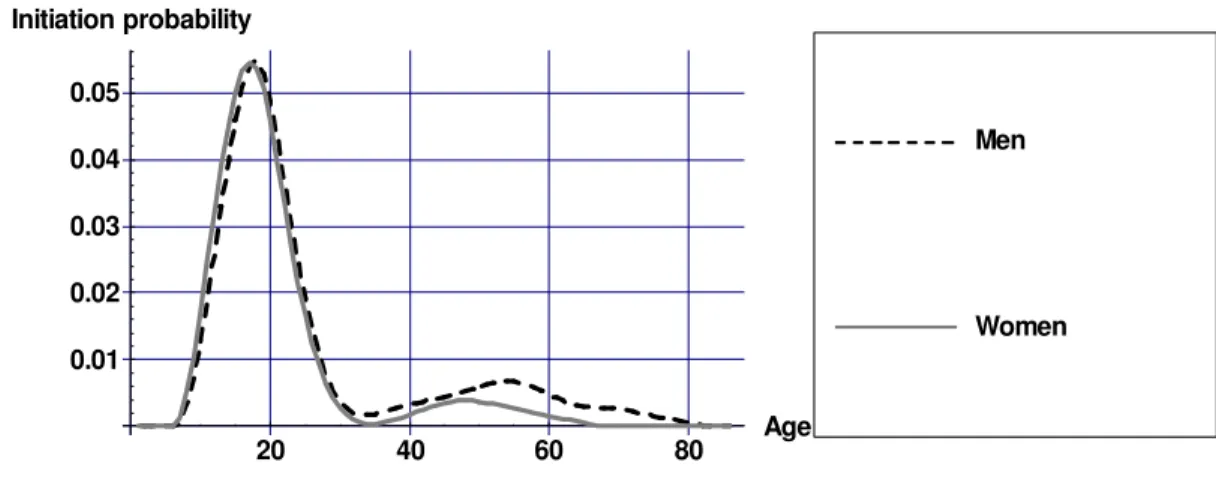
Among adolescents, a great potential impact can be expected of interventions targeted at preventing smoking, since most people start smoking for the first time when they are young. Figure 2.4 display the initiation probability of daily smoking estimated using STIVORO data.
20 40 60 80 Age 0.01 0.02 0.03 0.04 0.05 Initiation probability Women Men
Figure 2.4: Initiation probabilities for daily smoking specified by gender
Figure 2.4 shows that the probability to initiate daily smoking is highest around the age of 18. At this age, more than 5 out of 100 adolescents start daily smoking. In older ages, the number of persons that start daily smoking is consistently below 1 per 100.
From a public health point of view, prevention of smoking is especially important for at least two reasons. First, the majority of smokers who try to quit smoking will start again. Hence, it is very difficult to quit smoking at older ages, and therefore targeting at young people may be a wise approach. Second, the risk of mortality among 45-to-54-year-old smokers is almost twice as high in persons who started smoking before the age of 15, compared to persons that started after the age of 25. The duration of smoking is thus an important predictor of
premature mortality, and preventing adolescents to start at an early age is therefore very fruitful [2].
3. Description of the interventions
3.1 Tobacco taxes and its’ price elasticity
Increasing tobacco taxes can affect smoking behaviour in three different ways: - current smokers decrease the quantity of cigarettes consumed;
- more current smokers quit smoking; - less non-smokers start smoking.
By increasing tobacco taxes, the prices of cigarettes will rise (provided that tobacco
producers do not decrease their selling price). In reaction to the price increase, some smokers will lower the amount of cigarettes they consume and some might even quit smoking.
Moreover, higher prices may deter people from initiating smoking. Since most people start smoking when they are young (see Chapter 2), it is worthwhile to investigate whether tobacco taxes are effective in deterring young people from smoking. Furthermore, the additional advantage of using tobacco taxes for tobacco control is that from a government perspective they are a cheap intervention since it is possible to reduce smoking and at the same time to generate more tax revenues.
The effectiveness of price increases cannot be determined using a randomized controlled trial. Instead, historical time series of smoking behaviour have been related to price
developments during this period. To measure the effects of price on the demand of tobacco, economists estimate so-called price elasticities. The price elasticity of the demand for tobacco equals the relative change in the demand for tobacco divided by the relative change in the price of tobacco. As long as this elasticity is below 1, it implies that tax revenues will
increase. An extensive literature exists on the price elasticity of the total demand for tobacco. It is estimated that for western countries the elasticity lies somewhere between -.3 and -.5 which means that a 10% increase in prices leads to a 3 to 5% decrease in the demand for tobacco [3,4]. Empirical studies on the effects of prices on the demand for tobacco usually only look at the reactions of total demand for tobacco because of price changes. However, to estimate health effects of price increases effects on the prevalence of smoking are needed, preferably divided into effects on the number of current smokers (quitters) and on the number of new smokers (starters).
Ross and Chaloupka found that smoking prevalence among adolescents reacted more heavily to price changes than smoking prevalence among adults [5]. They estimated a smoking prevalence elasticity for adolescents of -.35 which implies that a 20% increase in the price of tobacco, decreases smoking prevalence among adolescents with 7%. In a study by Harris and Chan it was found that smoking prevalence among young adolescents was more sensitive to price changes than among older adolescents [6]. Their smoking prevalence elasticity
estimates ranged from -.83 (for ages 15-17) to -.52 (ages 18-20).
Changes in the smoking prevalence are the result of changes in smoking initiation among non-smokers and changes in quit rates among smokers. However, studies about the cause (i.e. more quitting or less initiation) of the price sensitivity among adolescents are scarce and point in different directions. This can be explained by the fact that there are several stages that can be distinguished before a never-smoker becomes a nicotine addict. Thus, the classifications into for instance starters and quitters is not always clear-cut. Several studies
did not find significant effects of price changes on smoking initiation [7-10]. However, a recent study [11] showed that if one controls for gender price increases decreases initiation among boys but not among girls. The authors explained their findings by arguing that girls start smoking as a way to counteract weight gains and therefore are less responsive to price changes. Most studies about quitting behaviour among smoking adolescents show that the number of quitters increase as price increases [7,8,10,12].
3.2 School interventions
In order to select school interventions that have been proven to be effective in reducing smoking prevalence among adolescents a literature search was conducted (details of the literature search are described in Appendix B). Only school interventions that have been evaluated in the Netherlands have been included. In compliance with the inclusion criteria (see Appendix B), three interventions were selected:
1. The in-school intervention by Ausems et al. (2004) in vocational schools [13], hereafter referred to as the in-school intervention;
2. The out of school intervention by Ausems et al. in vocational schools [13], hereafter referred to as the out-of-school intervention;
3. The intervention by Dijkstra et al. targeted at all school levels [14] hereafter referred to as the booster intervention.
The three interventions were performed in Dutch schools. The in-school intervention studied by Ausems et al. (2004) was part of the healthy school program, a large program in Dutch schools to promote a healthy lifestyle in adolescents. The three interventions were based on the ‘social influence resistance model’ . In the social influence approach, the social
environment of the individual is considered to be an important factor. Therefore, training of skills to protect against negative social influences is one of the key components of this approach. Many studies conclude that this is the most effective approach and that therefore in the prevention of smoking in adolescents the social influence approach has to be used
[15,16]. Hereafter each intervention is described in more detail.
3.2.1 The in-school intervention
The in-school intervention consisted of three lessons, each lasting about 50 minutes, for which student and teacher manuals were available. The first lesson explained the ingredients of tobacco and the physical and mental consequences of smoking, while the second discussed norms concerning smoking and the third emphasized the pressures to smoke and the skills that are helpful in resisting cigarettes [13].
Smoking behavior was measured using self-reports. Respondents who indicated having smoked during the past month were classified as current smokers. The in-school intervention was most effective in smoking cessation: after 1 year 29.4% of all current smokers as
measured at baseline continued smoking versus 42.2% in the control group. The fact that in both control and intervention group more than half of those adolescents classified as smokers, quit after one year illustrates the dynamics in smoking among adolescents. The chance of continuing smoking is significant smaller than in the control group (Odds ratio = 0.49 (0.29-0.84)). The odds of smoking initiation showed no significant difference (OR=0.52 (0.23-1.18)). The costs of the in-school intervention were estimated at 18,- per participant assuming that a class consists of 30 students. A detailed description of the cost analysis can be found in Appendix C.
3.2.2 The out-of-school intervention
The out-of school intervention consisted of three tailored letters with smoking prevention messages, which were sealed in envelopes and mailed to students’ homes at three-week intervals. The content of the letters were tailored to individual characteristics, using a pre-test questionnaire. The pretest questionnaire on attitudes, social norms, self-efficacy, smoking intention, and smoking behavior was used to create a database file containing personal information. A computer program combined the database file with the message file using decision rules that linked students’ answers to personal messages. The first letter (eight versions) contained information regarding students’ beliefs about smoking in general, and short-term and social consequences of smoking. The second letter (32 versions) discussed the influence of the social environment and the intentions not to smoke in the future. Boys and girls received different messages and cartoons. The third letter (two versions) described refusal techniques and included an exercise about cigarette refusal [13]. Smoking status was measured in the same way as in the in-school intervention.
The out-of school intervention was effective in smoking prevention: after 1 year 25% started smoking and after 1.5 years 27.2% (versus 40.9 and 47.9% in the control group). These percentages can be interpreted as probabilities to initiate ‘experimental’ smoking and cannot be compared to probabilities to initiate daily smoking as discussed in Chapter 2 (see Figure 2.4). The chance of continuing smoking differs not significantly from the control group: (OR=0.67 (0.29-1.56)). The chance of starting experimental smoking is smaller compared to the control group (Odds ratio = 0.42 (0.18-0.96)). The costs of the out-of school intervention were estimated at 50,- per participant (see Appendix C).
3.2.3 The booster intervention
The intervention studied by Dijkstra et al. (1999) consisted of five weekly peer-led lessons of 45 minutes each in small groups of four or five students. The peer-leader was a non-smoking student from the same class as the students. The first lesson focused on the reasons why people do or do not smoke. The second lesson dealt with the short-term effects of smoking. The third lesson focused on resisting peer pressure and acquiring skills to resist pressure. The fourth lesson discussed how to react when bothered with smoke, indirect pressure to smoke from adults and advertisements, and measures from the government against smoking. The last lesson focused on alternatives to smoking, making the decision to smoke or not and a
commitment to non-smoking behavior. Thereafter the study population received boosters. Three magazines were developed and distributed by teachers. In the magazines, well-known national and international singers and sports personalities served as non-smoking role models and gave their opinion on smoking. Information was given on the effects of smoking, passive smoking etcetera [14]. Teachers coordinated the lessons, stimulated students and assisted peer-leaders. Teachers received one hour training from health educators [14].
The booster intervention resulted in a significant lower increase in the amount of smokers. After 12 months, the amount of smokers increased with 5.6% in the intervention group versus 12.6% in the control group. After 18 months, the amount of smokers increased with 9.7% versus 14.9% in the control group. It was not measured whether this was the result of less initiation or more cessation in the control group. Respondents who indicated having smoked during the past month were classified as current smokers. The costs of the booster
4. Modeling interventions
4.1 The RIVM Chronic Disease Model
To estimate health gains in the long run as well as cost effectiveness for the interventions discussed in the previous Chapter the RIVM Chronic Disease Model (CDM) is used. The CDM has been developed as a tool to describe the morbidity and mortality effects of
autonomous changes of and interventions on chronic disease risk factors taking into account integrative aspects [17]. The CDM models the entire Dutch population, following the life course of birth cohorts over time. The model contains several risk factors including
cholesterol, systolic blood pressure, smoking, activity level, and Body Mass Index. It models 28 chronic diseases: acute myocardial infarction, other coronary heart disease, stroke, and chronic heart failure, COPD, asthma, diabetes mellitus, dementia, osteoarthritis, dorsopathy, osteoporosis and 15 different forms of cancer. The mathematical model structure is called a multi-state transition model and is based on the life table method. The model states defined are the risk factor classes (e.g. never smokers, current smokers and former smokers) and disease states (e.g. with or without COPD). State transitions are possible due to changes between classes for any risk factor, incidence, remission and progress for any disease, and mortality. The model describes the life course of cohorts in terms of changes between risk factor classes and changes between disease states over the simulation time period. Risk factors and diseases are linked through relative risks on disease incidence. That is, incidence rates for each risk factor class are found as relative risks times baseline incidence. All model parameters and variables are specified by gender and age. The time step used for modeling is 1 year. The main model outcome variables are incidence, prevalence and mortality numbers specified by disease, and integrative measures such as total and quality-adjusted life years. Demographic input data in the CDM came from Statistics Netherlands [18], data on the incidence, prevalence and mortality of the modeled diseases were based on Dutch General Practice registrations, national administrative data (Municipal Base Administration, GBA), hospital admission data (LMR, National Medical Registry), mortality registries (Statistics Netherlands), and time series data from CMR Nijmegen [19]. Health care costs in the CDM were based on the Costs of Illness in the Netherlands study [20,21] and quality of life weights on Dutch and international burden of disease studies [22-24].
4.2 Smoking in the CDM
In the Chronic Disease Model, prevalence rates in the start year of current and former smokers among the Dutch population by gender and 5-year age class were based on yearly population monitoring studies of STIVORO of the year 2004 [25]. Start, cessation and restart rates in the current practice scenario were estimated for each 5-year age and gender class from 10-14 years of age to 85+ [26]. These estimates were based on STIVORO data (2002-2003) [27,28]. Most men and women start smoking between 10 and 25 years of age (see Figure 2.4). The cessation rates approximate 12-month continuous abstinence rates. The average smoking cessation rate of the current practice scenario across all age and gender classes was 5.1% and among adolescents 3.2%. Relapse rates in the model reflect former smokers starting to smoke again after having been abstinent in the previous year and are a
function of the time since smoking cessation. The probability to start smoking after having stopped, decreases the longer one has stopped.
Smokers as well as former smokers run an increased risk for smoking related diseases [2], with the risks of former smokers depending on time since cessation [29]. Hence, more quitters lead to a reduction in the incidence of smoking related diseases, which reduces morbidity and mortality. Using the model, [13,30,31]the long term effects of increased smoking cessation rates or decreased initiation rates can be simulated on the smoking prevalence and incidence, prevalence, mortality and costs of fourteen smoking-related diseases, myocardial infarction, other coronary heart disease, chronic heart failure, stroke, COPD, diabetes, lung cancer, stomach cancer, larynx cancer, oral cavity cancer, esophagus cancer, pancreas cancer, bladder cancer and kidney cancer, as well as on total mortality, morbidity and health care costs can be simulated [32,33].
4.3 Estimating health effects and cost effectiveness
Estimating the health effects and cost effectiveness of an intervention with the CDM is done by comparing the costs and effects of an intervention scenario with a so-called current practice scenario [34]. In the current practice scenario the parameters of the CDM are not altered and can be interpreted as the scenario with a continuation of current health care policy. Future smoking prevalence rates are the result of transitions between smoking statuses. In the intervention scenario, some parameters of the models are adjusted to reflect the effects of the intervention. For instance, in a smoking cessation intervention, stop rates of smokers can be increased in the CDM [35]. A smoking prevention intervention (like some of the school interventions) can cause a decrease in the initiation probability of smoking among youth. This will decrease the number of smokers, which causes a decrease in the incidence, and thus the prevalence of smoking related diseases. This causes a gain in (healthy) life expectancy. Cost effectiveness ratios can be computed by dividing the difference in health care costs between the intervention and reference scenario by the difference in life
years/QALYs between the intervention and reference scenario.
We will present cost effectiveness ratios in four different ways, so that the cost effectiveness can be compared with outcomes of other studies:
1. intervention costs per averted smoker: representing the short term cost-effectiveness of the different interventions;
2. intervention costs per life year /QALY gained;
3. intervention costs plus savings in the costs of smoking related diseases per life year /QALY gained;
4. intervention costs plus the total difference in health care costs per life year/QALY gained. It should be mentioned that the last ratio is the most important and this is the only one that can be compared with health care interventions not aimed at smoking cessation [34].
5. Scenarios
5.1
Introduction
As discussed in Chapter 4, the CDM models transitions between three smoking classes: never smokers, current daily smokers and former smokers. Scenarios are defined by temporarily adjusting the transition rates between those classes. However, the effectiveness of the interventions as reported in Chapter 3 can not translated directly into scenarios modeled with the CDM. For instance, the effectiveness of the school interventions was reported in terms of ‘experimental’ smoking instead of ‘daily’ smoking. This Chapter describes the assumptions that are needed to translate the effectiveness of the interventions discussed in Chapter 3 to scenarios modeled with the CDM. For all interventions we formulated so-called ‘best guess’ scenarios. Table 5.1 displays a short description and assumptions of all four ‘best guess’ scenarios.
Table 5.1: Short description of the best guess scenarios
Scenario name Taxes In-school Out-of-school Booster
Type of intervention Tobacco tax
increase In-school intervention Out-of-school intervention Booster intervention
Implementation 20% increase in
price in the year 2005
all 7th grade high schools for 10 years
all 7th grade high schools for 10 years
all 8th grade high schools for 10 years Effect on quitting and/or
initiation More quitters and less initiation
More quitters Less initiation More quitters and less initiation Intervention costs per
participant
0 18 50 75
In the following two paragraphs, the assumptions for the different ‘best guess’ scenarios are discussed in more detail. In sensitivity analyses we tested the robustness of the results for several assumptions made in these ‘best guess’ scenarios (see Appendix D for definition and results of the sensitivity analyses).
5.2 Tobacco taxes scenario
The empirical findings regarding the effectiveness of tobacco taxes on youth smoking behaviour vary quite a bit (see Chapter 3). In our ‘best guess’ scenario we will use the estimate of the prevalence elasticity from the study of Ross and Chaloupka which equals -.35 [5]. This implies that in our example of a 20% price increase, prevalence after one year has dropped with 7%. It is assumed that half of the drop in the prevalence of smoking is the result of less initiation and the other half is caused by more quitters. In a sensitivity analyses the effects of a maximum and minimum estimate of the prevalence elasticity are also estimated (see Appendix D).
We model a price increase of 20% since this is roughly the price increase of cigarettes in the Netherlands in the beginning of 2004. Furthermore, it is assumed that the price increase
exerts the most influence immediately after the price increase and that start and stop rates gradually return to their old level. In sensitivity analysis it is tested how results are influenced if start rates and stop rates return faster or slower to their old level.
Although tobacco tax increases will affect also smoking behaviour of adults, we will only present the results of the price increases on current adolescent smoking population (all Dutch citizens aged 10-19) in this report.3 This gives a good benchmark in terms of health gains to compare with the school interventions.
5.3 School scenarios
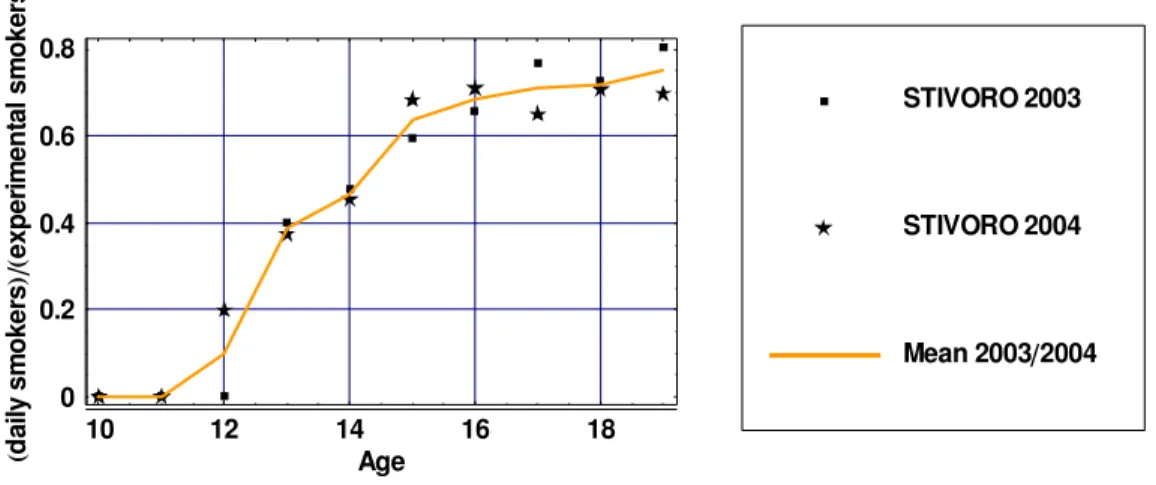
The effects on smoking status of the three different school interventions were all measured by the question ‘Have you smoked during the last month?’ . As described in Chapter 2, the prevalence rates of smoking differ enormously depending on the type of smoking status that is measured, daily smoking or experimental smoking. The effects of the interventions referred to experimental smoking status, not to daily smoking status. The prevalence rates, transition rates and relative risks of current and former smokers in the CDM are those of daily smokers and thus we needed to make assumptions about the effects of the interventions on daily smoking status. Figure 5.1 displays the prevalence of daily smoking divided by the prevalence of experimental smoking. The fraction of adolescents that indicates to smoke daily of all adolescents that indicate to have smoked during the past month increases with age. At low ages, most smokers are only ‘experimental’ smokers. However, approximately 70% of all smokers aged 18 are daily smokers.
10 12 14 16 18 Age 0 0.2 0.4 0.6 0.8 yli ad sr ek o ms lat ne mir ep xe sr ek o ms Mean 2003 2004 STIVORO 2004 STIVORO 2003
Figure 5.1: Ratio of daily /experimental smokers by age
To translate the effectiveness of the school interventions which were measured using experimental smoking status into effects on daily smoking the ratios of daily
smokers/experimental smokers were used (see Figure 5.1). Thus, if an intervention was successful at reducing experimental smoking prevalence by 10% at 13 years we assumed that the daily smoking prevalence was reduced by roughly 4 % since about 40% of all
3 In the report for interventions targeted results of tobacco tax increases for the complete Dutch population are
experimental smokers are daily smokers in that age group. For the school scenarios, we first calculated the difference in prevalence rates of experimental current smoking between the intervention and control group after 1 year for all interventions. To obtain effects of the interventions on daily smoking, the effects on experimental smoking status after 1 year were multiplied by the ratios as displayed in Figure 5.1. For the out-of-school scenario it was assumed that the difference was the result of less initiation and for the in school intervention it was assumed that the difference in smoking prevalence is the result of more quitters. For the booster scenario, we assumed that half of the drop in smoking prevalence was the result of less initiation and the other half of more quitters among smokers.
It was assumed that all school interventions were implemented on all school types in the Netherlands. Although the in-school and out-of-school have only been evaluated on
vocational schools there is no a priori reason why they could not be effective in other school types. To enable comparison of cumulative effects with the tax scenarios, for which we estimated effects on all current adolescents aged 10-19 years, in our school scenarios we assumed that the school interventions were implemented for ten years on all high schools in the Netherlands. For the in school and out-of school scenarios it was assumed that the intervention was implemented on all seventh grades. In the booster scenario it was assumed that all eight grades received the intervention.
6. Results
6.1 Introduction
In this Chapter only results of the ‘best guess’ scenarios are presented. It should be kept in mind that there is much uncertainty about the effectiveness of the interventions. In Appendix D results of the sensitivity analysis can be found that address some of the issues with respect to the uncertainty of the effectiveness of the interventions. However, not all uncertainty could be addressed in the sensitivity analysis. For the school scenarios,
uncertainty about the assumption regarding the effectiveness with respect to daily smoking is hard to quantify.
6.2 Effects on never, current and former smokers
Figure 6.1 displays difference in the number of smokers of the ‘best guess’ scenarios compared to the current practice scenario. The maximum difference in the number of smokers for the different scenarios ranges from approximately 15,000 for the in-school scenario to 45,000 for the booster scenario (the total number of smokers among adolescents currently is about 200,000). The booster scenario results in the largest drop in the number of smokers. In the school scenarios, the number of smokers increases immediately after the ten year implementation period of the school interventions. After this period, start and quit rates return to their current practice levels by assumption. In the tax scenario, a few years after the price increase the number of smokers gradually starts to rise again because smokers who have quit, start again or never smokers start smoking at a later age.
2020 2040 2060 2080 2100 Year 40000 30000 20000 10000 Difference # smokers Booster Out of school In school Taxes
Figure 6.1: Differences in number of smokers ‘best guess’ scenarios compared to current practice
To explain the differences in the number of smokers Figure 6.2 and 6.3 display the
differences in the number of never smokers and former smokers. The out-of-school scenario reduces the number of adolescents who start smoking, thereby increasing the number of never smokers, and decreasing the number of smokers and thus also the number of former smokers. For the in-school scenario, it was assumed that the intervention only increased the number of quitters which decreases the number of smokers and increases the number of former smokers. Hence, by assumption the number of never smokers is not affected in the in-school scenario. Results of the tax and booster scenarios are caused by both mechanisms.
2020 2040 2060 2080 2100 Year 10000
20000 30000
Difference # never smokers
Booster Out of school In school Taxes
Figure 6.2: Differences in number of never smokers ‘best guess’ scenarios compared to current practice
2020 2040 2060 2080 2100 Year 10000
10000 20000
Difference # former smokers
Booster Out of school In school Taxes
Figure 6.3: Differences in number of former smokers ‘best guess’ scenarios compared to current practice
6.3 Health gains
Figures 6.4 and 6.5 display the life years and QALYs gained over time. In all figures costs and effects are discounted at 4% to follow Dutch guidelines for pharmaco economic research [36]. The reduction in the number of smokers results in a decrease in the incidence of
smoking related diseases which causes a gain in life years and QALYs compared to current practice. The largest effects occur some 60-70 years after the intervention when the school population that received the intervention becomes middle aged. The health gains approach zero as the cohorts that receive the school intervention become extinct. Comparing Figures 6.4 and 6.5 shows that in the beginning there is more gain in quality of life than length of life caused by the reduced incidence of smoking related diseases. However, in the long run the gain in life years is larger than the gain QALYs as a result of substitute diseases that decrease quality of life in life years gained.
2020 2040 2060 2080 2100 Year 50 100 150 200 250
Life years gained
Booster Out of school In school Taxes
Figure 6.4: Life years gained over time (life years discounted with 4%)
2020 2040 2060 2080 2100 Year 50 100 150 200 250 QALYs gained Booster Out of school In school Taxes
6.4 Effects on health care costs
Figure 6.6 displays the difference in health care costs of smoking related diseases and Figure 6.7 of diseases not related to smoking. The decrease in the incidence of causally to smoking related diseases results in a decrease in health care costs of those diseases. However, the gain in life years causes an increase in the prevalence of all diseases, both those related to smoking and those not related to smoking (Figure 6.7). For the tax scenario after approximately 65 years costs of smoking related diseases start rising again. For the school scenarios, this happens a few years later since the implementation period of the school interventions is 10 years and the effects on the number of smokers of the school interventions are identical these 10 years. In the taxes scenario it is assumed that the effects on smoking prevalence are strongest the first year after the 20% price increase.
2020 2040 2060 2080 2100 Year 800 600 400 200 200 1000 Booster Out of school In school Taxes
Figure 6.6: Difference in health care costs of smoking related diseases over time (4% discount rate) 2020 2040 2060 2080 2100 Year 500 1000 1500 2000 2500 1000 Booster Out of school In school Taxes
Figure 6.7: Difference in health care costs of diseases not related to smoking over time (4% discount rate)
Figure 6.8 displays the total difference in health care costs over time. From this figure it can be seen that the savings in health care costs of smoking related diseases are outweighed by increases in the health care costs of diseases not related to smoking in life years gained. This is mainly due to high costs at the end of the time horizon. Cost savings were obtained over the first 60 years, from a reduction in smoking related diseases. However, if smokers live longer therefore they have a higher lifetime chance to develop chronic, expensive, not lethal diseases like dementia. The intervention costs during the first ten years for the school programs are not included in this figure.
2020 2040 2060 2080 2100 Year 500 500 1000 1500 2000 2500 3000 1000 Booster Out of school In school Taxes
Figure 6.8: Difference in total health care costs over time (intervention costs not included, discount rate 4%)
6.5 Cost utility ratios
Table 6.1 (next page) summarizes the results for the ‘best guess’ scenarios. The intervention costs per averted smoker are lowest for the in-school and highest for the out-of-school intervention. More health gains are achieved in the scenarios that have effect on smoking prevention compared to the scenarios in which effects on the number of quitters are assumed. This is because a lot of quitters start smoking again at a later age, and at a young age the target group is larger for interventions that have effect on smoking initiation compared to quitting. Therefore, intervention costs per QALY gained for out-of-school scenario were almost half those for the in-school scenario. The costs for the booster scenario were in between. Since tax increases had no intervention costs, it was not possible to calculate the intervention costs per LYG or QALY. However, since there is an increase in total health care costs, it was possible to calculate a cost effectiveness ratio by dividing the difference in health care costs by the incremental health effects gained. If only savings in the costs of smoking related diseases were taken into account, taxes were cost saving, while if total health care costs were included, costs per LY/QALY gained were 4,000 and 4,500, respectively. For the school programs, costs per LY/QALY gained were lower than the intervention costs
per LY/QALY gained, counting only smoking related diseases. If the total difference in health care costs was taken into account, the out-of-school intervention was most cost effective, but the cost-effectiveness ratios of all school interventions did not differ much and were much higher than those for tax increases. The cumulative life years/QALYs gained ranged from 1,600/1,700 to 8,600/8,000. The cumulative health effects were higher for scenarios in which effects on the number of starters were modeled. This can be explained since a lot of former smokers start again after having stopped. Furthermore, the life expectancy of never smokers is higher than that of former smokers. Since health care costs increase with age the cost utility ratio for the start scenarios is higher than for the stop scenarios.
Table 6.1: Summary of results
Scenario name Taxes In-school Out-of-school Booster
Difference # smokers after 10 year 14,000 16,000 35,000 46,000
Cumulative intervention costs a b 0 35.5 102.0 150.0
Intervention costs per averted
smoker 0 1,600 2,200 2,900
Cumulative Life years gained b 5,300 1,600 8,500 8,600
Cumulative QALYs gained b 4,800 1,700 7,500 8,000
Intervention costs per LY gained b 0 22,200 12,000 17,500
Intervention costs per QALY
gained b 0 21,100 13,600 18,900
Cumulative difference in health care costs of smoking related diseases a b
-15.4 -7.3 -21.8 -26.8
per LY gained b c Cost saving 17,700 9,400 14,400
per QALY gained b c Cost saving 16,800 10,700 15,500
Cumulative difference in total
health care costs a b +21.4 +2.5 +39.5 +32.6
per LY gained b d 4,100 23,800 16,700 21,300
per QALY gained b d 4,500 22,600 18,900 23,000
a 1.000.000 b discounted at 4% c Interventions costs and savings in smoking related diseases taken into
account d Interventions costs and difference in total health care costs into account
Figure 6.9 (next page) displays the total costs and effects for the school and tax scenarios with uncertainty ranges regarding the effectiveness of the interventions. Costs and effects in Figure 6.9 are discounted with 4%. For the school scenarios, only the uncertainty of the interventions with respect to experimental smoking is translated into daily smoking.
Uncertainty about the assumption regarding the effectiveness with respect to daily smoking is not taken into account