SMEETS Edward
VINYES Cristina
TABEAU Andrzej
VAN MEIJL Hans
BRINK Corjan
PRINS Anne Gerdien
2 0 1 4
Evaluating the macroeconomic impacts
of bio-based applications in the EU
J R C S C I E N C E A N D P O L I C Y R E P O R T S
LF-NA-26777-EN-N
As the Commission’s in-house science service, the Joint Research Centre’s mission is to provide EU policies with independent, evidence-based scientific and technical support throughout the whole policy cycle.
Working in close cooperation with policy Directorates-General, the JRC addresses key societal challenges while stimulating innovation through developing new methods, tools and standards, and sharing its know-how with
the Member States, the scientific community and international partners. Serving society
Stimulating innovation Supporting legislation JRC Mission
European Commission Joint Research Centre
Institute for Prospective Technological Studies Contact information
Address: Edificio Expo. c/ Inca Garcilaso, 3. E-41092 Seville (Spain) E-mail: jrc-ipts-secretariat@ec.europa.eu Tel.: +34 954488318 Fax: +34 954488300 https://ec.europa.eu/jrc https://ec.europa.eu/jrc/en/institutes/ipts Legal Notice
This publication is a Science and Policy Report by the Joint Research Centre, the European Commission’s in-house science service. It aims to provide evidence-based scientific support to the European policy-making process. The scientific output expressed does not imply a policy position of the European Commission. Neither the European Commission nor any person acting on behalf of the Commission is responsible for the use which might be made of this publication.
JRC91385 EUR 26777 EN
ISBN 978-92-79-39536-9 (PDF) ISSN 1831-9424 (online) doi:10.2791/10930
Luxembourg: Publications Office of the European Union, 2014 © European Union, 2014
Pictures in the cover page: © kav777
Reproduction is authorised provided the source is acknowledged. Abstract
In 2012, the European Commission (EC) launched the Bioeconomy Strategy and Action Plan with the objective of establishing a resource efficient and competitive society that reconciles food security with the sustainable use of renewable resources. This report contributes to the plan by evaluating the macroeconomic impacts of bio-based applications in the EU. Such effects can only be evaluated with a computable general equilibrium model such as MAGNET.
Four bio-based applications are considered, namely biofuel (second generation), biochemicals, bioelectricity, and biogas (synthetic natural gas). This is done assuming that 1 EJ lignocellulose biomass is converted into fuel, chemicals, electricity and gas and that the final product replaces an equal amount of conventional (e.g. fossil energy) product (on energy basis). The results show that given the assumed efficiency of conversion technology, costs of conversion, biomass price and oil price, the production of second generation biofuel and biochemicals are the only competitive sectors compare to their conventional counterparts in the year 2030 for the EU. In the case of the fuel sectors, it represents a net GDP effect of 5.1 billion US$ while biochemicals generates 6 billion US$. A substantial part of this impact can be explained by the increase in wages, since the production of biomass is relatively labour intensive. The resulting increase in wages is transmitted to other sectors in the economy and increases production and consumption. Another important contributor is the lower oil and fuel price as a result of the substitution of oil based fuel production by bio-based fuel production, which in turn benefits the entire economy.
Europe Direct is a service to help you find answers to your questions about the European Union Freephone number (*): 00 800 6 7 8 9 10 11
(*) Certain mobile telephone operators do not allow access to 00 800 numbers or these calls may be billed. A great deal of additional information on the European Union is available on the Internet.
It can be accessed through the Europa server http://europa.eu. How to obtain EU publications
Our publications are available from EU Bookshop (http://bookshop.europa.eu), where you can place an order with the sales agent of your choice.
The Publications Office has a worldwide network of sales agents.
You can obtain their contact details by sending a fax to (352) 29 29-42758.
European Commission
EUR 26777 – Joint Research Centre – Institute for Prospective Technological Studies Title: Evaluating the macroeconomic impacts of bio-based applications in the EU
Authors: SMEETS Edward, VINYES Cristina, TABEAU Andrzej, VAN MEIJL Hans, BRINK Corjan, PRINS Anne Gerdien Luxembourg: Publications Office of the European Union
2014 – 36 pp. – 21.0 x 29.7 cm
EUR – Scientific and Technical Research series – ISSN 1831-9424 (online) ISBN 978-92-79-39536-9 (PDF)
JRC SCIENTIFIC
AND POLICY REPORTS
Joint Research Centre
Evaluating the
macroeconomic impacts of
bio-based applications in
the EU
SMEETS Edward
VINYES Cristina
TABEAU Andrzej
VAN MEIJL Hans
BRINK Corjan
PRINS Anne Gerdien
A c k n o w l e d g e m e n t s
This report has been jointly prepared by scientific researchers from LEI-WUR, the European Commission’s JRC-IPTS centre, and the Netherlands Environmental Assessment Agency (PBL).
The project benefited from support granted by the European Union’s Seventh Framework programme under Grant Agreement No 341300 (Bioeconomy Information Systems Observatory project).
LEI-WUR gratefully acknowledges funding from the Ministry of Infrastructure and the Environment of the Netherlands
/ The Netherlands Environmental Assessment Agency and via the Knowledge Infrastructure for Sustainable Biomass and BE Basic projects, which are funded by the Ministry of Economic Affairs and the Ministry of Infrastructure and the Environment of the Netherlands.
Authors acknowledge valuable comments by AGRILIFE Head of Unit Jacques Delincé, Robert M’Barek, Jon Pycroft and Damien Plan. Special thanks for the editing work to Jeff Powell.
Contents
Acknowledgements 3 Executive summary 7 1 Introduction 9 2 Database 13 3 Model 154 Biomass modelling in MAGNET and cost data. 17
4.1 Modelling bio-based sectors in MAGNET 17
4.2 Biomass availability and production costs 18
4.3 Biomass pre-treatment and transport costs 19
4.4 Conversion efficiency and costs 20
5 Baseline and Scenarios 23
5.1 Baseline scenario 23
5.2 Bio-based scenarios 23
6 Results 25
6.1 Conventional vs bio-based production costs 25
6.2 Total production value and total GDP effect 25
6.3 Prices 27 6.4 Employment 28 6.5 Production 30 6.6 Consumption 31 6.7 Trade 32 7 Concluding remarks 33 References 35
List of Tables
Table 1: Projections of the energy prices in the baseline (in $/GJ). 13
Table 2: Biomass availability and production costs in 2030 18
Table 3: Biomass feedstock’s cost structures (% of total costs). 18
Table 4: Biomass transport and pelletizing cost structures (in $/GJ and % of total costs). 19
Table 5: Cost structures of the four chains considered for conventional (CONV) and bio-based (BIOB) applications 22
Table 6: The production costs of conventional and bio-based fuel, chemical, electricity and gas ($/GJ). 25
Table 7: The impact of biomass applications on the production value and GDP (billion US$). 26
Table 8: The impact of biomass applications on prices (%). 27
Table 9: The impact of biomass applications on wages (%). 28
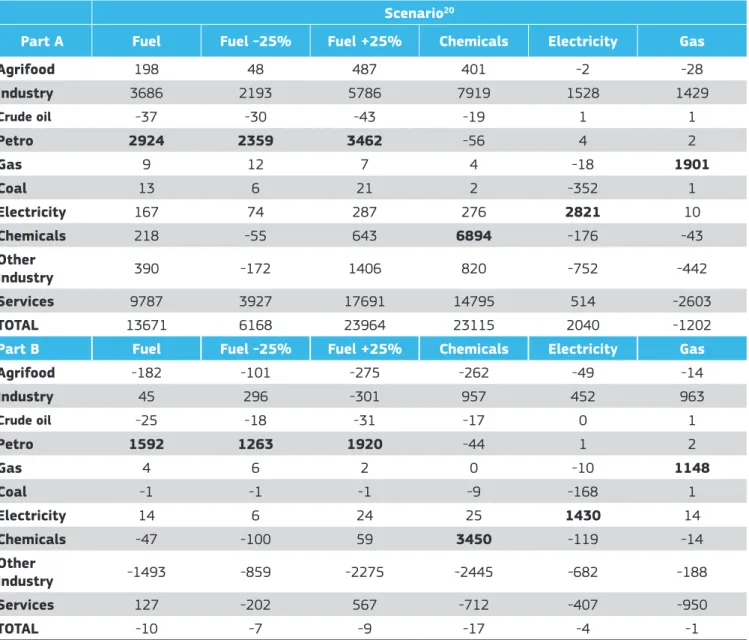
Table 10: The impact of biomass applications on employment value (part A in MUS$) and employment volume
(part B in MUS$). 29
Table 11: The impact of biomass applications on production volume (%). 30
Table 12: The impact of biomass applications on consumption volume (%). 31
Table 13: The impact of biomass applications on Trade balance (value in billion US$). 32
List of Figures
E x e c u t i v e s u m m a r y
In 2012, the European Commission (EC) launched the Bioeconomy Strategy and Action Plan with the objective to establish a resource efficient and competitive society that reconciles food security with the sustainable use of renewable resources. The focus of the Action Plan is on 1) investing in research, innovation and skills; 2) reinforcing policy interaction and stakeholder engagement; and 3) enhancing markets and competitiveness in the bioeconomy. To promote and monitor the development of the EU bioeconomy, the EC launched the Bioeconomy Information System Observatory project (BISO) aiming to set up a Bioeconomy Observatory. That observatory brings together relevant data sets and information sources, and uses various models and tools to provide a coherent basis for establishing baselines, monitoring, and scenario modelling for the bioeconomy. Moreover, the EC also started the Systems Analysis Tools Framework for the EU Bio-based Economy Strategy project (SAT-BBE) with the purpose to design an analysis toolbox useful to monitoring the evolution and impacts of the bioeconomy.
This report shall contribute to the Bioeconomy Strategy and Action Plan, and to the projects above as it aims to evaluate the macroeconomic impacts of bio-based applications in the EU. The macroeconomic effects of bio-based applications studied in this report are not only determined by the production costs, but also by the many indirect economic effects of these bio-based applications. Most of the indirect economic effects are caused by the interlinkages of the economy’s sectors, mostly through the use of production factors (labour and capital) and intermediate inputs for bio-based production and by changes in prices, production, consumption and trade. Such effects can only be evaluated with economic models, such as MAGNET (Modular Applied GeNeral Equilibrium Tool) which is the global recursive dynamic computable general equilibrium model used in this study.
Four bio-based applications are considered in MAGNET for the EU only, namely biofuel (second generation), biochemicals, bioelectricity, and biogas (synthetic natural gas). This is done assuming that 1 EJ lignocellulose biomass is converted into fuel, chemicals, electricity and gas and that the final product replaces an equal amount of conventional (e.g. fossil energy) product (on energy basis). To evaluate the importance of the indirect economic effects two methods
are compared to calculate the net GDP effect. First, the expected change in production value is calculated based on the conversion efficiency and costs of bio-based and conventional applications, these results are reached without the use of a CGE model. The second method calculates the net GDP effect by using the CGE model MAGNET.
The impact of biomass applications on GDP in the EU (billion US$). Direct cost calculations - Value of production CGE GDP effect MAGNET Multiplier effect 1 Fuel
+
+
>1 2 Chemicals+
+
<1 3 Electricity-
-
>1 4 Gas-
-
>1Source: Own and MAGNET calculations.
Given the assumed efficiency of conversion technology, costs of conversion, biomass price and oil price, the production of second generation biofuels and biochemicals are competitive sectors when compared to their conventional counterparts in the year 2030 for the EU, while the production of bio-based electricity and gas is not (Table above). Hence, replacing conventional fuels and chemicals by biofuels and biochemical will result in an increase in GDP. In the case of the fuel sector, the net GDP effect, as calculated by MAGNET, is larger than the direct value of production when costs are directly calculated (taking into account only the difference in production costs between conventional and bio-based applications, and no indirect economic effects). This implies a multiplier effect larger than one.
A substantial part of the multiplier effect of biofuel production can be explained by increases in wages, since the production of biomass is relatively labour intensive. In total, around 26% of the costs of producing, transporting and converting biomass are labour costs and almost all labour is used for the production and pre-treatment of the biomass. A shift from conventional to bio-based production increases the direct use of labour. The resulting increase in wages is transmitted to other sectors in the economy as higher wages
E v a l u a t i n g t h e m a c r o e c o n o m i c i m p a c t s o f b i o - b a s e d a p p l i c a t i o n s i n t h e E U
8
would imply more spendable income, hence production and consumption increases. Another important contributor to the multiplier effect are lower oil and fuel prices as a result of the substitution of oil based fuel production by bio-based fuel production, which in turn benefits the entire economy. These effects are higher in the scenario with higher oil prices, since a higher oil price means that the impact of biofuel production has a larger impact on the price of fuel. The opposite effect occurs in case of the lower oil price scenario, but biofuels remain competitive.
The same mechanisms described above apply to the macroeconomic impacts of the production of chemicals, electricity and gas. Given the assumptions, the production of chemicals results in the highest net GDP effect of the four bio-based applications considered, making it very competitive when compared to its conventional counterpart. However, the change in value of production costs is larger than the GDP effect which leads to a multiplier effect which is less than one. The increased production in the chemical industry, which is relatively labour intensive compared to the other bio-based applications and conventional sectors considered in this study, increases the demand for labour. This results in a reduced competitiveness of the service sector and the ‘other industries’ sector which compete for labour with the chemical industry. This effect reduces the volume of labour and the production volume in these sectors (i.e. services and ‘other industries’). Moreover, imports also
increase to maintain the level of consumption of services and ‘other industries’ sectors, which results in a negative trade balance effect.
Last, given the assumed efficiency of conversion technology, costs of conversion, biomass price and oil price, the production of bioelectricity and biogas are shown not to be competitive with their conventional counterparts and hence their prices rise, while employment, production, consumption and exports fall.
However, in the context of this novel research line, both the approach and MAGNET have several drawbacks and shortcomings. For example, the analyses presented in this report assume that one unit of bio-based product replaces an equal amount of conventional product (in terms of energy). In reality the use of bio-based products changes the demand and supply and price of conventional products. Also the demand and supply of biomass is considered in a static manner that only partially accounts for the impacts on land use and agricultural production and consumption. These effects can only be modelled by expanding MAGNET with new sectors that supply biomass or convert biomass into energy or materials; such work is currently being developed for future analysis on the subject.
Overall, based on the assumed efficiency of the conversion technology, costs of conversion, biomass prices and oil price, the analysis of biomass applications suggests that biomass would be better used in the production of second generation biofuels or biochemicals industries.
I n t r o d u c t i o n
In 2012, the European Commission (EC) launched the Bioeconomy Strategy and Action Plan with the objective of establishing a resource efficient and competitive society that reconciles food security with the sustainable use of renewable resources. More specifically, the Bioeconomy Strategy is aimed at five societal challenges 1) Ensuring food security; 2) Managing natural resources sustainably; 3) Reducing dependence on non-renewable resources; 4) Mitigating and adapting to climate change; and 5) Creating jobs and maintaining European competitiveness. The focus of the Action Plan is on 1) investing in research, innovation and skills; 2) reinforcing policy interaction and stakeholder engagement; and 3) enhancing markets and competitiveness in the bioeconomy.
To promote and monitor the development of the European Union (EU) bioeconomy, the EC launched the Bioeconomy Information System Observatory project (BISO) in February 2013 with the objective to set-up a Bioeconomy Observatory. That observatory must bring together relevant data sets and information sources, and use various models and tools to provide a coherent basis for establishing baselines, monitoring, and scenario modelling for the bioeconomy. Moreover, the EC started the Systems Analysis Tools Framework for the EU Bio-based Economy Strategy project (SAT-BBE) in November 2012, with the purpose to design an analysis tool useful to monitoring the evolution and impacts of the bioeconomy.
BISO and SAT-BBE are complementary projects. The BISO project aims at providing a comprehensive insight in the availability of data and tools that could be helpful when developing the conceptual analysis framework of the bioeconomy. While the SAT-BBE project aims at developing an analysis tool for monitoring the evolution of the bio-based economy bio-based on both quantitative and qualitative analytical models and tools in order to advise the BISO project on the types and sources of data and tools that need to be considered. Moreover, BISO will also assemble and implement the data and tools that lie beyond the conceptual framework to be designed in SAT-BBE into an information system.
At the same time, the EU is committed to combat climate change and to increase the security of its energy supply. To these ends, the EC has set ambitious greenhouse gas
emission and energy use reduction targets, which are known as the “20-20-20” targets for 2020:
• A 20% reduction in EU greenhouse gas emissions compared to 1990 levels
• A 20% rise of the EU share of renewable energy consumption
• A 20% improvement in the EU’s energy efficiency.
The 20% rise targeted increase for renewable energy consumption is implemented in the Renewable Energy Directive (RED) (EC 2009). In addition, the RED also includes a mandatory share of 10% renewable energy in transport for each member state.
The RED of the EC and various national policies, such as the Incentive Scheme for Sustainable Energy Production in the Netherlands, have resulted in a rapid increase in the use of renewable energy in the EU, from 8.5% in 2005 to 12.7% in 2010 (EC 2013). The production of energy from biomass currently accounts for more than two thirds of total renewable energy use in the EU (EC 2014). In the RED, Biomass is defined as the biodegradable fraction of products, waste and residues from biological origin from agriculture (including vegetal and animal substances), forestry and related industries including fisheries and aquaculture, as well as the biodegradable fraction of industrial and municipal waste. Biomass can be used for the production of various types of energy, such as heat and electricity, but also for liquid biofuels for transport and biogas.
Bioenergy1 is currently, the most important source of
renewable energy, both globally and in the EU and is expected to remain so in the future. The contribution of bioenergy to the total primary energy supply in the EU increased from 2.8% in 1990 to 7.7% in 2011 and is expected to increase to
10.2% in 2020 (IEA 2013) This means that more than 60%
of the renewable energy use will be met by bioenergy. The production of heat and electricity from solid biomass is by far the most important type of bioenergy, where its share
1 Bioenergy is renewable energy derived from biomass which includes biological materials such as plants, animals, woods, waste and alcohol fuels (https://www.iea. org/topics/bioenergy/).
E v a l u a t i n g t h e m a c r o e c o n o m i c i m p a c t s o f b i o - b a s e d a p p l i c a t i o n s i n t h e E U
10
in final consumption is expected to increase from 4.9% in 2010 to 8% in 2020 (Atanasiu 2010). The use of biogas and liquid biofuels is also expected to increase within the EU over the next decade, but with a limited contribution to the 2020 renewable energy target in the large majority of member states.
However, not only the demand for biomass for energy production is increasing. Rapid economic growth in some regions of the world and an increase in global population to 9 billion people in 2050 requires a move towards more sustainable, “triple performing” types of primary production which embrace economic, social and environmental objectives.
To this end, a wide variety of existing models and tools can be, and partially already have been, used to monitor and evaluate the impact of the bioeconomy on land use change and food security (Edwards et al. 2010, Laborde 2011, Plevin
et al. 2013) (Rathmann et al. 2010, Tyner 2010, Banse et al.
2011, Ciaian et al. 2011, Kim et al. 2011, Timilsina et al. 2011, Kavallari et al. 2014).
Recently, M’Barek et al. (2014) have provided an overview of the bioeconomy in the EU and argued for the need to adapt data and tools (such as social accounting matrices and CGEs) to these new challenges.
In addition to the aspects covered in the studies above there is a need for comprehensive assessments of the macroeconomic impacts of emerging bio-based sectors, technologies and applications. Examples are the use of biomass for the production of second generation biofuels, biochemicals, bioelectricity and biogas. Such assessments provide insight into the factors, mechanisms and relationships that determine the macroeconomic effects of the use of different bio-based applications in the EU. Such insights can help policy makers to design efficient and effective bio-based policies that contribute to economic growth and employment generation. However, only a limited number of studies have been carried out that investigate both the direct and indirect economic implications of a bio-based economy in the EU. Some of these studies are discussed below in order to show the relevance of comprehensive economic assessments. A relevant example is the study ‘An approach to describe
the agri-food and other bio-based sectors in the European Union’ of the Institute for Prospective Technological Studies
of the Joint Research Centre - EC (Cardente et al. 2012). The study is based on a set of SAMs for the EU-27 with a detailed disaggregated agricultural sector (AgroSAMs) for the year 2000 (Hertel and Tsigas 1997). The SAMs are used to identify key sectors of the bioeconomy and to extract the main tendencies in the behaviour of an economy. For this purpose, all sectors of an economy can be ranked according to a hierarchy derived from two types of indexes: a backward linkage (BL) and a forward linkage (FL), traditionally obtained from a symmetrical input-output table (SIOT). The BL indicator analyses the effect on the rest of the economy of a
change in the final demand of a sector. The FL evaluates the effect of a joint change in the final demand of all sectors on the production of a specific sector. Potential key sectors are sectors with a BL greater than 0.9, independently of its FL level. The results showed that livestock and related products (including fodder, milk and dairy products) present the highest BL within these sectors at the European level. Energy and water sectors are also important potential key sectors. On the other hand, some primary sectors - durum wheat, soy beans and sunflower seeds, grapes, fresh and vegetables, fruits and nuts - cannot be considered as key agri-food and other bio-based sectors at the EU level, although they may be key for some countries. The same observation applies to chemicals, rubber and plastic products. Further research may use the methodology on an updated database for a detailed pan-EU diagnosis. The limits of this approach are evident, as many changes in the EU economies have taken place within a decade. However, the AgroSAMs are the EU database providing details of all the relevant sectors mentioned. An update of the AgroSAMs for the year 2007 is on-going and will provide more recent data and results. A key limitation of SAM analysis is that no price and income effects are taken into account and also that other macroeconomic correlations and interactions are ignored. Investigating these links and correlations requires the use of a Computable General Equilibrium (CGE) model. However, only a limited number of CGE studies have been carried out on the bio-based economy, as further discussed below.
An example of a study that considers both direct and indirect effects is the study of Hoefnagels et al. (2010), which uses the LEITAP CGE model (currently called the MAGNET model) in combination with bottom-up analyses to evaluate the terms of value added, employment shares and the trade balance of the bio-based economy in the Netherlands for 2030. The results of the projections show that substitution of fossil energy carriers by biomass can have positive economic effects, as well as reducing GHG emissions and fossil energy requirement. The key factors to achieve these targets are enhanced technological development and the import of sustainable biomass resources into the Netherlands.
In the same year, Nowicki et al. (2010) carried out a related project aimed at improving the modelling of the bio-based economy with a national CGE model for the Netherlands (ORANGE). This study shows that, by using expert knowledge, it has been possible to integrate technical bio-based data into the original economy-based database of the model. ORANGE is used to model the effects of substitution of bio-based polylactic acid (PLA) as an intermediary product within the plastics industry, in place of oil based substances. The effects are calculated for the national economy, but also for agricultural commodity prices and land markets. Results show that the bio-based economy will create a new demand for agricultural commodities for the production of goods that are now using primary or intermediary materials coming from the oil based economy. This shift between two economic systems will (a) create greater demand for agricultural output and, as a consequence; (b) require more
I n t r o d u c t i o n
land for the agricultural sector. At the moment of writing a more detailed assessment of the macroeconomic impacts of the bio-based economy in the Netherlands is carried out using a combination of the ORANGE and MAGNET models referred to above.
In 2012, a CGE modelling study
was
completed in whichthe use of residues from palm oil production was used for various bio-based applications in Malaysia (Van Meijl et al. 2012). The results show that the macroeconomic effects are primarily influenced by the production and conversion costs of bio-based products compared to the price of fossil energy based systems. The relatively large differences between net GDP effects and the revenues connected to the use of palm oil biomass are the opportunity costs which are not zero in an economy that has not a lot unused resources in addition to palm waste. In other words, the collection, transportation and processing of palm biomass into ethanol and other products take resources (labour, capital and other inputs) from other activities if it is assumed that for example there is full employment in Malaysia (which is not an unreasonable assumption). Therefore, the emergence of a bio-based economy influences directly and indirectly many other sectors within the economy, for example, the education, financial and innovation systems. Therefore, the successful development of a bio-based economy requires a coherent set of government policies covering agricultural, energy, transport, infrastructure, education, financial, export and technology policies.
Also relevant is the study of Taheripour and Tyner (2010), which is based on the GTAP model. They investigated the interaction between biofuel use on other policies and on government and household income in the United States. Results indicate that the biofuel policy implemented raised the price of agricultural commodities and hence reduced the need for agricultural subsidies (in the US the level of agricultural subsidies is linked to the price of agricultural commodities). This effect partially relieves the impact of the
ethanol subsidy policy on government spending. Taheripour and Tyner also consider the impact of the ethanol policy on government spending and income tax. The results show that these mechanisms determine to a large extent the impact of biofuel policy on prices of agricultural commodities, GDP and welfare, but also on fossil fuel prices and consumption and thereby also GHG emissions.
The results of the studies discussed above, and also the modelling frameworks that are being developed in BISO and SAT-BBE, show that the economy-wide effects of bio-based applications can only be evaluated using CGE models if one wants to capture all the sectoral inter-linkages in the economy raising direct and indirect effects. Therefore, the objective of this study is to gain insight in the factors, mechanisms and correlations that determine the macroeconomic effects of a more bio-based EU. This is done using the MAGNET (Modular Applied GeNeral Equilibrium Tool) global recursive dynamic CGE model, which enables an evaluation of the main mechanisms of the impact of bio-based applications on consumption, production, prices, GDP, trade balance and employment for the economy as a whole and for the different sectors individually in the economy. Crucial for the macroeconomic effects of the bio-based applications is the efficiency of technologies to collect and convert biomass into bioenergy (e.g. biofuel, bioelectricity or biogas) or biochemicals, and the costs relative to fossil resources-based technologies. Therefore, the (development) price of fossil-based substitutes is explicitly considered in this study. Also important for the macroeconomic effects is the use of production factors (labour and capital) and intermediate inputs for bio-based production, which differ between different bio-based applications. In other words, the production of bio-based products competes for production factors and inputs with other sectors of the economy. The results of this study will be used in the SAT-BBE and BISO project when developing analysis tools for monitoring the evolution of the bio-based economy.
D a t a b a s e
The data used in this study is based on the GTAP database version 8 (Narayanan et al. 2012) which includes data on bilateral trade patterns, production, consumption and the intermediate use of commodities and services. It includes the dual reference years of 2004 and 2007 (in this case the 2007 reference year is used), all monetary values of the data are in million US$. The database covers 129 regions and 57 commodities. For computability, the database has been aggregated into 22 regions and 32 commodities of which 26 can be considered bio-based, following the SAT-BBE definition. The sectoral aggregation includes the new sectors such as second generation biofuel, bioelectricity, biogas and biochemicals as well as several primary sectors (e.g. cereals and oil seeds), processed products (e.g. dairy and meat products), industry and resources (e.g. coal, oil, petroleum and chemicals) and services (e.g. financial and business services). The regional aggregations include the
EU and its main trading partners, such as the USA, Canada, China, Russia etc. Furthermore, each region’s economy was
disaggregated according to nine accounts2.
To create the 2030 database, projections of GDP and population are assumed in line with USDA macroeconomic
projections3. Projections by the World Development Indicators
(WDI) are the main source of data for labour force. Data for
capital stock projections are taken from the OECD4. Lastly,
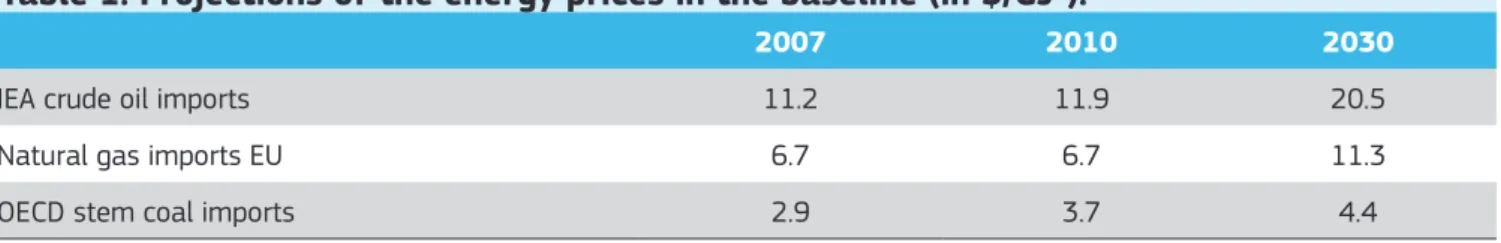
assumptions on the evolution of crude oil, gas and coal prices follow projections by the International Energy Agency (IEA 2011) see Table 1. These projections are based on the baseline scenario (referred to as Current Policies scenario in the IEA report), which assumes no changes in policies. All other parameters values follow the standard MAGNET model (Woltjer et al. 2013) as described further in the following section.
2 Activities, intermediate inputs, factors, households (regional and private), government, savings & investment, taxes, margins (trade costs and transport), and rest-of-the-world (trade, transfers, etc.).
3 http://www.ers.usda.gov/Data/Macroeconomics/#BaselineMacroTables 4 http://www.oecd.org/home/0,2987,en_2649_201185_1_1_1_1_1,00.html 5 1 GJ (Gigajoule) = 108 J (Joule)
2 Database
Table 1: Projections of the energy prices in the baseline (in $/GJ
5).
2007 2010 2030
IEA crude oil imports 11.2 11.9 20.5
Natural gas imports EU 6.7 6.7 11.3
OECD stem coal imports 2.9 3.7 4.4
E v a l u a t i n g t h e m a c r o e c o n o m i c i m p a c t s o f b i o - b a s e d a p p l i c a t i o n s i n t h e E U
M o d e l
The model used to analyse the macroeconomic consequences of a more intense bio-based EU is MAGNET (Modular Applied
GeNeral Equilibrium Tool)6. MAGNET is a recursive dynamic
global computable general equilibrium (CGE) model developed
by LEI7. MAGNET builds on the standard GTAP model8 (Hertel
and Tsigas 1997), by including different modules that can be switched on and off depending on the policy question at hand. The behavioural relationships used in MAGNET are those found in the standard GTAP model and correspond to neo-classical optimization assumptions: Producers are perfectly competitive and use technology characterized by Constant Elasticity of Substitution (CES) production functions over primary inputs (e.g. labour and capital) and Leontief production functions across intermediate inputs (e.g. agricultural, manufacturing or services sectors). Both labour types (skilled and unskilled) and capital are fully mobile between sectors and across the same region but immobile between countries, while land (which is agriculture specific) and natural resources exhibit restricted mobility. All five factors of production are fully employed. Last, technological change is assumed exogenous in the model.
Domestic demand is satisfied by composite commodities composed of domestic and imported commodities. A regional household accumulates income from the factors of production and ad valorem taxes, which are then appropriated in Cobb-Douglas fashion (i.e. fixed shares) over non-homothetic private demands, public demands and savings (investment demand). The price systems are linearly homogenous and thus only changes in relative prices matter. Consequently, the model has a global numeraire (world price index of primary factors), which is a benchmark of value against which changes in all other prices can be measured
Gross trade flows, modelled as import demands, are differentiated by region of origin using the Armington (1969) specification. Regional savings are collected by a global bank, which then assigns regional investments subject to a
6 MAGNET is part of the integrated Modelling Platform for Agro-economic Commodity and Policy Analysis (iMAP) hosted by the European Commission’s Joint Research Centre, Institute for Prospective Technological Studies (M’barek et al. 2012). 7 http://www.wageningenur.nl/en/Expertise-Services/Research-Institutes/lei/Research-Areas/International-policy.htm
8 Global Trade Analysis Project, see https://www.gtap.agecon.purdue.edu/
rate of return or a fixed share rule. Once the closure rules are defined, exogenous policy shocks initiate an interaction between economic agents, subject to a series of accounting identities and market clearing equations, which ensure a new ‘counterfactual’ general equilibrium solution.
In order to analyse the bio-based sectors and their inter-linkages with the rest of the economy the following modules are included: first the land use modules relating to endogenous land supply (which allows land to shift in and out of agriculture and accounts for increasing costs of conversion as land becomes scarce), land transformation between sectors (accounts for cost adjustments due to the land mobility for different uses) and substitution possibilities between feed inputs in the livestock sectors (Van Meijl et al. 2006; Eickhout et al. 2008; Neumann et al. 2011). The land use modules relating to endogenous land supply are included to account for the indirect effects of the use of biomass, since in this paper only biomass from residues, waste and abandoned agricultural land are considered, see further Section 4.2.
Second, a module encompassing the activities of first generation biofuels and their interactions with agricultural sectors and capital-energy substitution or fossil fuel - biofuel substitution is also included (Banse et al. 2008; Banse et al. 2011).
Third, additional behavioural and accounting equations are included to explicitly characterise EU agricultural policy mechanisms (i.e. milk and sugar production quotas, single farm payment, pillar 2 payments).
On the consumption side, a dynamic CDE (Constant Difference of Elasticities) expenditure function was implemented that allows for changes in income elasticities when purchasing power parity (PPP)-corrected real GDP per capita changes. In the area of factor markets modelling, segmentation and imperfect mobility between agricultural and non-agricultural labour and capital was introduced accounting for diverging wages and returns to capital. More details about the MAGNET model can be found in Woltjer et al., (2014).
Lastly, for the purpose of this study, further modelling was carried out in MAGNET in order to take into account bio-based applications in EU. The bio-based modelling and data needs deserve a separate section which follows.
B i o m a s s m o d e l l i n g i n M A G N E T a n d c o s t d a t a
In order to analyse the macroeconomic effects of a bio-based in EU, four very diverse bio-bio-based applications are considered, and are further described in section 4.4:
1. Biofuels 2. Biochemicals 3. Bioelectricity 4. Biogas
All four bio-based applications use lignocellulose biomass as feedstock. Information on this biomass feedstock is taken from the Biomass Futures (BF) project; further details can be found in Section 4.2.
The following sections describe how these bio-based applications are modelled in MAGNET, and then their availability and production, pre-treatment, transport and conversion costs in the EU in 2030 are presented.
4.1 Modelling bio-based
sectors in MAGNET
Macroeconomic impacts are evaluated by introducing bio-based chains into MAGNET by means of a shift in the application from conventional application (i.e. fuel, chemicals, electricity and gas) to a bio-based application (i.e. biofuel, biochemicals, bioelectricity and biogas). This is necessary given that MAGNET does not currently represent these bio-based sectors individually, therefore, in order to model the bio-based applications and to make the results comparable with their counterpart conventional applications, it is assumed that part of the energy from the conventional sectors production is replaced by the bioenergy from the
biomass sector. More specifically, it is assumed that 1 EJ9
of biomass is used and it replaces 1 EJ of the conventional application while taking into account the conversion efficiencies and costs of converting biomass into bio-based
9 1 EJ (exajoule) = 1018 J (joule).
products. The data used to this end is taken from the Targets IMage Energy Regional simulation model (TIMER) energy model (De Vries et al. 2001). This approach ensures that the shift in technology is consistent with the cost data in the TIMER energy model and with the GTAP database tailored to MAGNET. This approach is similar to the one used in the macroeconomic impact assessment of a bio-based economy in Malaysia (Van Meijl et al. 2012).
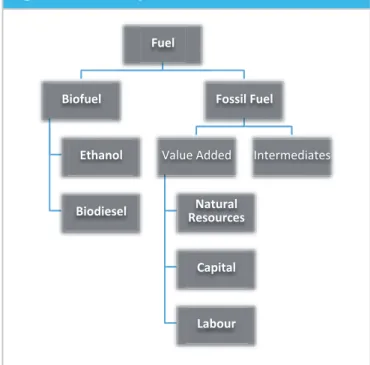
Further adjustments have been made in MAGNET for the
petroleum sector (i.e. fuel) (Figure 1). Given the flexibility
provided by MAGNET (e.g. flexible constant elasticity of substitution) to adapt the production structure of a sector to the needs at hand, in this study the production structure for the fuel sector is adapted to account for the first generation biofuels. To this end, at the top of the nest, fuel is produced by blending fossil fuels (with its intermediates inputs of production) and first generation biofuels (i.e. ethanol or biodiesel).
4 Biomass availability and
production costs.
E v a l u a t i n g t h e m a c r o e c o n o m i c i m p a c t s o f b i o - b a s e d a p p l i c a t i o n s i n t h e E U
18
4.2 Biomass availability and
production costs
Data on biomass availability and costs in the EU are taken
from the Biomass Futures (BF) project10 that was funded by
the EC. The BF project provides a comprehensive analysis of sustainable biomass availability and supply options up to 2030. This project first analyses the technical potential of different biomass feedstock types. Then, it translates these technical potentials into economic and environmentally sustainable potentials for the present and in 2030, potentials differ per biomass feedstock type (Elbersen et al. 2012). In total, the BF project distinguishes between 10 types of biomass feedstock which are aggregated into four for this study, these are:
1. Wastes (animal waste and verge grass), 2. Agricultural residues (straw and pruning),
3. Forestry residues (landscape care wood, primary, secondary and tertiary forest residues) and
4. Perennial crops (woody and grassy energy crops). The BF also includes round wood and additional harvestable round wood which are not considered here as they are too expensive to be economically viable (> 15 US$/GJ). Rotational crops are also not considered as the chosen bio-based applications require lignocellulosic biomass.
Therefore, only sustainable biomass sources are considered here, namely surplus residues (residues that are available but currently not used in the EU) and woody and grassy energy crops produced on surplus agricultural land in the EU (cropland and grassland that are expected to be abandoned according to economic outlook studies in the BF project’s reports).
10 http://www.biomassfutures.eu/
The final results are described in Table 2, where the cost and supply of biomass projections are included for the EU in 2030. The costs in the table are the average costs of supply of raw (i.e. untreated) biomass at the farm gate. The total average production costs of biomass in the EU in 2030 are 4.9 US$/GJ biomass.
The BF project only provides data on total costs (Elbersen
et al. 2012), but in this study disaggregated cost structures
are needed in order to include the bio-based applications in MAGNET. To this end, the cost structures of the four types of biomass feedstock considered are collected and described in Table 3.
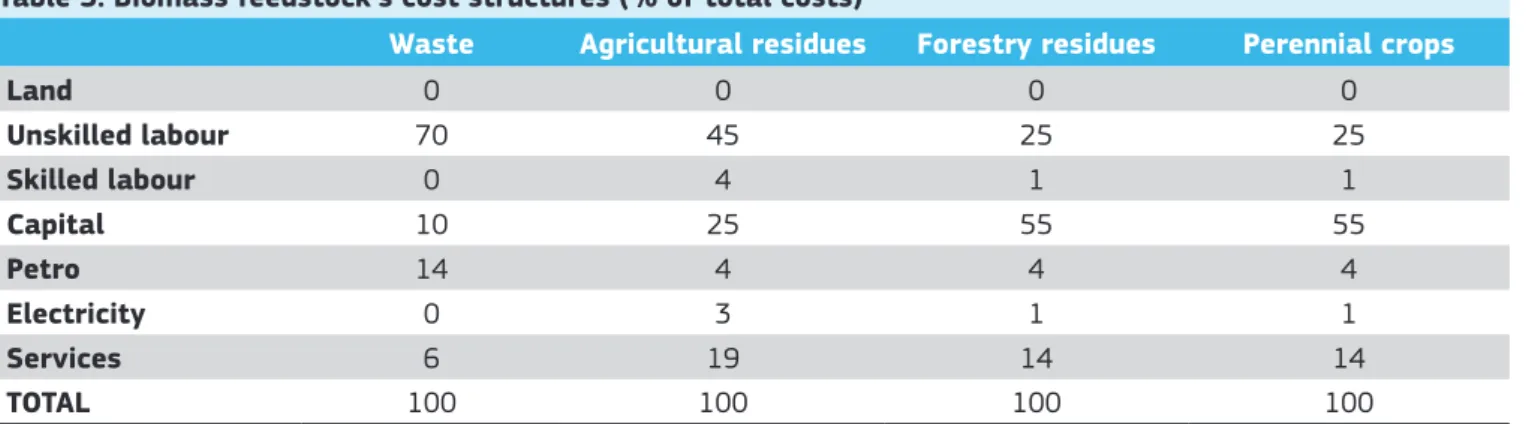
First, the cost structure of waste collection is based on data from a World Bank’ report (Cointreau 1994) in which capital, labour and operation & maintenance (O&M) costs account for 10%, 70% and 20% of the total collection costs respectively. Second, for agricultural residues, it is assumed that the same cost structure of the agricultural sector in the GTAP database applies. Last, for forestry residues and perennial crops it is assumed the forestry sector’s cost structure is as in the GTAP database. Note that the Services sector is not the same as the Services sector in the GTAP database, but rather it is an aggregated sector that includes 13 sectors in the GTAP database (e.g. air transport, communications, business and financial services, recreation and other services).
Table 2: Biomass availability and production costs in 2030
Sustainable
supply Average costs
Biomass considered EJ $/GJ
Wastes 0.2 3.5
Agricultural residues 2.4 4.5
Forestry residues 3.6 5.3
Perennial crops 1.5 0.0
Total supply / average
costs 7.6 4.9
Source: Own elaboration based on the Biomass Futures’ project
Table 3: Biomass feedstock’s cost structures (% of total costs)
Waste Agricultural residues Forestry residues Perennial crops
Land 0 0 0 0 Unskilled labour 70 45 25 25 Skilled labour 0 4 1 1 Capital 10 25 55 55 Petro 14 4 4 4 Electricity 0 3 1 1 Services 6 19 14 14 TOTAL 100 100 100 100
B i o m a s s m o d e l l i n g i n M A G N E T a n d c o s t d a t a
4.3 Biomass pre-treatment and
transport costs
Data about the costs of transportation and pre-treatment of biomass were taken from the literature (Hoefnagels et
al. 2011; C2ES 2013) and added to the costs of biomass
supply, see Table 4. It is assumed that regardless of the biomass application, every type of biomass needs to be
pelletized11 to reduce the costs of transport and storage.
Estimates of the costs of pelletizing biomass found in the literature vary widely due to differences in scale and in costs
11 Pelletizing is the process of compressing a material into the
shape of a pellet.
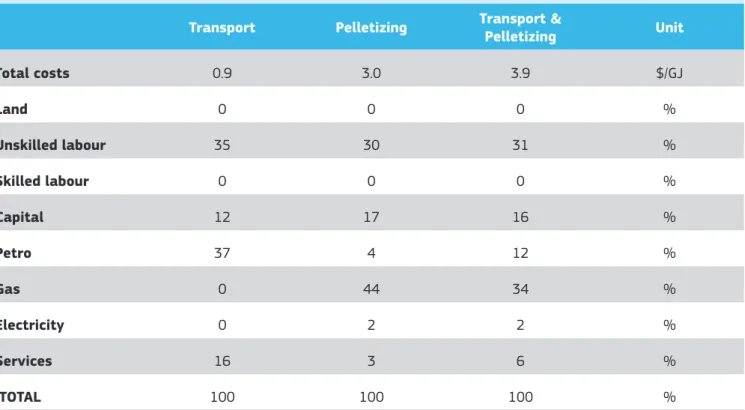
of drying (i.e. the fuel type and fuel price). In this study the costs of pelletizing are estimated to be 3.0 $/GJ in 2030. The average costs of transporting the biomass from pre-treatment facilities to end users are set at 0.9 $/GJ biomass (Hoefnagels et al. 2011) and subdivided into capital, fuel, labour and services (C2ES 2013).
The costs of transport and pre-treatment increase the costs of biomass from 4.9 $/GJ to 8.8 US$/GJ. The total costs of biomass is in the same order of magnitude as values from other sources such as the TIMER and GREEN-X energy models (Hoefnagels et al. 2011), although the ranges are large. Table 4: Biomass transport and pelletizing cost structures (in $/GJ and % of total costs)
Transport Pelletizing Transport & Pelletizing Unit
Total costs 0.9 3.0 3.9 $/GJ Land 0 0 0 % Unskilled labour 35 30 31 % Skilled labour 0 0 0 % Capital 12 17 16 % Petro 37 4 12 % Gas 0 44 34 % Electricity 0 2 2 % Services 16 3 6 % TOTAL 100 100 100 %
E v a l u a t i n g t h e m a c r o e c o n o m i c i m p a c t s o f b i o - b a s e d a p p l i c a t i o n s i n t h e E U
20
4.4 Conversion efficiency and
costs
The costs of converting biomass into biofuels, biochemicals, bioelectricity and biogas as well as the cost of conventional (fossil) systems are taken from the TIMER model (Stehfest
et al. 2014) and from other sources when TIMER data were
not available as further explained below for each biomass sector. TIMER is a cost optimisation model of the energy sector. TIMER determines the demand for energy services with population and income as primary drivers and the mix of final energy carriers and the technologies to produce them chosen on the basis of their relative costs. Key processes that determine these costs include technology development and resource depletion, and also preferences, fuel trade assumptions and policies. The model output demonstrates how energy intensity, fuel costs and competing non-fossil supply technologies, such as bioenergy, develop over time. The TIMER data and any other data used are translated into cost structures that are consistent with the classification of
sectors in the GTAP 8 database12 as shown in Table 5. The
cost structures assumed in this project are shown in Table 5. In MAGNET, the production of fuel and other petroleum products is included in the petro sector, which in this study is referred to as the fuel sector.
Fuels
The costs and conversion efficiency of producing second generation biofuels are based on TIMER data for biomass gasification and subsequent methanol production. According to the TIMER model this is the most promising technology for the production of second generation biofuels. According to TIMER projections this technology will be used primarily in the year 2030. For the costs of conventional fuel production (gasoline and diesel from fossil oil) the data used is from (Palou-Rivera and Wang 2010; Energy Almanac 2013). Note that in MAGNET/GTAP fuels are produced in the petro sector. Chemicals
In the TIMER model various technologies to produce chemicals are considered. In this study we consider the replacement of high value chemicals that are made from conventional oil. TIMER includes data about the costs and conversion efficiency of both oil- and bio-based high value chemicals.
Electricity
In this study we assume that the production of bioelectricity replaces electricity from coal and gas only, and not the production of other electricity systems. Coal and gas account
12 For a detail description of the GTAP sectors see (GTAP 2013). Also a description of the GTAP 8 Data Base is accessible online at: https://www.gtap.agecon.purdue.edu/ databases/v8/v8_sectors.asp.
for 51% of the electricity consumed in the EU in 2007. In the case of coal, two technologies are considered, namely steam electric power generation and gasification and combined cycle, while for gas only combined cycle technology is assumed. For bioelectricity we assume combined cycle power generation technology. All data about on conversion efficiency and costs are based on TIMER.
Gas
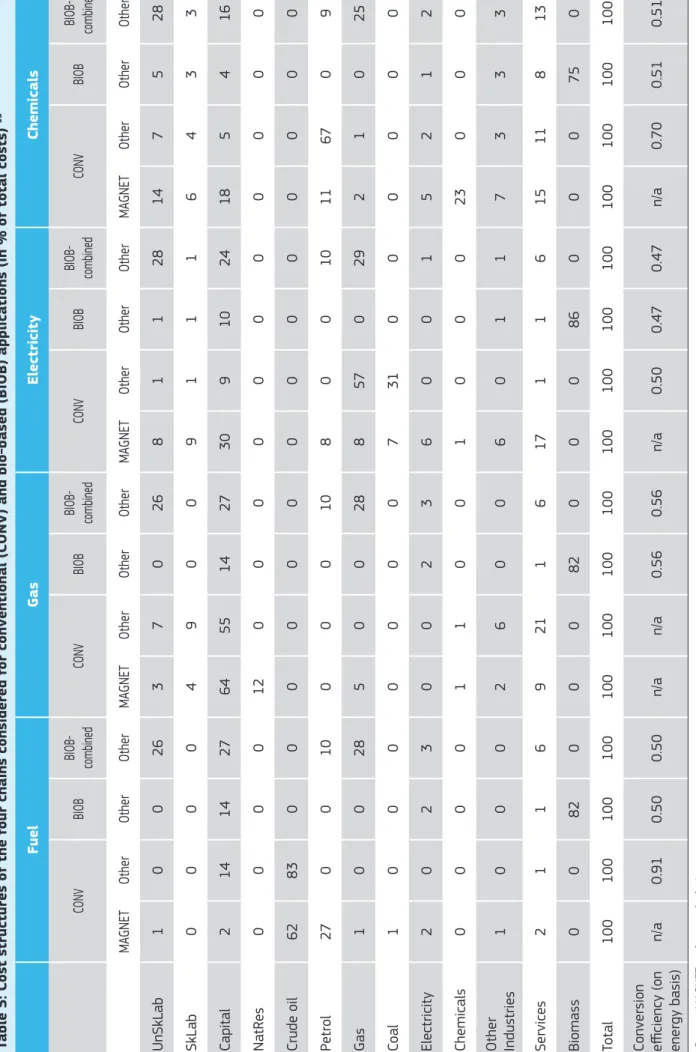
Data about the production costs and efficiency of synthetic natural gas (SNG) from biomass were not available from the TIMER model. However, the technology used for SNG production is similar to the technology of methanol production, except that efficiency is 10% higher compared to the production of methanol (Van der Meijden et al. 2010; Van der Drift 2011). Therefore, TIMER data about the production of methanol were used and adjusted for the 10% difference in conversion efficiency. Data about the production costs and cost structure of gas were derived from the price of gas according to the IEA (2011) and data about the cost structure of gas production is from the MAGNET model. In Table 5, the columns named ‘CONV’ and ‘MAGNET’ show the cost structure of conventional (i.e. fossil feedstock (oil, gas, coal) based) chains as found in the GTAP database in MAGNET. The columns with headings ‘CONV’ and ‘Other sources’ show the cost structure of conventional chains based on data from the TIMER model and other sources. Differences between the cost structures of conventional chains from the MAGNET model and from the TIMER model and other sources are partially the result of differences in classification and scope. The cost structures in MAGNET are representative for an entire sector, i.e. cost structures are based on the costs of the conventional production of fuels, gas, electricity and chemicals plus various associated activities, such as administration, marketing, storage, transport, research & development, etc.
The cost structures from the TIMER model and from the literature only include the costs of the production of fuels, gas, electricity and chemicals but do not include the other economic activities associated with these sectors (e.g. marketing, research and development). This means that the production value of the sectors that produce fuel, gas, electricity and chemicals is higher than the production value calculated based on the production level and cost structures from the TIMER model and other sources. The production of fuel, electricity and chemicals accounts for 39%, 13% and 16% of the total turnover in these sectors as projected by MAGNET. The production value of the gas sector is lower compared to what one would expect based on the costs of gas production and amount of gas produced. This is potentially the result of fact that gas production is partly in the gas sector (that includes production) as well as in the crude oil sector (which includes exploration).
The columns named ‘BIOB‘ show the cost structure of bio-based applications, whereby the contribution of biomass
I n t r o d u c t i o n
is shown as a separate sector. The columns named ‘BIOB-combined’ show the combined cost structure of biomass conversion (‘BIOB’) and biomass supply that are given in the previous sections. The sector ‘Biomass’, which is used in the BIOB cost structures, is not a separate sector in MAGNET, but rather refers to the use of biomass for the production of bio-based applications.
Note that a shift from conventional to bio-based is assumed not to affect the use of natural resources. The reason is that
since natural resources are scarce resources, a change in their use may have large and unrealistic effects on their price and thereby distort the macroeconomic impacts. This approach is consistent with the cost structures in the TIMER model and other sources that are used in this report, none of which consider costs related to natural resources. However, we acknowledge that this aspect deserves further attention, especially in the case of gas, since gas is a sector that uses natural resources. The other conventional sectors do not use natural resources directly.
E v a l u a t i n g t h e m a c r o e c o n o m i c i m p a c t s o f b i o - b a s e d a p p l i c a t i o n s i n t h e E U
22
Table 5: Cost structures of the f
our chains considered f
or conventional (CONV) and bio-based (BIOB) applications (In % of total costs)
13 Fuel Gas Electricity Chemicals CONV BIOB BIOB- combined CONV BIOB BIOB- combined CONV BIOB BIOB- combined CONV BIOB BIOB- combined MA GNET Other Other Other MA GNET Other Other Other MA GNET Other Other Other MA GNET Other Other Other UnSkLab 1 0 0 26 3 7 0 26 8 1 1 28 14 7 5 28 SkLab 0 0 0 0 4 9 0 0 9 1 1 1 6 4 3 3 Capital 2 14 14 27 64 55 14 27 30 9 10 24 18 5 4 16 NatRes 0 0 0 0 12 0 0 0 0 0 0 0 0 0 0 0 Crude oil 62 83 0 0 0 0 0 0 0 0 0 0 0 0 0 0 Petrol 27 0 0 10 0 0 0 10 8 0 0 10 11 67 0 9 Gas 1 0 0 28 5 0 0 28 8 57 0 29 2 1 0 25 Coal 1 0 0 0 0 0 0 0 7 31 0 0 0 0 0 0 Electricity 2 0 2 3 0 0 2 3 6 0 0 1 5 2 1 2 Chemicals 0 0 0 0 1 1 0 0 1 0 0 0 23 0 0 0 Other Industries 1 0 0 0 2 6 0 0 6 0 1 1 7 3 3 3 Services 2 1 1 6 9 21 1 6 17 1 1 6 15 11 8 13 Biomass 0 0 82 0 0 0 82 0 0 0 86 0 0 0 75 0 Total 100 100 100 100 100 100 100 100 100 100 100 100 100 100 100 100
Conversion efficiency (on energy basis)
n/a 0.91 0.50 0.50 n/a n/a 0.56 0.56 n/a 0.50 0.47 0.47 n/a 0.70 0.51 0.51 Source: MA GNET and o wn calculations 13 T
able 5: CONV = conventional technology and BIOB = bio-based, UnSkLab = unskilled l
abour; SkLab = skilled labour
, Nat Res = natural resources, petro = petrochemical industry (also ref
B a s e l i n e a n d S c e n a r i o s
5.1 Baseline scenario
One of the crucial aspects of any policy analysis, both at micro- as well as at macro-levels, is an appropriate model of the baseline. In this case, as MAGNET is a dynamic model, it allows us to develop a baseline scenario up to 2030 without explicitly considering an increase in the use of biomass for energy or chemicals but including current relevant policies. In MAGNET, similar to other recursive dynamic CGE models, important key macroeconomic variables are modelled
exogenously14, i.e. GDP projections and population growth. In
this study the macroeconomic and population projections of the USDA are used (USDA 2013).
Furthermore, as mentioned in Section 2, the model is shocked so that the world prices of fossil fuel, gas and coal are assumed to follow the levels projected by the International Energy Agency (IEA 2011). At the European level, three policies are taken into account, the first two relate to the CAP policy, first is a change in the sugar CAP white sugar policy
where EU is expected to lower its support on prices by 36%15.
Second, the elimination of milk quotas, and last a target budget for first generation biofuels is fixed as the projection of the price of oil is quite high, it is expected that EU will reduce their biofuels subsidies as currently is the case.
5.2 Bio-based scenarios
Comparing with a contemporary baseline (that is without bio-based applications (e.g. second generation biofuels or biochemical) a comparative static scenario assessments are carried out to evaluate the impact of the adaptation of bio-based applications in Europe in 2030.
14 In order to obtain policy results, which include GDP as one of the model’s endogenous variables, two further steps were needed. First, projections of GDP growth were translated into the growth of technological progress (the latter was endogenously calculated by the model). Second, given calculated rates of technological progress from the first step (now considered exogenous) the values for GDP growth were endogenously generated by the model separately for the baseline and policy scenarios. 15 For further details see: http://europa.eu/rapid/press-release_IP-05-1473_ en.htm?locale=en
1. Only biofuels 2. Only biochemicals 3. Only bioelectricity 4. Only biogas
In all cases a fixed amount of biomass (e.g. 1 EJ) will be considered to evaluate the relative macroeconomic effects of the different chains. We will assume that all bio-based products replace domestic production of conventional products. To make the results comparable, it is assumed that 1 EJ lignocellulose biomass is converted into fuel, electricity, gas or chemicals. We assume that the final product (i.e. fuel, electricity, gas or chemicals) that is produced from 1EJ biomass input replaces an equal amount of conventional production (e.g. fossil fuel in the case of biofuels) on energy basis. It is expected that the net macroeconomic effects will vary due to differences in cost structures (amount of labour, capital and other costs), conversion efficiency and price of conventional chains and price of biomass.
The sensitivity of the mechanisms that determine the macroeconomic and sector economic effects will be tested for the price of oil. Testing the sensitivity of the results for a 25% higher oil price and a 25% lower oil price (experiment 2 only, as this is the only economically attractive chain with a large potential based on the assumed cost structures). The oil price can be expected to have an impact on the profitability and macroeconomic impacts.
R e s u l t s
In this section the impacts of the six comparative static bio-based economy scenarios are investigated by comparing their effects with the baseline scenario.
6.1 Conventional vs bio-based
production costs
A key determinant of the macroeconomic impacts of bio-based systems in the EU is the difference in production costs between conventional and bio-based applications. The production costs of conventional and bio-based chains in 2030 are shown in Table 6, assuming a biomass price of 8.8 $/GJ (including transport and pre-treatment) and assuming the increases in conventional energy prices as projected by the IEA (IEA 2011) (see Table 1).
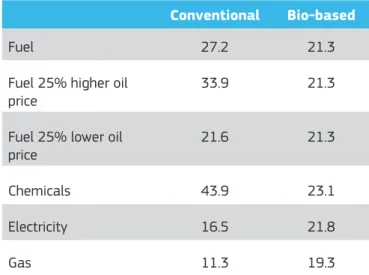
Table 6: The production costs of conventional and bio-based fuel, chemical, electricity and gas ($/GJ).
Conventional Bio-based
Fuel 27.2 21.3
Fuel 25% higher oil
price 33.9 21.3
Fuel 25% lower oil
price 21.6 21.3
Chemicals 43.9 23.1
Electricity 16.5 21.8
Gas 11.3 19.3
Source: Own calculations.
Looking at Table 6, one can conclude that the production of second generation biofuels and biochemicals is competitive compared to the production of fuels and chemicals from oil. The production of conventional fuel depends to a large extent on the oil price, which accounts for approximately 80% of the production cost (Table 5). Another important factor is that the costs of biomass are relatively constant to 2030. However, the results show that even if a 25% lower oil price in 2030 is assumed, the production costs of second generation biofuels are lower than the costs of conventional
fuel production (ceteris paribus). The production of biogas and bioelectricity is uncompetitive at the assumed biomass prices, conversion efficiencies and costs and price of natural gas and coal in 2030.
6.2 Total production value and
total GDP effect
In this section we evaluate the impact of the use of 1 EJ biomass per bio-based application on the production value for the four sectors (i.e. fuel, chemicals, electricity and gas) and on EU’s GDP. This is done in two different ways to illustrate the importance of the indirect economic effects which can only be captured by a CGE model, which takes into account economy-wide inter-linkages.
First, the expected change in production value is calculated based on the conversion efficiency and costs of bio-based
and conventional applications16. This is done assuming that
1 EJ lignocellulose biomass is converted into fuel, electricity, gas or chemicals. It is also assumed that the final product (i.e. fuel, electricity, gas or chemicals) that is produced from 1 EJ biomass input replaces an equal amount of conventional production (e.g. fossil fuel in the case of biofuels) on energy basis. In MAGNET, the cost structure of the fuel, chemicals, electricity and gas sectors is split into a part that is (partially) replaced by the bio-based chain (i.e. the conventional chain) and a part that is not affected by the bio-based chain (i.e. all economic activities that are not related to the conventional production of energy and chemicals and that are not (directly) affected by the introduction of bio-based applications). This approach ensures that the shift in applications is consistent with the cost data in the TIMER energy model and with the GTAP database used in MAGNET.
Table 7 shows the increase in value of production of bio-based products per sector (bio-based on 1 EJ biomass input) and the decrease of production value of conventional fuel, chemicals, electricity and gas and the net change value. Then, the macroeconomic impact is calculated in two different ways; first the net change of value of production
16 The production value is in this report the same as production costs, as neoclassical assumptions are taken with zero profits.
E v a l u a t i n g t h e m a c r o e c o n o m i c i m p a c t s o f b i o - b a s e d a p p l i c a t i o n s i n t h e E U
26
(third column in Table 7) is used as a proxy for the direct macroeconomic effect. The results (Table 7) show that the costs of collecting, transporting and converting 1 EJ of biomass into biofuel, biogas, bioelectricity and biochemicals are in the same order of magnitude, ranging from 10.2 to 11.8 billion US$ (first column in Table 7).
More important are the differences in the costs of producing an equal volume (on energy basis) of the conventional counterpart, which differs between 6.2 billion US$ for gas to 22.4 billion US$ for chemicals (second column in Table 7). The difference in the value of production is the shock introduced in MAGNET which can be considered to be a proxy for a direct production value effect (third column, Table 7). The results also show that the value of conventional fuel production depends mainly on the price of oil.
Table 7: The impact of biomass applications on the production value and GDP in the EU (billion US$). Cost calculations
(spreadsheet) CGE model calculations (MAGNET)
Change of value of bio-based production Change of value of conventional production Net change of value of production Net GDP effect MAGNET Multiplier Effect 1 Fuel 10.7 -13.7 3.0 5.1 1.7 2 Chemicals 11.8 -22.4 10.6 6.0 0.6 3 Electricity 10.2 -7.7 -2.5 -3.0 1.2 4 Gas 10.7 -6.2 -4.5 -5.1 1.1
5 Fuel 25% higher oil price 10.7 -16.6 5.9 11.0 1.9
6 Fuel 25% lower oil price 10.7 -10.9 0.2 0.6 2.9
R e s u l t s
Second, the total net change in production value of the four shocks is evaluated using results from MAGNET after implementing the ‘1 EJ shocks’ (fourth column, Table 7). These show how the production value of the sectors has changed in response to the shocks. The results are then compared with the results as derived with the first method mentioned above. The difference between the two methods is the result of the many indirect effects on factor prices and intermediate inputs, and on consumption, production, trade to name a few. These indirect effects can be summarized as the ‘multiplier effect’ (fifth column, Table 7), which is defined as the ratio between the net GDP impact calculated by MAGNET and the net GDP effect calculated based on production value data (i.e. the costs of production).
The results show that the macroeconomic income effect, calculated from the change in production value (first method), varies between -4.5 billion US$ for biogas to 10.6 billion US$ for biochemicals. However, MAGNET predicts for biogas
a net GDP effect of -5.1 billion US$. The multiplier effect for biogas application is thus -5.1/-4.1 or 1.1. The lowest multiplier effect was found to be for biochemicals (0.6). These results show that the macroeconomic effects depend not only on the difference in bio-based application, but also on indirect effects. In the following sections, the differences in multiplier effects between bio-based applications are analysed in more detail by investigating some of the most important macroeconomic variables.
6.3 Prices
One of the first effects of introducing bio-based applications is that production costs change and as a result output prices also change for fuel, chemicals, electricity and gas sectors
(see Table 8). 17
17 Each column shows the change in prices for each sector of the economy (in the row) when biomass is used only on the scenario specified (i.e. scenario1: biomass is used on the production of 2nd gen. biofuels only).
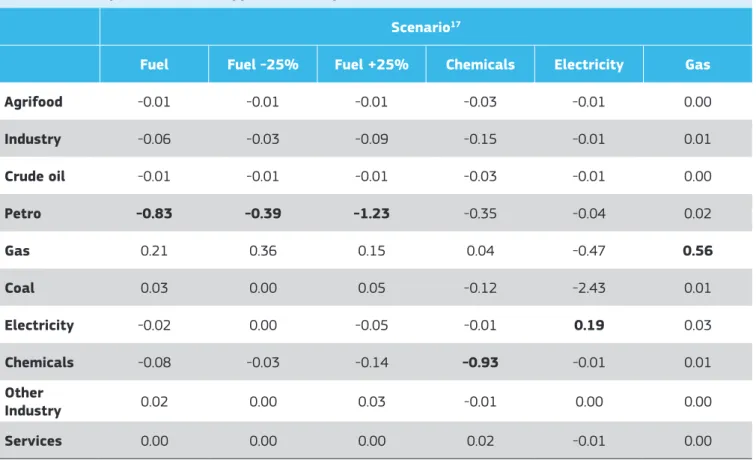
Table 8: The impact of biomass applications on prices (%).
Scenario17
Fuel Fuel -25% Fuel +25% Chemicals Electricity Gas
Agrifood -0.01 -0.01 -0.01 -0.03 -0.01 0.00 Industry -0.06 -0.03 -0.09 -0.15 -0.01 0.01 Crude oil -0.01 -0.01 -0.01 -0.03 -0.01 0.00 Petro -0.83 -0.39 -1.23 -0.35 -0.04 0.02 Gas 0.21 0.36 0.15 0.04 -0.47 0.56 Coal 0.03 0.00 0.05 -0.12 -2.43 0.01 Electricity -0.02 0.00 -0.05 -0.01 0.19 0.03 Chemicals -0.08 -0.03 -0.14 -0.93 -0.01 0.01 Other Industry 0.02 0.00 0.03 -0.01 0.00 0.00 Services 0.00 0.00 0.00 0.02 -0.01 0.00
E v a l u a t i n g t h e m a c r o e c o n o m i c i m p a c t s o f b i o - b a s e d a p p l i c a t i o n s i n t h e E U
28
As we have seen in section 6.2 the production of biofuel and biochemicals is competitive with conventional production systems. In the first scenario, in which only second generation biofuels are introduced, the largest impact is as expected on the price of the petro sector where price drops by 0.83%, this is when the oil price is 20.5 US$/GJ (first column, Table 8). This effect is smaller in the case of a lower oil price (15 US$/ GJ, second column, Table 8) and larger in the case of a higher oil price (26 US$/GJ, third column Table 8) namely -0.39% and -1.23%, respectively. In the second scenario, where only biochemicals are produced using biomass, recall that it was shown that biochemical were found to be competitive when compared to conventional production and given the initial assumptions, as a result the price of chemicals decreases by 0.93%. Bioelectricity and especially biogas (third and fourth scenarios respectively) are much more expensive compared to conventional electricity and gas production, which is also visible in the results on Table 8 where their prices are higher. The price of gas increases by 0.56% and the price of electricity by 0.19%.
Changes in prices in the fuel, chemicals, electricity, and gas sectors also affect prices in other sectors. For example, the use of biomass in the fuel sector not only affects the petro sector (where second generation biofuels are blended in) but also affects the prices of agrifood sectors (by -0.01%) or chemicals (by -0.08%), probably because the petro sector is important as an intermediate input for the chemicals or even increasing the price of gas sector (by 0.21%).
Other causal correlations are relevant when explaining the price effects, as CGE effects take place, demand for factors of production change in various sectors and therefore factor prices are also affected. For example, wages change due to the changes in employment from the introduction of bio-based applications (Table 9). This in turn, affects the wages and employment in other sectors. These changes also (partially) explain price effects and multiplier effects, as further discussed in the following sections.
6.4 Employment
The introduction of bio-based applications changes the use
of labour and capital18 in the economy. This partially explains
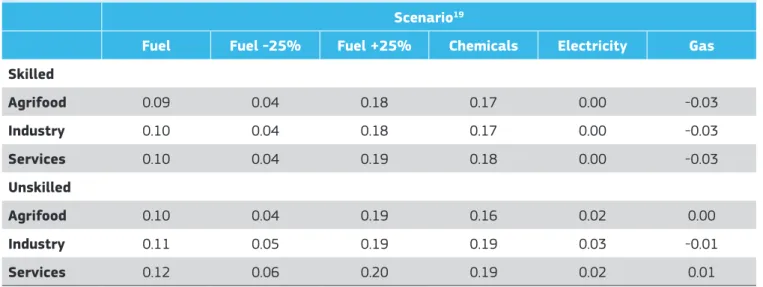
the “multiplier effects” seen in section 6.2. Especially important is the production of biomass, which is a relatively labour intensive activity. In total 26% to 28% of the costs of producing, transporting and converting biomass are labour costs and almost all labour is used for the production and pre-treatment of the biomass (see Table 3 to Table 5). Based on these assumptions, a shift from conventional to bio-based production increases the use of labour.
The increased demand for labour in sectors using bio-based applications, results in an increase in of the cost of labour (i.e. wages) so the rest of the sectors in the economy decrease their employment of labour, assuming that the supply of labour is fixed and there is full employment (Table 9).
18 The impact on capital use is not analysed as the effects are almost negligible. 19 Each column shows the change in wages for each sector of the economy (in the row) when biomass is used only as in the scenario specified (i.e. scenario1: biomass is used on the production of second generation biofuels only).
Table 9: The impact of biomass applications on wages (%).
Scenario19
Fuel Fuel -25% Fuel +25% Chemicals Electricity Gas
Skilled Agrifood 0.09 0.04 0.18 0.17 0.00 -0.03 Industry 0.10 0.04 0.18 0.17 0.00 -0.03 Services 0.10 0.04 0.19 0.18 0.00 -0.03 Unskilled Agrifood 0.10 0.04 0.19 0.16 0.02 0.00 Industry 0.11 0.05 0.19 0.19 0.03 -0.01 Services 0.12 0.06 0.20 0.19 0.02 0.01