HERDING BEHAVIOUR IN TEAM AND
INDIVIDUAL INVESTMENT DECISIONS:
EXPERIMENTAL EVIDENCE
Word count: 24645
Guillaume Bocksruth and Janouck Keppens Student number: 01304083 and 01505659
Supervisor: Prof. Dr. Koen Inghelbrecht
A dissertation submitted to Ghent University in partial fulfilment of the requirements for the degree of Master of:
Business Administration: Finance and Risk management
CONFIDENTIALITY AGREEMENT
PERMISSIONOndergetekende verklaart dat de inhoud van deze masterproef mag geraadpleegd en/of gereproduceerd worden, mits bronvermelding.
I declare that the content of this Master’s Dissertation may be consulted and/or reproduced, provided that the source is referenced.
Naam student/ name student: Guillaume Bocksruth and Janouck Keppens
Handtekening/ signature:
Guillaume Bocksruth
PREAMBLE COVID-19 MEASURES
The current COVID-19 pandemic has had an impact on the original design and progress of this master’s dissertation.
Originally, each participant was supposed to be physically approached on the campus of the Faculty of Economics and Business Administration of Ghent University and on the campus ‘Mercator’ of Hogent. Respondents who were willing to participate in this experiment received the trading platform as an Excel file and completed it (as an individual or as a team). After completing the trading platform, the trading platform was submitted to janouck.keppens@ugent.be or guillaume.bocksruth@ugent.be. Originally, no other distribution channels were chosen.
However, after the various measures taken by the Belgian government, Ghent University and Hogent to prevent the spread of the COVID-19 virus, respondents could no longer be psychically approached. In response to these measures, we have chosen to distribute the trading platform online from the beginning of March until the end of April. Again, the completed trading platforms were sent to janouck.keppens@ugent.be or guillaume.bocksruth@ugent.be. The trading platform was distributed via the online course ‘Onderzoeksmethoden in Finance’ on the online UGent platform ‘Ufora’ and the following Facebook groups.
- Eerste bachelor handelswetenschappen 2019-2020 - Tweede bachelor handelswetenschappen 2019-2020 - Derde bachelor handelswetenschappen 2019-2020
- Master handelswetenschappen: Finance and risk 2019-2020 - Master handelswetenschappen: Fiscaliteit 2019-2020
- Master handelswetenschappen: Management en informatica 2019-2020
- Master handelswetenschappen: Personeels- en organisatiemanagement 2019-2020 - Master handelswetenschappen: Commercieel beleid 2019-2020
This preamble is drawn up in consultation between the student and the supervisor and is approved by both.
NEDERLANDSTALIGE SAMENVATTING
Indien een individu een beslissing moet nemen wordt dit individu vaak beïnvloed door het gedrag van andere individuen. Zo zal een individu sneller een restaurant kiezen dat bijna volledig volzet is in vergelijking met een restaurant dat leeg is. Er wordt algemeen aangenomen dat investeerders in de financiële markt handelen op basis van de acties van andere investeerders. Dit gedrag staat gekend als kuddegedrag en kan verschillende gevolgen hebben op de financiële markten.
Een ander aspect van deze masterproef heeft betrekking tot het handelen in team versus het handelen als individu. In veel situaties in het echte leven worden belangrijke beslissingen genomen door een groep zoals de Raad van Bestuur en een commissie in plaats van door één individu. Ondanks het feit dat veel beslissingen collectief worden genomen, heeft de finance slechts weinig aandacht aan besluitvorming in team. De reeds bestaande literatuur focust zich louter op de verschillen tussen individuele en team investeringsbeslissingen met betrekking tot risiconemend gedrag, de prestaties en gedragsvooroordelen.
Het onderzoeksopzet van deze masterthesis bestaat erin deze hiaat in de literatuur aan te vullen en empirisch het niveau van kuddegedrag van individuen en teams in investeringsbeslissingen te analyseren. Om het kuddegedrag van individuen en teams in investeringsbeslissingen te analyseren, werd een zelfontwikkeld handelsplatform ontwikkeld in Excel waarbij iedere respondent (individu of team) tien jaar lang een beleggingsportefeuille moest opbouwen en beheren met als doel een maximum rendement te behalen. Jaarlijks werd ook een robot-advies gegeneerd om participanten te helpen bij het maken van hun beslissingen met betrekking tot het aan- en verkopen van effecten. Het onderzoek liep van januari 2020 tot en met april 2020 en uiteindelijk namen 64 individuen en 10 teams deel aan het experiment.
Wij vinden met dit experiment dat zowel individuen als teams kuddegedrag vertonen waarbij teams duidelijk een hoger niveau van kuddegedrag vertonen. Echter vertonen teams alleen maar meer kuddegedrag op advies dat slaat op aandelen en niet op obligaties ten opzichte van individuen. Verder, wordt er nog geconcludeerd dat individuele vrouwen een hogere kans tot handelen hebben ten opzichte van individuele mannen. Wat ook blijkt uit dit experiment is dat jongere individuen (oudere teams) een hogere kans hebben om te (des)investeren in vergelijking met oudere individuen (jongere teams). Tot slot heeft de tijdsperiode wanneer het advies gegeven wordt een grote invloed op de handelingen die een participant voert ondanks het feit dat er aankoop- of verkoopadvies gegeven wordt. Zo is er een beduidend lagere kans dat participanten aankopen en een beduidend hogere kans dat ze verkopen naar het einde van experiment toe ondanks het gegeneerd robot-advies.
PREFACE
This master’s dissertation is submitted for the degree of Business Administration with a major in Finance and Risk Management at Ghent University. Writing this thesis allowed us to think critically, to improve our research skills and to obtain more knowledge about the topic. Several people played a decisive role in making this thesis possible and therefore we would like to thank them.
Firstly, we would like to express our deepest appreciation to prof. Mr. Inghelbrecht for giving us the chance to explore this topic in more depth. We would also like to extend our deepest gratitude to Mr. Dierick for his guidance, knowledge and remarks.
Furthermore, thanks should also go to all the participants that took part in our experiment and enabled this research to be possible.
Finally, the completion of our dissertation would not have been possible without the support, love and encouragement of our family and friends. We are especially grateful to our parents for the emotional and financial support.
Guillaume Bocksruth and Janouck Keppens August 2020
TABLE OF CONTENTS
NEDERLANDSTALIGE SAMENVATTING ... I PREFACE ... II LIST OF ABBREVIATIONS ... V LIST OF FIGURES AND TABLES ... VI
INTRODUCTION ... 1
LITERATURE REVIEW ... 3
2.1. Definition and types of herding behaviour ... 3
2.1.1. Definition herding behaviour ... 3
2.1.2. Intentional herding behaviour and spurious herding behaviour ... 4
2.1.3. Irrational, not fully rational and rational herding behaviour ... 5
2.2. Causes of rational herding behaviour ... 7
2.2.1. Information-based herding behaviour ... 8
2.2.2. Reputation-based herding behaviour ... 11
2.2.3. Compensation-based herding behaviour ... 13
2.3. Measures of herding behaviour ... 16
2.3.1. Measures of institutional herding behaviour ... 17
2.3.1.1. Measure of Lakonishok, Shleifer, and Vishny (1992) ... 17
2.3.1.2. Measure of Wermers (1999) ... 18
2.3.1.3. Measure of Sias (2004) ... 19
2.3.2. Measures of market-wide herding behaviour ... 20
2.3.2.1. Measure of Christie and Huang (1995) ... 20
2.3.2.2. Measure of Chang, Cheng, and Khorana (2000) ... 22
2.4. Previous empirical research on herding behaviour ... 23
2.4.1. Herding behaviour by individual versus institutional investors ... 23
2.4.2. Herding behaviour according to companies’ market capitalization/size ... 24
2.4.3. Herding behaviour according to funds’ investment objectives ... 25
2.4.4. Herding behaviour in emerging versus developed markets ... 25
2.4.5. Herding behaviour during extreme market conditions ... 25
2.4.6. Asymmetric herding behaviour ... 26
2.5. Consequences of herding behaviour in financial markets ... 26
2.6. Individual versus team decision-making ... 28
RESEARCH QUESTION AND HYPOTHESES ... 30
3.1. Research question and sub-questions ... 30
DATA AND DESCRIPTIVE STATISTICS ... 32 4.1. Data ... 32 4.2. Trading platform ... 32 4.2.1. Pricing of assets ... 33 4.2.2. Current portfolio ... 37 4.2.3. Investment advice ... 38
4.2.4. Buy and sell decisions ... 39
4.2.5. Portfolio after buy and sales decisions ... 41
4.2.6. Value total portfolio ... 41
4.2.7. Macro’s ... 41
4.3. Descriptive statistics ... 42
METHODOLOGY ... 49
5.1.1. Linear probability model ... 49
5.1.2. Logit model ... 52 5.1.3. Probit model ... 54 5.1.4. Preferred model ... 55 5.1.5. Data transformation ... 55 RESULTS ... 57 6.1. Bivariate analyses ... 57 6.2. Multivariate analysis ... 60
6.2.1. Linear probability model ... 60
6.2.2. Logit model ... 67
CONCLUSION – LIMITATIONS AND SUGGESTIONS ... 73
7.1. Conclusion ... 73
7.2. Limitations ... 74
7.3. Directions for future research ... 75 REFERENCES ... VII APPENDICES ... XI
9.1. Screenshot introduction ... XI
9.2. Screenshot instructions ... XII
9.3. Screenshot VBA code hiding worksheets ... XIII
9.4. Screenshot VBA code locking in the current year – year 1 ... XIII
9.5. Screenshot VBA code locking in the current year – year 2 ... XIV
9.6. Results multivariate regressions – probit model – buy-side (%) ... XV
LIST OF ABBREVIATIONS
EMH Efficient Market Hypothesis
SEU Subjective Expected Utility
BHW Bikhchandani, Hirshleifer, and Welch (1992)
U.S. United States
LSV Lakonishok, Shleifer, and Vishny (1992)
CH Christie and Huang (1995)
CSSD Cross-Sectional Standard Deviation CAPM Capital Asset Pricing Model
CCK Chang, Cheng, and Khorana (2000)
CSAD Cross-Sectional Absolute Deviation CLRM Classical Linear Regression Model
OLS Ordinary Least Squares
LIST OF FIGURES AND TABLES
List of figures
Figure 1. Division of herding behaviour (Bikhchandani & Sharma, 2001) ... 4
Figure 2. Herding behaviour among U.S. mutual funds per security type (International Monetary Fund, 2015) ... 15
Figure 3. Herding behaviour among U.S. mutual funds by fund type (International Monetary Fund, 2015) ... 15
Figure 4. Trading platform: formula used in excel to stimulate random stock prices ... 35
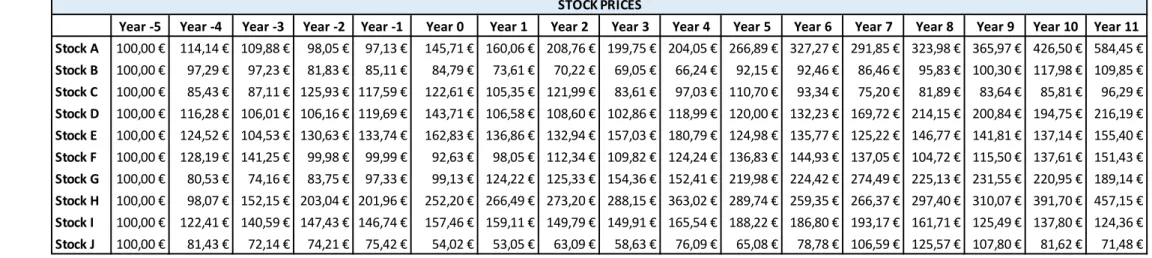
Figure 5. Trading platform: stock prices ... 36
Figure 6. Trading platform: zero-coupon bond ... 36
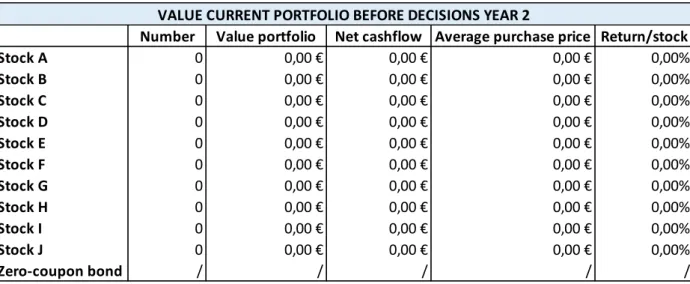
Figure 7. Trading platform: value current portfolio year 2 ... 37
Figure 8. Trading platform: investment advice in year 1...
...
.38Figure 9. Trading platform: investment advice year 2...38
Figure 10. Trading platform: buy and sell decisions in year 2 ... 40
Figure 11. Trading platform: formula sales decisions year 2 ... 40
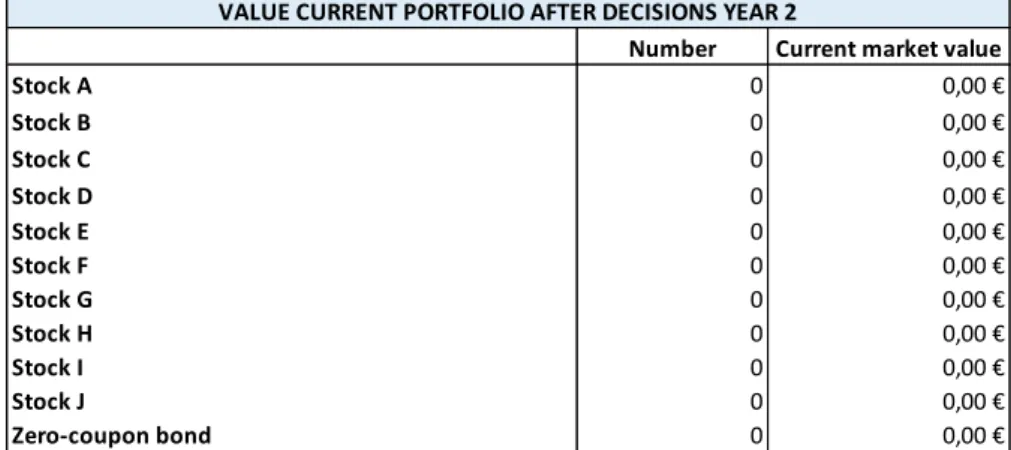
Figure 12. Trading platform: portfolio after buy and sales decisions in year 2 ... 41
Figure 13. Trading platform: value total portfolio in year 2 ... 41
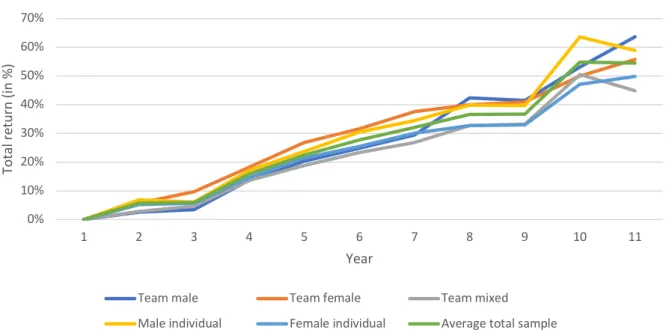
Figure 14. Descriptive statistics: total average return per year and per subsample ... 43
Figure 15. Descriptive statistics: portfolio composition individuals ... 44
Figure 16. Descriptive statistics: portfolio composition teams ... 45
Figure 17. Descriptive statistics: portfolio composition teams versus individuals ... 46
Figure 18. Descriptive statistics: buy and sell activities individuals ... 47
Figure 19. Descriptive statistics: buy and sell activities teams ... 48
List of tables
Table 1. Trading platform: input parameters Geometric Brownian Motion ... 35Table 2. Descriptive statistics: gender ... 42
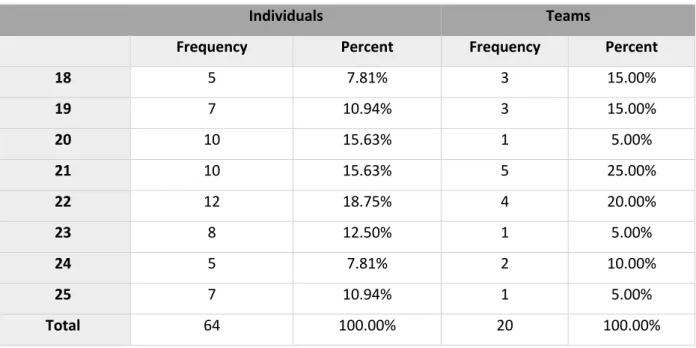
Table 3. Descriptive statistics: age groups ... 42
Table 4. Results of the bivariate analyses – individuals and teams – buy-side and sell-side (%) ... 59
Table 5. Results multivariate regressions – LPM – buy-side (%) ... 63
Table 6. Results multivariate regressions – LPM – sell-side (%) ... 66
Table 7. Results multivariate regressions – Logit model – buy-side (%) ... 69
INTRODUCTION
Imagine you are looking for a product. You surf to your trusted online retailer Amazon to find the best offer. After a few minutes you find two identical products. Both products have the similar quality and price. However, product one has more than a thousand positive reviews while the other product has barely ten reviews. When deciding which product you will buy, it is likely you will follow the herd and choose to purchase the first product since you believe that people who have already bought the product have information about the quality of the product or have had previous experiences.
The phenomenon where an individual ignores his own information and decides to follow the actions of other individuals can be defined as herding behaviour. Herding behaviour does not only apply to day-to-day decisions such as the restaurant where an individual wants to eat or what product an individual wants to buys from his favourite online e-retailer. It is strongly believed that investors in the financial markets also imitate the actions of other investors.
Most decisions in real life situations are made by groups such as boards of directors or committees rather than by an individual. Despite the fact that many important decisions are made in teams, the finance literature has devoted little attention to team decision-making.
In the literature, there is already a well-founded theoretical and empirical framework with regard to herding behaviour. With regard to the theoretical framework of herding behaviour, the different concepts (Bikhchandani & Sharma, 2001), causes (Banerjee, 1992; Bikhchandani, Hirshleifer, & Welch, 1992; Scharfstein & Stein, 1990; Maug & Naik, 1995) and measures (Lakonishok, Shleifer, & Vishny, 1992; Christie & Huang, 1995; Chang, Joseph, & Khorana, 2000) of herding behaviour have already been substantiated. With regard to the empirical framework of herding behaviour, several studies have already analysed herding behaviour among individual and institutional investors (Lakonishok, Shleifer, & Vishny, 1992; Wermers, 1999; Sias, 2004), in developed and emerging markets (Economou, Philippas, & Alexandro, 2011; Chang, Joseph, & Khorana, 2000) and during periods of market stress (Lakonishok, Shleifer, & Vishny, 1992; Chiang & Zheng, 2010).
There is a gap in the literature that investigates investment decisions made by teams and individuals. The existing and growing academic literature on individual and team decision-making highlights the difference between individuals and teams with respect to risk-taking behaviour (Baker, Laury, & Williams, 2008; Bliss, Potter, & Schwarz, 2008), the performance in investment settings (Rockenbach, Sadrieh, & Mathauschek,
The gap in the literature concerning team and individual decision-making served as a research motive from which the following research question emerged: 'Do teams exhibit more herding behaviour in investment decisions compared to individuals?’
To examine herding behaviour in individual and team investment decisions, a self-developed trading platform in Excel was created which was distributed among the campus of the Faculty of Economics and Business Administration of Ghent University and the campus ‘Mercator’ of Hogent. Each participant, as an individual or as a team, had to build and manage an investment portfolio for ten consecutive trading years with the objective of achieving a maximum return. The participant could buy or sell securities annually. Furthermore, random robo-advice was also created to assist participants in buying and selling securities.
Eventually, 64 individuals and 10 teams participated in the experiment and an answer could be formulated to the research question. Concluding from the various statistical analyses, results reveal that both individuals and teams display herding behaviour but teams show a higher level of herding behaviour (higher buy probability if they get advice to buy and higher sell probability if they get advice to sell). Furthermore, the analyses also show that female individuals have a higher chance to (des)invest compared to male individuals. Additionally, older individuals (younger teams) have a higher chance to trade compared to younger individuals (older teams). Moreover, the time period in which the participant is situated appears to be an important factor (i.e. lower buy probability and higher sell probability starting from trading year six despite if they receive investment advice). Lastly, teams exhibit a higher level of herding behaviour regarding to stocks when an advice is given compared to individuals.
The present study is divided into seven sections. The introduction is followed by a discussion of the literature in the second chapter. The third chapter discusses the research and sub-questions with their corresponding hypotheses that are being tested. Next, the fourth chapter discusses the collected data, the self-developed trading platform and descriptive statistics. The research methodology is formulated in chapter five, while chapter six discusses the results of various statistical results. Finally, chapter seven concludes with a critical discussion and a recommendation for further research.
LITERATURE REVIEW
This chapter introduces the concept of herding behaviour, thereby, contrasting spurious and intentional herding behaviour and rational, not fully rational and irrational herding behaviour. Next, possible causes of rational herding behaviour are studied in more detail. Thereafter, some measures of herding behaviour have received particular attention while also evidence regarding the existence of herding behaviour is given. Later in this section, possible consequences of herding behaviour in financial markets will be discussed. The chapter ends with an examination of individual and team decision-making.
2.1. Definition and types of herding behaviour
2.1.1. Definition herding behaviour
In its general form, herding behaviour is defined as “behavior [sic] patterns that are correlated across individuals” (Devenow & Welch, 1996, p. 604). However, Devenow and Welch (1996) argue that when many investors are buying ‘hot’ stocks, for example, behaviour patterns may be correlated because investors acted on correlated information and not because they observed the behaviour of other investors. For this reason, herding behaviour is divided into intentional and spurious herding behaviour. Both types of herding behaviour are discussed later in this section. A more appropriate definition of herding behaviour is given by Hwang and Salmon (2004, p. 585): “Herding arises when investors decide to imitate the observed decisions of others or movements in the market rather than follow their own beliefs and information.”
An investor must be conscious of and be influenced by other investors’ actions in order to be part of a herd. An investor is part of a herd when other investors’ decisions to not make an investment causes the investor not to invest, whereas the investor would have made the investment if he/she had not known other investors’ decisions. Herding behaviour also exists in the opposite scenario where an investor changes his/her mind from not investing to making an investment when he/she observes other investors making an investment (Bikhchandani & Sharma, 2001).
In order to enable investors to be aware of other investors’ actions, herding behaviour requires a coordination mechanism. On the one hand, the mechanism can be a rule based on some signal (e.g. a price movement), this is the indirect part of the mechanism. On the other hand, the mechanism can be a rule based on the observation of the actions of others (e.g. observing the investment of a competitor), this is the direct part of the mechanism (Devenow & Welch, 1996).
In the literature, herding behaviour is split into different categories. Figure 1 demonstrates how herding behaviour is divided according to Bikhchandani and Sharma (2001). Herding behaviour can be segregated into intentional or true herding and unintentional herding or spurious herding. Intentional herding can be further classified into irrational, not fully rational and rational herding behaviour. The last, rational herding, can be divided into three subcategories, namely herding based on information, reputation and compensation. In what follows, each subcategory of herding behaviour will be discussed in more detail.
Figure 1. Division of herding behaviour (Bikhchandani & Sharma, 2001)
2.1.2. Intentional herding behaviour and spurious herding behaviour
As displayed in Figure 1, herding behaviour can be segregated into two different categories, the first category being intentional herding behaviour and the second category being spurious herding behaviour. Intentional herding behaviour is defined as a situation where investors intentionally copy the behaviour of other investors abandoning their initial vision (Bikhchandani & Sharma, 2001). Intentional herding behaviour can cause asset prices to no longer reflect fundamental information, exacerbate volatility, destabilize markets and contribute to bubbles and crashes; intentional herding may therefore result in inefficient market outcomes (Kremer, 2010).
Spurious herding behaviour, on the other hand, occurs when a group of investors facing similar decision problems and information sets chooses the same action regardless of other investors’ actions (Bikhchandani & Sharma, 2001). As pointed out by Lakonishok, Shleifer, and Vishny (1992), spurious herding behaviour may arise because market participants are exposed to identical market information. When market participants receive the same fundamental information, they might all react to this independently and herd as a result.
Herding
Spurious
herding Intentional herding
Irrational
herding Not fully rational Rational herding
Information
An example will make the concept of spurious herding behaviour more clearly.
A sudden rise of interest rates by a central bank may cause investors to sell their positions in stocks as they become less attractive investments. At this point, behaviour patterns across investors may be correlated. However, given that investors are not following other investors’ decisions but instead are reacting to commonly known public information, which is the rise in interest rates, this is not considered as intentional herding behaviour (Bikhchandani & Sharma, 2001).
Spurious herding behaviour leads to efficient market outcomes because the market becomes more efficient as investors are reacting to new public information, bringing the securities prices to their new fundamental level (Lakonishok, Shleifer, and Vishny, 1992; Bikhchandani and Sharma, 2001). This behaviour is consistent with the Efficient Market Hypothesis (further referred to as EMH) (Fama, 1970).
2.1.3. Irrational, not fully rational and rational herding behaviour
To understand financial markets, traditional finance uses models in which agents are perceived ‘rational’. According to Barberis and Thaler (2003), rationality means two things. Firstly, when new information enters the market, investors update their beliefs following Bayes’ law. Secondly, investors make choices that are consistent with Savage's (1954) Subjective Expected Utility (SEU) theory. The SEU theory states that a decision maker under risk uses the subjective maximum expected utility as a measure to estimate the economic opportunity of his choice. For the subjective expected utility, two different concepts are incorporated: a personal utility function and a personal probability distribution. Savage (1954) argues that the decision maker will choose the option with the highest subjective expected utility. However, different decision makers may make different choices as their subjective utility function or their probability distribution may differ.
Another pillar of traditional finance is the EMH, as coined by Fama (1970). The EMH states that in an efficient market, the prices of securities reflect all available information, in particular internal and external information, but also future expectations. Fama (1965, p. 76) defined an efficient market as “a market where there are large numbers of rational, profit-maximisers actively competing, with each trying to predict future market values of individual securities, and where important current information is almost freely available to all participants”.
Thus, the implication of the EMH is that both technical analysis1 and fundamental analysis2 cannot result in achieving better investment results than those that could be achieved by a randomly selected portfolio of individual stocks with comparable risk (Malkiel, 2003). In other words, it is impossible to consistently ‘beat the market’ in the long run. If a trader could predict future price levels, this would be evidence against market efficiency because the capacity to predict stock prices would illustrate that not all available information was reflected in the stock prices (Bodie, Kane, & Marcus, 2019).
The Random Walk Theory is associated with the EMH (Malkiel, 2003). If the EMH holds, then price changes of securities should wander randomly from previous security prices (Fama, 1965). The rationale of the random walk hypothesis is that “if the flow of information is unimpeded and information is immediately reflected in stock prices, then tomorrow’s price change will reflect only tomorrow’s news and will be independent of the price changes today. But news is by definition unpredictable, and, thus, resulting price changes must be unpredictable and random” (Malkiel, 2003, p. 59).
However, in the 1980s, there appeared growing evidence challenging the hypothesis of the efficient market. In particular, numerous researchers found that stocks prices did exhibit some patterns, questioning the EMH and thus indicating inefficient markets (Shefrin, 2002). These patterns were called ‘anomolies’. One of the most reported anomolies is the ‘size effect’, which states that smaller firms tend to realize higher risk adjusted returns than larger firms (Banz, 1981). ‘Calendar effects’ have also been reported. Wachtel (1942) found that stocks exhibit higher returns in January compared to the other months of the year; this is known as the ‘January effect’.
Market anomolies caused extensive research that questioned investors’ rationality, the cornerstone of traditional finance and the key assumption of the EMH. In response to these anomolies, a new field of finance emerged: behavioural finance. Behavioural finance is defined as “finance from a broader social science perspective including psychology and sociology” (Shiller, 2003, p. 83). Behavioural finance argues that market anamolies can be understood by using models in which some agents are not perceived as fully rational. In particular, in some behavioural finance models, agents do not always process information correctly due to cognitive biases. In other models, agents make choices that are incompatible with SEU (Barberis & Thaler, 2003).
1 Technical analysis is “the study of past stock prices in an attempt to predict future prices” (Malkiel, 2003, p. 59).
2 Fundamental analysis is “the analysis of financial information such as company earnings and asset values to help
From the previous discussion, the concepts of irrational, not fully rational, and rational herding behaviour can now be explained. Irrational herding behaviour occurs when an agent decides to imitate the behaviour of other agents while ignoring his own information with the result that the agent’s subjective expected utility (i.e. the return in the case of an investor) is not maximized. As mentioned above, this behaviour cannot be explained by traditional financial, but can be explained by the fact that people are prone to cognitive and emotional biases (Barberis & Thaler, 2003).
Another subcategory of intentional herding behaviour is not fully rational herding behaviour. One type of not fully rational herding is the use of ‘momentum-investment’ or ‘positive-feedback’ strategies. Bikchandani and Sharma (2001) define a momentum investor as an investor who buys and sells stocks based on past returns of the stocks, in other words, to buy recent ‘winners’ and sell recent ‘losers’. Based on the EMH (Fama, 1970), market prices should reflect all available information and therefore these strategies are not rational. However, Bikhchandani and Sharma (2001) argue that this behaviour can be rational if one would assume that an average investor cannot digest and act on new information immediately. Hence, market prices would reflect all information over time and not immediately. Therefore, an investor who follows such strategies could exploit the persistence of returns over some time period.
Rational herding behaviour, on the other hand, occurs when an investor decides to imitate other investors’ actions while ignoring his own information with the result that the investor’s subjective expected utility (e.g. return on an investment) is maximized. There are several reasons for an investor to engage in rational herding behaviour in financial markets. These reasons will be explained in the next section.
2.2. Causes of rational herding behaviour
As illustrated in Figure 1, rational herding behaviour can be divided into three subcategories, namely information-based, reputation-based, and compensation-based herding behaviour. These three subcategories reflect the main causes of rational herding behaviour in financial markets. However, it is rational only from the investor’s point of view as he would be gaining something (i.e. maximizing his subjective utility) (Abbi, Agarwal, & Balachandran, 2014).
Note that these models are often based on game theory and are therefore not directly applicable to financial markets as various underlying assumptions are made to the models. Nonetheless, these models do provide insights into how herding behaviour can emerge in financial markets. Over time, various modifications have been made to the basic models in order to make them more applicable to financial markets.
2.2.1. Information-based herding behaviour
A primary cause for the existence of rational herding behaviour was modelled through the concept of ‘informational cascades’ by Banerjee (1992) and Bikhchandani, Hirshleifer, and Welch (1992) (hereafter BHW). BHW (1992, p. 994) state that "an informational cascade occurs when it is optimal for an individual, having observed the actions of those ahead of him, to follow the behavior [sic] of the preceding individual without regard to his own information".
To make the concept of an informational cascade more clearly, a real world example is provided as presented by Banerjee (1992). Suppose there are two restaurants next to each other, restaurant A and B, and restaurant A is favoured a priori by 51 percent and restaurant B is favoured a priori by 49 percent. One hundred persons have to choose in which restaurant they want to eat. Ninety-nine of them receive an information signal that restaurant B is better than restaurant A and one person receives the opposite signal. However, suppose this person arrives first and chooses restaurant A as his signal suggests. The second person arriving will face a dilemma; on the one hand he knows that the first person had an information signal that favoured restaurant A and on the other hand he receives a signal that restaurant B is better. These two signals cancel each other out and the rational choice for the second person would be to choose restaurant A. At this point, only the first person's information is passed on to the rest of the population since the second person disregarded his own information and followed the first person's choice. The situation of the third person is the same as that of the second person, so the third person would make the same choice and so on. As a result everyone ends up at restaurant A even though the aggregate information of the population indicates that restaurant B is better. Suppose now that the second person follows his own signal and chooses restaurant B. In this situation, both informational sets of the previous persons are conveyed to the third person. The third person would then have chosen restaurant B since his signal would correspond with that of the second person. In the same way, the remaining persons will choose restaurant B.
The above-mentioned example shows that the second individual only observes the action of the first individual and not the private signal. He assumes that the information set available to the first individual, both the private signal and the public information, is more reliable than his own information set. The second individual therefore values the first person’s action over his information set and chooses to imitate him, ignoring his own private signal and thus starting an informational cascade. This cascade implies a negative externality on the rest of the population since the private signal of the second individual is ignored, although it may contain information that is relevant to the decision-makers as a whole. The information cascade thus leads to herding behaviour. However, if the second individual had used his private information, the rest of the population could infer information about his decision, which in turn would have encouraged them to use their private information as well (Banerjee, 1992; Abbi, Agarwal, & Balachandran, 2014).
Banerjee (1992) developed a decision model in which each agent has to choose one asset in a set of assets, but only one asset has a payoff. The agents may or may not receive a private signal telling which asset provides a payoff, however, this signal can be either true or false. The decision-making in the model is sequential and the person who takes the first decision is chosen randomly. The following agents take their decisions allowing them to observe the choices made by the previous agents. It is not allowed to find out whether the previous agent received a signal or not. In the model each agent has a decision tree that reflects the circumstances under which the agent makes a decision. Based on some decision rules, it is shown that when the first two agent choose the same action, all subsequent agents will follow them regardless of their private information, thus displaying herding behaviour. This behaviour might be rational for an agent since he assumes that the information observed from other agents’ decisions may be more important which may allow him to choose the asset which has a payoff. However, the author demonstrates that the resulting equilibrium may not be efficient since the imitated action may be a non-winning one.
BHW (1992) presented another model of herding behaviour including a cost of adoption. They proposed a model where a sequence of individuals has to decide to adopt or reject some behaviour. Each individual can observe the decisions of all previous individuals. In their model, there is a value of adoption, but also a cost of adoption which is considered to be fixed (the cost of adoption was not included in the model described above). Each individual observes an independent private signal about the value of adoption. An individual will adopt when the expected value of adoption is greater than or equal to the cost of adaption. An individual can perceive the action taken of previous individuals: when previous individuals have adopted the behaviour and they are not in a cascade, the individual induces that their signal about the
the individual induces that their signal is smaller. BHW (1992) show that the probability of an individual not being in a cascade falls exponentially with the number of individuals; in other words, as the number of individuals increases, the probability that an informational cascade occurs tend to one. Once an individual is in an informational cascade, all subsequent individuals will be in a cascade as the action of the previous individual convey no information about private signal and thus this action does not improve the decisions of the subsequent individuals.
The basic insights of the model of BHW (1992) could be applied in several aspects of finance, including the market for corporate control (takeover bids), initial public offerings, and the renegotiation of debt with a creditor. Nonetheless, the applicability of the model to financial markets is more difficult since the price mechanism in financial markets changes the cost of the actions (price of an asset in financial markets) whereas the authors assumed a fixed cost.
In response to the critique of the BHW model, Avery and Zemsky (1998) developed a new model that incorporates a pricing mechanism. They start from a general model in which traders have the option to buy or sell an asset or to refrain from trading. The price at which to buy or sell the asset depends on the history of trading which is publicly available. This aspect is different from BHW (1992), where the cost of adoption is fixed. Furthermore, there is a market maker who sets the bid-ask spread and there are two categories of traders: informed traders who receive private signals about the true value of the asset and noise traders who receive no private signals. However, the private signals that informed traders receive can be informative or noisy. The authors state that “herd behavior [sic] occurs when agents imitate the prior actions (buying or selling) of others” (Avery & Zemsky, 1998, p. 728). They conclude that when there is value uncertainty (i.e. if the real value of an asset is higher or lower than the current price), the price mechanism assures that there is no rational herding behaviour possible in an informationally efficient market. To allow for herding behaviour, the authors extend their model due to the fact that some traders may be informed of shocks that have an impact on the underlying value of an asset, whereas the market maker is not informed. However, these traders do not know whether a shock increases or decreases the value of the asset, this is known as ‘event uncertainty’. It is shown that herding behaviour can arise when investors are exposed to multidimensional uncertainty: when there is private information about event uncertainty on top of private information about value uncertainty. Moreover, when composition uncertainty (i.e. uncertainty with regard to the proportion of the market that is informed) is added to the model, herding behaviour can lead to a price crash and a bubble.
2.2.2. Reputation-based herding behaviour
Many theoretical studies have been conducted on reputation-based or principal-agent herding behaviour. These studies offer different models that illustrate the reason why agents may rationally choose to imitate the behaviour of other agents. Scharfstein and Stein (1990), Trueman (1994), Graham (1999), and Hong et al. (2000) provide models based on the reputational concerns of fund managers or analysts. These models are built upon the idea that when a principal is uncertain of the agent’s capability of selecting the right stocks, it is reasonable for an agent to imitate other agents’ decisions to preserve the principal’s uncertainty with regard to the agent’s ability (Bikhchandani & Sharma, 2001).
Scharfstein and Stein (1990) developed a model that demonstrates that managers exhibit herding behaviour due to managers’ rational attempts to improve their reputation. In their model, managers make investment decisions in order to manipulate the inferences of the labour market regarding their decision-making ability. The authors consider two types of managers, namely smart and dumb managers. Smart ones are those managers who obtain useful signals about the value of an investment whereas dumb ones are those managers who receive noisy signals. However, neither the managers nor the labour market know which type each manager is. After each investment decision by each manager, the beliefs of the labour market regarding the manager’s type are revised based on the investment profitability of a manager and whether or not the manager behaves the same as the other managers. The latter is included in the market’s beliefs because there are unpredictable components of investment value that could give misleading signals and make smart managers unlucky. Consequently, a so-called ‘sharing-the-blame’ effect arises, meaning that an unprofitable investment decision has less negative impact on a manager’s reputation when others make the same mistake than if the manager was alone when making the decision. This effect is created because smart managers obtain correlated signals while dumb managers observe uncorrelated noise. As a result, a manager is perceived as smart when copying the behaviour of others as this suggests to the labour market that he has obtained a signal that is correlated with theirs. On the other hand, a manager is perceived as dumb if he takes a contrarian position. This can lead to a situation where managers follow other managers’ decisions, even when these managers believe that the expected value is greater than that of the herd. The reason is to avoid being perceived as the only manager who invests in a product that might turn out to be a bad decision.
However, Scharfstein and Stein (1990) point out that their model cannot be perfectly transferred to a stock market setting due to the assumptions they made (e.g. perfect elastic supply and a lack of a market price). Anyway, their basic insights could be applied to the stock market. For example, money managers always have an idea of how active their competitors are in the market. Consequently, the possibility exists that these managers will imitate each other’s asset allocation strategies even when their private information suggest that current price levels are too high or too low. The result is that asset allocation decisions made by money managers should be more correlated than those made by private investors who are not concerned about their reputations.
Trueman (1994) presented a model of reputational herding behaviour by analysts. His model starts from an economic setting with many investors, one risky firm and two security analysts who are paid by clients to provide prognoses of the firm’s earnings. Clients assess both analysts based on their ability to predict earnings. Both analysts know their ability with certainty, but their clients do not. At the beginning of the period, both analysts receive private information about the firm’s earnings to be realized. Based on this signal, the analysts form an expectation about the company’s earnings. This forecast is released to their clients and then are made public. However, their earnings expectations may deviate from their announced forecasts. At the end of the period, clients assess the analysts based on the released forecast and the earnings that are disclosed. So, in deciding on the forecasts to release, the analysts try to maximize their expectation of the client's assessment of their ability. This objective arises because the author assumes that the fees that analysts can charge in the next period are dependent on the client's assessment of their ability.
The likelihood that the analyst releases a forecast similar to those previously announced by other analysts is greater than could be justified by his own information. Such action is a manifestation of herding behavior [sic] and, as before, is undertaken in order to favourably affect investors’ assessment of the analyst’s forecasting ability. (Trueman, 1994, p. 98)
Research by Graham (1999) and Hong et al. (2000) support the existence of reputational herding behaviour. Graham (1999) built a reputational herding model among investment newsletters. He concludes that ability is the key factor in determining whether a newsletter herds on the advice of the market leader. Hong et al. (2000) found that younger security analysts exhibit more herding behaviour than more experienced security analysts.
In the paper of Scharfstein and Stein (1996), the pre-October 1987 stock market crash is given as an illustrative example of reputational herding behaviour.
In October 1987, the stock market experienced a single-day collapse, known as Black Monday
(Dewey, 2017). The Dow Jones Industrial Average dropped 22.61%, falling 508 points from
2,246.73 (16/10/1987) to 1,738.74 (19/10/1987) (Microsoft Corp., 2020). Around October 1987, the agreement among many professional managers was that the price level was too high. In their opinion the market was likely to fall rather than to rise. Despite of this, few money managers were willing to sell their holdings. The reason for this was that if the stock market went up anyway, they did not want to be considered as lone fools and risk damaging their reputation. Contrarily, in the case of a market decline, their reputation would not be damaged because there would be comfort in numbers who had suffered the same fate. Or how Keynes (1936, p. 138) remarked, “it is better to fail conventionally than to succeed unconventionally.”
2.2.3. Compensation-based herding behaviour
The third and final cause of rational herding is compensation-based herding behaviour. When an agent’s compensation is based on his performance in comparison to other similar agents, this agent has the incentive to herd. As the agent’s compensation decreases when he performs worse than the other agents, this causes the agent to align his investments with the portfolio of the other agents than if he had traded for his own account (Bikhchandani & Sharma, 2001). Compensation-based herding has been confirmed by Maug and Naik (1995).
Maug and Naik (1995) examined the extent to which fund managers’ relative performance contracts induce them to herd and to adjust their portfolio allocation to that of other funds. To investigate herding behaviour, they set up a two stage model in which an agent (fund manager) is hired by a principal to manage the principal’s portfolio. As the principal does not have information about assets, the agent is charged with acquiring information and making portfolio decisions on behalf of the principal. Next to this agent, there exists another fund manager in the market who trades on his own account. Moreover, the agent receives a relative performance contract linking his compensation to the profits of this second trader.
In the first stage of the model, Maug and Naik (1995) start by deriving the general contract the principal should offer to the agent. They investigate two possible situations. The first situation is where the principal offers a moral hazard contract to the agent. This is a contract where the agent makes an unobservable cost to obtain superior information. Secondly, the principal can also offer a so-called screening contract
to the agent where the principal distinguishes good agents from bad agents. The distinction is made on the basis of traders’ ability to become informed. In the second stage, the authors investigate the impact of the contract with relative performance on the behaviour of agents. If a trader mimics other traders’ actions while ignoring his own information, this may not be too bad if other traders have superior information. To cope with this argument, they consider the case where the fund manager is smart and the agent he is benchmarked against is dumb. The authors assume an exchange economy with one risky and one riskless asset available. The economy consists of two informed risk averse agents, namely the fund manager and the trader who trades on his own account, and a number of traders who trade independent of prices and provide liquidity.
Maug and Naik (1995) conclude that the relative performance contract results in some degree of herding behaviour by the agent. This behaviour results in trading by the agent when he initially would not have been trading. It could also induces the agent to trade in the opposite direction compared to what he would have done if he had been trading independently. An explanation is that fund managers put a relatively larger weight on public information and a smaller weight on private information. Taking into account the inefficient outcome, the authors suggest that it is still optimal for the principal to offer a relative performance contract to the agent in order to save on screening costs and to provide incentives to the agent.
An example of compensation-based herding behaviour is given by the International Monetary Fund (2015).
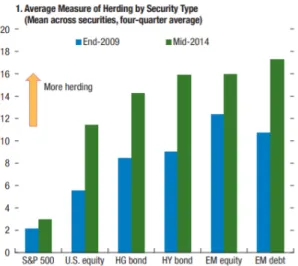
In the Global Financial Stability Report of 2015, the International Monetary Fund measured the degree of herding behaviour among U.S. open-end mutual funds using the method developed by Lakonishok, Shleifer, and Vishny (1992)3. Looking at Figure 2, it can be seen that the degree of
herding behaviour among U.S. mutual funds has risen sharply in 2014 compared to 2009. Herding behaviour is more pronounced in emerging markets, high yield bond markets and high grade bond markets. According to the report, this herding behaviour arises because of incentive problems between end investors and fund managers.
Figure 2. Herding behaviour among U.S. mutual funds per security type (International Monetary Fund, 2015)
Moreover, as can be seen in Figure 3, retail-oriented funds exhibit a stronger degree of herding behaviour than institutional-oriented funds. A possible explanation given in the report is that “retail investors are more prone to quickly reallocate money from funds with poor recent performance to funds with high recent returns, possibly because it is more difficult for them than for institutional investors to assess and monitor portfolio managers. This difficulty in assessing and monitoring managers and the resulting volatility of inflows would exacerbate the role of incentive problems described earlier in driving herding behavior [sic]” (International Monetary Fund, 2015, p. 114).
2.3. Measures of herding behaviour
Measuring herding behaviour has proved challenging. Bikhchandani and Sharma (2001) point out that the approaches to measure herding behaviour are statistics-oriented, focussing on whether clustering of trades is taking place in financial markets. Methods of herding behaviour therefore fail to observe the direct link between the underlying reasons for such behaviour and the empirical design used to test for herding. Moreover, many approaches do not differentiate between spurious and intentional herding behaviour. The explanation of Bikhchandani and Sharma (2001) is that it is difficult to determine the fundamentals of herding, and that is difficult to measure and quantify them. In brief, measures of herding behaviour can hardly separate imitating behaviour from clustering of decisions. Consequently, most of the herding behaviour literature uses herding behaviour as a synonym for clustered trading and herding measures are proxies for imitative behaviour (Hachicha, 2010).
In the literature, empirical methodologies that have focussed on investigating the existence of herding behaviour can be classified into two streams (Hachicha, 2010). The first stream could be described as 'specific herding behaviour' in which market participants base their investment decisions directly on the decisions of other specific market participants. The most pronounced category in this stream of herding behaviour is 'institutional herding'. Sias (2004, p. 166) defined institutional herding behaviour as “a group of investors following each other into (or out of) the same securities over some period of time”. Examples of institutional investors include insurance companies, pension funds, mutual funds, banks, etc. This stream of herding behaviour requires detailed information on the trading activities of investors and examines whether specific investor types herd. Measures that attempt to detect institutional herding behaviour include the measure of Lakonishok, Shleifer, and Vishny (1992), the measure of Wermers (1999), and the measure of Sias (2004).
However, institutional herding measures do not capture 'market-wide herding behaviour'. Christie and Huang (1995, p. 31) describe market-wide herding as “individuals who suppress their own beliefs and base their investment decisions solely on the collective actions of the market, even when they disagree with its predictions”. The market movement could be considered as a source of information by uninformed market participants. Consequently, these market participants could herd by following the collective actions of the market (Hey & Morone, 2004). Nonetheless, using institutional herding measures, it is not possible to determine whether investors are moving into or out of the market at the same time (Burghardt, 2011). As a result, the literature is extended from the institutional level to the market level. Studies that measure herding behaviour at the market level use aggregate price and market activity data.
The researches that are undertaken in this context are those of Christie and Huang (1995), and Chang, Cheng, and Khorana (2000).
In what follows, the above-mentioned measures of herding behaviour are briefly discussed. It is important to note that the following measures listed in this section are not the only measures which detect herding behaviour. However, these models have been utilised the most by various researchers.
2.3.1. Measures of institutional herding behaviour
2.3.1.1. Measure of Lakonishok, Shleifer, and Vishny (1992)
Lakonishok, Shleifer, and Vishny (1992) (hereafter called LSV) define herding behaviour as the average tendency of money managers to trade more on either the buy or sell side of the market relative to what could be expected if they traded independently. In fact, the LSV measure assesses the correlation in trading patterns for a group of investors and their degree to buy and sell the same set of stocks. Herding behaviour leads to correlated trading, but the opposite need not to be true (Bikhchandani & Sharma, 2001).
The LSV measure is based on trades conducted by a homogeneous group of investors over a period of time. Let B(i,t) [S(i,t)] be the number of investors who buy [sell] stock i in quarter t, i.e. net buyers [net sellers]. The LSV measure, H(i,t), for a given stock i in a given quarter t is:
!(#, %) = |)(#, %) − )(%)| − +,(#, %)
where p(i,t) = B(i,t)/[B(i,t) + S(i,t)], and p(t) is the average of p(i,t) over all stocks i that the investors traded in that quarter t. Indeed, |B(i,t)/(B(i,t) + S(i,t)) – p(t)| can be interpreted as excess buying or selling in the stock relative to an average stock bought or sold. The adjustment factor in equation 2.1. is:
+,(#) = -[/ 0(#, %)
0(#, %) + 2(#, %)− )(%)/]
where B(i,t) follows a binomial distribution with parameter p(t). The adjustment factor ensures that the herding measure is anticipated to be zero under the null hypothesis of no herding, since the absolute value of p(i,t) – p(t) is greater than zero. Therefore, herding behaviour exists if the expected value of the LSV measure is positive and significant.
(2.1) )
.1)
The LSV measure has been criticized in the literature because it suffers from a few drawbacks. Firstly, the measure does take into account the amount of buyers and sellers of a stock, but not the amount of stock that investors buy or sell. Consider a scenario where the number of buyers and sellers of a stock is similar but the amount of the stock that is bought is much larger than the amount sold. In this case, the LSV measure would not indicate herding behaviour even if that existed (Bikhchandani & Sharma, 2001).
Secondly, the LSV measure does not allow to identify intertemporal trading patterns. Using the LSV measure, it is possible to detect the existence of herding in a particular asset over time, but it does not tell whether it is the same fund that continues to herd (Bikhchandani & Sharma, 2001).
Thirdly, the LSV measure is directionless in the sense that it measures herding behaviour without considering whether herding behaviour comes from the buy-side or sell-side (Wermers, 1999).
Despite its drawbacks, the LSV measure remains a widely used measure to detect herding behaviour at the institutional level. Some authors have proposed other measures or modifications to the LSV measure to improve its performance. Wermers (1999) adapted the LSV measure and Sias (2004) proposed another approach to detect herding behaviour.
2.3.1.2. Measure of Wermers (1999)
Wermers (1999) notes that differences may exist between buy and sell herding behaviour. Therefore, he modified the LSV measure and designed a buy-side herding measure, BMIi,t, and a sell-side herding
measure, SHMi,t, in order to examine whether a group of investors buy or sell certain stocks in herd. The
measures are calculated in the same manner as the LSV measure, but conditioned:
0!4!,# = !4!,# | )(#, %) > )(%)
2!4!,# = !4!,# | )(#, %) < )(%)
In this way, the third problem of the LSV measure, that it is directionless, is solved. However, it should be noted that the modification to the LSV measure solves only one problem. The other disadvantages of the LSV measure, that it does not take into account the amount of stock that investors buy or sell and that it cannot identify intertemporal trading patterns, persist.
(2.3) (2.4)
2.3.1.3. Measure of Sias (2004)
Sias (2004) proposed a new approach in order to detect herding behaviour. Similar to the LSV measure, he starts by estimating the number of buyers as a fraction of the total number of active traders. This ratio is called the 'raw fraction of institutions buying' and is estimated using the following formula:
89:∆$,#=
0<$,# 0<$,#+ 2<$,#
where BIk,t is the number of institutions buying asset k during quarter t, and SIk,t is the number of
institutions selling asset k during quarter t.
Then, the author standardizes this ratio to allow for aggregation over time. The standardized fraction ratio is defined as:
∆$,#=
89:∆$,#− 89:∆=========# >(89:∆$,#)
where 89:∆========= is the cross-sectional average raw fraction of institutions buying in quarter t and #
>(89:∆$,#) is the cross-sectional standard deviation of the raw fraction of institutions buying in quarter
t.
Finally, a cross-sectional regression of the standardised buyer ratios in the current quarter on the standardised buyer ratio in the previous quarter is evaluated:
∆$,#= ?#∆$,#%&+ @$,#
where ?t is A(∆$,#, ∆$,#%&) and represents the correlation between institutional demand this quarter and
institutional demand last quarter. Sias (2004) decomposes this correlation into the proportion resulting from institutional investors following themselves into and out of the same securities over adjacent quarters and the proportion resulting from institutional investors following other institutional investors into and out of the same securities. The cross-sectional regression is estimated for each quarter.
(2.5)
(2.6)
As Sias (2004, p. 177- 178) points out “the key difference is the Lakonishok, Shleifer, and Vishny (1992) measure indirectly tests for cross-sectional temporal dependence by recognizing that within a period, later institutional traders following earlier institutional investor’s trades will result in most institutional traders on one side of the trade within that period. Alternatively, we directly test whether institutional investors follow each other’s trades by examining the cross-sectional correlation between institutional investors’ trades in one period and other institutional investor’s trades the next period”.
2.3.2. Measures of market-wide herding behaviour
2.3.2.1. Measure of Christie and Huang (1995)
Christie and Huang (1995) (hereafter referred to as CH) presented a model to test for the presence of herding behaviour in the U.S. equity market. The model measures the tendency of market participants to converge to the entire market mean, it is therefore a market focused model. According to CH, market participants act irrational during periods of market stress, by suppressing their own beliefs in favour of the market consensus, causing security returns to cluster around the market returns.
To measure how close individual stock returns are to the market return, CH applied the cross-sectional standard deviation (CSSD) of equity returns, or dispersion. In other words, the CSSD quantifies the average closeness of individual returns to the mean of the market portfolio. CSSD is measured by the following formula:
B22C# = D∑(!)&(8!,#− 8',#)² G − 1
where N represents the number of returns, Ri,t is the observed stock return on firm i at time t, and 8',#
is
the cross-sectional average of the N returns in the aggregate market portfolio at time t.
According to CH, when herding behaviour is present in the market, security returns will converge to the market mean and, consequently, dispersions are predicted to be low. However, low dispersions themselves do not guarantee the presence of herding behaviour. On the other hand, in a fully efficient market without herding behaviour, where rational asset-pricing theories hold, dispersions vary with the market.
To test for the presence of herding behaviour in extremely bullish and bearish period, CH regressed the CSSD returns against a constant and two dummies. The linear regression is as follows:
B22C# = I + ?&C#*+ ?
+C#,+ J#
where α is an intercept, C#* = 1 if the market return on day t lies in the extreme lower tail of the return
distribution and C#* = 0 otherwise, and C#- = 1 if the market return on day t lies in the extreme upper tail
of the return distribution and C#, = 0 otherwise, and J# is the error term at time t. The dummy variables
capture differences in herding behaviour in extreme positive and negative periods versus relatively normal market periods. To define extreme market periods, CH used one and five percent of the observations in the upper and lower tail of the market return distribution. The α coefficient denotes the average dispersion of the sample excluding the regions corresponding to the two dummy variables.
Statistically significant negative values for ?&and ?+ should reveal the presence of herding behaviour. The
rationale is that the dummy variables capture the extreme phases of the market return. When the CSSD values are lower during these days, CSSD and 8',#, move in the opposite direction, which is indicated by
the negative coefficient. When ?&and ?+ have negative values, this implies a negative relationship to the
CSSD estimate. This means that in the most extreme phases of the market returns the CSSD actually decreases and herding behaviour is implied to be present (Christie & Huang, 1995).
However, the Capital Asset Pricing Model (Sharpe, 1964; further referred to as CAPM) relate individual returns to the market return. During periods of large price movements, the CAPM predicts that large changes in the market return would lead to an increase in dispersion. The reason is because individual securities differ in their sensitivity to the market return. The CAPM will therefore predict significantly positive coefficient for ?&and ?+. Hence, herd behaviour and the CAPM offer different predictions for the
behaviour of dispersions during periods of unusual market movements (Christie & Huang, 1995).
Nonetheless, the approach proposed by CH suffers from a few drawbacks. Firstly, Economou, Kostakis, and Philippas (2011) assert that the CSSD is an intuitive measure of cross-sectional returns’ dispersion, but it is can be severely biased by outliers. Secondly, Kreinovich, Sriboonchitta, and Chakpitak (2018) note that the CH approach requires the definition of extreme market returns. CH employed one and five percent as the criteria to define the upper and lower tails of the return distribution, however, they argue that this definition is arbitrary. Market participants do not always have the same opinion about an extreme return, and so the characteristics of the return distribution may change over time.
Lastly, an important assumption of the CH approach is that it only measures the potential presence of herding behaviour during periods of extreme market movements but herding behaviour can happen over the entire return distribution (Kreinovich, Sriboonchitta, & Chakpitak, 2018).
2.3.2.2. Measure of Chang, Cheng, and Khorana (2000)
Chang, Cheng, and Khorana (2000; henceforth referred as CCK) modified CH’s approach and presented a new approach to detect herding behaviour in stock markets. CCK’s method overcomes the problem of the CH’s approach, that the CSSD can be biased by outliers, by using the cross-sectional absolute deviation (CSAD) of returns, as a measure of dispersion. The CSAD is calculated as follows:
B2+C# = 1
KL |M!,#− M=====|',#
. !)&
where n is the number of stocks in the portfolio, ri,t is the stock return of company i at time t and M===== is ',#
the cross-sectional average return of the n returns in the market portfolio at time t.
CCK discuss that rational asset pricing models predict a linear and increasing relationship between individual equity returns and the market return. However, during periods of large price movements, investors may behave the same way, exhibiting herding behaviour. When herding behaviour is present in the stock market, correlation among stock returns is likely to increase, and the related dispersion, or CSAD, would decrease, or at least at a less than proportional rate with the portfolio average. According to CCK, the increased tendency of investors to herd around the market consensus during periods of large price movements is enough to convert the linear relation into a non-linear relation. The non-linear regression is given below:
B2+C# = I + N&O8',#O + N+P8',#Q++ J#,
where α is an intercept, |Rm,t| represents the absolute value of market return at time t, P8',#Q+ is the
squared value of the market return at time t, and J# is the error term at time t. A negative and statistically
significant γ+ coefficient would indicate the presence of herding behaviour.
(2.10)
The possibility exists that the relationships between CSAD and market return might be asymmetric in the up- versus the down-market. The regressions are constructed in the same way as for the entire market, however, divided into two parts depending on the sign of the corresponding market return:
B2+C#,/ = I + N
&,/O8',#,/O + N+,/P8',#,/Q++ J# #S 8',# > 0
B2+C#012(= I + N
&012(O8',#012(O + N+012(P8',#012(Q++ J# #S 8',# < 0
where negative and statistically significant γ+ coefficients imply the presence of herding behaviour.
2.4. Previous empirical research on herding behaviour
In recent years, herding behaviour in financial markets has been widely studied. This section summarizes the main findings of several studies. The main conclusions of herding behaviour are classified according to the context/situation: herding behaviour by individual versus institutional investors, herding according by companies’ market capitalization and investment objectives, herding in emerging and developed markets, herding during extreme market conditions, and finally asymmetric herding behaviour.
2.4.1. Herding behaviour by individual versus institutional investors
Studies have been conducted into herding behaviour by individual and institutional investors. Lakonishok et al. (1992) point out several reasons why herding behaviour might be more prevalent among institutional investors than among individuals. Firstly, agency problems are created between institutional managers and fund sponsors due to difficulties in assessing managers’ performance where ‘luck’ must be separated from ‘skill’. Money managers are often evaluated against each other. In order not to fall behind a group of money managers by pursuing a unique investment strategy, money managers have the incentive to follow the same investment strategy as other money managers. This reason is consistent with the theory of rational herding behaviour given by Scharfstein and Stein (1990). Secondly, institutions are more aware of each other’s trades than individuals because they try to derive information about the quality of investments, with the result that they may exhibit more herding behaviour. Thirdly, the exogenous fundamental signals that enter the market and to which institutions respond are often more correlated than the signals reaching individuals, causing institutions to display a higher level of herding behaviour.
(2.12) c (2.13)