Agricultural
practices and
water quality
on farms
Agricultural practices and water quality on farms
registered for derogation in 2012
Agricultural practices and water quality
on farms registered for derogation in
2012
RIVM report no. 680717038/2014 A.E.J. Hooijboer et al.
Colophon
© RIVM 2014
Parts of this publication may be reproduced, provided acknowledgement is given to the National Institute for Public Health and the Environment (RIVM), stating the title and year of publication.
Published by:
National Institute for Public Health and the Environment
P.O. Box 1│NL-3720 BA Bilthoven The Netherlands
www.rivm.nl
A.E.J. Hooijboer, RIVM T.J. de Koeijer, LEI A. van den Ham, LEI L.J.M. Boumans, RIVM H. Prins, LEI C.H.G. Daatselaar, LEI E. Buis, RIVM Contact person: Arno Hooijboer
Centre for Environmental Monitoring arno.hooijboer@rivm.nl
This study was commissioned by the Ministry of Economic Affairs as part of Project No. 680717, Minerals Policy Monitoring Programme (LMM).
Abstract
Agricultural practices and water quality on farms registered for derogation in 2012
The EU Nitrates Directive obligates member states to limit the use of livestock manure to a maximum of 170 kg of nitrogen per hectare per year. Dutch farms cultivating at least 70 percent of their total area as grassland were in 2012 allowed to deviate from this requirement under certain conditions, and apply up to 250 kg of nitrogen per hectare (this partial exemption is referred to as ‘derogation’). The Netherlands is obligated to monitor agricultural practices and water quality at 300 farms to which derogation has been granted, and to submit an annual report on the results to the EU. This study examines farms that registered for derogation in 2012, and concludes that the average nitrate concentration in groundwater on these farms decreased between 2007 and 2013. This report was prepared by the National Institute for Public Health and the Environment (RIVM) in collaboration with LEI Wageningen UR (LEI).
Agricultural practices
The report also shows that, on average, derogation farms in 2012 used approx. 11 kg less nitrogen in livestock manure than the prescribed maximum of 250 kg of nitrogen per hectare. The quantity of nitrogen that can potentially leach into the groundwater in the form of nitrate is partly determined by the nitrogen soil surplus. This surplus is defined as the difference between nitrogen input (e.g. in the form of fertilisers) and nitrogen output (e.g. via milk). On average, the nitrogen soil surplus has not changed substantially between 2006 and 2012.
Groundwater quality
In 2012, the average groundwater nitrate concentration on derogation farms in the Sand Region amounted to 36 milligrammes per litre (mg/l) and was
therefore below the nitrate standard of 50 mg/l. On average, farms in the Clay and Peat Regions had even lower nitrate concentrations (10 and 4 mg/l, respectively). With an average groundwater nitrate concentration of 55 mg/l, only derogation farms in the Loess Region exceed the standard. The difference between the regions is mainly caused by a higher percentage of soils prone to nitrogen leaching in the Sand and Loess Regions. Less denitrification occurs on these soils, and more nitrate can therefore leach into the groundwater.
Keywords:
Publiekssamenvatting
Landbouwpraktijk en waterkwaliteit op landbouwbedrijven aangemeld voor derogatie in 2012
De Europese Nitraatrichtlijn verplicht lidstaten om het gebruik van dierlijke mest te beperken tot 170 kg stikstof per hectare. Landbouwbedrijven in Nederland met ten minste 70% grasland mochten in 2012 onder bepaalde voorwaarden van deze norm afwijken en 250 kilogram per hectare gebruiken (derogatie). Nederland is verplicht om op 300 bedrijven die derogatie gebruiken, de
bedrijfsvoering en waterkwaliteit te meten en deze resultaten jaarlijks aan de EU te rapporteren. Uit de rapportage over de bedrijven die in 2012 voor derogatie zijn aangemeld, opgesteld door het RIVM met LEI Wageningen UR, blijkt dat de nitraatconcentratie in het grondwater tussen 2007 en 2013 is gedaald.
Bedrijfsvoering
Uit de rapportage blijkt ook dat het stikstofgebruik uit dierlijke mest op de derogatiebedrijven in 2012 gemiddeld circa 11 kilo lager was dan de maximaal toegestane 250 kilo stikstof per hectare. De hoeveelheid stikstof die als nitraat kan uitspoelen naar het grondwater, wordt onder andere bepaald door het stikstofbodemoverschot. Dit is het verschil tussen de aanvoer van stikstof (zoals meststoffen) en de afvoer ervan (waaronder via melk). Het
stikstofbodemoverschot, gemiddeld over heel Nederland, is niet duidelijk veranderd tussen 2006 en 2012.
Grondwaterkwaliteit
In 2012 lag de nitraatconcentratie in het grondwater in de Zandregio met gemiddeld 36 milligram per liter (mg/l) onder de nitraatnorm van 50 mg/l. Bedrijven in de Kleiregio en de Veenregio hadden gemiddeld een lagere
nitraatconcentratie (10 en 4 mg/l). Alleen de derogatiebedrijven in de Lössregio bevonden zich gemiddeld met 55 mg/l boven de norm. Het verschil tussen de regio’s wordt vooral veroorzaakt door een hoger percentage droge gronden in de Zand- en Lössregio; dit zijn gronden waar nitraat in mindere mate in de bodem wordt afgebroken en daardoor kan uitspoelen naar het grondwater.
Trefwoorden:
Preface
This report provides an overview of agricultural practices in 2012 on all farms that registered for derogation in the derogation monitoring network. The agricultural practice data include data on fertiliser use and actual nutrient surpluses. Information is also provided about the results of water quality monitoring conducted in 2012 and 2013 on farms in the derogation monitoring network.
This report was commissioned by the Dutch Ministry of Economic Affairs, and prepared by the National Institute for Public Health and the Environment (RIVM) in collaboration with LEI Wageningen UR (LEI). LEI is responsible for the
information about agricultural practices, while RIVM is responsible for the water quality data. RIVM also served as the official secretary for this project.
The monitoring network covers 300 farms. The farms in the derogation monitoring network were either already participating in the Minerals Policy Monitoring Programme (Landelijk Meetnet effecten Mestbeleid, LMM), or were recruited and sampled during sampling campaigns.
The authors would like to thank Mr E.A.A.C. Gemmeke of the Ministry of Economic Affairs, Mr G.L. Velthof and Mr J.J. Schröder of the Committee of Experts on the Fertilisers Act (CDM), and Mr W.J. Willems of the LMM Feedback Group for their helpful contributions. Finally, we would like to thank our
colleagues at LEI and RIVM who, each in their own way, have contributed to the realisation of this report.
Arno Hooijboer, Tanja de Koeijer, Aart van den Ham, Leo Boumans, Henri Prins, Co Daatselaar and Eke Buis
Contents
Summary—11
1 Introduction—15
1.1 Background—15
1.2 Fulfilment of obligations, approach—15
1.3 Previously published reports and contents of this report—17
2 Design of the derogation monitoring network—19
2.1 Introduction—19
2.2 Change of method in 2013 and 2014—19
2.3 Statistical method used to determine deviations and trends—20 2.4 Water quality and agricultural practices—21
2.5 Number of farms in 2012—22
2.5.1 Number of farms where agricultural practices were determined—22 2.5.2 Number of farms where water quality was sampled—23
2.6 Representativeness of the sample—25 2.7 Description of farms in the sample—27
2.8 Characteristics of farms where water quality samples were taken—28
3 Results—31
3.1 Agricultural characteristics—31 3.1.1 Nitrogen use in livestock manure—31
3.1.2 Nitrogen and phosphate use compared to nitrogen and phosphate application standards—32
3.1.3 Crop yields—33 3.1.4 Nutrient surpluses—34 3.2 Water quality—36
3.2.1 Water leaching from the root zone, measured in 2012 (NO3, N and P)—36
3.2.2 Ditch water quality measurements in 2011-2012 (nitrogen and phosphorus)—38 3.2.3 Comparison with provisional figures for 2012 as reported—40
3.2.4 Provisional figures for measurement year 2013 (nitrogen and phosphorus)—40
4 Developments in monitoring results—43
4.1 Developments in agricultural practices—43 4.1.1 Developments in farm characteristics—43 4.1.2 Use of livestock manure—45
4.1.3 Use of fertilisers compared to application standards—45 4.1.4 Crop yields—47
4.1.5 Nutrient surpluses on the soil surface balance—49 4.2 Development of water quality—51
4.2.1 Development of average concentrations during 2007-2013 period—51 4.2.2 Effects of environmental factors and sample composition on nitrate
concentrations—53
4.3 Effects of agricultural practices on water quality—55 References—56
Appendix 1 Selection and recruitment of participants in the derogation monitoring network—61
Appendix 2 Monitoring of agricultural characteristics—67 Appendix 3 Sampling of water on farms in 2012—81
Appendix 4 Derogation monitoring network results by year—91
Summary
Introduction
The EU Nitrates Directive obligates member states to limit the use of nitrogen in livestock manure to a maximum of 170 kg of nitrogen per hectare per year. The Netherlands has requested the European Commission to issue an exemption from this obligation (this exemption is referred to as ‘derogation’ throughout this report). Dutch grassland farms cultivating at least 70 percent of their total area as grassland were in 2012 allowed to apply up to 250 kg of nitrogen per hectare in the form of manure from grazing livestock. The conditions attached to this exemption arrangement include an obligation for the Dutch government to set up a monitoring network comprising 300 farms that have registered for derogation (‘derogation farms’), and to submit annual reports to the European Commission.
The derogation monitoring network was set up by expanding the Minerals Policy Monitoring Programme (Landelijk Meetnet effecten Mestbeleid, LMM) of RIVM and LEI. A stratified random sampling method was used to select 300 farms, distributed as evenly as possible according to soil type (sand, loess, clay and peat), farm type (dairy farms and other grassland farms), and economic size. Of these 300 farms, 295 actually participated in the derogation scheme in 2012.
Agricultural practices in 2012
In 2012, the farms in the derogation monitoring network used an average of 239 kg of nitrogen from livestock manure per hectare of cultivated land. This is 11 kg less than the nitrogen application standard for livestock manure (250 kg per hectare). The total use of nitrogen (in the form of inorganic fertilisers and plant-available nitrogen from livestock manure) was 14 kg less than the total nitrogen application standard (257 kg per hectare on average). Phosphate use was slightly below the average phosphate application standard for farms in the derogation monitoring network (89 kg per hectare), taking account of the phosphate status of the soil.
The average nitrogen surplus on the soil surface balance in 2012 was calculated at 188 kg per hectare. This nitrogen surplus decreased in the following order: Peat > Clay > Sand > Loess. The phosphate surplus on the soil surface balance amounted to 9 kg of P2O5 per hectare on average.
Agricultural practices during the 2007-2012 period
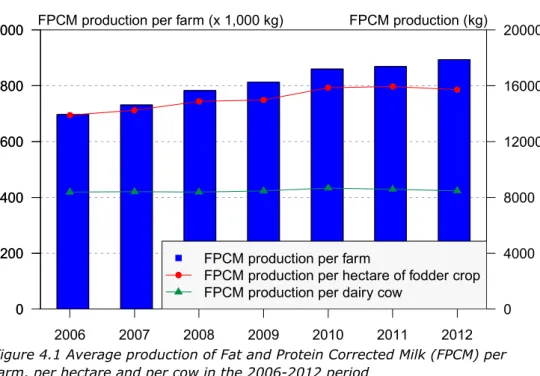
Milk production per farm, per hectare and per cow all increased during the 2007-2012 period. The area of cultivated land per farm also increased, but to a lesser extent than the milk production per farm. This indicates a slow, gradual increase in scale and intensification, resulting in higher milk production per cow and per hectare of fodder crop. Despite the increase in milk production per hectare of fodder crop, nitrogen production in livestock manure per hectare decreased, particularly after 2010.
The proportion of grassland has remained virtually stable, while the proportion of farms with grazing dairy cows slowly declined until 2011. The decrease in grazing in the September-October period was greater than the decrease in grazing throughout the entire May-October grazing period. The percentage of dairy farms with grazing animals in 2012 was comparable to the relevant percentage in 2011.
The percentage of farms with grazing animals and intensive livestock decreased. As a result, the average livestock density per hectare measured in Phosphate Livestock Units (LSUs) also decreased.
In 2012, the quantity of nitrogen produced in livestock manure was 14 kg per hectare lower than in 2011. The use of nitrogen in livestock manure remained virtually unchanged in the 2006-2012 period. The use of inorganic fertilisers also remained virtually constant. As a result of the higher statutory availability coefficient for nitrogen in livestock manure, the total use of plant-available nitrogen is increasing, but still remains below the total application standard for nitrogen. In 2012, the total release of plant-available nitrogen was a few kilogrammes below the level of 2011. This was caused by lower production of nitrogen in the form of manure per farm.
The application standard for phosphate decreased between 2006 and 2012. This was associated with a decrease in the use of phosphate, particularly in the form of inorganic phosphate-containing fertilisers.
The grass and silage maize crop yields (expressed in tonnes of dry matter per hectare) increased during the 2006-2012 period. The yield measured in kilogrammes of phosphate per hectare also rose. The grass yield measured in kilogrammes of nitrogen per hectare decreased between 2006 and 2012. This was caused by lower nitrogen contents in the grass in 2012 compared to previous years. As a result, the nitrogen yields in 2012 were lower than in previous years. The same applied to silage maize. In 2013, the nitrogen
contents in grass returned to a level comparable to that of the 2006-2011 period (Netherlands Laboratory for Soil and Crop Research, 2014).
The nitrogen surpluses on the soil surface balance fluctuated somewhat from year to year, but no overall increase or decrease took place during the
2006-2012 period. In 2012, both the nitrogen input (via feed products) and the nitrogen output (via animals and livestock manure) decreased compared to 2011. The phosphate soil surplus did decrease between 2006 and 2012, however. In 2012, the phosphate input (via feed products) and the phosphate output (via animals and manure) decreased as well. The decrease in the use of inorganic phosphate-containing fertilisers mainly took place in the 2006-2010 period. Both the nitrogen soil surpluses and the phosphate soil surpluses differ significantly between farms.
Water quality in 2012
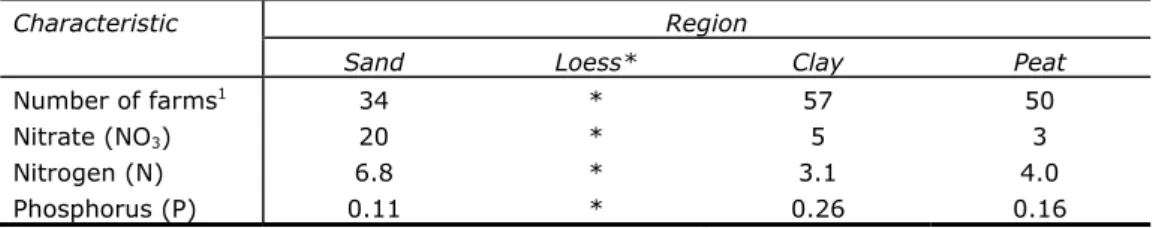
At 36 mg/l, the average nitrate concentration in groundwater in the Sand Region was below the nitrate standard of 50 mg/l. At 55 mg/l, the average nitrate concentration on farms in the Loess Region exceeded the standard. Nitrate concentrations in the Clay Region (10 mg/l) and the Peat Region (4 mg/l) were lower. In the Sand Region, nitrate concentrations were below the nitrate standard on 74 percent of all farms. In the Loess Region, this was the case on 47 percent of all farms. The percentage of farms with below-standard average nitrate concentrations was 100 percent in both the Clay Region and the Peat Region. The nitrate and nitrogen concentrations measured in ditch water were lower than the concentrations measured in water leaching from the root zone.
The highest phosphor concentrations in water leaching from the root zone were measured in the Peat Region (0.42 mg P/l), followed by the Clay Region
(0.34 mg P/l). The average phosphorus concentration in the Sand Region was 0.09 mg P/l, and below the detection threshold in the Loess Region.
Water quality in the 2007-2013 period
In 2013, the nitrate concentrations measured in water leaching from the root zone in the Sand, Clay and Peat Regions were lower than the average levels in previous years. This was not the case in the Loess Region. Concentrations in the Sand, Clay and Peat Regions decreased between 2007 and 2013. The three lowest nitrate concentrations were measured in the past three years. The decrease in nitrate concentrations was also observed in ditch water.
During the measurement period, phosphorus concentrations decreased in the Clay Region and increased in the Sand Region. During the measurement period, no trend change could be observed in the phosphorus concentrations in the other regions.
Relationship between agricultural practices and water quality
The nitrogen soil surpluses did not decrease or increase during the 2006-2012 period. However, the nitrate concentrations in groundwater did decrease during this period. Possible causes of this decrease may include after-effects of higher soil surpluses in the past or a decrease in grazing.
As a result of a decrease in the use of inorganic fertilisers in the 2006-2012 period, the phosphate surplus on the soil surface balance fell from 26 kg to 9 kg per hectare. During the measurement period, phosphorus concentrations in the Clay Region also decreased (possibly as a result of this).
1
Introduction
1.1 Background
The EU Nitrates Directive obligates member states to limit the use of nitrogen in livestock manure to a maximum of 170 kg of nitrogen per hectare per year (EU, 1991). A member state can request the European Commission for exemption from this obligation under certain conditions (this exemption is referred to as ‘derogation’ throughout this report). In December 2005, the European Commission issued the Netherlands with a derogation decision for the
2006-2009 period (EU, 2005). Under this decision, grassland farms cultivating at least 70 percent of their total area as grassland are allowed to apply on their total area up to 250 kg of nitrogen per hectare in the form of livestock manure originating from grazing livestock. In February 2010, the derogation decision was extended until the end of December 2013 (EU, 2010). The Dutch government is obligated to collect various data about the effects of the
derogation scheme, and to report these annually to the European Commission. This report has been prepared to fulfil this obligation under the derogation decision.
1.2 Fulfilment of obligations, approach
The present report together with the RVO.nl report (RVO.nl, 2014) fulfil the following obligations under the derogation decision (2005):
Article 8 Monitoring
8.1 Maps showing the percentage of grassland farms, percentage of livestock and percentage of agricultural land covered by individual derogation in each municipality, shall be drawn by the competent authority and shall be updated every year. Those maps shall be submitted to the Commission annually and for the first time in the second quarter of 2006.
This obligation is fulfilled in RVO.nl et al. (2014).
8.2 A monitoring network for sampling of soil water, streams and shallow groundwater shall be established and maintained as derogation monitoring sites. The monitoring network, corresponding to at least 300 farms benefiting from individual derogations, shall be representative of each soil type (clay, peat, sandy and sandy loessial soils), fertilisation practices and crop rotation. The composition of the monitoring network shall not be modified during the period of applicability of this Decision.
Chapter 2 describes the set-up of the derogation monitoring network.
8.3 Survey and continuous nutrient analysis shall provide data on local land use, crop rotations and agricultural practices on farms benefiting from individual derogations. Those data can be used for model-based
calculations of the magnitude of nitrate leaching and phosphorus losses from fields where up to 250 kg nitrogen per hectare per year in manure from grazing livestock is applied.
Section 3.1 (situation) and section 4.1 (trends) summarise the results of the 300 farms that participate in the derogation monitoring network. Appendix 5 presents the data of all derogation farms in the Netherlands, and discusses the differences between the two sets of results arising from a difference in approach.
8.4 Shallow groundwater, soil water, drainage water and streams in farms belonging to the monitoring network shall provide data on nitrate and phosphorus concentration in water leaving the root zone and entering the groundwater and surface water system.
Section 3.2 (situation) and section 4.2 (trends) provide data on the quality of ditch water and water leaching from the root zone on the 300 farms that participate in the derogation monitoring network.
8.5 A reinforced water monitoring shall address agricultural catchments in sandy soils.
Of the 300 farms in the planned sample, 160 farms are located in the Sand Region (also see section 2.4).
Article 9 Controls
9.1 The competent national authority shall carry out administrative controls in respect of all farms benefiting from an individual derogation for the assessment of compliance with the maximum amount of 250 kg nitrogen per hectare per year from grazing livestock manure, with total nitrogen and phosphate application standards and conditions on land use. 9.2 A programme of inspections shall be established based on risk analysis,
results of controls of the previous years and results of general random controls of legislation implementing Directive 91/676/EEC. Specific inspections shall address at least 5% of farms benefiting from an individual derogation with regard to land use, livestock number and manure production. Field inspections shall be carried out in at least 3% of farms in respect to the conditions set out in Article 5 and 6.
The results of these controls are included in RVO.nl et al. (2014). Article 10 Reporting
10.1 The competent authority shall submit the results of the monitoring, every year, to the Commission, with a concise report on evaluation practice (controls at farm level, including information on non compliant farms based on results of administrative and field inspections) and water quality evolution (based on root zone leaching monitoring,
surface/groundwater quality and model-based calculations). The report shall be transmitted to the Commission annually in the second quarter of the year following the year of activity. (Additional provision in the
extension of the derogation decision, EU, 2010)
The present report is the report referred to in the above article. Details of controls and instances of non-compliance are presented in RVO.nl et al. (2014).
10.2 In addition to the data referred to in paragraph 1 the report shall include the following:
(a) data related to fertilisation in all farms which benefit from an individual derogation;
(b) trends in livestock numbers for each livestock category in the Netherlands and in derogation farms;
(c) trends in national manure production as far as nitrogen and phosphate in manure are concerned;
(d) a summary of the results of controls related to excretion coefficients for pig and poultry manure at country level.
Section 3.1 (situation) and section 4.1 (trends) summarise the agricultural practice results of the 300 farms that participate in the derogation monitoring network. Appendix 5 presents the data of all derogation farms in
the Netherlands, and discusses the differences between the two sets of results arising from a difference in approach. The obligation referred to in
Article 10(2)(d) is fulfilled in RVO.nl et al. (2014).
10.3 The results thus obtained will be taken into consideration by the Commission with regard to an eventual new request for derogation by the Dutch authorities.
10.4 In order to provide elements regarding management in grassland farms, for which a derogation applies, and the achieved level of optimisation of management, a report on fertilisation and yield shall be prepared annually for the different soil types and crops by the competent authority and submitted to the Commission.
Section 3.1.3 provides the yields for grass and silage maize per hectare for the different soil regions on the 300 derogation farms. Section 3.1.3 provides the use of nitrogen from manure and fertilizer for crop type and soil region
1.3 Previously published reports and contents of this report
This is the eighth annual report setting out the results of the derogation monitoring network. It contains data on fertilisation, crop yields, nutrient surpluses and water quality.
The first report (Fraters et al., 2007b) was limited to a description of the derogation monitoring network, the progress made in 2006, and the design and content of the reports for the years 2008 to 2010 inclusive. The derogation monitoring network results have been published in the subsequent reports (Fraters et al., 2008; Zwart et al., 2009, 2010 and 2011; Buis et al., 2012; Hooijboer et al., 2013). Once results for multiple measurement years became available, the reports devoted increasing attention to the consideration of trends in agricultural practices and water quality.
Chapter 2 describes the design and implementation of the derogation monitoring network. It also details the agricultural characteristics of the participating farms (section 2.6). Section 2.7 describes the water quality sampling method, and the soil characteristics of the farms where water quality samples were taken.
Chapter 3 presents and discusses the measurement results of the agricultural practice and water quality monitoring for 2012. This chapter also contains the provisional water quality monitoring results for 2013 (see section 3.2.3). Chapter 4 describes developments related to agricultural practices and water quality, including a discussion of trend-based changes since the start of the derogation scheme, and a statistical analysis of the extent to which agricultural practice year 2012 differed from previous years. In addition, an assessment is provided concerning the effects of agricultural practices on water quality.
2
Design of the derogation monitoring network
2.1 Introduction
The design of the derogation monitoring network must satisfy the requirements of the European Commission, as stipulated in the derogation decision of
December 2005 and the extension of the derogation granted in 2010 (refer to section 1.3). Previous reports provided extensive details about the composition of the sample and the choices this entailed (Fraters and Boumans, 2005; Fraters
et al., 2007b).
During negotiations with the European Commission, it was agreed that the design of this monitoring network would tie in with the existing national network for monitoring the effectiveness of minerals policy, the Minerals Policy
Monitoring Programme (LMM). Water quality and agricultural practices at farms selected for this purpose have been monitored under this programme since 1992 (Fraters and Boumans, 2005). Additionally, it was agreed that all LMM
participants that satisfy the relevant conditions would be regarded as participants in the derogation monitoring network.
All agricultural practice data relevant to the derogation scheme were registered in accordance with the FADN system (Poppe, 2004). Appendix 2 provides a description of the monitoring of the agricultural characteristics and the
calculation methods for fertiliser use and nutrient surpluses. Water sampling on the farms was carried out in accordance with the standard LMM procedures (Fraters et al., 2004). This sampling method is explained in Appendix 3.
The set-up of the derogation monitoring network and the reporting of results are based on the division of the Netherlands into regions as used in the action programmes for the Nitrates Directive (EU, 1991). Four regions are
distinguished: the Sand Region, the Loess Region, the Clay Region and the Peat Region. The acreage of agricultural land in the Sand Region accounts for about 47 percent of the approx. 1.85 million hectares of agricultural land in the Netherlands (Statistics Netherlands Agricultural Census, data processed by LEI, 2012). The acreage of agricultural land in the Loess Region accounts for approx. 1.5 percent, in the Clay Region for approx. 41 percent, and in the Peat Region for approx. 10.5 percent of all agricultural land.
2.2 Change of method in 2013 and 2014
With effect from measurement year 2011 (Hooijboer et al., 2013), there have been some changes to the boundaries of the four regions that are reported on. As of measurement year 2011, the regional boundaries have been adjusted with retroactive effect for all years surveyed, including a recalculation of historical data sets. Another consequence of the new regional boundaries is that a number of farms are no longer included in the water quality report, because the samples at these farms were taken outside the period applicable to the new region (see section 2.4.2). Due to the new regional boundaries, minor differences have arisen between the trend data in the present reports and the trend data in the reports published prior to 2013. Hooijboer et al. (2013) explain the effects that this has on water quality and soil surpluses during the 2006-2012 period.
The same applies to the FADN calculation system used by LEI to determine soil surpluses. With effect from measurement year 2011, the calculation system was changed compared to previous years. An explanation of this adjustment is provided in Hooijboer et al. (2013). It turned out that the present report
required a correction of the nitrogen content in the roughage stocks on clay soils in 2007. As a result, the nitrogen soil surpluses in 2007 and 2008 were
recalculated. These surpluses therefore deviate from the surpluses presented in Hooijboer et al. (2013) for both years.
Other differences in nitrogen soil surpluses arose as a result of minor adjustments at farm level or because some farms dropped out. As a result, differences in nitrogen soil surpluses of more than 10 kg of nitrogen per hectare per year may arise for small groups of farms like those in the Peat and Loess Regions.
2.3 Statistical method used to determine deviations and trends
Determining deviations in the measurement year under consideration
The comparison aims to establish if there is a significant difference between the measurement year and the average for the preceding years. The significance was determined using the Restricted Maximum Likelihood procedure (REML method). The REML method is suitable for unbalanced data sets and therefore takes account of farms which ‘drop out’ and are replaced. The agricultural practice data were processed using the REML method available as part of the ‘linear mixed effects models procedure’ (MIXED method) in IBM SPSS Statistics (version 20). The water quality data were processed using the REML method in GenStat (14th edition; VSN International Ltd.).
The calculations were based on unweighted annual farm averages, i.e. the data were not corrected for farm acreage, size, etc. All available annual farm
averages were divided into two groups, with Group 1 comprising all the averages for the measurement year concerned, and Group 2 comprising all averages for the preceding years. The difference between Group 1 and Group 2 was then estimated as a so-called ‘fixed effect’, taking into account the fact that some data are not derived from the same farms (‘random effect’). A discussion of fixed and random effects may be found in standard statistical manuals on variance analysis, e.g. Kleinbaum et al. (1997) and Payne (2000). Welham et al. (2004) explain how to produce estimations with such models.
If the results for the most recent measurement year deviate significantly from the average of the preceding years (p < 0.05), the direction of the deviation compared to previous years is indicated by a plus sign (+) or minus sign (-). If there is no significant difference (p > 0.05), this is indicated by the
‘approximately equal’ sign (≈). These symbols may be found in the ‘Difference’ column in the overview tables (e.g. Appendix 4, Table A4.1B). The main text of this report only makes mention of differences if they are significant.
Determination of trends
The data were also analysed to identify any trends during the measurement period. The REML method with annual groups was used for this purpose as well. Only significant trend changes (p < 0.05) will be considered.
2.4 Water quality and agricultural practices
The water quality levels measured in any year partly reflect agricultural practices in the year preceding the water quality monitoring and agricultural practices in previous years. The extent to which agricultural practices in previous years affect the water quality measurements depends on various factors, including (fluctuations in the) precipitation surplus during that year and local hydrological conditions. In the High Netherlands, it is assumed that agricultural practices affect water quality at least one year later. In the Low Netherlands, the impact of agricultural practices on water quality is quicker to materialise. This difference in hydrological conditions (rate of leaching) also explains the different sampling methods and sampling periods employed in the Low and the High Netherlands (see Appendix 3).
In the Low Netherlands, water quality is determined in the winter following the year in which the agricultural practices were determined. The ‘Low Netherlands’ comprises the Clay and Peat Regions, as well as those parts of the Sand Region that are drained by means of ditches, possibly in combination with drainage pipes or surface drainage. The ‘High Netherlands’ comprises the other parts of the Sand Region, and the Loess Region. In the Sand Region, groundwater is sampled in the summer following the year in which agricultural practices were determined. In the Loess Region, soil moisture samples are taken in the autumn following the year in which agricultural practices were determined (see
Appendix 3).
This means that water quality samples for measurement year 2012 can be related to agricultural practices in 2011 (see Table 2.1). Water quality samples for measurement year 2012 were taken during the winter of 2011/2012 in the Low Netherlands, and during the summer and autumn of 2012 in the High Netherlands.
The present report includes water quality sampling results for measurement year 2013, which can be related to agricultural practices in 2012 (see
Table 2.1). These water samples were taken in the winter of 2012-2013 in the Low Netherlands, and in the summer of 2013 in the High Netherlands. The results for the Loess Region from sampling carried out in the autumn of 2013 are not yet available, and the other data are regarded as provisional because not all the required quality controls have been completed at this time. The definitive figures will be reported in 2015, at which time the 2013 data for the Loess Region will also be available and finalised.
Table 2.1 Overview of data collection periods for the presented monitoring results on agricultural practices and water quality
Report Agricultural practices Water quality2
Clay and Peat Regions Sand Region Loess Region Hooijboer et
al., 2013 2011 2011/2012 provisional2010/2011 final, 2012 provisional2011 final, 2012/2013 not yet available 2011/2012 final Hooijboer et
al., 20141 2012 2012/2013 provisional2011/2012 final, 2013 provisional2012 final, 2013/2014 not yet available 2012/2013 final
1 Present report
2 The provisional figures can be related to the agricultural practice data presented in the same report.
2.5 Number of farms in 2012
2.5.1 Number of farms where agricultural practices were determined
Although the derogation monitoring network is a permanent network, a number of farms ‘drop out’ every year because they are no longer participating in the LMM programme. It is also possible that agricultural practices could not be reported due to incomplete data on nutrient flows. Incomplete nutrient flow data may be caused by the presence on the farm of animals owned by other parties, so that data on the input and output of feedstuffs, animals and manure is by definition incomplete. In addition, other administrative errors may have been made when registering inputs and/or outputs. However, water quality samples have been taken in these cases.
Agricultural practices were successfully established at 298 of the 300 planned farms. Of these 298 farms, 295 actually participated in the derogation scheme. Seventeen farms that participated in the derogation monitoring network in 2011 have since dropped out. These farms have therefore been replaced.
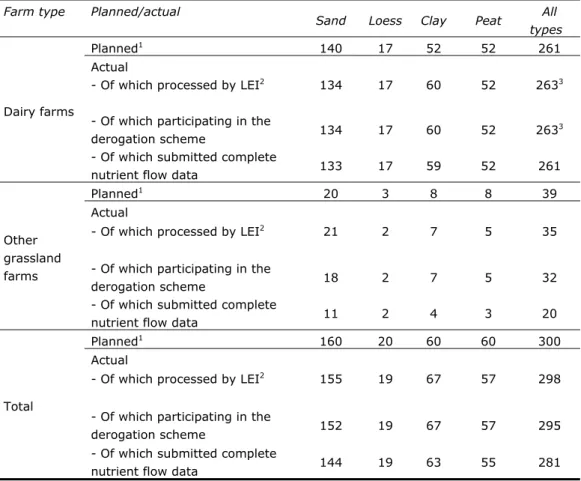
Table 2.2 Planned and actual number of analysed dairy and other grassland farms per region in 2012 (agricultural practices)
Farm type Planned/actual
Sand Loess Clay Peat All
types
Dairy farms
Planned1 140 17 52 52 261
Actual - Of which processed by LEI2 134 17 60 52 2633
- Of which participating in the
derogation scheme 134 17 60 52 2633
- Of which submitted complete
nutrient flow data 133 17 59 52 261
Other grassland farms
Planned1 20 3 8 8 39
Actual - Of which processed by LEI2 21 2 7 5 35
- Of which participating in the
derogation scheme 18 2 7 5 32
- Of which submitted complete
nutrient flow data 11 2 4 3 20
Total
Planned1 160 20 60 60 300
Actual
- Of which processed by LEI2 155 19 67 57 298
- Of which participating in the
derogation scheme 152 19 67 57 295
- Of which submitted complete
nutrient flow data 144 19 63 55 281
1 As determined based on old regional boundaries
2 As determined based on new regional boundaries
3 The actual sample differs from the planned sample due to changes in regional boundaries and
The various sections of this report describe agricultural practices based on the following numbers of farms:
The description of general farm characteristics (section 2.5) concerns all farms that could be fully processed in FADN in 2012, and that
participated in the derogation scheme (295 farms).
The description of agricultural practices in 2012 (section 3.1) concerns all farms for which a full picture of nutrient flows could be obtained from FADN data (281 farms).
The comparison of agricultural practices in the 2006-2012 period (section 4.1) concerns all farms that participated in the derogation monitoring network in the respective years. This number varies from year to year (see Appendix 4, Table A4.2A).
2.5.2 Number of farms where water quality was sampled
In 2012, water quality was sampled on 299 farms (see Table 2.3). Of these 299 farms, 283 participated in the derogation monitoring network in 2012. The difference of sixteen farms is caused by the fact that no samples could be taken at new farms in 2012 due to changes in the derogation monitoring network. The sixteen farms that have dropped out have been used to determine trends in water quality, however. Of the remaining 283 farms, a further eleven farms dropped out because they could not be included in the reports after the new regional boundaries were introduced. Samples at these farms were previously taken in summer, and the farms were then reassigned to a region where samples are taken only in winter (i.e. the Clay and Peat Regions). Furthermore, three farms did not qualify for participation or did not actually participate in the derogation scheme. It is unknown if two farms qualified for participation or actually participated in the derogation scheme, since these farms are not included in FADN. The water quality sampling results of the remaining 267 sampled farms are presented in this report.
Table 2.3 Planned and actual number of analysed dairy and other grassland farms per region in 2012 (water quality)
Farm type Planned/actual
Sand Loess Clay Peat All
types Dairy farms Planned1 140 17 52 52 261 Actual - Sampled2 133 18 63 49 263 - Derogation monitoring network 20123 124 17 61 48 250
- Included after changes to
regional boundaries 124 17 52 46 239 - Participated in derogation scheme 122 17 51 46 236 Other grassland farms Planned1 20 3 8 8 39 Actual - Sampled2 21 2 8 5 36 - Derogation monitoring network 20123 19 2 7 5 33
- Included after changes to
regional boundaries 19 2 7 5 33 - Participated in derogation scheme 17 2 7 5 31 Total Planned1 160 20 60 60 300 - Sampled2 153 19 71 54 299 - Derogation monitoring network 20123 143 19 68 53 283
- Included after changes to
regional boundaries 143 19 59 51 272 - Participated in derogation
scheme 139 19 58 51 267
1 As determined based on old regional boundaries
2 As determined based on new regional boundaries
3 Samples are often taken at farms before the composition of the monitoring network is known (i.e.
after certain farms have dropped out). The farms that have dropped out are used to determine trends, however.
This report details the water quality on the following numbers of farms: The description of the water quality results for measurement year 2012
(section 3.2) concerns all farms where water quality samples were taken in 2012 and that qualified for participation in the derogation scheme in 2012 (267 farms).
The description of the water quality results for measurement year 2013 (section 3.2) concerns all farms participating in the derogation monitoring network in 2012 (excluding farms in the Loess Region) where water quality samples were taken in measurement year 2013 (280 farms). In
measurement year 2013, the sampling procedure was adjusted to the new regional boundaries to ensure that farms switching regions would no longer ‘drop out’.
The analysis of water quality levels during the 2007-2013 period (section 4.2) concerns all farms that participated in the derogation
measurement year, and that were entitled to derogation in that previous year. This number varies from year to year (see Table 2.4).
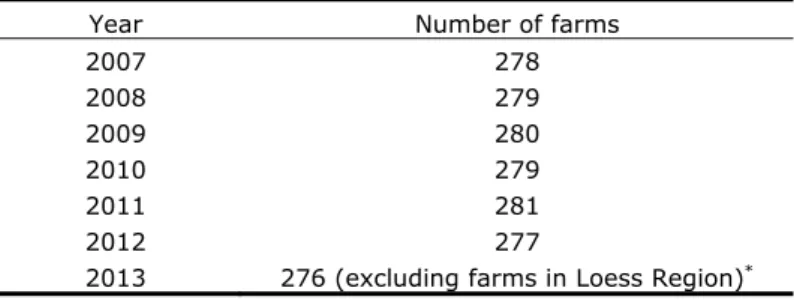
Table 2.4 Number of farms per year used to determine water quality trends (the farms qualified for participation in the derogation scheme prior to the year when samples were taken)
Year Number of farms
2007 278 2008 279 2009 280 2010 279 2011 281 2012 277 2013 276 (excluding farms in Loess Region)*
* In 2013, the sampling procedure was adjusted to the new regional boundaries to ensure that farms switching regions would no longer ‘drop out’.
Depending on the soil type region, water leaching from the root zone
(groundwater, drain water or soil moisture) and/or ditch water is sampled (see Table 2.5).
Table 2.5 Number of sampled and reported farms1 per sub-programme and per
region in 2012 and 2013, and sampling frequency of leaching water (LW) and ditch water (DW) (the target sampling frequency is stated in parentheses)
Year Sand Loess Clay Peat Total
2012 Number of farms 139 19 58 51 267
Number of farms – Leaching
water 138 19 58 51
266 Number of farms – Ditch
water 34 - 57 50
141 LW sampling frequency 1.0 (1) 1.0 (1) 3.0 (2-4)1 1.0 (1)
DW sampling frequency 4.0 (4) - 4.0 (4) 4.3 (4-5)
2013 Number of farms 155 -* 68 57 280
Number of farms – Leaching
water 154 -* 68 57
279 Number of farms – Ditch
water 35 - 67 56
158 LW sampling frequency 1.0 (1) -* 3.4 (2-4) 1.0 (1)
DW sampling frequency 3.8 (4) - 4.0 (4) 4.1 (4-5)
1 In the Clay Region, groundwater is sampled up to two times and drainage water up to four times,
depending on the type of farm. Therefore, the average total number of samples will always be between two and four, depending on the proportion of farms with groundwater sampling versus farms with drainage water sampling.
* In the Loess Region, samples were taken at twenty derogation farms during the autumn of 2013. These sample results were not yet available when this report was compiled.
2.6 Representativeness of the sample of farms
In 2012, 295 farms are known to have registered for derogation. These farms had a combined total acreage of 16,337 hectares, accounting for 2.0 percent of all agricultural land on grassland farms in the Netherlands, see Table 2.6). The sample represents 85 percent of the farms and 96 percent of the acreage of all farms that registered for derogation in 2012 and satisfied the LMM selection
criteria (refer to Appendix 1). Farms not included in the sample population and that did register for derogation are mainly other grassland farms with a size of less than 25,000 Standard Output (SO) units.
Furthermore, it is noteworthy that in all regions the proportion of sampled to total acreage is greater on dairy farms than on other grassland farms. During the selection and recruitment process, the required number of farms to be sampled for each farm type is derived from the share in the total acreage of cultivated land. On average, the other grassland farms included are slightly smaller than the dairy farms in terms of their acreage of cultivated land. The Loess Region is relatively small and therefore does not have many derogation farms in the sample population. Consequently, a relatively large proportion of farms (15.7 percent) is included in the monitoring network.
Table 2.6 Area of cultivated land (in hectares) included in the derogation monitoring network compared to the total area of cultivated land on derogation farms in 2012 in the sample population, according to the 2012 Agricultural Census
Sample
population1 Derogation monitoring network
Region Farm type Area (hectares)
Area (hectares) Percentage of acreage of total sample population
Sand Dairy farms 339,113 7,261 2.1%
Other grassland farms
49,490 603 1.2%
Total 388,603 7,864 2.0%
Loess Dairy farms 4,617 776 16.8%
Other grassland farms
688 58 8.4%
Total 5,305 834 15.7%
Clay Dairy farms 232,148 3,889 1.7%
Other grassland farms
28,752 152 0.5%
Total 260,899 4,041 1.5%
Peat Dairy farms 134,100 3,403 2.5%
Other grassland farms
13,242 195 1.5%
Total 147,343 3,598 2.4%
All
types Dairy farms
709,978 15,329 2.2%
Other grassland farms
92,172 1,008 1.1%
Total 802,150 16,337 2.0%
1 Estimate based on the 2012 Agricultural Census performed by Statistics Netherlands, data processed
2.7 Description of farms in the sample
The 295 farms which are known to have registered for derogation in 2012 had an average of 55 hectares of cultivated land, of which 83 percent was comprised of grassland. The average livestock density was 2.27 Phosphate Livestock Units (LSUs) per hectare (see Table 2.7). Farm data derived from the 2012
Agricultural Census have been included for purposes of comparison, in so far as these farms were included in the sample population (Appendix 1).
From the comparison of the structural characteristics of the population of sampled farms and the Agricultural Census data (Table 2.8), we can conclude that the population of sampled farms is representative of the Agricultural Census sample population, despite some minor differences.
Table 2.7 Overview of a number of general characteristics in 2012 of farms participating in the derogation monitoring network (DMN), compared to average values for the Agricultural Census (AC) sample population
Farm characteristic1 Populati
on
Sand Loess Clay Peat All
type s
Number of farms in DMN DMN 152 19 67 57 295
Grassland area (hectares) DMN 40 32 50 56 45
AC 33 31 45 43 38
Area used to cultivate silage maize (hectares)
DMN
10.4 9.6 8.2 6.8 9.2 AC 7.8 7.7 5.2 3.7 6.4 Other arable land (hectares) DMN 1.0 2.1 1.8 0.1 1.1 AC 0.5 1.6 1.0 0.3 0.6 Total area of cultivated land (hectares) DMN 52 44 60 63 55
AC 41 40 51 47 45
Percentage of grassland DMN 79 74 86 91 83
AC 81 78 89 94 85
Natural habitat (hectares) DMN 1.3 2.1 1.8 1.1 1.4 AC 0.9 1.8 1.3 1.2 1.1 Grazing livestock density (Phosphate
Livestock Units per hectare)2
DMN
2.31 2.41 2.24 2.14 2.27
AC 2.27 2.24 2.04 1.98 2.15
Percentage of farms with intensive livestock DMN 7 11 1 11 6
(%) AC 10 3 5 5 8
Specification of livestock density on farms participating in derogation monitoring network (Phosphate Livestock Units per hectare)1
Dairy cattle (including young livestock) DMN 2.22 2.20 2.09 2.03 2.16 Other grazing livestock DMN 0.08 0.21 0.16 0.11 0.11 Intensive livestock (total) DMN 0.63 0.02 0.00 0.20 0.37 All animals (total) DMN 2.94 2.43 2.25 2.34 2.63 Source: FADN and Statistics Netherlands Agricultural Census 2012 (data processed by LEI).
1 Surface areas are expressed in hectares of cultivated land; natural habitats have not been included.
2 Phosphate Livestock Unit (LSU) is a standard used to compare numbers of animals based on their
standard phosphate production (Ministry of Agriculture, Nature & Food Quality, 2001). The standard phosphate production of one dairy cow is equivalent to one Phosphate Livestock Unit.
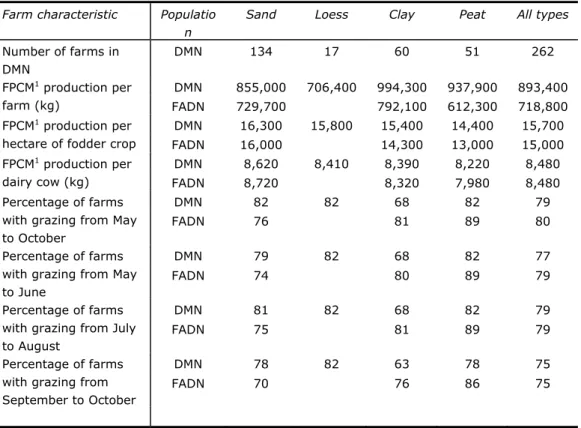
The weighted average of the national FADN sample has been used to ascertain the extent to which the characteristics of dairy farms participating in the derogation monitoring network deviate from those of other dairy farms. The Agricultural Census does not include appropriate data for comparison. The comparison (see Table 2.8) shows that in all regions, the dairy farms
participating in the derogation monitoring network have a larger acreage and produce more milk per farm than the weighted national average. A similar comparison has not been performed for the Loess Region due to an insufficient number of FADN-registered farms. The average milk production per hectare and per dairy cow on dairy farms participating in the derogation monitoring network differed little from the national FADN average.
Table 2.8 Average milk production and grazing periods on dairy farms
participating in the derogation monitoring network (DMN) in 2012, compared to the weighted average for dairy farms in the national FADN sample
Farm characteristic Populatio n
Sand Loess Clay Peat All types
Number of farms in DMN DMN 134 17 60 51 262 FPCM1 production per farm (kg) DMN 855,000 706,400 994,300 937,900 893,400 FADN 729,700 792,100 612,300 718,800 FPCM1 production per
hectare of fodder crop
DMN 16,300 15,800 15,400 14,400 15,700 FADN 16,000 14,300 13,000 15,000 FPCM1 production per dairy cow (kg) DMN 8,620 8,410 8,390 8,220 8,480 FADN 8,720 8,320 7,980 8,480 Percentage of farms with grazing from May to October
DMN 82 82 68 82 79 FADN 76 81 89 80 Percentage of farms
with grazing from May to June
DMN 79 82 68 82 77 FADN 74 80 89 79 Percentage of farms
with grazing from July to August
DMN 81 82 68 82 79 FADN 75 81 89 79 Percentage of farms
with grazing from September to October
DMN 78 82 63 78 75 FADN 70 76 86 75
1 FPCM = Fat and Protein Corrected Milk, a standard used to compare milk with different fat and protein
contents (1 kg of FPCM is defined as 1 kg of milk with 4.00 percent fat content and 3.32 percent protein content).
2.8 Characteristics of farms where water quality samples were taken
The sampled farms were distributed across the four soil type regions (see Figure 2.1). The map divides the Sand Region into three sub-regions: North, Central and South. The farm density is higher in the Loess Region. The reason for this is that at least fifteen farms must be sampled in order to draw properly
substantiated conclusions (Fraters and Boumans, 2005). The map also makes a distinction between dairy farms and other grassland farms.
Figure 2.1 Locations of the 283 grassland farms with reported data in 2012 where water samples were taken for derogation monitoring purposes
Within a particular region, other soil types occur in addition to the main soil type for which the region is named (see Table 2.9 and Table 2.10). The Loess Region mainly consists of soils with good drainage, whereas the Peat Region mainly consists of soils with poor drainage. The well-drained soils in the Sand Region are under-represented in the derogation monitoring network. Traditionally, the best soils (with favourable drainage conditions and nutrient status) were used for arable farming, while poorer (i.e. wetter) soils were used for dairy farming. In addition, the driest soils in the Sand Region are often not used for agricultural purposes. Wetter sandy soils are therefore overrepresented in the derogation monitoring network. The differences in soil type and drainage class in the derogation monitoring network between 2012 and 2013 are minimal.
Table 2.9 Relative distribution (in percentages) of soil types and drainage classes in the different regions, for derogation farms where samples were taken in 2012
Region Soil type Drainage class1
Sand Loess Clay Peat Poor Moderate Good
Sand 87 0 5 8 40 51 9
Loess 1 80 19 0 1 3 96
Clay 5 0 92 4 45 51 4
Peat 11 0 28 61 95 5 0
1 The drainage class is linked to the water table class (Grondwatertrap, Gt). The ‘Poor natural drainage’
class comprises water table class Gt I through Gt IV, the ‘Moderate drainage’ class comprises water table class Gt V, Gt V* and Gt VI, and the ‘Good drainage’ class comprises water table class Gt VII and Gt VIII.
Table 2.10 Relative distribution (in percentages) of soil types and drainage classes in the different regions, for derogation farms where samples were taken in 2013
Region Soil type Drainage class1
Sand Loess Clay Peat Poor Moderate Good
Sand 86 0 6 8 39 50 10
Loess * * * * * * *
Clay 5 0 92 3 46 49 5
Peat 13 0 27 60 94 5 0
1 The drainage class is linked to the water table class (Grondwatertrap, Gt). The ‘Poor natural drainage’
class comprises water table class Gt I through Gt IV, the ‘Moderate drainage’ class comprises water table class Gt V, Gt V* and Gt VI, and the ‘Good drainage’ class comprises water table class Gt VII and Gt VIII.
3
Results
3.1 Agricultural characteristics
3.1.1 Nitrogen use in livestock manure
In 2012, the average use of nitrogen in livestock manure on derogation farms (including manure excreted during grazing) was approx. 11 kg per hectare below the livestock manure application standard of 250 kg per hectare (see Table 3.1). In all regions, less nitrogen in livestock manure was applied on arable land (mainly land used for cultivation of silage maize) than on grassland. The farms in the monitoring network both import and export livestock manure. As the average production exceeded the permitted use, the average manure outputs exceeded the inputs (including stock changes). This applied to all regions (see Table 3.1). On average, the use of livestock manure in 2012
(including rounding-off differences) exceeded the 2011 levels by 7 kg of nitrogen per hectare (see Appendix 4, Table A4.2A).
Table 3.1 Average nitrogen use in livestock manure (in kg of nitrogen per hectare) in 2012 on farms participating in the derogation monitoring network (regional averages)
Description Sand Loess Clay Peat All types
Number of farms 144 19 63 55 281 Produced on farm1 270 265 253 259 263 + Inputs 11 9 14 7 11 + Changes in stocks2 -5 -3 -5 -5 -5 - Outputs 37 25 24 23 30 Total 239 246 238 237 239
Use on arable land3 178 172 154 193 175
Use on grassland3 256 266 251 244 253
1 Calculated on the basis of standard quantities (N=175), with the exception of dairy farms that
indicated they were using the guidance document on farm-specific excretion by dairy cattle (N=106) (see Appendix 2).
2 A negative change in stocks is a stock increase and corresponds to output.
3 The average use data and the application standards for grassland and arable land are based on
268 farms and 203 farms, respectively, instead of on 281 farms. This is because on 13 farms, the allocation of fertilisers to arable land exceeded the upper limit or fell below the lower limit (see Appendix 2, Table A2.1; this can happen if the allocation of fertiliser use to grassland and arable land is not possible), and because 65 farms had no arable land.
Almost 25 percent of all farms in the monitoring network did not import or export livestock manure (see Table 3.2). Nearly 25 percent of all farms only imported livestock manure and did not export it. These farmers were probably of the opinion that importing nutrients in livestock manure offered economic benefits compared to using inorganic fertilisers. This may also apply to the farmers who both imported and exported livestock manure (14 percent).
Table 3.2 Percentage of farms participating in the derogation monitoring network with livestock manure inputs and/or outputs in 2012 (regional
averages)
Description Sand Loess Clay Peat All types
No inputs or outputs 17 16 30 29 22
Only outputs 44 47 35 36 41
Only inputs 23 21 21 25 23
Both inputs and outputs 15 16 14 9 14
3.1.2 Nitrogen and phosphate use compared to nitrogen and phosphate application standards
In 2012, the calculated total use of plant-available nitrogen at farm level on farms participating in the derogation monitoring network was lower than the nitrogen application standard in all regions except the Loess Region, where the total use was approximately equal to the application standard (see Table 3.3).
Table 3.3 Average use of nitrogen in fertilisers (expressed in kg of
plant-available nitrogen per hectare)1 on farms participating in the derogation
monitoring network in 2012 (regional averages)
Description Item Sand Loess Clay Peat All
types
Number of farms 144 19 63 55 281
Average statutory availability coefficient for livestock manure (%)
49 49 51 48 49 Fertiliser use Livestock manure 117 120 122 115 118
Other organic fertilisers 0 0 0 0 0 Inorganic fertilisers 119 118 146 122 125 Total average fertiliser use 236 237 268 237 243
Nitrogen application
standard 239 235 295 271 257
Use of plant-available nitrogen on arable land2 122 137 125 130 125
Application standard for arable land2 141 146 153 152 145
Use of plant-available nitrogen on grassland2 270 259 293 250 271
Application standard for grassland2 266 264 318 283 281
1 Calculated on the basis of the applicable statutory availability coefficients (see Appendix 2).
2 The average use data and the application standards for grassland and arable land are based on
268 farms and 203 farms, respectively, instead of on 281 farms. This is because on 13 farms, the allocation of fertilisers to arable land exceeded the upper limit or fell below the lower limit (see Appendix 2, Table A2.1; this can happen if the allocation of fertiliser use to grassland and arable land is not possible), and because 65 farms had no arable land.
In 2012, the average total use of phosphate on farms participating in the derogation monitoring network was slightly lower than the average application standard of 89 kg of phosphate per hectare (see Table 3.4). On average nearly 97 percent of phosphate was applied in the form of livestock manure.
Table 3.4 Average use of phosphate in fertilisers (in kg of P2O5 per hectare) in
2012 on farms participating in the derogation monitoring network (regional averages)
Description Item Sand Loess Clay Peat All
types
Number of farms 144 19 63 55 281
Fertiliser use Livestock manure 83 88 86 82 84
Other organic fertilisers 0 0 1 0 0
Inorganic fertilisers 3 6 3 2 3
Total average fertiliser use 87 94 89 84 87
Phosphate application
standard4 87 86 91 91 89
Use of phosphate on arable land1,2 75 78 74 82 76
Application standard for arable land1 68 66 70 68 68
Use of phosphate on grassland1,3 91 99 91 86 90
Application standard for grassland1 92 93 94 93 93
1 The average use data and the application standards for grassland and arable land are based on
268 farms and 203 farms, respectively, instead of on 281 farms. This is because on 13 farms, the allocation of fertilisers to arable land exceeded the upper limit or fell below the lower limit (see Appendix 2, Table A2.1; this can happen if the allocation of fertiliser use to grassland and arable land is not possible), and because 65 farms had no arable land.
2 Phosphate use on arable land is reported by the dairy farmer.
3 Grassland usage levels are calculated by deducting the quantity applied on arable land from the total
quantity applied.
4 The phosphate application standard for a farm depends on the crop (grass or maize) and the fertility
of the soil (low-neutral-high).
3.1.3 Crop yields
In 2012, farms participating in the derogation monitoring network had an estimated average dry-matter yield of silage maize of 16,900 kg per hectare, resulting in an estimated average yield of 180 kg of nitrogen and 31 kg of phosphorus (72 kg of P2O5). Yields in the Clay Region, Loess Region and Sand
Region slightly exceeded the national average, while yields in the Peat Region were below the national average (Table 3.5).
The calculated grassland dry-matter yield amounted to nearly 65 percent of the estimated silage maize yield. However, both the nitrogen and phosphorus yields per hectare were higher due to higher nitrogen and phosphorus contents in grass. The calculated grassland dry-matter yields were highest in the Clay Region.
Table 3.5 Average crop yields (in kg of dry matter, nitrogen, phosphorus and P2O5 per hectare) for silage maize (estimated) and grassland (calculated) in
2012, on farms participating in the derogation monitoring network that meet the criteria for application of the calculation method (Aarts et al., 2008) (regional averages)
Description Sand Loess Clay Peat All types
Silage maize yields
Number of farms 103 7 27 23 160
Kilogrammes of dry matter per hectare 17,000 17,100 17,500 15,800 16,900 Kilogrammes of nitrogen per hectare 179 192 191 165 180 Kilogrammes of phosphorus per hectare 31 32 35 29 31 Kilogrammes of P2O5 per hectare 71 73 80 67 72
Grassland yields
Number of farms 118 9 48 43 218
Kilogrammes of dry matter per hectare 10,600 10,800 11,200 10,700 10,800 Kilogrammes of nitrogen per hectare 258 261 262 261 259 Kilogrammes of phosphorus per hectare 39 39 41 38 39 Kilogrammes of P2O5 per hectare 90 89 93 87 90
3.1.4 Nutrient surpluses
The average nitrogen surplus on the soil surface balance of farms in the derogation monitoring network amounted to 188 kg per hectare in 2012 (Table 3.6). In 2012, both inputs (nitrogen via feed products and manure) and outputs (nitrogen via animals and manure) were lower than in 2011 (see Table A4.6 in Appendix 4). The variation in nitrogen surpluses on the soil surface balance was considerable. The 25 percent of farms with the lowest surpluses realised a surplus of less than 138 kg of nitrogen per hectare, whereas the surplus exceeded 224 kg of nitrogen per hectare on the 25 percent of farms with the highest surpluses. A possible explanation may be that farmers with a low nitrogen soil surplus are able to effectively integrate environmental aims into their farm management practices (Van den Ham et al., 2010). Farms with a low surplus may also have relatively high crop yields, whereas farms with a high surplus may have soils producing relatively low yields.
Table 3.6 Nitrogen surpluses on the soil surface balance (in kg of nitrogen per hectare) on farms in the derogation monitoring network in 2012 (average values and 25th and 75th percentile values per region)
Description Item Sand Loes
s
Clay Peat All types Number of
farms
144 19 63 55 281
Farm inputs Inorganic fertilisers 119 118 146 122 125 Livestock manure and other
organic fertilisers 11 6 15 6 10 Feedstuffs 217 176 158 172 192 Animals 2 1 2 2 2 Other 2 2 2 1 2 Total 350 303 323 303 332
Farm outputs Milk and other animal products 83 71 74 78 79
Animals 25 12 11 14 19
Livestock manure 41 26 29 27 34
Other 21 29 21 14 20
Total 170 138 135 132 153
Average nitrogen surplus per farm 180 166 187 171 179 + Deposition, mineralisation and organic nitrogen
fixation
43 41 42 1241 58
- Gaseous emissions2 48 48 51 52 50
Average nitrogen surplus on soil surface balance3 174 159 179 242 188
Nitrogen surplus on soil surface balance, 25th percentile
125 150 152 145 138 Nitrogen surplus on soil surface balance,
75th percentile
218 220 243 272 224
1 Based on the assumption that an additional 160 kg of nitrogen mineralises from organic matter on
peat soil
2 Gaseous emissions resulting from stabling, storage, application and grazing
3 Calculated in accordance with method described in Appendix 2
The average phosphate surplus on the soil surface balance was 9 kg per hectare (see Table 3.7). In 2012, both inputs (phosphate via feed products and manure) and outputs (phosphate via animals and manure) were lower than in 2011 (see Table A4.8 in Appendix 4). The 25 percent of farms with the lowest phosphate surpluses realised a surplus of less than -1 kg per hectare (0 kg/ha = balance), whereas the surplus exceeded 20 kg per hectare on the 25 percent of farms with the highest surpluses. As in the case of nitrogen soil surpluses, these differences could be explained by the assumption that farmers with a low phosphate soil surplus are able to effectively integrate environmental aims into their farm management practices (Van den Ham et al., 2010). Additionally, some of these farms may have relatively high crop yields, while farms with a high surplus may have soils producing relatively low yields.
Table 3.7 Phosphate surpluses on the soil surface balance (in kg of P2O5 per
hectare) on farms in the derogation monitoring network in 2012 (average values and 25th and 75th percentile values per region)
Description Item San
d Loes s Cla y Pea t All types Number of farms 144 19 63 55 281
Farm inputs Inorganic fertilisers 3 6 3 2 3 Livestock manure and other organic
fertilisers 5 3 7 3 5 Feedstuffs 75 59 52 60 66 Animals 1 1 1 1 1 Other 0 1 0 0 0 Total 85 69 64 66 75
Farm outputs Milk and other animal products 33 29 30 30 31
Animals 13 8 8 9 11
Organic fertilisers 18 10 12 14 15
Other 9 11 9 7 9
Total 73 58 58 60 66
Average phosphate surplus on soil surface balance1 12 11 5 6 9
Phosphate surplus on soil surface balance, 25th percentile
-2 -6 1 0 -1 Phosphate surplus on soil surface balance,
75th percentile
19 14 23 19 20
1 Calculated in accordance with method described in Appendix 2
3.2 Water quality
3.2.1 Water leaching from the root zone, measured in 2012 (NO3, N and P)
In 2012, the average nitrate concentrations in the Sand Region, Clay Region and Peat Region were below the nitrate standard of 50 mg/l (see Table 3.8). The average nitrate concentration in the Loess Region was 55 mg/l. Although nitrate concentrations in the Peat Region were lower than in the Clay Region, the total nitrogen concentration was higher. This is caused by higher ammonium
concentrations in groundwater in the Peat Region. The higher ammonium concentrations are probably due to nutrient-rich peat layers (Van Beek et al., 2004) in which nitrogen is released in the form of ammonium due to the decomposition of organic matter (Butterbach-Bahl and Gundersen, 2011).
Groundwater that is or has been in contact with nutrient-rich peat layers often has high phosphorus concentrations (Van Beek et al., 2004). These nutrient-rich peat layers may also partly cause the higher average phosphorus concentrations measured in the Peat and Clay Regions compared to the concentrations
measured in the Sand Region. In addition, phosphate ions are easily adsorbed by iron and aluminium (hydr)oxides and clay minerals, particularly under acidic circumstances such as those occurring in the Sand Region. Phosphate also readily precipitates in the form of poorly soluble aluminium, iron and calcium phosphates.