Netherlands Environmental Assessment Agency, August 2009
Uncertainty in the
Netherlands’
green-house gas emissions
inventory
Estimation of the level and trend uncertainty
using the IPCC Tier 1 approach
IPCC Tier-1: suitable method for greenhouse gas emission uncertainty estimates
The Netherlands signed the United Nations Framework Conven-tion on Climate Change (UNFCCC), and, therefore, is bound to report its greenhouse gas emissions, annually in a National Inventory Report (NIR). Within the framework of this NIR, an annual uncertainty assessment is made for both national total annual emissions and the trend, from the base year 1990 (1995 for F-gases) to the current year. The present report documents uncertainty estimates in the assessment performed for the NIR 2006 and (minor) updates made in the later submissions (2007 and 2008).
Uncertainty estimates were made using the simplified IPCC Tier 1 uncertainty analysis following the Intergovernmental Panel on Climate Change (IPCC) Good practice Guidance. In addition, assumptions and results of two more comprehensive analyses are presented in this report, based on IPCC Tier 2 Monte Carlo assessments. These Tier 1 and Tier 2 assessments were used for identifying areas for improvement within the emissions inventory. Both studies showed that Tier 2 and Tier 1 uncertainty analyses, using similar underlying uncertainty data, resulted in similar mag-nitudes of overall uncertainty calculations, both for level and trend uncertainty. Therefore, using Tier 1 as the main method for uncer-tainty analysis in the NIR is justified, also because it is unlikely that the uncertainties will change quickly over the years.
Uncertainty in the Netherlands’
greenhouse gas emissions inventory
Estimation of the level and
trend uncertainty using the
IPCC Tier 1 approach
Uncertainty in the Netherlands’ greenhouse gas emissions inventory © Netherlands Environmental Assessment Agency (PBL), August 2009 PBL publication number 500080013
Corresponding Author: J.G.J. Olivier; jos.olivier@pbl.nl
Parts of this publication may be reproduced, providing the source is stated, in the form: Netherlands Environmental Assessment Agency: Title of the report, year of publication. This publication can be downloaded from our website: www.pbl.nl/en. A hard copy may be ordered from: reports@pbl.nl, citing the PBL publication number.
The Netherlands Environmental Assessment Agency (PBL) is the national institute for strate-gic policy analysis in the field of environment, nature and spatial planning. We contribute to improving the quality of political and administrative decision-making by conducting outlook studies, analyses and evaluations in which an integrated approach is considered paramount. Policy relevance is the prime concern in all our studies. We conduct solicited and unsolicited research that is both independent and always scientifically sound.
Office Bilthoven PO Box 303 3720 AH Bilthoven The Netherlands Telephone: +31 (0) 30 274 274 5 Fax: +31 (0) 30 274 44 79 Office The Hague PO Box 30314 2500 GH The Hague The Netherlands Telephone: +31 (0) 70 328 8700 Fax: +31 (0) 70 328 8799 E-mail: info@pbl.nl Website: www.pbl.nl/en
Acknowledgments 5 Many colleagues from a number of organisations (CBS,
EC-LNV, LEI, PBL, TNO and SenterNovem) are involved in the annual updates of the Netherlands greenhouse gas inventory, which is part of the Netherlands Pollutant Release and Transfer
Register (PRTR). This annual project is led by the
Nether-lands Environmental Assessment Agency (PBL). The emission calculations, including those on greenhouse gas emissions, are performed by members of so-called PRTR Task Forces. Subsequently, the greenhouse gas emissions and activity data of the Netherlands’ inventory are converted by TNO into the IPCC source categories contained in the CRF files, which are a supplement to the National Inventory Report (‘NIR’) on greenhouse gas emissions. The estimated uncertainty about the different sources is part of the source description and an analysis of emission trends has been made in cooperation with the following experts:
1A: stationary energy: Jos Olivier (PBL) with the assistance
of Joost Huurman and Bas Guis (CBS); 1A: transport, bunkers: Anco Hoen (PBL);
1B: fugitive emissions: Kees Peek with the assistance of Jos
Olivier (both PBL);
2: industrial processes: Kees Peek with the assistance of
Jos Olivier
3: solvent and product use: Durk Nijdam (PBL) with the
assistance of Jos Olivier;
4: agriculture: Marian van Schijndel (PBL);
5: LULUCF: Gert-Jan van der Born (PBL), and Nynke Schulp
(WUR), with the assistance of Gert-Jan Nabuurs and Peter Kuikman (Alterra);
6A and 6C (=1A1a) solid waste: Guus van den Berghe,
Marco Kraakman, Timo Gerlagh (SenterNovem); 6B, 6D: waste water, other waste: Kees Baas (CBS).
In addition, Laurens Brandes and Romuald te Molder were responsible for the key source analysis and Jos Olivier for the coordination of the uncertainty estimates. We greatly appreci-ate the contributions by each of the groups and individuals named above, to the uncertainty estimates used in the key source analysis and reported in the National Inventory Report.
Abstract 7 The Netherlands signed the United Nations Framework
Convention on Climate Change (UNFCCC), and, therefore, is bound to report its greenhouse gas emissions annually in a National Inventory Report (NIR). Within the framework of this NIR, an annual uncertainty assessment is made for both national total annual emissions and the trend, from the base year 1990 (1995 for F-gases) to the current year. The present report documents uncertainty estimates in the assessment performed for the NIR 2006 and (minor) updates made in the later submissions (2007 and 2008).
Uncertainty estimates were made using the simplified IPCC Tier 1 uncertainty analysis following the Intergovernmental Panel on Climate Change (IPCC) Good practice Guidance. In addition, assumptions and results of two more comprehen-sive analyses are presented in this report, based on IPCC Tier 2 Monte Carlo assessments. These Tier 1 and Tier 2 assessments were used for identifying areas for improvement within the emissions inventory. Both studies showed that Tier 2 and Tier 1 uncertainty analyses, using similar underlying uncertainty data, resulted in similar magnitudes of overall uncertainty calculations, both for level and trend uncertainty. Therefore, using Tier 1 as the main method for uncertainty analysis in the NIR is justified, also because it is unlikely that the uncertain-ties will change quickly over the years.
Key words: Uncertainty, emissions, greenhouse gas, National Inventory Report
Abstract 9
Contents
Acknowledgments 5 Abstract 7 Samenvatting 11 Summary 13 1 Introduction 151.1 Types of data sources 16
1.2 Approaches and data sources used in the Netherlands 16
1.3 Procedures and history of uncertainty estimates used for the Dutch NIR 16
2 Uncertainties in the NIR 2006
19
2.1 Energy sector 19
2.2 Industrial processes (2) 26
2.3 Solvents and the use of other products (3) 28 2.4 Agriculture (4) 28
2.5 Land use, land-use change, and forestry (LULUCF) (5) 29 2.6 Waste (6) 34
3 Changes in uncertainties since NIR 2002
37
3.1 Expanded uncertainty calculation to include uncertainties larger than 60% 39 3.2 Comparison of a Tier 1 uncertainty estimate with a Tier 2 uncertainty calculation 40
4 Correlation between sources
43
4.1 Fuel combustion sector (1A) 43 4.2 Fugitive emissions from fuels (1B) 43
4.3 Industrial processes and product uses (2 and 3) 44 4.4 Agriculture (4) 44
4.5 Land use, land use change and forestry (LULUCF) (5) 45 4.6 Waste (6) 45
5 Emission factors and implied emission factors
47
Appendix 1 Uncertainty ranges for energy consumption
49
Appendix 2 Detailed uncertainty assumptions
50
Appendix 3 Estimating uncertainties for the key source analysis
53
Appendix 4 Uncertainties used for Tier 2 assessment in 2006
56
Appendix 5 Tables 6.1 and 6.2 of the IPCC Good Practice guidance (NIR 2008)
61 References 65 Colophon 67
Samenvatting 11 Nederland ratificeerde het Klimaatverdrag van de Verenigde
Naties (United Nations Framework Convention on Climate Change (UNFCCC)), en verplichtte zich daarmee tot een jaarlijkse rapportage over broeikasgasemissies via een NIR (National Inventory Report).
Een vast onderdeel hiervan is de onzekerheidsanalyse, die gebruikt wordt om mogelijkheden tot verbetering van de emissieberekeningen in beeld te brengen. De onzekerheids-analyse richt zich op zowel de emissiehoeveelheid (nationaal totaal) voor het rapportagejaar als op de trend ten opzichte van het basisjaar 1990 (1995 voor F-gassen).
Voor de analyse wordt door Nederland de Tier 1- methodiek toegepast, zoals beschreven in de IPPC Good practice Guidance
and Uncertainty Management in Greenhouse Gas Inventories. De Tier 1- methode gebruikt standaard vergelijkingen voor de foutenvoortplanting, en gaat uit van ongecorreleerde data met een normale verdeling voor de onzekerheden. Dit rapport geeft een overzicht en een onderbouwing van de gemaakte inschattingen voor de onzekerheidsanalyse in het NIR 2006, waarbij een vergelijking wordt gemaakt met eerdere jaren (vanaf 1999). Tevens is er een aanvulling met (kleine) actualisaties voor de jaren 2007 en 2008.
Naast de standaard Tier 1 analyse zijn ook uitgebreidere studies uitgevoerd (Tier2, Monte Carlo analyse). Deze hebben een groter detailniveau, houden rekening met mogelijke cor-relaties tussen de basisdata en beschouwen ook niet-normale verdelingen in de onzekerheden. Een door het Instituut voor Milieustudies (Olsthoorn and Pielaat, 2003) uitgevoerde studie gaf, uitgaande van dezelfde basisdata , voor de Tier 1- en Tier 2-analyse vergelijkbare uitkomsten voor de onze-kerheden. In 2006 werd, in opdracht van SenterNovem, een nieuwe Tier 2-studie uitgevoerd door het Copernicus Instituut van de Universiteit Utrecht (Ramírez, 2006). Reden om een nieuwe studie te laten uitvoeren was een belangrijke wijziging in diverse methoden voor het berekenen van de emissies, waardoor ook de Tier 1-uitkomsten sterk waren gewijzigd. Ondanks dat bleek opnieuw dat de uitkomsten van Tier 1- en Tier 2, gegeven dezelfde basisdata, maar weinig van elkaar verschilden.
Het blijven toepassen van Tier 1 is dan ook goed te verdedi-gen, ook omdat het onwaarschijnlijk is dat de beschouwde onzekerheden snel (binnen enkele jaren) zullen veranderen.
Summary 13 The Netherlands signed the United Nations Framework
Convention on Climate Change (UNFCCC), and, therefore, is bound to report its greenhouse gas emissions on an annual basis. Within the framework of the National Greenhouse Gas Inventory (NIR), annual uncertainty assessments are made, for both national total emissions and the trend, from the base year (1990, 1995 for F-gases) to the current year. These uncertainty assessments are used for identifying areas for improvement within the emissions inventory, as required by the Kyoto Protocol. Recommended methods for carrying out these assessments are incorporated in the IPCC report Good
practice Guidance and Uncertainty Management in National Greenhouse Gas Inventories.
For the Dutch NIR, the simplified IPCC Tier 1 uncertainty analysis was used. This type of analysis uses standard error propagation equations and assumes that uncertainties in the potential key sources are all uncorrelated and have normal distributions. This report documents the uncertainty esti-mates which were used in the uncertainty assessment perfor-med for the NIR 2006, and the changes made compared to previous NIRs, since the start of these assessments in 1999. It also documents the (limited) updates made in later submis-sions (2007 and 2008).
Next to the standard Tier 1 analysis, more comprehensive ones (Tier 2, Monte-Carlo based) were also carried out, with a more detailed level of aggregation, correlations between emission sources, and specific probability density functions. A study carried out by IVM (Institute for Environmental Studies, Olsthoorn and Pielaat 2003) showed that Tier 2 and Tier 1 uncertainty analyses, using similar underlying uncertainty data, result in similar magnitudes of overall uncertainty, in both level and trend.
A second Tier 2 project, commissioned by SenterNovem, was carried out by the Dutch Copernicus Institute for Sustainable Development and Innovation (Ramírez-Ramírez, 2006). The main reason for a new Tier 2 study was that, in 2004 and 2005, the methods for calculating emissions changed substantially. This resulted in large differences in the outcomes of the Tier 1 uncertainty analysis, before and after the recalculations. Despite the changes in emission calculation methods and outcomes, the new study again showed that the results of the Monte-Carlo analysis were of the same order of magnitude as the outcomes of Tier 1. In this way, the 2006 study suppor-ted the conclusion that it is justified to use Tier 1 as the main method for uncertainty analysis in the Dutch NIR.
Introduction 15 The purpose of this report is to document the uncertainty
estimates used in the uncertainty assessment which was per-formed for the National Inventory Report (NIR) 2006, and the changes made compared to previous NIRs, since the start of these assessments in 1999. This report focuses on document-ing the uncertainty estimates used in the NIR 2006, because that report was also used in the Kyoto Protocol for determin-ing the so-called Assigned Amount, which is based on the base-year emissions (1990; 1995 for F-gases). Furthermore, this report also documents the limited updates in uncertainty estimates made in the later NIR submissions of 2007 and 2008.
Uncertainty assessments are a means of providing inventory users with a quantitative judgements on the inventory quality, and of directing the inventory preparation team to priority areas where improvements are warranted and may be fea-sible. The uncertainty estimates in the annual national total emissions and in the trend from the base year to the current year presented in the NIRs, are based on simplified uncer-tainty analyses that use error propagation equations, and, assuming that the uncertainties in the potential key sources are all uncorrelated, have normal distributions and are less than 60%. This is called the IPCC Tier 1 uncertainty analysis, as described in the report Good practice Guidance and Uncertainty
Management in National Greenhouse Gas Inventories (IPCC, 2000). This guideline also offers countries the possibility to choose a more comprehensive Monte Carlo based analysis, on a more detailed level of aggregation (Tier 2), but as this analysis is very resource intensive, the Netherlands annually reports uncertainties according to the Tier 1 method. In 2002, a first Tier 2 analysis ‘Sources of Uncertainties in the Dutch Emission Registration’, commissioned by the Working Group Emissions Greenhouse Gases (in Dutch abbreviated ‘WEB’), was carried out by the Institute for Environmen-tal studies IVM (Olsthoorn and Pielaat, 2003). The broad objective was to investigate the viability of the IPCC Tier 2 uncertainty approach, within uncertainty management related to the annual production of the Dutch NIR. This Tier 2 uncertainty analysis, using a Monte Carlo method, took into account correlations between emission sources and specific probability density functions. The study showed that the Tier 2 and Tier 1 uncertainty analyses, using similar underlying uncertainty data, resulted in similar magnitudes of overall uncertainty calculations, both for level and trend uncertainty. The study concluded that there was no need to repeat a Tier
2 every year, because of the unlikelihood of uncertainties changing quickly over the years.
At the end of 2005, a second Tier 2 project, commissioned by SenterNovem, was carried out by the Copernicus Institute for Sustainable Development and Innovation (Ramírez-Ramírez et al., 2006). The main reason for a new Tier 2 study was that, in 2004 and 2005, the methods for calculating emissions changed substantially, resulting in substantial differences in the outcomes of the Tier 1 uncertainty analysis, before and after the recalculations. This Tier 2 study again showed that the results of the Monte-Carlo analysis are of the same order of magnitude as the Tier 1 outcomes. The study concluded that it seemed justified to use Tier 1 as the main method for uncertainty analysis in the NIR.
It should be stressed that most uncertainty estimates are ulti-mately based on expert judgments and, therefore, inevitably show a high degree of subjectivity. However, the reason for using these estimates was to identify the most important uncertain sources. For this purpose, an estimate of a reasona-ble order of magnitude of the uncertainty in activity data and in emission factors, proved to be sufficient. Moreover, the purpose of the uncertainty assessment was to help identify areas for improvement of the emissions inventory, as recom-mended by the IPCC Good Practice Guidance (IPCC, 2000), and as required by the national system requirements of the Kyoto Protocol. The protocol describes key quality assurance aspects of the emission estimation and reporting activities of industrialised countries that annually submit an updated inventory.
Structure of this report
First the different types of data sources of uncertainty estimates are provided, followed by the hierarchy of sources used in the Netherlands. Next, an overview is provided of the evolution of the uncertainty estimates since 1999. In chapter 2, the uncertainty in the NIR 2006 is presented, including some detailed assessments of particular source categories. In chapter 3, a summary is given of the changes in uncertainty estimates made from the NIR 2004 to the NIR 2005, and from the NIR 2002 to the NIR 2004. Finally, chapter 4 summarises recent information that is available to update the present uncertainty estimates. In the annexes, more details are provided about the derivation of some uncertainties (for road transport, agriculture and waste), the uncertainty estimates for the energy statistics, a summary of the IPCC default values from IPCC (1997), and the more detailed uncertainty
tions made for the Tier 2 uncertainty assessment performed in 2005 to 2006.
Types of data sources
1.1
In general, there are six types of data sources of uncertainties in activity data and emission factors used in greenhouse gas emission inventories:
IPCC defaults from the Good Practice Guidance; 1.
Country-specific values based on information about meas-2.
urement accuracy or on the spread in multiple measure-ment values;
Country-specific reports that provide uncertainty 3.
estimates;
Other reports that provide estimates of the uncertainty in 4.
particular source categories;
Expert judgement by a group of experts; 5.
Expert judgement by one expert, for example, the one 6.
responsible for the documentation of the source category in the NIR.
Approaches and data sources
1.2
used in the Netherlands
Uncertainty estimates aim to show the uncertainties at the aggregation level of potential key sources suggested by the IPCC Good Practice Guidance. This enables a Tier 2 level and trend key source analysis of the greenhouse gas inventory, including the uncertainty in the emission estimates. In the case of the Netherlands, the basis for the uncertainty estimates was the collective expert judgement of groups of experts – consisting of members of the PER Task Forces, other national sectoral experts, and RIVM/MNP/PBL experts responsible for the NIR report. The groups of experts partici-pated in two workshops held in 1999 (one on emissions and one on the LUCF sector), the conclusions of which formed the basis for the greenhouse gas inventory improvement programme that started in 2000 (data source types 3,4, and 5, see above). Other country-specific uncertainty estimates were made in so-called factsheets compiled by RIVM1) as part of the
quality assurance of the assessments made in the frame-work of the annual Environmental Balance of RIVM (type 5). For some sources, some reports documented uncertainty estimates from particular sources, for example, for energy consumption statistics by the statisticians from CBS (type 4 and 5), and for the uncertainty in the CO2 emission factor for
natural gas and coal (type 3). For CO2 from petrol and diesel
used in transport, the uncertainty in the country-specific CO2
emission factors could be determined from the measurement data (type 2). In most cases, the uncertainty estimates were determined in the following order of preference:
country-specific expert judgements in the two workshops 1.
held in 1999;
other country-specific reports with documented uncer-2.
tainty estimates;
IPCC Good Practice defaults; 3.
other reports, when available, providing uncertainty 4.
estimates;
expert judgement by the author’s team responsible for the 5.
documentation in the NIR.
In the last years, new information has become available, for example, through the Tier 2 uncertainty assessment projects conducted by IVM in 2003 and by the Utrecht University in 2006.
It is very important to know that all uncertainty figures should
be interpreted as corresponding to a confidence interval of 2 stand-ard deviations (2σ), or 95%. For example, given an uncertainty of 10%, for a certain emission, this gives a total range of the given emission plus or minus ten percent.In cases where asymmetric uncertainty ranges were assumed, the largest percentage was used in the calculation.
Procedures and history of uncertainty
1.3
estimates used for the Dutch NIR
In 1999, in two workshops, Dutch experts from the PRTR 1.
and others from research institutes debated the quality of the then current inventory to quantify the uncertainties, identify the largest areas of uncertainty, and priority areas for improvement within the inventory. The uncertainties were partly country-specific and partly adopted from IPCC default values. Discussion papers and a summary of conclu-sions were published in workshop proceedings by Van Amstel et al. (ed.) (2000a/b).
To meet the UNFCCC reporting guidelines for the NIR (IPCC 2.
Tier 1 estimation of the annual and trend uncertainties per sector and per gas, and in the national total), and for an IPCC Tier 2 identification of key sources, NIR coordina-tor Olivier compiled a first set of uncertainties for activity data (AD) and emission factors (EF) for all (uncorrelated) sources used in the key source identification. For fossil-fuel use, this took into account the correlation between the sectoral energy data and CO2 emission factors, so it was
decided to split total stationary energy use and energy feedstocks, each into three fuel categories: natural gas, oil and coal.
These uncertainties were determined by expert judg-3.
ment, by consulting the the following sectoral NIR and PER experts: Spakman and Montfoort (stationary energy and energy feedstocks); Van den Brink (transport); Peek (industrial sources); Van der Hoek (agriculture); Van der Born (LUCF); Beker and Van den Berghe (landfills); and Baas (wastewater).
The uncertainty values used were basically documented in: 4.
summary spreadsheet with source categories and a.
uncertainty figures for AD and EF, possibly different for base year and current year, and a reference source for the value;
spreadsheet for CH
b. 4 and N2O from transport (1A3);
spreadsheet for agriculture (CH
c. 4 from 4A, CH4 from 4B,
and N2O from 4D);
spreadsheet for CH
d. 4 from landfills (6A).
The uncertainties used are based on the following inputs, 5.
in this order: 1) Now PBL
Introduction 17 the outcome of these workshops (Van Amstel et al
a. .
(ed.), 2000a/b) with country-specific estimates of the uncertainty, for particular sources;
if no country-specific judgment was available: supple-b.
mented with IPCC default uncertainties from the IPCC Good Practice Guidance 2000;
more recent insights, if available; c.
own expert judgment, if no IPCC default were available. d.
Uncertainties were determined by order-of-magnitude 6.
estimates, for example, chosen from the following series: 1%, 2%, 5%, 10%, 20 to 25%, 50%, 100%, 200%.
The uncertainty values in this report are presented as half 7.
the 95% confidence interval (2 standard deviations) divided by the total (i.e. mean) and expressed as a percentage. In a few cases, where emission factors were based on many samples, we used the standard deviation of the mean (also called the standard error of the mean) as an expression of the uncertainty.
For some sources, such as enteric fermentation (CRF 4A), 8.
animal waste (CRF 4B), and landfills (6A), the uncertainty in the overall AD and EF is an aggregate of the uncertainty in the more detailed parameters, which were first selected at the lower level, and, subsequently, a calculated (4A, 4B) or heuristic (6A) estimate was made for the higher level uncertainties.
The uncertainties used were also documented in a number 9.
of RIVM/LAE factsheets for major emission sources (RIVM, 1999).
In subsequent years, the uncertainties in the list of EF were 10.
slightly updated for a few sources, when improved EF data was starting to be used.
In parallel, to gain insights into the limitation of the IPCC 11.
Tier 1 uncertainty assessment and the added value of a Tier 2 assessment, SenterNovem commissioned an IPCC Tier 2 uncertainty assessment project, carried out by IVM (Olst-hoorn and Pielaat, 2003). For this project, IVM compiled its own list of uncorrelated source categories for which they wanted to make the Tier 2 assessment. Also, they consulted other experts than the ones who estimated the IPCC Tier 1 uncertainties. Unfortunately, this sometimes resulted in other uncertainty values, inconsistent with the uncertainty values reached at a higher aggregation level for the IPCC Tier 1 uncertainty assessment. IVM did not include any correlations between emission sources in their calculation. However, this project did result in new insights into the actual uncertainty and uncertainty causes for a number of sources.
In the NIR 2005, additional and updated values were used 12.
for some of the newly introduced key sources and for a number of old ones. This was based on consultation with the PRTR expert, for sources where major changes were made in the methodology, activity data, or emis-sion factors used. This update included major NOx, NH3
and non-methane volatile organic compounds (NMVOC) sources (Van Gijlswijk et al., 2004). For NMVOC sources, an uncertainty estimate was made based on a more detailed assessment of underlying uncertainties. This resulted in updates of NMVOC from solvents (activity data for indirect CO2 reported in sector 3), and in national total NOx and NH3
emissions (activity data for indirect N2O in source category
2G).
When all the major inventory improvements were carried 13.
out and new information on the background and quality of activity data and emission factors had become available – for the new ones but also for some of the older ones – it was time to update the set of uncertainties used for priori-tising the future monitoring of greenhouse gas emissions and the Tier 2 key source identification. This new set of uncertainties is presented in Annex 7 of the NIR 2006. In 2006, new information on the CO
14. 2 emission factor for
natural gas led to the selection of a new national average emission factor and a new uncertainty estimate for this value.
In 2005 and 2006, a second Tier 2 uncertainty assessment 15.
of the Netherlands greenhouse gas inventory was carried out by Utrecht University (Ramírez et al., 2006, 2008), bearing in mind the lessons learned from the previous acti-vities: (1) use uncertainty estimates compatible with the Tier 1 assessments made for the NIR; (2) for final determi-nation of the uncertainty values consult the same experts as were responsible for these estimates; (3) explicitly include correlations (if they can be identified and were not taken into account in the Tier 1 approach); (4) as a follow-up, organise a new expert review to update the uncertain-ties in view of any new material available.
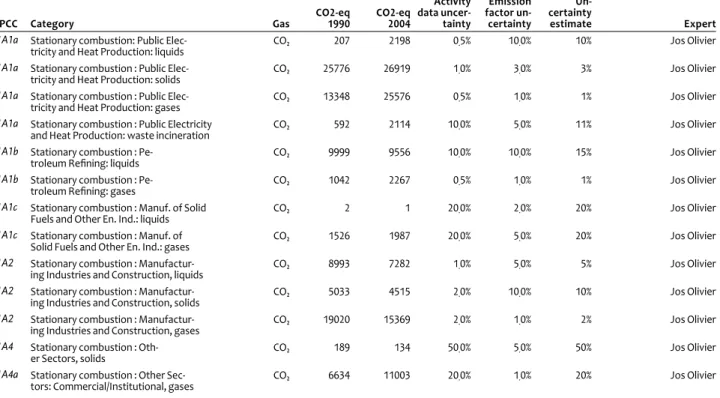
Uncertainties in the NIR 2006 19 The uncertainties used for the key source assessment in the
NIR 2006 are summarised in Table 2.1. In the remainder of this chapter, the uncertainties are discussed per IPCC sector, as well as the underlying assumptions to calculate them, when applicable.
Energy sector
2.1
Stationary combustion, activity data 2.1.1
The five most important fuels that cover the largest part of fossil-fuel consumption in the Netherlands, are:
natural gas (all sectors), covering 45 to 47% of total CO
1. 2
from fuel combustion;
hard coal (mainly in public power generation) and coke 2.
(mainly in iron and steel production), covering almost 20% of the 1A total CO2, of which 16 to 17% in public power
gen-eration (including BF and CO gas);
petrol and diesel (mainly in transport, predominantly in 3.
road transport), accounting for 17 to 20% of the fuel com-bustion total (including LPG).
These coal and coke uses capture 95 to 99% of total CO2 from
solid fuel combustion, whereas petrol, diesel and LPG in road transport capture 60% of total CO2 from liquid fuel
combus-tion. The major part of the remaining CO2 from liquid fuel
combustion stems from refineries (decreasing from 20 to 17%) and the chemical industry (varying around 10%), including the use of refinery gas, but not taking into account residual chemical gas.
The uncertainties for gaseous fuels relate to natural gas only; uncertainties for other fuels relate to the fossil-fuel waste component in waste incineration. Liquids in the road trans-port sector refer to petrol, diesel and LPG. Liquid and solid fuels in stationary combustion include an explicit estimate for so-called derived gases:
refinery gas and residual chemical gas, which are part of
liquid fuels;
blast furnace gas or oxygen furnace gas, and coke oven
gas, which are part of solid fuels.
The uncertainties in the activity data for the energy sector were updated in 2005, based on uncertainty estimates from the energy statistics division of CBS (Statistics Netherlands)
which were published in the report on the Protocol on Energy Conservation, and on new insights gained from the energy and CO2 recalculation project, performed by CBS (Huurman,
2005). Table 2.2 shows the most recent uncertainty estimates, as used in the uncertainty assessment of the NIR 2006. The accuracy of fuel consumption data in power generation (1A1a) and oil refineries (1A1b), generally, is considered to be very high. The used volumes of natural gas are (very) well known, therefore, the uncertainty was estimated by CBS at 0.5%. Both solid fuels used in power generation and liquid fuels used in refineries have a larger estimated uncertainty of 1% and 10%, respectively, based on the share of blast furnace gas in total solid consumption, and the ‘unaccounted-for liquids’ calculated for refineries. For other fuels, we used a 10% uncertainty, which refers to the amount of fossil-fuel waste being incinerated and, thus, to the uncertainties in the total amount of waste and the fossil and biomass fractions. The consumption of gas and liquid fuels in the 1A1c category is mainly by the oil and gas production industry itself, where splitting the consumption into use and venting/flaring proved to be quite difficult. Thus this carries a large uncertainty of 20%.
The large uncertainty in activity data in the 1A4 source cat-egory, in particular, in the service sector (subcategory 1A4a), is due to the allocation of the remainder of total national energy consumption per fuel type – that is, after subtraction of the amounts attributed to the subcategories 1A1, 1A2, 1A3, 1A4b/c, and 1A5.
An uncertainty of 20% is assumed for liquid fuel use in ‘Off-road Machinery and Fisheries’, and in the other categories under 1A4.
Stationary combustion, emission factors 2.1.2
CO2 Natural gas
The 1% uncertainty in the emission factor of 56.1 kg CO2/GJ
from natural gas, is based on information by Gasunie. Van Harmelen and Koch (2002) analysed the emission factor for standard Groningen gas (G-gas, a mixture of gas from the Slochteren reservoir and high calorific gas from other small gas fields), and so-called High calorific gas (H-gas), produced
Uncertainties in
Emissions and uncertainty estimates in the key source analysis of the NIR 2006
IPCC Category Gas
CO2 eq 1990 (Gg) CO2 eq 2004 (Gg) AD unc(%) EF unc(%) EM 2004 unc (%) 1A1a Stationary combustion: Public Electricity and Heat Production: liquids CO2 206 2,230 0.5 10 10
1A1a Stationary combustion : Public Electricity and Heat Production: solids CO2 25,776 27,004 1 3 3
1A1a Stationary combustion : Public Electricity and Heat Production: gases CO2 13,348 25,488 0.5 1 1
1A1a Stationary combustion : Public Electricity and Heat Production: waste incineration CO2 592 1,750 10 5 11
1A1b Stationary combustion : Petroleum Refining: liquids CO2 9,999 9,556 10 10 14
1A1b Stationary combustion : Petroleum Refining: gases CO2 1,042 2,267 0.5 1 1
1A1c Stationary combustion : Manuf. of Solid Fuels and Other En. Ind.: liquids CO2 2 1 20 2 20
1A1c Stationary combustion : Manuf. of Solid Fuels and Other En. Ind.: gases CO2 1,418 1,978 20 5 21
1A2 Stationary combustion : Manufacturing Industries and Construction, liquids CO2 8,788 7,502 1 5 5
1A2 Stationary combustion : Manufacturing Industries and Construction, solids CO2 5,195 4,384 2 10 10
1A2 Stationary combustion : Manufacturing Industries and Construction, gases CO2 19,020 15,402 2 1 2
1A4 Stationary combustion : Other Sectors, solids CO2 189 134 50 5 50
1A4a Stationary combustion : Other Sectors: Commercial/Institutional, gases CO2 6,653 11,057 20 1 20
1A4b Stationary combustion : Other Sectors, Residential, gases CO2 18,696 18,786 5 1 5
1A4c Stationary combustion : Other Sectors, Agriculture/Forestry/Fisheries, gases CO2 8,328 7,041 10 1 10
1A4c Stationary combustion : Other Sectors, Agriculture/Forestry/Fisheries, liquids CO2 2,522 2,656 20 2 20
1A4 Stationary combustion : Other Sectors, liquids excl. From 1A4c CO2 1,479 451 20 2 20
1A5 Military use of fuels (1A5 Other) CO2 566 437 20 2 20
1A Emissions from stationary combustion: non-CO2 CH4 523 557 3 50 50
1A Emissions from stationary combustion: non-CO2 N2O 218 231 3 50 50
1A3b Mobile combustion: road vehicles: petrol CO2 10,902 13,168 2 0.4 2
1A3b Mobile combustion: road vehicles: diesel oil CO2 11,832 19,542 5 0.2 5
1A3b Mobile combustion: road vehicles: LPG CO2 2,738 1,131 10 0.2 10
1A3 Mobile combustion: waterborne navigation CO2 405 832 20 0.2 20
1A3 Mobile combustion: aircraft CO2 41 41 50 0.5 50
1A3 Mobile combustion: other (railways) CO2 91 109 5 0.2 5
1A3 Mobile combustion: other (non-road) CH4 1 1 50 100 112
1A3 Mobile combustion: other (non-road) N2O 1 3 50 100 112
1A3 Mobile combustion: road vehicles CH4 157 67 3 60 60
1A3 Mobile combustion: road vehicles N2O 271 485 5 50 50
1B2 Fugitive emissions venting/flaring CH4 1,252 310 2 25 25
1B2 Fugitive emissions from oil and gas operations: gas distribution CH4 255 268 2 50 50
1B2 Fugitive emissions from oil and gas operations: other CH4 162 149 20 50 54
1B1b CO2 from coke production CO2 403 509 50 2 50
1B2 Fugitive emissions venting/flaring: CO2 CO2 769 124 50 2 50
2A1 Cement production CO2 416 446 5 10 11
2A3 Limestone and dolomite use CO2 276 297 25 5 25
2A7 Other minerals CO2 308 411 25 5 25
2B1 Ammonia production CO2 3,096 3,086 2 1 2
2B2 Nitric acid production N2O 6,330 5,617 10 50 51
2B5 Caprolactam production N2O 1,240 759 50 50 71
2B5 Other chemical product manufacture CO2 717 786 50 50 71
2C1 Iron and steel production (carbon inputs) CO2 2,514 1,105 3 5 6
2C3 CO2 from aluminium production CO2 395 479 2 5 5
2C3 PFC from aluminium production PFC 1,901 106 2 20 20
2F SF6 emissions from SF6 use SF6 301 328 50 25 56
2F Emissions from substitutes for ozone depleting substances (ODS substitutes): HFC HFC 249 1,023 10 50 51
2E HFC-23 emissions from HCFC-22 manufacture HFC 5,759 354 10 10 14
2E HFC by-product emissions from HFC manufacture HFC 12 99 10 20 22
2F PFC emissions from PFC use PFC 37 179 5 25 25
2G Other industrial: CO2 CO2 347 342 5 20 21
2G Other industrial: CH4 CH4 297 309 10 50 51
2G Other industrial: N2O N2O 3 7 50 50 71
2G Indirect N2O from NH3 from combustion and industrial processes N2O 52 56 50 200 206
2G Indirect N2O from NO2 from combustion and industrial processes N2O 883 637 15 200 201
3 Indirect CO2 from solvents/product use CO2 316 144 25 10 27
4A1 CH4 emissions from enteric fermentation in domestic livestock: cattle CH4 6,767 5,712 5 20 21
4A8 CH4 emissions from enteric fermentation in domestic livestock: swine CH4 439 351 5 50 50
4A CH4 emissions from enteric fermentation in domestic livestock: other CH4 319 286 5 30 30
Uncertainties in the NIR 2006 21 from other, smaller gas fields. The study concluded that the
average mix had an emission factor very close to that of pure Slochteren gas (with an emission factor of 56.1 kg CO2/GJ),
since G-gas is the most-used gas in the Netherlands, and ana-lysed H-gases differed only by up to about 0.5% for the 56.1 kg CO2/GJ value for G-gas. This value falls within the uncertainty
range of 1% estimated by Gasunie for Slochteren gas. Also, for one Dutch importer of British H-gas, the average emis-sion factor appeared to be within this uncertainty range. This 1% uncertainty for natural gas was also used in the study by Olsthoorn and Pilaat (2003).
This study also showed the sensitivity of the CO2 emission
factor in the methane/ethane ratio, and, for comparison (in their Table 3.21), presented emission factors for natural gas from other sources: H-gas from Ekofisk (56.7), L-gas Enriched (56.4), and gas from Algeria (56.3).)
Recently, Gasunie Transport Services (GtS) provided new information on the emission factor of natural gas. This information was based on routine measurements carried out in 2003 and 2004, at 35 distribution stations. The results indicate that the average CO2 emission factor for natural gas
(56.1 kg/GJ) is underestimated. Further analyses showed that both qualities of natural gas delivered to customers within the Netherlands – G-gas and H-gas – have significantly larger average CO2 emission factors than the factor for pure
Slochteren gas (Vreuls, 2006). A very detailed analysis of the measurement data showed that, for 2003 and 2004, the national average weighted emission factor was 56.8 kg CO2/
GJ. A second analysis of the data showed that the national average emission factor for 1990 had the same value.
There-fore, the value of 56.8 was applied to the whole time series of 1990 to 2004. For natural gas, the uncertainty in the CO2
emission factor is now estimated to be 0.25%, based on the recent fuel quality analysis reported by Heslinga and Van Harmelen (2006); however this value has not been used yet in the recent NIRs (2006, 2007, 2008).
CO2 Solid fuels
For hard coal (bituminous coal), an analysis was made of its use in power generation (Van Harmelen and Koch, 2002); for coking coal, the analysis was done for coke ovens (CO) and blast furnaces (BF). For CO gas and BF gas, the emission factors were based on a three-year average (2000 to 2002) of plant-specific values, reported by Corus (2004). For the default power plant factor, 94.7 CO2/GJ was the mean value
of 1270 samples in 2000, with an accuracy of about 0.5%. For 1990 and 1998, the emission factor varied by about 0.9 CO2/GJ
(see Table 4.1 in Van Harmelen and Koch., 2002), so in apply-ing the default factor to other years, the uncertainty is appar-ently larger, about 1%. For coke production (1B1), based on the variability of the accuracy in the C contents, the uncertainty in the default factors for the coking coal was about 3%, whereas for coking coal injected in blast furnaces. in the iron and steel production (1A2a), the uncertainty was about 7% (average of plant-specific values for three subsequent years). The same analysis for the default CO2 emission factors for coke oven gas
and blast furnace gas showed uncertainties of about 10% and 15%, respectively (data reported by Corus, 2004). Since BF/OF gas has a share of 15 to 20% in total solid-fuel emissions from power generation, the overall uncertainty in the emission factor for that subcategory is about 3%. For the CO2 emission
IPCC Category Gas
CO2 eq 1990 (Gg) CO2 eq 2004 (Gg) AD unc(%) EF unc(%) EM 2004 unc (%)
4B Emissions from manure management N2O 694 707 10 100 100
4B1 Emissions from manure management : cattle CH4 1,574 1,475 10 100 100
4B8 Emissions from manure management : swine CH4 1,141 919 10 100 100
4B9 Emissions from manure management : poultry CH4 243 56 10 100 100
4B Emissions from manure management : other CH4 12 16 10 100 100
4D1 Direct N2O emissions from agricultural soils N2O 4,597 4,839 10 60 61
4D3 Indirect N2O emissions from nitrogen used in agriculture N2O 4,861 3,209 50 200 206
4D2 Animal production on agricultural soils N2O 1,308 651 10 100 100
5A1 5A1. Forest Land remaining Forest Land CO2 -2,505 -2,289 25 61.8 67
5A2 5A2. Land converted to Forest Land CO2 -11 -159 25 57.9 63
5B2 5B2. Land converted to Cropland CO2 -36 -36 25 50 56
5C1 5C1. Grassland remaining Grassland CO2 4,246 4,246 25 50 56
5C2 5C2. Land converted to Grassland CO2 -51 -51 25 61.2 66
5E2 5E2. Land converted to Settlements CO2 -152 -152 25 50 56
5F2 5F2. Land converted to Other Land CO2 717 717 25 50 56
5G 5G. Other (liming of soils) CO2 183 79 25 1 25
5A1 5A1. Forest Land remaining Forest Land N2O 0 0 25 20 32
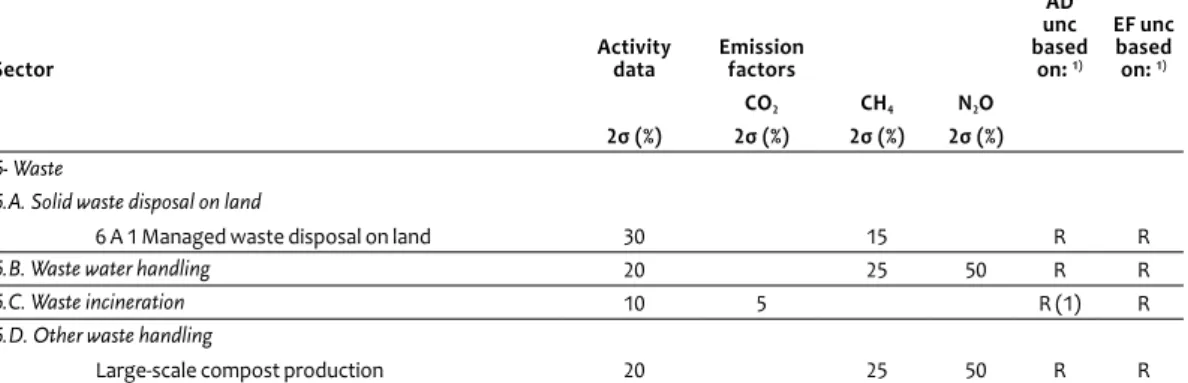
6A1 CH4 emissions from solid-waste disposal sites CH4 12,011 6,521 30 15 34
6B Emissions from wastewater handling CH4 290 225 20 25 32
6B Emissions from wastewater handling N2O 513 399 20 50 54
6D OTHER CH4 CH4 1 72 20 25 32
3, 6D OTHER N2O N2O 250 139 20 50 54
TOTAL EMISSIONS 216,700 220,151
Uncertainties for 2B2 (N2O emissions from nitric acid production) and 2B5 (caprolactam production) have been updated in the
NIR 2008 to 10% (AD) and 20% (EF) in 2B2 and to 20% (AD and EF) in 2B5. This results in an uncertainty in the emissions of 22% and 28% (vs. 51% and 71% listed here).
factor for solid-fuel use in category 1A4, an uncertainty of 5% was assigned.
CO2 Liquid fuels
For the other major oil uses in refineries and in the (chemical) industry, the uncertainty is estimated at 10% and 5%, respec-tively, taking into account that 40 to 50% of the refinery CO2
from liquid fuel stems from refinery gas (or 70-85% includ-ing unaccounted for liquid fuel) and that about half of the CO2 emissions in the (chemical) industry stem from residual
chemical gases. An uncertainty of 2% was assigned to the CO2
emission factor for liquid fuel use in category 1A4.
CH4 and N2O from stationary combustion
The uncertainty in the methane (CH4) factor for stationary
combustion was estimated at 50%, since the emission factors were made up from a multi-sectoral aggregate, except for biofuels where we used the IPCC default uncertainty of 80%. For nitrous oxide (N2O) from stationary combustion the
uncertainty in the emission factor was estimated at 50%.
Emissions from stationary combustion 2.1.3
Energy industries (1A1) and Manufacturing industries (1A2)
The uncertainty in the source categories Energy industries (1A1) and Manufacturing industries (1A2) was estimated to be 4% and 3%, respectively, in annual CO2 emissions from
combus-Uncertainty estimates for activity data and emission factors in stationary fuel combustion (1A1, 1A2, 1A4)
Sector ity dataActiv- Emission factors
AD unc based on: 6) EF unc based on: 6) CO2 CH4 N2O ±2σ (%) ±2σ (%) ±2σ (%) ±2σ (%) 1A- FUEL COMBUSTION
3 -- 50 50 R R
1.A.1-Energy industries
1.A.1.a. Public electricity and heat production
Liquid fuels 0.5 10 1) R (2) R
Solid fuels 1 3 2) R R
Gaseous fuels 0.5 0.25 3) R (2) M (3)
Other fuels 10 5 R (1) R
1.A.1.b. Petroleum refining
Liquid fuels 10 10 R (2) R (2)
Gaseous fuels 0.5 0.25 R (2) M (3)
1.A.1.c. Manufacture of solid fuels and other energy industries
Liquid fuels 20 2 R R (1)
Gaseous fuels 20 5 R R
1.A.2-Manufacturing Industries and construction
Liquid fuels 1 5 4) R (2) R Solid fuels 2 10 5) R (2) R (2) Gaseous fuels 2 0.25 R (2) M (3) 1.A.4-Other sectors Liquid fuels 20 2 R (2) R Solid fuels 50 5 R (2) R
Gaseous fuels See
1A4a,b,c. 1A1a,b,c.See
Biomass 25 5 R R 1.A.4.a. Commercial/institutional Liquid fuels Solid fuels Gaseous fuels 20 0.25 R M (3) 1.A.4.b. Residential Liquid fuels Solid fuels Gaseous fuels 5 0.25 R (2) M (3) 1.A.4.c. Agriculture/forestry/fisheries Liquid fuels 20 2 R (2) R Solid fuels Gaseous fuels 10 0.25 R (2) M (3)
1) 0% (1990) to 100% residual chemical gas. 2) 15 to 20% blast furnace gas.
3) In the NIR 2006, 2007, and 2008, an uncertainty of 1% was used for the CO2 emission factor of natural gas.
4) 50% chemical residual gas.
5) iron and steel sector: 66% blast furnace/oxygen furnace gas
6) Documented as D [= Default of IPCC source category], R [= National Referenced data], or M [= Measurement based]. References: (1) Van Amstel et al., 2000, (2) Huurman, 2005, (3) Heslinga and Van Harmelen, 2006.
Uncertainties in the NIR 2006 23 tion. The ‘other’ manufacturing industry (1A2f) included the
use of off-road machinery in building and construction, and other uses (except in agriculture).
Other sectors (services, residential, agriculture and fisheries) (1A4)
The energy consumption data on the total category 1A4 ‘Other sectors’, is much more accurate than the data on the subsectors. In particular, energy consumption in the com-mercial subsector, and - to a lesser extent - the agricultural subsector, was less accurately monitored than in the residen-tial sector.
Therefore, trend conclusions for these subcategories should be treated with some caution. The uncertainty for the 1A4 cat-egory as a whole was estimated to be 10% in annual emissions of CO2, the uncertainty in CH4 and N2O emissions was
esti-mated to be much larger (about 50% and 100%, respectively)
Activity data on mobile combustion 2.1.4
Table 2.3 shows the uncertainty estimates used in the trans-port sector. The uncertainty in fuel use by road vehicles was estimated to be 2% for petrol, 5% for diesel oil, and 10% for LPG. These uncertainty estimates were based on an analysis according to the national approach (based on vehicle-kilome-tre statistics), and the IPCC approach (based on fuel deliveries to fuelling stations). For petrol, the differences between the two approaches were found to be in the range of 0 to 3%. If we assume the uncertainty in fuel used to be 0%, then the uncertainty can be calculated as ((3-0)/2) = 1.5% and rounded at 2% (see bullet 6 in section 1.3). For diesel oil, the differences between the two approaches were in the range of 9 to 18%. Using the same assumption as for petrol, the uncertainty was calculated at 4.5% and rounded at 5%. For LPG, the differences between the two methods were found to be in the range of 9 to 35%. From this range, the uncertainty was calculated to be 13%; rounded at 10%. The uncertainty in fuel used by ‘Civil
Avia-tion’ was estimated to be about 50%, while for ‘NavigaAvia-tion’, this was 20%. The accuracy of military fuel consumption data (1A5) was tentatively estimated at 20%.
Emission factors for mobile combustion 2.1.5
For petrol and diesel fuel, the national default was deter-mined from the C contents of 50 fuel samples of both fuels, covering summer and winter qualities and the uncertainty in the mean value: 0.4 and 0.2% for petrol and diesel fuel, respectively. For LPG in road transport, the uncertainty was estimated at 0.2%. For the uncertainty in the CO2 emission
factor for railways and navigation, the same value was chosen as that for diesel in road transport.
For the uncertainty in emissions factors of CH4 and N2O
from road transport, the overall emission-factor uncertainty was estimated from uncertainties in the emission factors for petrol, diesel and LPG used in passenger cars, with and without catalytic converter, in freight vans, and for diesel used in trucks, buses, and other road transport, resulting in an uncertainty of about 60% for CH4 and about 50% for N2O, from
the total road transport (see Tables 2.4 and 2.5). In all other transport modes, the uncertainty in the CH4 and N2O emission
factor was estimated at 100%.
Emissions from mobile combustion 2.1.6
Road transport (1A3b)
The uncertainty in CO2 emissions from road transport was
estimated to be 3% in annual emissions. For CH4, this was
estimated to be about 50%. Data on the share of CH4 in VOC
were based on information in Veldt and Van der Most (1993) and have not been validated since.
Possibly, the mass fraction of CH4 has changed, for example,
because of recent changes in the aromatic content of road-transport fuels or improvements in exhaust after-treatment
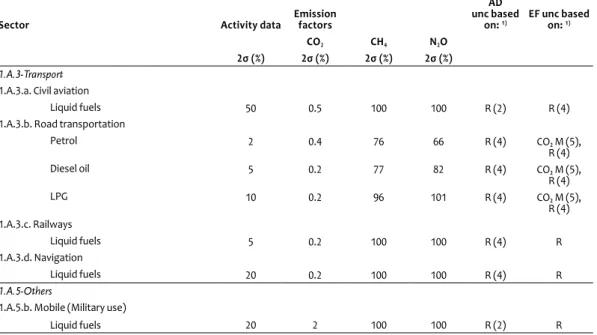
Uncertainty estimates for activity data and emission factors in 1A3 transport and 1A5 others
Sector Activity data Emission factors
AD unc based
on: 1) EF unc based on: 1)
CO2 CH4 N2O
2σ (%) 2σ (%) 2σ (%) 2σ (%) 1.A.3-Transport
1.A.3.a. Civil aviation
Liquid fuels 50 0.5 100 100 R (2) R (4)
1.A.3.b. Road transportation
Petrol 2 0.4 76 66 R (4) CO2 M (5), R (4) Diesel oil 5 0.2 77 82 R (4) CO2 M (5), R (4) LPG 10 0.2 96 101 R (4) CO2 M (5), R (4) 1.A.3.c. Railways Liquid fuels 5 0.2 100 100 R (4) R 1.A.3.d. Navigation Liquid fuels 20 0.2 100 100 R (4) R 1.A.5-Others
1.A.5.b. Mobile (Military use)
Liquid fuels 20 2 100 100 R (2) R
1) Documented as D [= Default of IPCC source category], R [= National Referenced data], or M [= Measurement based]. References: (1) Van Amstel et al., 2000, (2) Huurman, 2005, (4) Van den Brink (in Olivier et al., 2002), (5) Olivier, 2004
technology. The uncertainty in N2O emissions from road
trans-port was estimated to be 50% in annual emissions. Current emissions from heavy-duty diesel vehicles were probably overestimated, but, for the whole period, the overestimation affected the emission trend only slightly.
Other modes of transport (shipping, aviation, other) (1A3d, a and e)
The uncertainty in CO2 emissions from domestic aviation
and from other transport was estimated to be about 50% in annual emissions from aviation, and 20% in annual shipping emissions. The uncertainty in CH4 and N2O emissions from
non-road transport was estimated to be about 100% in annual emissions. Data on the share of CH4 in total VOC were based
on information in Veldt and Van der Most (1993) and have not been validated since.
Others (military shipping and military aviation) (1A5)
The uncertainty in CO2 emissions from military shipping and
military aviation was tentatively estimated to be about 20% in annual emissions. For the negligible CH4 and N2O emissions
this was estimated to be about 100%.
Uncertainty estimates for N2O emission factors for 1A3 transport
N2O Activity data uncert. 2σ (%) Emission factor uncert. 2σ (%) Emissions in 1990 (Gg) (NIR 2001) Emissions in 1999 (Gg) (NIR 2001) Road transportation
passenger cars petrol with catalytic conv. 25 100 1.08 2.03
passenger cars petrol without catalytic conv. 25 50 0.54 0.19
passenger cars diesel 25 50 0.29 0.29
passenger cars LPG 25 100 0.46 0.64
freight vans petrol 25 100 0.03 0.04
freight vans diesel 25 50 0.25 0.37
freight vans LPG 25 50 0.01 0.04
freight trucks and buses 25 100 2.08 1.59
Other road transport 50 50 0.09 0.06
Road transport total 4.84 5.26
per fuel type (calculated for 1990)
Petrol 2 66 1.75 2.32
diesel 5 82 2.62 2.25
LPG 10 101 0.47 0.69
Table 2.4
Uncertainty estimates for CH4 emission factors for 1A3 transport
CH4 Activity data uncert. 2σ (%) Emission factor uncert. 2σ (%) Emissions in 1990 (Gg) (NIR 2001) Emissions in 1999 (Gg) (NIR 2001) Road transportation
passenger cars petrol with catalytic conv. 25 100 0.48 1.42
passenger cars petrol without catalytic conv. 25 100 4.19 1.26
passenger cars diesel 25 100 0.16 0.09
passenger cars LPG 25 100 0.50 0.14
freight vans petrol 25 100 0.37 0.14
freight vans diesel 25 100 0.15 0.11
freight vans LPG 25 100 0.04 0.03
freight trucks and buses 25 100 0.80 0.31
Other road transport 50 100 0.83 0.70
Road transport total 7.52 4.19
per fuel type (calculated for 1990)
petrol 2 76 5.87 3.51
diesel 5 77 1.11 0.51
LPG 10 96 0.53 0.17
Uncertainties in the NIR 2006 25
Non-combustion or related sources of fugitive 2.1.7
emissions (1B)
Fugitive emissions from solid fuels (coke manufacture) (1B1), activity data
CO2 emissions were calculated from the calculation model
below: a carbon balance with coking coal as input, and coke and coke oven gas as output:
CO2 from coke and coal inputs = amount of coke * EFcoke +
amount of coal * EFcoal – (blast furnace gas + oxygen oven
gas produced) * EFBFgas
The uncertainty in coking coal input was estimated at 1% (assuming the same accuracy as for coal use in power plants), and the coke and coke oven gas outputs at 2% and 20%, respectively. The uncertainty of 20% in the amount of coke oven gas produced, reflected the interannual variation in resulting net CO2 emissions per tonne of coke produced,
which can be up to 25% (see Table 3.42 in NIR 2005). The accu-racy of the C content in these fuels was estimated at 3% for coking coal, vs. 1% for coke and 15% for coke oven gas (Corus, personal communication 2004). This resulted in an overall uncertainty in the activity data of about 45% (rounded at 50%), which is quite large given the relatively low uncertainties for the separate terms in the carbon balance.
Fugitive emissions from solid fuels (coke manufacture) (1B1), emission factors
The uncertainty in the implied emission factor of CO2 was
esti-mated at 20%, based on the interannual variation of the CO2
emissions per tonne of coke produced (see Table 3.42 in NIR 2005). The large uncertainty in the CO2 emission factor also
reflects the way in which these emissions were calculated. The uncertainty in the CH4 emission factor was estimated at
50%.
Methane from gas distribution (1B2), activity data and emission factors
The IPCC Tier 3 approach for CH4 from ‘gas distribution’ (1B2)
was based on two country-specific emission factors: 610 m3
(437 Gg) methane from grey cast iron, and 120 m3 (86 Gg)
from other materials per 1000 kilometres of pipeline, both due to leakages. These emission factors were based on seven measurements of leakage per hour from grey cast iron, at one pressure level, and on 18 measurements, at three pressure levels, from other materials (PVC, steel, nodular cast iron and PE). Subsequently, the results were aggregated to factors for the material mix in 2004. From 2004 onwards, the gas distri-bution sector annually recorded the number of leaks found per substance, and any future trends in the emission factors will be derived from these data.
For CH4 from gas distribution, the uncertainty in the emission
factors was estimated at 50%. This uncertainty referred to the limited number of measurements, per gas leak, for differ-ent types of substances and pressures, on which the Tier 3 approach of methane emissions from gas distribution was based. The uncertainty in the length of pipeline, per sub-stance, was estimated at 2% (based on apparent inconsisten-cies in the time series of subsequent surveys).
Emission factors for venting and flaring) (1B2)
The uncertainty in the emission factor of CO2 from gas flaring
and venting (1B2) was estimated at 2%, for flaring, taking into account the variability in the gas composition at the smaller gas fields, and, for venting, taking into account the variability in CO2 gas produced at a few locations where CO2 is extracted
and subsequently vented.
For CH4 from fossil fuel production, the uncertainty in the
emission factors was estimated at 25% for gas venting, and 50% for gas distribution. These uncertainties referred to the changes in reported emissions from venting in the oil and gas production industry, over the previous years, and to the limited number of measurements, per gas leak, for differ-ent types of substances and pressures, on which the Tier 2
Uncertainty estimates for activity data and emission factors in the non-combustion and fugitive emissions sector (1B)
Sector Activity data Emission factors
AD unc based on: 1) EF unc based on: 1) CO2 CH4 N2O 2σ (%) 2σ (%) 2σ (%) 2σ (%) 1.B.1.b-Solid fuel transformation2)
Coke production 50 20* 50 -- R (1) R (1)
1.B.2-Fugitive emissions from venting and flaring
1.B.2.b. ii Distribution
CH4 2 -- 50 -- R (2) M (2)
1.B.2.c. Venting and flaring
CO2 50 2 -- R (1) R (1)
CH4 2 25 R (1) R (1)
1.B.2. Other
CH4 20 -- 50 -- R (1) R(1)
1) Documented as D [= Default of IPCC source category], R [= National Referenced data], or M [= Measurement based]. 2) To be corrected in the NIR 2007: uncertainty in CO2 emission factor of 20% instead of 2% (as used in the NIR 2006).
References: Huurman and Olivier (pers. comm., 2007), Gastec/KIWA (2005); this report.
approach for methane emissions from gas distribution was based.
Emissions from non-combustion or related sources
The uncertainty in annual CO2 emissions from coke production
(1B2) was estimated to be about 50%. For the annual CO2
emis-sions from gas flaring and venting this was about 50%. The uncertainty in annual methane emissions was estimated to be 25% from oil and gas production (venting), and 50% from gas transport and distribution (leakage).
Feedstocks and use of residual chemical gas 2.1.8
CO2 emissions from this group comprise:
industrial process emissions (sector 2), with a share
decreasing from a third to a fifth;
combustion emissions from blast furnace gas and residual
chemical gas (sector 1A), which share increased to about 70%;
fossil waste incineration (in 1A1a), which share increased
from 3 to 7%;
product-use emissions (sector 3).
Uncertainty in emissions from the production of soda ash and ammonia, was estimated at about 5% For most other sector 2 sources, this was about 10%. Emissions from residual chemical gas combustion, reported in sector 1A, were also less accurate, about 10%, due to the variability of their carbon content. CO2 emissions from waste incineration may have a
similar uncertainty, due to the limited accuracy of both total activity data and the underlying composition and fossil carbon fraction of the various waste types
International marine and aviation bunkers 2.1.9
The uncertainty in CO2 emissions from international bunkers
was estimated to be about 2%, annually (Boonekamp et al., 2001).
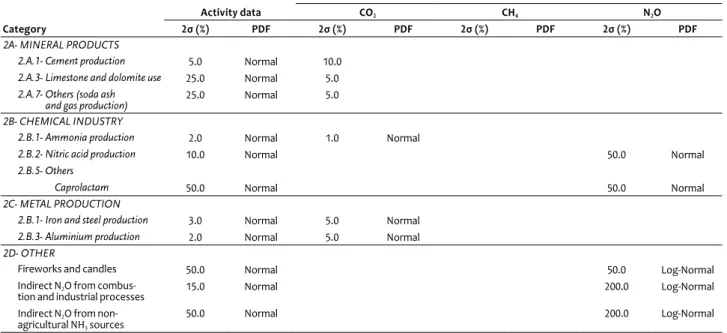
Industrial processes (2)
2.2
Table 2.7 shows the uncertainty estimates used for activity data and emission factors. for the key source assessment in industry, sector 2. Most of these estimates were made in 2002, except for the ones that were identified or recalculated for the NIR 2005.
Mineral products (2A) 2.2.1
Uncertainty estimates were based on expert judgements, since no detailed information was available for assessing the uncertainties in the emissions reported by the producers (Cement clinker production, Limestone and dolomite use, and Soda ash production).
The uncertainty in CO2 emissions from cement production
was estimated to be about 10%, annually (IPCC Tier 2 default uncertainty); based on 5% uncertainty in activity data – con-cerning the production of cement clinkers, as reported by the only Dutch company that produces them – and 10% in the CO2
emission factor.
For limestone/dolomite use and ‘other minerals’ (soda ash use and glass production), an uncertainty of 25% was used,
as a result of the relatively large uncertainty in the activity data (25%). The uncertainty in the CO2 emission factor was
estimated at 5%.
Chemical industry (2B) 2.2.2
Uncertainty estimates were based on expert judgements, since no accurate information was available for assessing the uncertainties in the emissions reported by the producers (i.e. ammonia, nitric acid, caprolactam production). Emissions from HCFC-22 manufacture were reported under category 2E.
CO2 from ammonia production
The uncertainty in CO2 emissions from ammonia was
esti-mated to be about 2%,(2% in activity data and 1% in emission factor). For other chemicals production, this uncertainty was estimated to be about 70%, as the result of a 50% uncertainty in activity data and a 50% uncertainty in the CO2 emission
factor.
N2O from nitric acid and caprolactam production
The uncertainty in N2O emissions from nitric acid was
esti-mated to be about 50%, resulting from an uncertainty in activ-ity data of 10% and 50% in the N2O emission factor. The
uncer-tainty in annual N2O emissions from caprolactam production
was estimated to be about 70% (based on uncertainties of 50% in activity data and 50% in the N2O emission factor).
Metal production (2C) 2.2.3
The uncertainty in annual CO2 emissions was estimated at
about 5% for iron and steel production (carbon inputs); based on 3% uncertainty in activity data and 5% in the CO2 emission
factor.
For aluminium production, the uncertainty in annual CO2
emissions was also estimated at about 5%, with an uncertainty in activity data of 2% and 5% in the CO2 emission factor. The
uncertainty in PFC emissions from aluminium production was estimated to be about 20% (2% in activity data and 20% in the PFC emission factor).
Food and drink (2D) 2.2.4
The uncertainty in CO2 emissions was estimated at about 5%.
Since this is a very small emission source, the uncertainties in this category were not analysed in more detail, and not included separately in the Tier 1 uncertainty analysis.
Production of halocarbons and SF6 [2E] 2.2.5
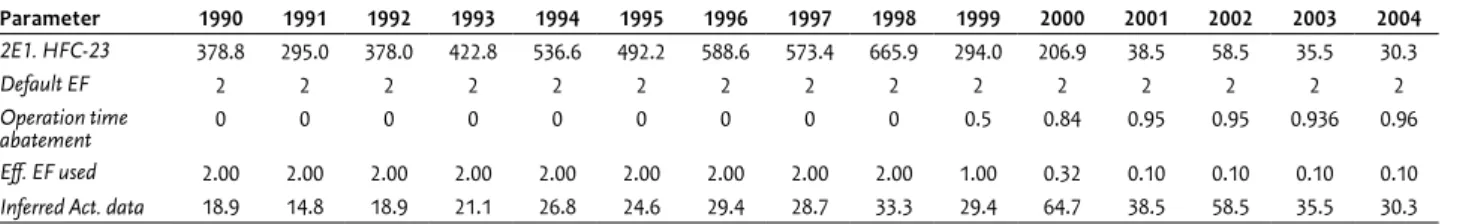
Because of confidentiality, only emissions from HFC-23 by-products were reported by the producer. An estimate of activity data and emission factors would be required for a Tier 1 or Tier 2 uncertainty assessment, associated with reported emissions.
First, the uncertainty in the activity data was estimated at 2%. Next, from a default uncontrolled emission factor and the annual operation time of the thermal afterburner, an estimate of the emission factor over time could be estimated. From this, the implied activity data could be derived.
In the 1990 to 1997 period, no end-of-pipe emission control was used. The uncontrolled emission factor for this period could be estimated, based on a) IPCC default of 4% (based on
Uncertainties in the NIR 2006 27 the US NIR from 1994 compiled for 1990 to 1993); b) EDGAR
multi-year average of 2.15% (based on the best fit of atmos-pheric concentration measurements for the 1978 to 1995 period. We selected the value of 2% for uncontrolled emis-sions, because it reflected the state of modern production plants.
The thermal afterburner was operational for 84% of the time, in 2000; for 95% in 2001; for 93.6% in 2002; and for 96% in 2004. The effective emission factors for these years were then estimated by: EF_uncontrolled * Abatement_factor, with the abatement factor equal to 1 minus the operation time of the afterburner, expressed as fraction. The calculated (implied) emission factor from 2001 to 2004 was 0.10%, 0.10%, 0.13% and 0.08%, respectively. Therefore, for 2001, we assumed a value for the effective emission factor of 0.10%. The uncertainty in the emission factors were estimated at about 50% for 1990 to 1995, and about 20% for 2004 (based on values observed for 2001 to 2004 of 0.08 to 0.13%). The uncertainty in the activity data was estimated at 2%.
In summary, for the Tier 1 uncertainty assessment, the uncertainty in HFC emissions from HCFC-22 production was estimated to be about 15%, while from handling activities this was about 50%. The uncertainty in the activity data for these sources was estimated at 10%. The uncertainties in the emis-sion factors for HFC23 from HCFC-22 production and for HFC from handling activities were estimated at 10 and 50%, respec-tively. These figures were all based on experte judgments.
Consumption of halocarbons and SF6 (2F) 2.2.6
The uncertainty in HFC emissions from HFC consumption was estimated to be 50%, and for PFC and SF6 this was about 25%
and 55%, respectively. The uncertainty in the activity data for the HFC, SF6 and PFC sources was estimated at 10%, 50%, and
5%, respectively. For the emission factors, the uncertainties were estimated at 50%, 25% and 25%. All of these figures were based on expert judgements.
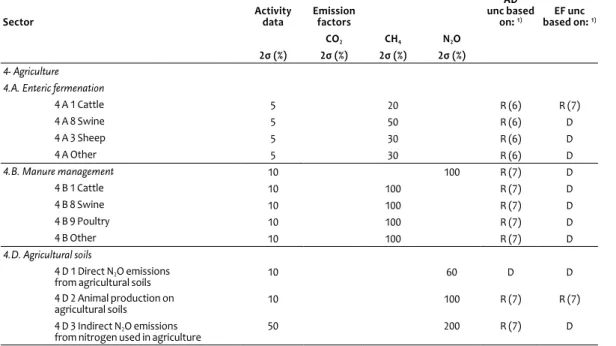
Uncertainty estimates for activity data and emission factors in sector 2 Industrial Processes and sector 3 Solvents and other Product Use
Sector Activity data Emission factors
AD unc based on: 1) EF unc based on: 1) CO2 CH4 N2O HFC PFC SF6 2σ (%) 2σ (%) 2σ (%) 2σ (%) 2σ (%) 2σ (%) 2σ (%) 2 – Industry 2 A Mineral products 2 A 1 Cement production 5 10 R (1) D
2 A 3 Limestone and dolomite use 25 5 R R (1)
1 A 7 Other minerals 25 5 R R
2 B Chemical industry
2 B 1 Ammonia production 2 1 R R
2 B 2 Nitric acid production 10 50 R R
2 B 5 Other chemicals 50 50 R R
Caprolactam production 50 50 R R
2 C Metal production
2 C 1 Iron and steel production 3 5 R R
2 C 3 Aluminium production 2 5 20 R, PFC :D R
2 E Production of halocarbons and SF6
2 E 1 By-product emissions: HFC-23 emissions from HCFC-22 manufacture
10 10 R R
2 E 3 Handling activities 10 20 R R
2 F Consumption of halocarbons and SF6
2 F (1-4) HFC Emissions from substitutes for
ozone depleting substances 10 50 D D
2 F 6 PFC emissions from PFC use 5 25 D D
2 F 9 SF6 emissions from SF6 use 50 25 R R
2 G Other industrial processes
Indirect N2O from NO2 from combustion and
industrial processes 15 200 R R
Indirect N2O from NH3
from non agricultural sources 8 200 R R
Other CO2 process emissions 5 17 R R
Other CH4 process emissions 10 50 R R
Other N2O process emissions 50 50 R R
3 Solvents and other product use
Indirect CO2 25 10 R R
N2O use 50% 0 R R
1) Documented as D [= Default of IPCC source category], R [= National Referenced data], or M [= Measurement based].