This study has been performed within the framework of the Netherlands Research Programme on Climate Change (NRP-CC), subprogramme Scientific Assessment and Policy Analysis, project
‘Options for (post-2012) Climate Policies and International Agreement’
CLIMATE CHANGE
SCIENTIFIC ASSESSMENT AND POLICY ANALYSIS
Assessing dangerous climate impacts
for the Netherlands
Report
500102 007
Authors
Joyeeta Gupta Harro van AsseltBas Amelung Janette Bessembinder Marc-Jeroen Bogaardt Leonie Bolwidt Hendrik Buiteveld, Maud Huynen Rik Leemans Pim Martens Jan Verhagen Mick van der Wegen
November 2006
This study has been performed within the framework of the Netherlands Research Programme on Scientific Assessment and Policy Analysis for Climate Change
Wetenschappelijke Assessment en Beleidsanalyse (WAB) Klimaatverandering
Het programma Wetenschappelijke Assessment en Beleidsanalyse Klimaatverandering in opdracht van het ministerie van VROM heeft tot doel:
• Het bijeenbrengen en evalueren van relevante wetenschappelijke informatie ten behoeve van beleidsontwikkeling en besluitvorming op het terrein van klimaatverandering;
• Het analyseren van voornemens en besluiten in het kader van de internationale klimaatonderhandelingen op hun consequenties.
De analyses en assessments beogen een gebalanceerde beoordeling te geven van de stand van de kennis ten behoeve van de onderbouwing van beleidsmatige keuzes. De activiteiten hebben een looptijd van enkele maanden tot maximaal ca. een jaar, afhankelijk van de complexiteit en de urgentie van de beleidsvraag. Per onderwerp wordt een assessment team samengesteld bestaande uit de beste Nederlandse en zonodig buitenlandse experts. Het gaat om incidenteel en additioneel gefinancierde werkzaamheden, te onderscheiden van de reguliere, structureel gefinancierde activiteiten van de deelnemers van het consortium op het gebied van klimaatonderzoek. Er dient steeds te worden uitgegaan van de actuele stand der wetenschap. Doelgroep zijn met name de NMP-departementen, met VROM in een coördinerende rol, maar tevens maatschappelijke groeperingen die een belangrijke rol spelen bij de besluitvorming over en uitvoering van het klimaatbeleid.
De verantwoordelijkheid voor de uitvoering berust bij een consortium bestaande uit MNP, KNMI, CCB Wageningen-UR, ECN, Vrije Universiteit/CCVUA, UM/ICIS en UU/Copernicus Instituut. Het MNP is hoofdaannemer en fungeert als voorzitter van de Stuurgroep.
Scientific Assessment and Policy Analysis (WAB) for Climate Change
The Netherlands Programme on Scientific Assessment and Policy Analysis Climate Change has the following objectives:
• Collection and evaluation of relevant scientific information for policy development and decision–making in the field of climate change;
• Analysis of resolutions and decisions in the framework of international climate negotiations and their implications.
We are concerned here with analyses and assessments intended for a balanced evaluation of the state of the art for underpinning policy choices. These analyses and assessment activities are carried out in periods of several months to a maximum of one year, depending on the complexity and the urgency of the policy issue. Assessment teams organised to handle the various topics consist of the best Dutch experts in their fields. Teams work on incidental and additionally financed activities, as opposed to the regular, structurally financed activities of the climate research consortium. The work should reflect the current state of science on the relevant topic. The main commissioning bodies are the National Environmental Policy Plan departments, with the Ministry of Housing, Spatial Planning and the Environment assuming a coordinating role. Work is also commissioned by organisations in society playing an important role in the decision-making process concerned with and the implementation of the climate policy. A consortium consisting of the Netherlands Environmental Assessment Agency, the Royal Dutch Meteorological Institute, the Climate Change and Biosphere Research Centre (CCB) of the Wageningen University and Research Centre (WUR), the Netherlands Energy Research Foundation (ECN), the Netherlands Research Programme on Climate Change Centre of the Vrije Universiteit in Amsterdam (CCVUA), the International Centre for Integrative Studies of the University of Maastricht (UM/ICIS) and the Copernicus Institute of the Utrecht University (UU) is responsible for the implementation. The Netherlands Environmental Assessment Agency as main contracting body is chairing the steering committee.
For further information:
Netherlands Environmental Assessment Agency, WAB secretariate (ipc 90), P.O. Box 303, 3720 AH Bilthoven, tel. +31 30 274 3728 or email: wab-info@mnp.nl.
Preface
This study was commissioned by the Netherlands Programme on Scientific Assessment and Policy Analysis (WAB) for Climate Change. The study has been coordinated by Joyeeta Gupta and Harro van Asselt at the Institute for Environmental Studies, Vrije Universiteit, Amsterdam. The report has been produced by:
Joyeeta Gupta & Harro van Asselt, Institute for Environmental Studies, Vrije Universiteit, Amsterdam
Janette Bessembinder with Bram Bregman, Hans van den Brink, Rob van Dorland, Wilco Hazeleger, Bart van den Hurk & Caroline Katsman, Royal Netherlands Institute of Meteorology, De Bilt
Hendrik Buiteveld & Leonie Bolwidt, Institute for Inland Water Management and Waste Water Treatment (RIZA), Lelystad
Rik Leemans, Lars Hein, Marc Metzger, Arnold van Vliet & Valentina Tasone, Environmental Systems Analysis Group, Wageningen UR, Wageningen
Mick van der Wegen, Institute for Water Education (UNESCO-IHE), Enschede
Maud Huynen, Bas Amelung & Pim Martens, International Centre for Integrated assessments and Sustainable development (ICIS), Maastricht
Jan Verhagen, Plant Research International, Wageningen UR, Wageningen
Marc-Jeroen Bogaardt, Agricultural Economics Research Institute, Wageningen UR, Wageningen
Name, address of corresponding author Dr. Joyeeta Gupta
Institute for Environmental Studies, Vrije Universiteit De Boelelaan 1087 1081 HV Amsterdam The Netherlands Tel. ++31-20-4449 555 Fax. ++31-20-4449 553 E-mail: info@ivm.falw.vu.nl
Copyright © 2006 Netherlands Environmental Assessment Agency (MNP), Bilthoven All rights reserved. No part of this publication may be reproduced, stored in a retrieval system or transmitted in any form or by any means, electronic, mechanical, photocopying, recording or otherwise without the prior written permission of the copyright holder.
List of Acronyms
ACIA Arctic Climate Impact Assessment AR4 Fourth Assessment Report of the IPCC
CAA Clean Air Act
CO2 Carbon dioxide
CZM Coastal Zone Management EPA Environmental Protection Agency GCM General Circulation Model GDP Gross Domestic Product
GHG Greenhouse gas
GIS Greenland Ice Sheet
HOT Helping Operationalise article Two ICJ International Court of Justice
IPCC Intergovernmental Panel on Climate Change IUCN World Conservation Union
KNMI Royal Netherlands Institute of Meteorology MNP Netherlands Environmental Assessment Agency MPR Maximum Permissible Risk
NGO Non-governmental organisation
NLTCT project Project on Re-evaluation of the Netherlands’ Long-Term Climate Targets
SLR Sea level rise
SRES Special Report on Emission Scenarios of the IPCC TAR Third Assessment Report of the IPCC
TBE Tick-Borne Encephalitis
TCI Tourism Climatic Index
THC Thermohaline Circulation
UNFCCC United Nations Framework Convention on Climate Change VROM Ministry of Housing, Spatial Planning and the Environment WAIS West Antarctic Ice Sheet
Contents
List of Acronyms 5
Summary and Conclusions 11
1 Introduction 25
1.1 The problem definition 25
1.2 Background 25
1.3 The Re-evaluation of the Netherlands Long-Term Climate Targets project 26
1.4 Objectives and research questions 29
1.5 Methodology 30
1.6 The structure of this report 32
2 Defining Dangerous Climate Change: A Bird’s Eye View of the Literature 33
2.1 Introduction 33
2.2 Long-term targets: rationale and types 34
2.3 The role of science 37
2.4 Methods for defining dangerous climate change 39
2.5 Overview of indicators 41
2.6 Legal interpretation of Article 2 UNFCCC 47
2.7 Outstanding issues 51
2.8 When is climate change dangerous? An overview of proposals 54
2.9 Conclusions 55
3 Observed and projected climate change: globally and in the Netherlands 57
3.1 Introduction 57
3.2 Current scientific knowledge on human influences on climate 57 3.3 Observed trends world-wide and in the Netherlands in the 20th century 58
3.4 Global climate change in the 21st century 61
3.5 The future climate in the Netherlands 61
3.6 Examples of future changes in the Netherlands 64
3.7 Conclusions 68
4 Climate Impacts for the Netherlands: Fresh Water 69
4.1 Introduction 69
4.2 Indicators for fresh water 69
4.3 Adaptation options 76
4.4 Threshold levels 76
4.5 Scientific robustness and gaps in knowledge 77
5 Ecosystems and Nature Conservation: Determining Dangerous Impacts of Climate
Change 79
5.1 Introduction 79
5.2 Plants and vegetation 80
5.3 Mammals 85
5.4 Birds 87
5.5 Marine species 91
5.6 Impacts on coral reefs 92
5.7 What to do? 94
5.8 Consequences for the ‘Burning Ember’ 95
5.9 Summary and conclusions 96
6 The Health Effects of Climate Change in the Netherlands 97 6.1 The health effects of climate change in the Netherlands 97
6.2 Indicators 97
6.3 Adaptation options 101
6.4 Acceptable thresholds 102
6.5 Dangerous health effects of climate change 103
6.7 Conclusions/summary 110
7 Climate Impacts on the Coastal Zone 111
7.1 Introduction 111
7.2 Indicators 112
7.3 Adaptation options 115
7.4 Threshold levels 116
7.5 Scientific robustness and gaps in knowledge 116
8 Climate Impacts on Tourism and Recreation 117
8.1 Indicators 117
8.2 General climatological suitability 118
8.3 Season for tourism and recreation 119
8.4 Frequency of the Elfstedentocht event 119
8.5 Adaptation 120
8.6 Thresholds 120
8.7 Scientific robustness and gaps in knowledge 121
8.8 Conclusion 121
9 Climate Impacts on Agriculture 123
9.1 Indicators 123
9.2 Crop productivity 124
9.3 Damage from extreme weather events 125
9.4 Commodity prices 126
9.5 Adaptation 127
9.6 Thresholds 127
9.7 Scientific robustness and gaps in knowledge 127
10 Conclusions and recommendations 129
10.1Introduction 129
10.2Methodology 129
10.3Literature review on assessing dangerous climate change 129 10.4Towards an updated Netherlands’ perspective on dangerous climate change 130 10.5Indicators of relevance to the Netherlands situation 130
10.6Indicators and threshold levels 134
10.7Communicating the information 136
10.8Temperature or concentration targets 139
10.9Policy recommendations 139
References 141
Annex 1 Workshop Report 161
List of Tables
1. An ideal-typical assessment of how disciplines would deal with ‘danger’. 13
2. Legend for the KNMI’06 climate scenarios. 14
3. Climate change in the Netherlands around 20501, compared to the baseline year
19902, according to the four KNMI'06 climate scenarios. 14 4. Indicators and impacts relevant for the Netherlands at different mean global
temperature rise compared to pre-industrial level (with and without adaptation). 19 1.1. Preliminary list of indicators and threshold levels. 28
1.2. Indicators selected for this report. 31
2.1. Ways of expressing long-term (LT) targets along the climate change cycle 36 2.2. An ideal-typical assessment of how disciplines would deal with ‘danger’ 39 2.3. A taxonomy of indicators for dangerous climate change. 42 2.4. Selected indicators used in regional and national studies. 43
2.4. Overview of proposals for thresholds 55
3.1. Legend for the KNMI’06 climate scenarios. 62
3.2. Climate change in the Netherlands around 20501, compared to the baseline year
3.3. Average number of days per year met certain temperatures around 2050 under
various climate scenarios (KNMI’06 scenarios) for four locations in the Netherlands. 65 4.1. Working standards for water logging as agreed in the Dutch National Administrative
Agreement on Water. 74
5.1. Predicted bird extinctions for different scenarios up to 3oC. 90 6.1. Bioclimatic (temperature) thresholds for Ixodes ricinus, the tick responsible for the
transmission of Lyme disease. 100
6.2. Adaptation options for reducing the health impacts of climate change: heat wave
mortality, Lyme disease and pollen allergies. 101
6.3. Acceptability thresholds for heat wave mortality, Lyme disease and pollen allergy. 103 6.4. Number of excess heat wave deaths resulting in real loss of life, averaged per year,
under different assumptions. 105
6.5. Climate change and Lyme disease: winter and summer. temperature thresholds
of ticks 106
6.6. Climate change and heat wave mortality: Evaluation scientific basis. 108 6.7. Climate change and Lyme disease: Evaluation scientific basis. 109
7.1. Costs of adaptation works (in billion euro). 114
7.2. Yearly averaged chloride concentration (mg/l) near Ridderkerk after Jacobs (2004). 115
8.1. Proxies used for the +0, +1, +2, +3 degree cases. 118
8.2. Change in the Tourism Climatic Index for the Netherlands according to the
+1, +2, +3 degree change scenario. 118
8.3. Change in the number of months with very good conditions for outdoor tourism
and recreation in the Netherlands according to the +1, +2, +3 degree change scenario.119 10.1. Indicators and impacts relevant for the Netherlands at different mean global
temperature rise compared to pre-industrial level (with and without adaptation). 135
List of Figures
1. Schematic overview of the four KNMI’06 climate scenarios (for an explanation see the
legend below). 13
2. ‘Burning Embers’ figure for impacts relevant to the Netherlands (updated). 20 3. ‘Burning Embers’ figure highlighting issues of relevance for Dutch residents. 22 1.1. Perceived levels of danger associated with different levels of temperature rise 29
1.2. Legend for ‘Burning Embers’ figure. 32
3.1. Average annual temperature on earth (left) and in De Bilt (right) between 1860 and
2005. 59
3.2. Trends in number of days per year with at least 20 mm precipitation, measured at
European weather stations between 1946 and 2004 59
3.3. Sea level rise in mm per year between 1993 and 2004 as measured by satellites 60 3.4. Schematic overview of the four KNMI’06 climate scenarios. 62 3.5. Map with the observed number of summer days (left; maximum temperature
>= 25°C) per year for 1971-2000, and for four locations in the Netherlands the
climate scenarios for 2050. 65
3.6. Number of heating degree-days per year in the Bilt between 1900 and 2005, and the four climate scenarios for 2050 (coloured points). The thick black line represents
the 30-year moving average in the observations. 66
3.7. Day number in the year at which the average day temperature reaches 5°C and after which it remains above 5°C until the first of July in De Bilt between 1900
and 2005, and the four climate scenarios (coloured lines). 67 3.8. Cumulative precipitation deficit (=difference between precipitation and potential
evaporation) in the Netherlands (average 13 stations) for the historical climate
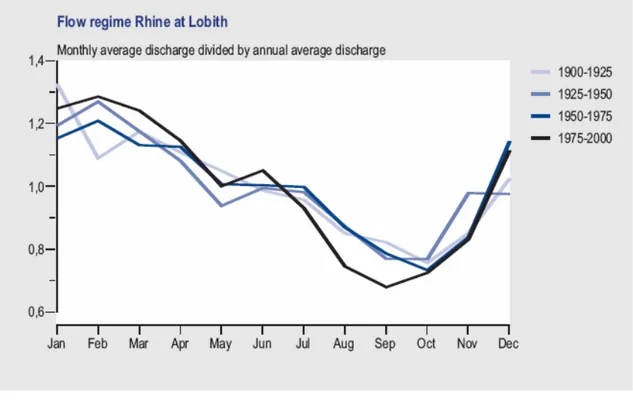
(1906-2000; black), and two climate scenarios for 2050 (W and W+) 67 4.1. In recent decennia the winter discharge from the Rhine has increased and the
summer discharge has decreased 70
4.2. In all four of the climate scenarios considered, the winter discharge increases even more in the future; the summer discharge decreases for the Rhine in all of
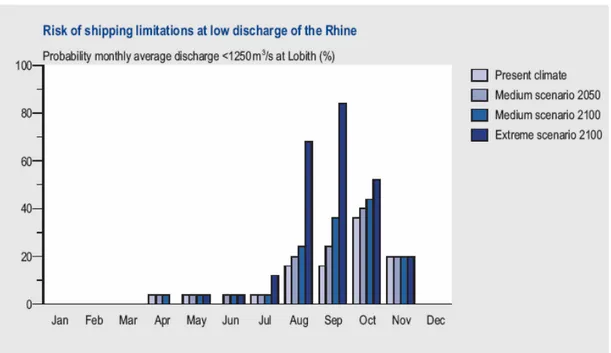
4.3. The probability of extremely low river discharge and limited navigatable depth
mainly increases compared to the current situation 72
4.4. Average annual temperatures of the water in the River Rhine at Lobith during the
period 1909-2003 72
4.5. Trend in the number of days per year when the temperature of the water in the
Rhine was higher tan 23°C during the period 1909-2003 73 4.6. Waterlogging problems, during extreme rainfall events, such as the autumn of 1998,
different region were affected (after: Rainfall figures KNMI). 74 5.1. The ‘Burning Ember’ of risks for negative impacts in plant phenology. 81 5.2. The ‘Burning Ember’ for vegetation productivity. Assessed is the risk that the current
carbon sink function turns into a carbon source under changed climate conditions. 82 5.3 Satellite derived change in forest productivity in Alaska and Northern Canada. 84 5.4. The ‘Burning Ember’ for risks of negative impacts of plant species and vegetation
shifts and the subsequent consequences for biodiversity. 85 5.5. The ‘Burning Ember’ for risks of negative impacts on mammal species. 87 5.7. The ‘Burning Ember’ for risks of negative impacts on migratory bird species. 91 5.8. Sea surface temperatures and regional coral bleaching as determined by chlorophyll
content at the Great Barrier Reef in March 2006. 93
5.9. The ‘Burning Ember’ for risks of negative impacts on marine species and ecosystems. 94 5.10. The final ‘Burning Ember’ summarizing the risks for ecosystem impacts. 96
6.1. Health effects of climate change. 97
6.2. Heat wave scenarios for a 1, 2 and 3°C temperature rise compared to 1961-1990 104 7.3. Tick activity: percentage of days with a minimum temperature of at leas 5°C,
per season 106
7.1. The process of coastal squeeze. 113
8.1. Change in the Tourism Climatic Index for the Netherlands according to the +1, +2,
+3 degree change scenario. 119
8.2. The estimated relationship between temperature change and the number of
potential Elfstedentocht events per century 120
10.1. ‘Burning Embers’ figure for impacts relevant to the Netherlands (updated). 136 10.2. ‘Burning Embers’ figure highlighting issues of relevance for Dutch residents. 138
Summary and Conclusions
Introduction
In order to understand the urgency with which climate change needs to be controlled, it is important to realise the extent to which climate change can become dangerous for countries. The key question that we address is thus: How can Article 2 of the United Nations Framework Convention on Climate Change (UNFCCC, 1992) be elaborated into quantitative indicators for climate change control? Article 2 UNFCCC states:
“The ultimate objective of this Convention and any related legal instruments that the Conference of the Parties may adopt is to achieve, (…), the stabilization of greenhouse gas concentrations in the atmosphere at a level that would prevent dangerous
anthropogenic interference with the climate system. Such a level should be achieved
within a time-frame sufficient to allow ecosystems to adapt naturally to climate change, to ensure that food production is not threatened and to enable economic development to proceed in a sustainable manner” (emphasis added).
Other relevant questions are:
• What operational criteria could be developed to indicate dangerous and non-dangerous levels of anthropogenic interference with the climate system?
• What indicators can be selected that are both politically relevant and publicly comprehensible and appealing, and that can be scientifically substantiated (attributable to climate change, reliable/valid, measurable, predictable)?
• How can different indicators be integrated?
In 1996, the Government of the Netherlands decided to interpret Article 2 as follows:
• The global average temperature should not rise above a maximum of +2ºC compared to pre-industrial levels;
• The rate of temperature change should be less than +0.1ºC per decade; and;
• Sea-level rise should be limited to a maximum of 50 cm (VROM, 1996: 88-89).
Subsequently, the European Council adopted a long-term climate policy goal to limit global warming to maximally 2ºC and a concentration level of 550 ppmv of CO2 emissions (EC, 1996). These targets are subject to revision based on the latest information.
The earlier commitment of the Dutch Government in 1996 to interpret Article 2 proactively shows that within the Dutch political system there is a need for clarity regarding end goals. With the subsequent adoption by the EU of a goal in 2000, and by several other European countries,1 the Netherlands is certainly not alone in the effort to better understand how the long-term target should be articulated. The Netherlands has also systematically requested assessments of the term dangerous climate change, and from that we infer that at least at the political level there is a need to be informed about the latest science in this field.
The question now is: Are these targets still valid given the new science available and to what extent is the underlying science anecdotal or based on substantial literature? This is a separate question from: Are these targets realistic?
In 2004, a team of Dutch researchers prepared an assessment of when climate change may become dangerous to the Netherlands (Gupta & van Asselt (eds.), 2004). However, there were many gaps in the assessment, and it was also unclear the extent to which the underlying information was based on anecdotal cases or was based on trends observed in the literature. Hence, the purpose of this project is to provide a more up-to-date assessment of an understanding of when climate change may become dangerous to the Netherlands.
Methodology
This report is not the result of new research. It is instead an assessment project, which means it merely assesses the existing scientific information available at this point of time. In other words, this report has a limited methodology. It should be noted, however, that the research builds further on the earlier completed assessment of when climate change becomes dangerous for the Netherlands. Three points about this assessment can be noted here. First, although some scientists see a definition of dangerous climate change as a futile exercise, we see it as a worthwhile endeavour, despite its shortcomings. Second, through identifying indicators, it is possible to work backwards through identifying threshold levels, temperature changes and concentration levels, and finally define acceptable emission levels. Third, although we build further on the results of a limited participatory integrated assessment, carried out in the previous round of a related project, this project merely updated the information and tested out the results at a national workshop.
Literature review on assessing dangerous climate change
A literature study of research undertaken to define dangerous climate change reveals a number of key issues:
• What is inherently clear is that defining dangerous climate change is something that is highly controversial. Many scientists deny that there is an objective method to define dangerous climate change and hence argue that the effort to do so is futile. Others argue that given the high degree of danger inherent in climate change, it is absolutely vital that efforts are made to define what constitutes dangerous climate change.
• Although there are a number of different methods used to identify dangerous climate change, most seek to only look at some part of the entire chain from impact through concentrations to emissions to the perception of the problem. Most authors identify indicators related to certain climate impacts but the identification of thresholds is difficult, as most impacts gradually increase with increasing temperatures. In such a case there are no clear thresholds. There is also considerable overlap between the indicators identified in the literature. Most articles focus on one or more indicators.
• Each discipline looks at danger differently and what is considered dangerous also differs between one person and another. In this report we try to indicate the reasons that can be given to consider a certain climate change dangerous or not.
• In the selection and assessment of indicators there are two kinds of risks. One, the choice of scale to determine risk is mainly national. At least most countries and researchers are studying this at national level. Only systemic impacts (i.e. large-scale events) are evaluated at a global level; almost all other impacts are seen purely from a national or local perspective. This may imply that impacts in other countries and regions are not taken into account to the fullest extent. The other issue is that there is a tendency to argue that since such risks are gradual, adaptation can play a major role. However, taking adaptation into account is not an easy exercise; and literature on adaptation demonstrates the numerous problems involved.
• Finally, several authors argue that a 2 ºC rise in temperature (or 400 ppmv CO2-eq. Concentration level) from pre-industrial levels is the level at which dangerous climate change can set in because of the potential impacts of low-probability high-impact events. However, for many sectors and for abrupt and extreme events it is not clear if specific thresholds can be specified. Gradual change of our climate and gradual change of related impacts without a clear threshold temperature is more common. Therefore ultimately, the discussion on what is dangerous climate change, or in other words what are we willing to accepted as a society, will be determined in the political arena, on the basis of much more than only the scientific information.
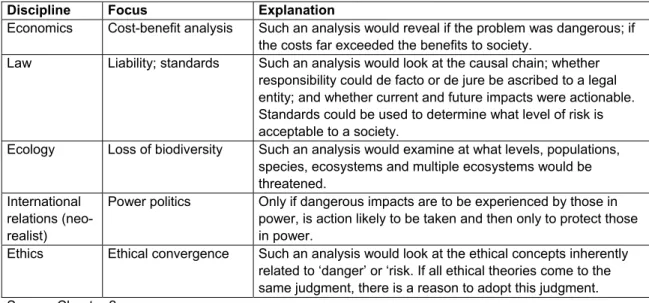
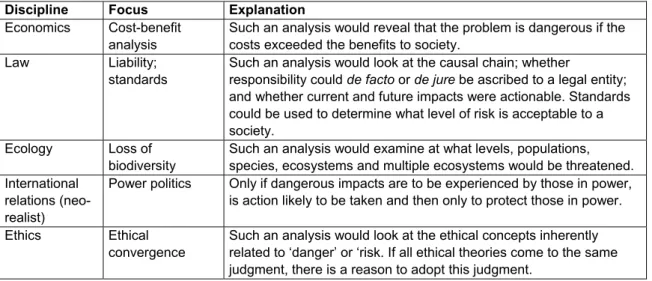
Table 1. An ideal-typical assessment of how disciplines would deal with ‘danger’.
Discipline Focus Explanation
Economics Cost-benefit analysis Such an analysis would reveal if the problem was dangerous; if the costs far exceeded the benefits to society.
Law Liability; standards Such an analysis would look at the causal chain; whether responsibility could de facto or de jure be ascribed to a legal entity; and whether current and future impacts were actionable. Standards could be used to determine what level of risk is acceptable to a society.
Ecology Loss of biodiversity Such an analysis would examine at what levels, populations, species, ecosystems and multiple ecosystems would be threatened.
International relations (neo-realist)
Power politics Only if dangerous impacts are to be experienced by those in power, is action likely to be taken and then only to protect those in power.
Ethics Ethical convergence Such an analysis would look at the ethical concepts inherently related to ‘danger’ or ‘risk. If all ethical theories come to the same judgment, there is a reason to adopt this judgment. Source: Chapter 2.
Towards an updated Netherlands’ perspective on dangerous climate change
An assessment of the state of the science on the climate system shows that given the multiple scales at which the climate change system functions, and the multiple positive and negative feedback loops, the future evolution of (regional) climate is subject to many uncertainties. These include the uncertainties regarding the development of anthropogenic activities, and related emissions of greenhouse gases and changes in land use; and limited understanding of the complex climate system; its inherent internal variability and its response to changes in concentrations of greenhouse gasses and land use changes. Nevertheless, the Royal Meteorological Institute for the Netherlands formulated four scenarios for the Netherlands. It is considered most likely that our future climate will develop between these four ‘corner points’ (see Figure 1 below).
G+
+ 1 °C + 2 °C Air circulation patterns World Temperature in 2050W+
G
W
change d unchangedFigure 1. Schematic overview of the four KNMI’06 climate scenarios (for an explanation see the legend below).
Table 2. Legend for the KNMI’06 climate scenarios.
* ‘G’ is derived from ‘Gematigd’ = Dutch for ‘moderate’.
The implications of this for the Netherlands are:
Table 3. Climate change in the Netherlands around 20501, compared to the baseline year 19902, according to the four KNMI'06 climate scenarios.
N.B. Footnotes to this table are not included here. Please see Chapter 3.
In general, projected changes have an increasing uncertainty when following the series of variables from temperature via sea level rise, precipitation and wind. Wintertime precipitation is more certain than changes in precipitation in summer. The mean changes are more certain than changes in extremes (events that occur once per 10 year or even less, and also ‘abrupt’ changes). This chain is partly dictated by the complexity of the underlying physical processes. The gaps in knowledge include the circulation response of increased greenhouse gas concentrations; the dynamics of glaciers and large ice sheets; changes in precipitation at high latitudes; and the role of land surface interactions including snow and soil water.
Indicators of relevance to the Netherlands situation
The previous project identified 23 indicators on the basis of available literature and a workshop with a limited number of stakeholders. The indicators were chosen to be representative and scientifically sound for the assessment of climate change impacts in the Netherlands. Since the discussion on the assessment of the term ‘dangerous’ is closely related to public perceptions, an important criterion for the selection of the indicators was the appealing character of the indicator. Furthermore, it was decided not to present an extensive list of indicators, in order to keep the discussion transparent. In this project, the project team revisited the indicators on the basis of the new information available and concluded that the key indicators could be clustered along six key sectors for the Netherlands – namely fresh water, ecosystems, health, coastal zones, tourism and recreation, and agriculture. The impacts on industry (e.g. cooling water for energy generation) were captured under the above headings. It was also decided not to study economic impacts separately from the sectors, since that would lead to double counting. In addition, the team decided to include the threats posed by extreme events and abrupt events separately. Finally, during the stakeholder workshop in the previous project, some global indicators were seen also as critical to the Dutch cosmopolitan identity. Although these were not specifically investigated, it was decided to keep a generic category of international solidarity as an indicator.
Impacts on fresh water may require substantial adaptation
Four indicators in the area of fresh water were selected for this study, of which two are related to river discharge and two to precipitation. For river discharge these are design discharge and low flow discharge, as an indicator for navigation. For precipitation, these are the 10-day precipitation sum as an indication for waterlogging, and the precipitation deficit. The indicators stand for instance for the safety against flooding, access to and availability of clean water, navigation, and cooling water. The research indicated that due to climate change the river discharge is expected to increase in the winter and decrease in the summer. There is a likelihood that the regional water and the urban drainage system will have greater waterlogging problems, due to increasing precipitation. The Netherlands already experiences a minor water deficit in the summer months, and depending on the climate scenario the problems in the local system increase. Larger water deficits may result in serious problems for e.g. agriculture, ecosystems, etc. Due to lower river discharge and sea level rise it will be more difficult to discharge the river water in the North Sea. As a consequence there will be more salt-water intrusion, which threatens the fresh water supply for the regional water system and the drinking water supply. Due to the lower discharge of the Rhine in the summer, navigation will be negatively affected in summer months. Problems with cooling water for power plants will increase, because the water temperature will increase due the lower discharge and the increasing temperature. In order to reduce the risk of climate change the water system will need to be adapted to a climate change based on the +1°C temperature increase for 2050. In the case of flooding the adaptations consists of retaining and storing of water. However, there are also problems related to, for example, cooling water, where the adaptation has to be made by the sector itself. The above information is partly based on existing laws and policies, and partly on well-established scientific information, while some of the extrapolation is partly based on reasoning.
Ecosystems may not easily adapt
Indicators were selected for five elements of ecosystems that may be affected at a global, regional and local level. The elements include phenology, plants and vegetation, mammals, birds, and marine species. Indicators for each of these elements were assessed and these revealed that considerable impacts are already occurring now. Many show that species and ecosystems are able to cope with observed levels of climate change but some are detrimental. Beyond a 1-2°C warming, these detrimental impacts are expected to start to dominate and beyond a 2°C risks rapidly increase. This could become a major threat to biodiversity. The assessment of the recent scientific literature indicates that the Third Assessment Report of IPCC underestimated the climate change impacts on species and ecosystems. The terrestrial carbon balance would likely shift after a few decades from a sink into a source. This has serious
consequences for managing atmospheric concentrations. There will be rapid phenological responses of plants and animals, widespread shifts in species geographic ranges, and changes in structure and composition of most ecosystems (not only in the boreal zone as previously stressed). There is now growing evidence for a high vulnerability of a considerable fraction of species becoming committed to extinction than previously assessed. Changes in disturbance and other stresses such as fires, invasive species and pollution are likely to exacerbate climate change impacts.
Endemic species (i.e. unique species confined to a small area) are very sensitive to climate change, resulting in clear impacts on biodiversity and biodiversity hotspots. The most sensitive ecosystems are coral reefs, Arctic systems, mountains, Mediterranean systems and savannas. In most cases, species persistence requires migration rates that exceed their natural adaptive capacity. These effects, combined with landscape fragmentation and pollution, limit natural adaptation, and increase their risk of extinction during this century. Marine ecosystems and species appear more able to shift range rapidly than many terrestrial species. All these impacts will lead to detrimental changes in ecosystem services. Impacts on sustainable development and livelihoods of people depending on the ecosystems remain, however, difficult to estimate. The TAR already established in 2001 that beyond 2ºC global mean temperature increase compared to the pre-industrial level risks for negative impacts on species and ecosystems rapidly increased. This analysis shows that this assessment was too conservative. Risks for impacts on many local and regional species and ecosystems already rapidly increase beyond 1ºC global mean warming and are also not negligible at lower temperature increases.
To limit the risks for impact of climate change on ecosystems two approaches have to be taken. First, climate change has to be limited by limiting and reducing greenhouse gas emissions. This seems economically and technologically feasible. Second, the resilience of species and ecosystems has to be increased. One of the most effective strategies to achieve this is to reduce other stresses on species and ecosystems and enhance conservation efforts. However, the cascade of uncertainties from climate change projections through species to ecosystem responses remains a significant barrier to develop coherent and detailed regional policy planning.
Impacts on health
In the health sector, three indicators were chosen. These include increased mortality as a result of heat waves, increased risk of Lyme disease, and an increased risk of pollen allergies. Past heat waves in the Netherlands have resulted in an excess mortality of 38.9 excess deaths (12.8%) per heat wave day. However, part of the excess mortality during heat waves must be viewed as ‘only a slight forward displacement of deaths’. The other part of the excess mortality, however, relates to avoidable deaths and substantial loss of life. The most vulnerable to heat waves are senior citizens, persons with cardiovascular or respiratory disease, and young children. The view that climate change will have an impact on heat wave mortality is well established. Climate-change-induced heat wave mortality might become unacceptable under various assumptions regarding adaptation capacity and ‘forward displacement’.
The expectation that climate change has an impact on Lyme is well established, although more quantitative research is required. Tick densities are positively correlated with human Lyme disease. With less harsh winters, it is expected that tick survival, and, consequently, tick densities will increase. In addition, a significant prolongation of the tick-season is expected. If climate change would result in a (possible) 1% increase in disease incidence, the acceptable lifetime risk on morbidity – induced by climate change – might be exceeded.
Weather conditions affect the timing/duration of the pollen season, the quantity of pollen produced and the geographic distribution of flowering plants. However, the impact of climate change on allergic disorders is uncertain and there is a need to better understand this relationship between the changing climate and allergic disorders.
A wide range of adaptation options are possible which include legislative, technical, educational and behavioural changes that could enhance the ability of humans to overcome these risks. What is clear is that risks increase as temperature rises, but that adaptation may reduce these risks somewhat. More research on adaptive capacity is required.
Impacts on coastal zones will require substantial investment and adaptation
Having a long history of battling sea level rise, the Netherlands is well prepared to deal with the three indicators related to coastal zones.
• The first indicator is coastal squeeze, where a rising sea level leads to a shrinking of the coastal zones: Dune type of environments are thus gradually changed into more hard protection measures like dike systems.
• The second indicator is the risk of flooding. In order to maintain the current risk standards, major protection measures are needed against rising costs in case of higher sea levels. The same holds for the frequency and magnitude of exponentially rising costs in case of higher sea levels. Additionally a rising sea level brings with it a higher uncertainty. The reason for this is that the behaviour of the North Sea system induced by higher sea levels is not known from history. The same holds for the frequency and magnitude of extreme events like storms.
• Salt-water intrusion is the third indicator. Higher sea levels will cause salt surface water and groundwater to intrude further inland, impacting the freshwater supply and ecosystems. While in the short-term salt water intrusion can be prevented through membrane filtering techniques, in the longer-term, this may be difficult to deal with and drinking water inlets need to be moved more upstream.
Impacts on tourism and recreation may be beneficial
Not all the news is bad, as the story about tourism and recreation indicates. Climate change will generally have a positive influence on tourism and recreation in the Netherlands. Overall conditions for outdoor tourism activities (represented by the annual mean Tourism Climatic Index) will improve, and in summer, the period with very good circumstances will lengthen substantially, perhaps even by several months. One of the drawbacks of climate change for tourism and recreation in the Netherlands is the decreasing availability of natural ice in winter that is of sufficient quality for ice-skating. This trend is symbolised by the projected decreasing likelihood of the Elfstedentocht ice-skating events.
Impacts on agriculture
Three indicators were selected to represent the potential impacts on agriculture. These include a change in crop productivity, damage from extreme weather events and changes in commodity prices. Farmers are used to dealing with weather variability, a two degree temperature increase over the next century will not have a severe impact on the sector, as farmers will adapt. The direction and speed of development in the sector are strongly determined by economic and technological drivers. However, farming systems are vulnerable to extreme weather events and salt water intrusion. To which extent insurance remains a feasible option is unclear.
As the effects of climate for the Netherlands are relatively low when compared to other regions in Europe (e.g. southern Europe) current trends of intensification of agriculture in northern and Western Europe and extensification in the Mediterranean and south-eastern parts of Europe could be reinforced by climate change. These developments could have a positive effect on the competitiveness of agriculture in the Netherlands.
As the Netherlands is strongly engaged in commodity trade, impacts of climate change in other countries may raise the price of commodities affecting the market situation. In globalising and liberalising markets it will most likely result in shifts in production centres.
Extreme events
There is much speculation in the literature about the increased risk of extreme events following climate change. On the basis of the most recent analyses of KNMI it can be concluded that as a result of climate change:
• Temperatures, and related the chance of heat waves, will continue to increase;
• Precipitation in winter will increase, resulting in higher river discharges. In summer precipitation may increase slightly, or decrease clearly, resulting in hardly any change in river discharges or clear decrease. The intensity of extreme precipitation will increase in winter and summer;
• There is no indication that the intensity of gales in the Netherlands will increase clearly as a result of climate change.
Despite the small risk of extreme events in the Netherlands occurring, the financial and socio-economic consequences could be enormous. The possible impacts of these extreme events have been included in the sectoral indicators, e.g. agricultural damage from drought, increase mortality due to heat waves, and floods.
Impacts of low risk high impact abrupt events could be substantial and need to be avoided
A key problem is the potential of low-risk high-impact events that could change the shape of the climate – and the world – completely. Examples of low risk - high impact events are melting of large ice caps (Greenland, Antarctica), collapse of the thermohaline circulation, excessive release of carbon by melting permafrost etc. Most literature considers it unlikely that these events will occur in the 21st century at the temperature projections of the IPCC (+1.4 up to 5.8°C compared to 1990). Although, most consider the risk to increase with increasing temperatures (but still unlikely during the 21st century), no clear threshold can be given.
North-South solidarity
While many of the risks to the Netherlands may be manageable if the rate of change does not exceed certain thresholds, small island states and developing countries with coastal zones, and mountain zones are likely to be extremely vulnerable to a global mean temperature rise. There is very little literature to assess when solidarity thresholds can be crossed, but we did not consider that reason enough to not even mention this point.
Indicators and threshold levels
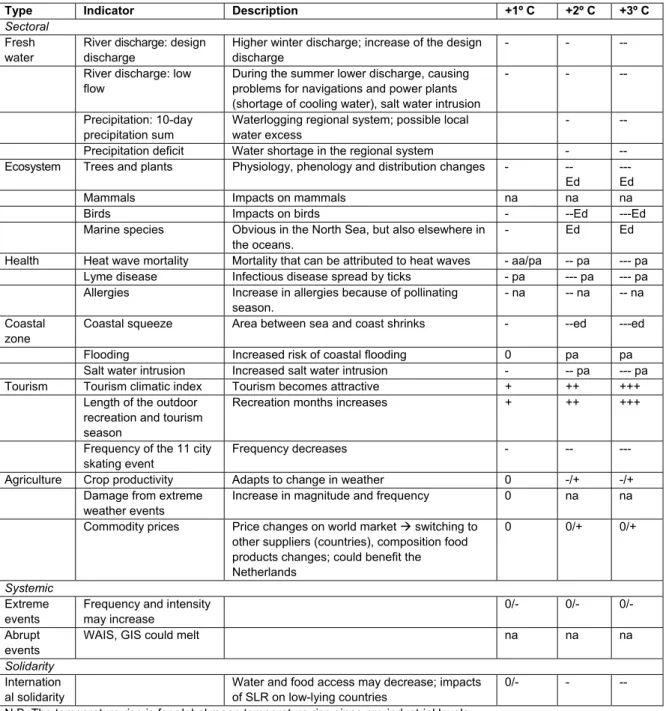
The following table attempts to sum up the information provided above in a comparative and simple manner. It indicates the type of indicator; the name of the indicator; and a brief description of the impacts for the Netherlands. It then uses a simple code to indicate how serious the impact can be; where a negative sign stands for a negative impact, and a positive sign for a positive impact. 0 stands for neutral. Where there will be autonomous adaptation – we indicate that with ‘aa’. Where there needs to be proactive adaptation, we indicate that with ‘pa’. Where systems become endangered, we show that through ‘ed’. The term ‘na’ indicates not available. For a more extensive and nuanced description, see the various Chapters.
Table 4. Indicators and impacts relevant for the Netherlands at different mean global temperature rise compared to pre-industrial level (with and without adaptation).
Type Indicator Description +1º C +2º C +3º C Sectoral
Fresh water
River discharge: design discharge
Higher winter discharge; increase of the design discharge
- - --
River discharge: low flow
During the summer lower discharge, causing problems for navigations and power plants (shortage of cooling water), salt water intrusion
- - --
Precipitation: 10-day
precipitation sum
Waterlogging regional system; possible local water excess
- --
Precipitation deficit Water shortage in the regional system - -- Ecosystem Trees and plants Physiology, phenology and distribution changes - --
Ed
--- Ed
Mammals Impacts on mammals na na na
Birds Impacts on birds - --Ed ---Ed
Marine species Obvious in the North Sea, but also elsewhere in the oceans.
- Ed Ed
Health Heat wave mortality Mortality that can be attributed to heat waves - aa/pa -- pa --- pa Lyme disease Infectious disease spread by ticks - pa --- pa --- pa Allergies Increase in allergies because of pollinating
season.
- na -- na -- na Coastal
zone
Coastal squeeze Area between sea and coast shrinks - --ed ---ed
Flooding Increased risk of coastal flooding 0 pa pa
Salt water intrusion Increased salt water intrusion - -- pa --- pa
Tourism Tourism climatic index Tourism becomes attractive + ++ +++
Length of the outdoor recreation and tourism season
Recreation months increases + ++ +++
Frequency of the 11 city skating event
Frequency decreases - -- ---
Agriculture Crop productivity Adapts to change in weather 0 -/+ -/+
Damage from extreme weather events
Increase in magnitude and frequency 0 na na
Commodity prices Price changes on world market Æ switching to other suppliers (countries), composition food products changes; could benefit the Netherlands
0 0/+ 0/+
Systemic
Extreme events
Frequency and intensity may increase
0/- 0/- 0/-
Abrupt events
WAIS, GIS could melt na na na
Solidarity
Internation al solidarity
Water and food access may decrease; impacts of SLR on low-lying countries
0/- - -- N.B. The temperature rise is for global mean temperature rise since pre-industrial levels.
Communicating the information
The potential impacts of climate change on the Netherlands can be visualised as shown in the following figure. This figure updates and replaces the earlier figure entitled ‘Perceived reasons for concern in the Netherlands’ (Gupta & van Asselt (eds.), 2004). The following figure includes impacts on six sectors; irreversible systemic impacts; and international impacts that may concern the Dutch citizen. Text in bold indicates whether there is substantial literature pointing in a specific direction. As the colour turns from white through yellow to red, we expect that acceptable threshold levels will be crossed (when going from yellow to red). Although adaptation is possible in many areas, the cost of adapting increases as major thresholds are crossed.
Figure 2. ‘Burning Embers’ figure for impacts relevant to the Netherlands (updated).
Clarification reasoning behind the ‘Burning Embers’:
• Fresh water: With increased temperatures the fresh water problems increase. The quantitative water sector aims at an adaptation based on a temperature increase of 1-2°C (compared to the 1990 situation), therefore compared with pre-industrial red starts between 2 and 3°C. Problems associated with drought and low flow can however already be problematic in an earlier stage.
• Ecosystems: Many changes are already observed in ecosystems. Many are adequate responses to cope with the changing climate but some are detrimental. The adverse impacts include the decline in population of migratory bird species and shifts in food webs in the North Sea. Negative impacts start to dominate beyond a 1°C temperature increase and increase in extent and magnitude beyond a 2°C temperature increase.
• Health: Health effects are expected with every temperature rise. Based on the lower threshold (i.e no increase in the chance of dying), climate change is only acceptable if adaptation will prevent all climate change induced heatwave deaths. Under a variety of assumptions (incl. adaptation), the upper acceptability threshold (i.e. acceptable annual risk
Temperature change (ºC) Global mean w.r.t. pre-industrial level
1 2 3
present
Ecosystems Risks to ecosystems like Wadden Sea Risks to manyspecies and ecosystems Health Heat wave mortality High
Lyme; allergies increases
CZM SLR 20 cm/century; doubling of costs for coastline maintenance damage to coastal ecosystemsSLR 35-45 cm/century; severe SLR 40-55 cm/century; allowingregular coastal flooding
Tourism TCI +3; Good months: 3 Skating event ½ present Skating event ¼ presentTCI +6; good months: 4 TCI +8; good months: 4.5Skating event 1/5 present Agriculture
Extreme events extreme events will further increaseIntensity and frequency of some
Abrupt events Probability low risk-high impact events ( WAIS, THC, GIS) increases Int. solidarity States and coastal areasHigh risks to low-lying water and food shortageHigh risks of regional
Fresh water High risk navigation; high risk of flooding; High risk salt-water intrusion and drought increase in intense winter
precipitation; high risk to cooling water; medium risks to navigation
Adaptation difficult Adaptation difficult Adaptation difficult Adaptation difficult Adaptation difficult Adaptation difficult pre-ind. level Invasion of species Risks to some ecosystems
Damage from extreme
weather events Higher
Low Adaptation difficult
Temperature change (ºC) Global mean w.r.t. pre-industrial level
1 2 3
present
Ecosystems Risks to ecosystems like Wadden Sea Risks to manyspecies and ecosystems Health Heat wave mortality High
Lyme; allergies increases
CZM SLR 20 cm/century; doubling of costs for coastline maintenance damage to coastal ecosystemsSLR 35-45 cm/century; severe SLR 40-55 cm/century; allowingregular coastal flooding
Tourism TCI +3; Good months: 3 Skating event ½ present Skating event ¼ presentTCI +6; good months: 4 TCI +8; good months: 4.5Skating event 1/5 present Agriculture
Extreme events extreme events will further increaseIntensity and frequency of some
Abrupt events Probability low risk-high impact events ( WAIS, THC, GIS) increases Int. solidarity States and coastal areasHigh risks to low-lying water and food shortageHigh risks of regional
Fresh water High risk navigation; high risk of flooding; High risk salt-water intrusion and drought increase in intense winter
precipitation; high risk to cooling water; medium risks to navigation
Adaptation difficult Adaptation difficult Adaptation difficult Adaptation difficult Adaptation difficult Adaptation difficult pre-ind. level Invasion of species Risks to some ecosystems
Damage from extreme
weather events Higher
Low Damage from extreme
weather events Higher
Low Adaptation difficult
of dying= 10-6) will be exceeded with a temperature rise of +3°C (compared to 1960-1990). Climate change is expected to increase tick densities (due to increased winter survival and prolongation of the tick season) and, subsequently, the risk on Lyme disease. The vast increases in tick-bites and Lyme disease in the past decade indicate that adaptation/prevention might be difficult. Even with a small an increase of 1% in the incidence of Lyme disease, the lifetime risk on morbidity due to climate change might become unacceptable. Climate-induced changes in pollen exposure may affect a large number of people, but there is insufficient quantitative information to predict the size of this effect.
• Coastal zone management: Major problems in the coastal zone for the coming 100 years are not foreseen. With higher temperatures, adaptation measures will become more drastic and urgent. However, this does not mean that we cannot cope with it. Sea level rise will have its impacts, but not to such an extent that we are surprised by it and that we cannot manage. Therefore, the colour sloping from white to red radiates and supports the message that developments and adaptations are gradually more drastic with rising temperatures.
• Tourism and recreation: In general, climate change has positive effects on tourism: outdoor conditions improve, and the ‘holiday season’ lengthens. Hence, no real dangers associated with 1 and 2 degrees increases in temperature. As a result of climate change, there will be fewer opportunities for ice skating on natural ice. As climate change intensifies, the likelihood of an Elfstedentocht ice skating event may decrease to around 20% of its current value, which is already low. This can be considered a loss of a traditional event in tourism & recreation, hence the orange score in the figure.
• Agriculture: Changes in Agriculture are largely driven by changes in markets and technology. Current systems will have to adapt to changes in climatic conditions. A gradual change, 4 degrees in 100 years, will not cause major problems for agriculture in the Netherlands. Key concerns are temporary water shortages and water excess which can result in yield reduction or even yield loss. Changes in climate extremes are a potential risk but so far climate scenarios present no clear picture on change in frequency and magnitude of extreme events such as late frost, hail, storms, etc. In conclusion agriculture will be able to adapt to gradual climate change but caution is needed in relation to extremes. Information on changes in extremes and the coping range of the sector is lacking to allow for quantitative conclusions.
• Extreme events: Starts with white since there were no or acceptable risk under pre-industrial conditions; between 1 and 2°C the intensity of some events (e.g. rainfall, length of heat waves may increase; it is not clear whether the frequency will increase) increases requiring adaptation, but adaptation is considered possible; red at the right end (about 2°C compared to current situation): adaptation is still possible but more costly. Thresholds may be passed if no adaptation takes place, but this is not clear.
• Abrupt events: Starts with white since there were no or acceptable risk under pre-industrial conditions; red at the right end (and gradual change in between): although the risk is very low (not likely in this century), the effects can be that enormous (financially, socio-economically, directly in the Netherlands or indirectly affecting the Netherlands) that we are not willing to accept any risk that these events will happen.
• International solidarity: Although no specific research has been conducted with regard to international solidarity, stakeholders in the previous project indicated the importance of this aspect; research has indicated that risks of food and water shortage, as well as general economic impacts will be greater for developing countries, even for temperature increases below 2°C.
Risks rapidly become unacceptable for some of the sectors at relatively low increases in temperature, sometimes even close to 1°C. A warming of around 0.8°C since pre-industrial levels has already occurred. There are obvious costs for both autonomous and proactive adaptation; but these costs as well as the costs of taking mitigation action have not been covered in this report. This is because comprehensive information was not available at the sectoral level for all the impacts studied.
The previous report of the project team argued on the basis of the stakeholder discussions that the driving factors for engaging in discussions on dangerous climate change in the Netherlands are the losses to unique ecosystems such as the Wadden Sea and the coastal belt; the high
economic, but also socio-political costs of coastal adaptation; the implications of the changing precipitation regime for navigation, agriculture, and infrastructure; impacts on tourism and health; irreversible and abrupt events with high associated risks; and last but not least important - the impacts on vulnerable societies and countries especially in the developing world.
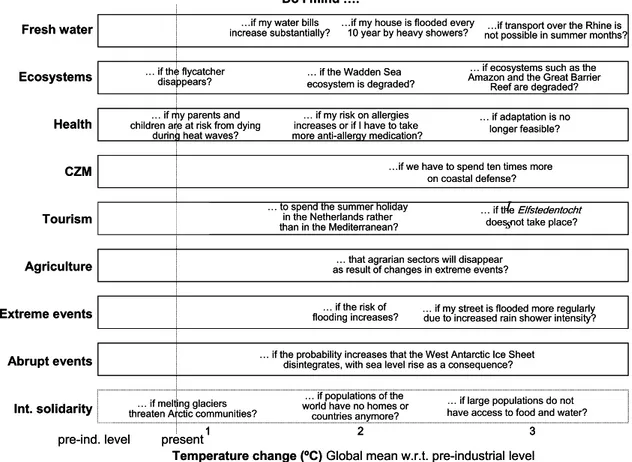
During the workshop with Dutch experts organised in May 2006, the participants stated that a figure such as the burning embers figure contains much information but remains difficult to comprehend for the general public. It was necessary to make the figure more sensible and relevant for lay people. This led to a first draft of a follow-up figure. While the basis of this figure does not contain colours, a value judgment can be added by posing questions. The figure could be an online tool for the public to assess what they consider unacceptable. This could be done by framing questions in a way that people will have to value the occurrence of climate impacts (“Do I mind if climate impact X happens?”) By answering these questions, it is possible to add colour to the figure, and to show people what they themselves consider ‘dangerous’ climate change. For impacts where there is still a lot of uncertainty, such as the large-scale abrupt events, questions could be posed in a way that explicates the uncertainty (“Do I mind that there is a probability X that climate impact Y happens?”). It is noted that such a figure or tool does not in itself address the relative importance people attach to different sectors (for example, the impacts on the coastal zone could be considered much more important than impacts on the tourism sector). The following figure contains questions composed by the research team. This is a first attempt to provide questions relevant for the project. However, many more questions can be thought of and could be included in such a figure.
Figure 3. ‘Burning Embers’ figure highlighting issues of relevance for Dutch residents.
1 2 3
Ecosystems … if the Wadden Seaecosystem is degraded? Amazon and the Great Barrier… if ecosystems such as the Reef are degraded?
Health
CZM …if we have to spend ten times more on coastal defense? Tourism … to spend the summer holiday in the Netherlands rather
than in the Mediterranean?
… if the Elfstedentocht does not take place?
Agriculture as result of changes in extreme events?… that agrarian sectors will disappear
Extreme events flooding increases?… if the risk of … if my street is flooded more regularly due to increased rain shower intensity? Abrupt events
Int. solidarity world have no homes or… if populations of the countries anymore? … if large populations do nothave access to food and water? Fresh water not possible in summer months?…if transport over the Rhine is
… if my parents and children are at risk from dying
during heat waves?
… if the probability increases that the West Antarctic Ice Sheet disintegrates, with sea level rise as a consequence?
… if my risk on allergies increases or if I have to take more anti-allergy medication? … if the flycatcher
disappears?
… if melting glaciers threaten Arctic communities?
…if my water bills
increase substantially? …if my house is flooded every 10 year by heavy showers?
I s … if adaptation is no longer feasible? present pre-ind. level
Temperature change (ºC) Global mean w.r.t. pre-industrial level “Do I mind ….”
Temperature or concentration targets
Although in 1996 and 2001, the Netherlands and the EU chose to express their targets in terms of temperature increases and greenhouse gas concentrations, the realisation that the climate sensitivity might be higher than previously assumed, make many argue in favour of temperature targets as opposed to targets related to concentration levels, since the latter is a less certain parameter than global mean temperature for determining impacts. Furthermore, a long-term stabilisation of concentrations target does not take into account the inertias in the system. This means that the temperature consequences are not felt for decades to come and that a considerable warming is already committed. This means that if we wish to stabilise global temperature at 2ºC above pre-industrial levels, we need to ensure that concentrations of CO2 equivalence are not much higher than 400 ppmv. This still does not mean that we have a 100% probability that if we stabilise at 400 ppmv that we can limit temperature rise to 2ºC above pre-industrial levels. This is because of the large number of uncertainties in the system.
Policy recommendations
This report has highlighted the observed and expected impacts of climate change on several areas of importance to the Netherlands, and has explained how these impacts can be seen as potentially dangerous in the sense of Article 2 of the Climate Change Convention. In this regard, the findings of this report are also relevant for the Adaptation Programme for Spatial Planning and Climate (Nationaal Programma Adaptatie Ruimte en Klimaat; ARK), which aims specifically to address the nature and magnitude of observed an expected climate impacts.
This report concludes that the impacts of climate change on the Netherlands can be classified into three categories in relation to a possible 2°C rise in global mean temperature from pre-industrial levels:
• Mainly positive effects expected: tourism and recreation and the agricultural sector may stand to gain if food production falls in other parts of the world;
• Mainly negative effects expected: for health, fresh water, and coastal zone management. For these sectors, we may have to invest heavily in adaptation in order to maintain the status quo. For species and ecosystems it is clear that there will be adverse impacts, which means that a combination of mitigation and adaptation is needed;
• Unclear: for large-scale abrupt events, there remains much uncertainty. Most scientists believe that the risk of abrupt events will increase with increasing global mean temperatures. It can be seen that some of the impacts have an explicit international component, which can be regarded as relevant for the determination of what is dangerous for the Netherlands. These include the potential impacts of abrupt events, which would have global impacts by definition; ecosystems, which are at larger risk in other parts in the world than in the Netherlands; and the impacts on other, more vulnerable regions and countries. However, there are also some impacts that have an international component, which could imply a positive outcome for the Netherlands, such as increased tourism in the Netherlands, or shifts in agricultural production. In general, the risks for climate change impacts increase gradually (although not always linearly) with increasing temperatures. While for the tourism sector a temperature increase of 3ºC compared to pre-industrial levels may seem acceptable; and impacts on agriculture may be limited, for the bulk of the other sectors a 1-2ºC rise in temperature implies approaching threshold limits. We believe that beyond a 2ºC global warming in relation to pre-industrial levels the probability of occurrence of low-probability high-risk events increases. Agreeing to the 2ºC target implies that ecosystems and species would be at considerable risk, and that numerous proactive adaptation activities would have to take place in the fresh water, health, coastal zone management and agricultural sectors. Furthermore, the impacts that would still occur on other vulnerable regions of the world should not be neglected. The 2°C target could imply adverse impacts on other, more vulnerable countries.
As we have already warmed around 0.8°C since pre-industrial times, this means that a stronger focus on adaptation some of the abovementioned sectors is justified. However, this is not to suggest a total shift towards adaptation policy. On the contrary, the current and expected
impacts on, for example, ecosystems around the world, as well as vulnerable countries emphasise the importance of mitigation policies.
According to recent literature, to stay with considerable certainty below a 2ºC warming limit implies stabilising CO2 equivalent concentrations at 400 ppmv. This is considerably lower than the previous concentration target of 500-550 ppmv. Further relaxing the temperature target raises the risk of putting larger number of species and ecosystems at risks of extinction and would neglect the impacts of climate change in other parts of the world. Clearly, while such a target is a political goal, committing to such a target only makes sense when other developed countries also soon engage in such commitments, followed later by all the other countries. According to VROM (2006), the short-term climate targets for the Netherlands for 2010 will be achieved. Furthermore, it also states that it is technically feasible to avoid exceeding the 2°C target. This conclusion seems premature, given that achieving the Kyoto targets certainly does not ensure in itself that the long-term ambition of the Netherlands will be fulfilled. Furthermore, as indicated in this report, there is still much uncertainty on the stabilisation pathway that is needed to stay below 2°C. Given that we are already well on our way towards this temperature increase, and given that it is more probable that lower stabilisation levels are required than initially thought, we recommend to examine which emission and stabilisation pathways need to be followed to achieve the Netherlands’ long-term political ambitions.