Summary
Netherlands Environmental Assessment Agency
with
Transport Research Centre (AVV)
Statistics Netherlands (CBS)
Netherlands Bureau for Economic Policy Analysis (CPB)
Netherlands Energy Research Foundation (ECN)
Association of the Provinces of the Netherlands (IPO)
Royal Dutch Meteorological Institute (KMNI)
Agricultural Economics Research Institute (LEI)
National Aviation and Space Exploration Laboratory (NLR)
National Institute for Coastal and Marine Management (RIKZ)
National Institute for Inland Water Management
and Wastewater Treatment (RIZA)
Netherlands Institute for Spatial Research (RPB)
Wageningen University and Research Centre (WUR)
Foreword
Every year the Netherlands Environmental Assessment Agency (MNP) publishes an Environmental Balance according to the Environmental Management Act. The Envi-ronmental Balance describes the state of the environment in the Netherlands, the effects of past policy, and further bottlenecks and policy dilemmas. The 2005 Environ-mental Balance was prepared for use in the Dutch parliament during the debate on accountability with respect to current environmental policy in May 2005. The conclu-sions drawn in the Environmental Balance will also be put into monetary terms for use during the presentation of the budget at the opening of parliament in September 2005.
This summary provides an overview of the Environmental Balance 2005, which is avai-lable in Dutch only. It has been prepared to reflect the selected features described in each chapter of the Environmental Balance. Chapter 1 starts off with a presentation of environmental costs, both public and societal, and the linkages between economic trends and emissions. Further chapters describe the state of the environment, policy trends and policy achievements in climate change (Chapter 2), environmental quality in rural areas (Chapter 3) and air quality & urban living environment (Chapter 4). The final chapter (Chapter 5) deals with trends in environmental policy over the last 15 years and the forms in which additional measures were incorporated into Dutch poli-cy to meet the European Union targets. Just as in the report, this summary too devotes attention to the comparison of Dutch trends with those in the other European mem-ber states. Appendices (not included in the summary) provide the figures underpin-ning the analyses in the Environmental Balance and present new emission figures and figures for environmental costs. Methods for communicating uncertainty data are also available in the appendices.
The Environmental Balance is available both in book form (in Dutch only) and via the MNP website (www.mnp.nl). The English-language summary is also available via the MNP website (www.mnp.nl). Detailed statistical data used in the analyses have been included in the Environmental Compendium, a joint document of the MNP and Statis-tics Netherlands available via www.environmentaldata.nl. Specifically, the Environ-mental Compendium incorporates current, detailed figures on emissions and descri-bes a large number of environmental indicators.
The Environmental Balance was compiled in collaboration with a number of other research institutes and policy assessment offices. These are listed on the title page of the Environmental Balance. Data have also been made available by the Emissions Registration – a broad coalition of organisations under the auspices of the Inspectora-te of the Ministry of Housing, Spatial Planning and the Environment (VROM) and SenterNovem, the TAFTIE (Association for Technology Implementation in Europe) member organisation in the Netherlands.
Professor N.D. van Egmond
Director of the Netherlands Environmental Assessment Agency SUMMARY ENVIRONMENTAL BALANCE 2005
Summary
Environmental quality is gradually improving, but additional Dutch policy is needed to meet EU requirements
European policies are leading to considerable emission reductions, but in the Netherlands this is not enough to meet the environmental quality standards set by the European Union (EU). Compared to other EU member states, emissions per square kilometre are higher because the Netherlands is more densely built-up and populated. Moreover, a relatively large proportion of air pollutants originate from surrounding countries. To meet the statu-tory quality standards, therefore, the Netherlands must implement additional measures. But if a policy of maintaining a level playing field for industries (fair competition) is strict-ly pursued, this can run counter to the EU’s ambition of equal protection for its citizens against poor environmental quality.
The additional measures taken in the Netherlands frequently represent spatial solutions that keep pollution sources away from population centres and nature conservation areas. This avoids the need to introduce national emission standards that go beyond present European policies, thus protecting the competitive position of companies in the Nether-lands. But spatial solutions are not always effective, particularly when background levels are high and where population concentrations and natural habitats are fragmented. Some new spatial developments have been delayed by private citizens insisting on the statutory quality standards.
These are the key messages of the Environmental Balance 2005. The rest of this sum-mary reviews both Dutch performance in meeting EU targets for climate change, ammonia and manure, air quality and the urban environment, and the influence of policy. The general trends in policy are also summarised.
SUMMARY
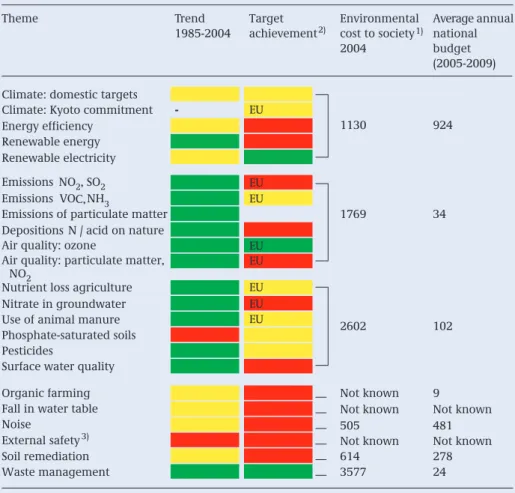
Table 1 Trends in emissions, environmental quality, achievement of policy targets for 2010 and expenditure on the environment (in millions of euros per year, 2004 prices).
Theme Trend Target Environmental Average annual
1985-2004 achievement cost to society1) national
2004 budget
(2005-2009) Climate: domestic targets
Climate: Kyoto commitment -- EU
EU EU 2) 1130 924 Energy efficiency Renewable energy Renewable electricity Emissions NO2, SO2 Emissions VOC, NH3
Emissions of particulate matter 1769 34
Depositions N / acid on nature
Air quality: ozone EU
Air quality: particulate matter, NO2 EU EU EU EU Nitrate in groundwater 2602 102
Use of animal manure Phosphate-saturated soils Pesticides
Surface water quality
Organic farming Not known 9
Fall in water table Not known Not known
Noise 505 481
External safety Not known Not known
Soil remediation 614 278
Waste management 3577 24
1) Including central government costs. 2) EU = European obligations.
3) Assessment based on group risk and case studies. Explanation of colours:
Column 2: green indicates reduction in environmental pressure, improvement in environmental quality; yellow indicates little or no change;
red indicates an increase in environmental pressure & lowering of environmental quality. Column 3: green indicates that targets will probably be achieved under currently adopted policies;
yellow indicates a chance of achieving targets of about 50% or indeterminable; red indicates that targets will probably not be achieved under currently adopted policies. Nutrient loss agriculture
General trends
Most emissions are falling, but many environmental targets are not being met
Under current policies emissions are decreasing too slowly. Although pressure on the environment is falling or stabilising, and environmental quality is improving, many environmental targets are not being met on time (Table 1). The chances of meeting many European emission targets (emission ceilings) for 2010 are about 50%. Under currently adopted policies it is expected that European quality standards will most likely not be achieved.
Eco-efficiency in the Netherlands improving
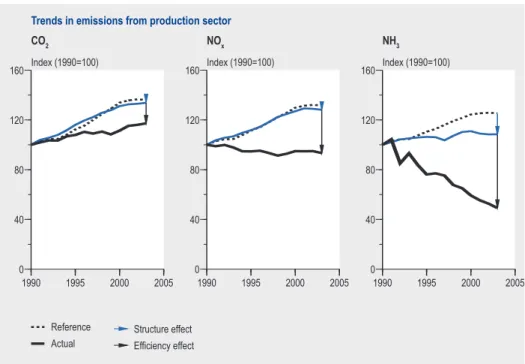
Technological improvements are raising eco-efficiency: the relationship between the profitability of a sector and its emissions is becoming increasingly favourable. Improv-ing eco-efficiency is necessary, but not sufficient for reducImprov-ing total emissions. In virtu-ally all sectors eco-efficiency for acidifying compounds has improved so much since 1990 that emissions are decreasing despite economic growth (Figure 1). Dutch eco-efficiencies for SO2and NO2are among the best in Europe. In contrast, Dutch CO2 eco-efficiency is not so good: the Dutch economy consumes more energy than the Euro-pean average consumption. Emissions of all pollutants except CO2 are currently decreasing, while the economy is growing. The total cost of reducing pressure on the environment has more than doubled since 1990, and environmental costs account for 3% of the Dutch gross domestic product (GDP), almost twice as high as the average for the EU-15.
Figure 1 Emission trends explained by economic growth, changes in sector structure and chan-ges in environmental intensity of the economy.
1990 1995 2000 2005 0 40 80 120 160 Index (1990=100) Reference Actual CO2
Trends in emissions from production sector
Structure effect Efficiency effect 1990 1995 2000 2005 0 40 80 120 160 Index (1990=100) NOx 1990 1995 2000 2005 0 40 80 120 160 Index (1990=100) NH3
Climate change
Warming likely largely due to human activity
The warming of the climate since 1950 cannot be explained by natural warming from solar energy and volcanoes alone: the influence of human activity has to be taken into account. Global climate change is noticeable in the Netherlands. The average annual temperature is rising and the chances of the traditional Elfstedentocht (long-distance ice-skating) event taking place are falling (Figure 2). The low elevation of the Nether-lands makes it vulnerable to rising sea levels and extreme weather conditions.
Maximum 2ºC global increase demands severe greenhouse gas reductions: Kyoto target as modest step
The European Union wants to keep the rise in global temperature to within 2ºC above the pre-industrial level up to 2100. New insights suggest that to be more than 50% cer-tain of meeting this target, greenhouse gas emissions will have to fall 30-50% between 1990 and 2050, a reduction of 40-60% from current emission levels. The industrialised countries participating in the Kyoto Protocol have pledged to reduce their green-house gas emissions by 5% from the 1990 level between 2008 and 2012. Kyoto, there-fore, represents a modest step towards meeting the challenge, but will create an administrative infrastructure for taking further steps.
The Netherlands meets the Kyoto target by acquiring foreign emission reduc-tions
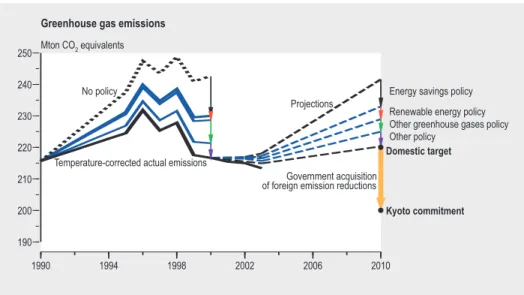
By purchasing foreign emission reductions, the Netherlands has a 50% chance of achieving the Kyoto commitment if domestic emissions remain roughly stable (Figure 3). Stabilisation of domestic emissions depends on the prolongation of the available
SUMMARY ENVIRONMENTAL BALANCE 2005
20 30 %
renewable energy subsidies and on industrial CO2emission ceilings remaining at pre-sent levels beyond 2007.
The Netherlands has agreed to a 6% reduction in greenhouse gas emissions compared to 1990 levels in 2008-2012. This is equivalent to an annual emission ceiling of 200 Mton in the period of 2008-2012. Domestic greenhouse gas emissions in the Nether-lands in 2010 are projected to be 220±10 Mton. Compared with other EU member states, the Netherlands has been quick to adopt many measures in other countries, purchasing emission reductions via the Kyoto Mechanisms (5 × 20 Mton for 2008-2012). The contracts and financial arrangements for these purchases are almost all complete, but the proposed projects must be formally approved before they can start up. The industrial sector is not expected to exceed its CO2emission ceiling and will therefore not buy extra foreign reductions through the European emissions trading system.
Dutch policies for energy (energy savings, renewable energy targets) and for other greenhouse gases are helping to only slightly increase greenhouse gas emissions. The Netherlands will not reach its target of 1.3% energy savings every year (the actual fig-ure is just 1%). Neither will the target for renewable energy (5% in 2010) be achieved; in 2010 renewables will account for about 3.5% of the energy use. The target for renewable electricity, though, will be met.
A broad range of policies must adapt to climate change
Climate change will affect the future of the Netherlands mainly through its water sys-tem. Even if temperature rise is limited to 2ºC, the Netherlands will still have to adapt
1990 1994 1998 2002 2006 2010 190 200 210 220 230 240 250 Mton CO2equivalents l l Greenhouse gas emissions
Domestic target
Kyoto commitment
Government acquisition of foreign emission reductions
Energy savings policy Renewable energy policy Other greenhouse gases policy Other policy
No policy
Temperature-corrected actual emissions
Projections
Figure 3 The effects of Dutch national policies and foreign emission reductions on achieving the Kyoto commitment.
to climate change. The changes in water policy have been translated into plans and several projects are already being implemented. In other policy areas, such as land use planning, agriculture and nature conservation, the first steps still have to be taken.
Manure and ammonia
A fifty-fifty chance of meeting the National Emission Ceiling for ammonia
Since 1990 ammonia emissions have fallen from 250 kton to about 130 kton, slightly above the National Emission Ceiling (NEC Directive). Ammonia emissions are projec-ted to be 104 to 145 kton in 2010, which means a fifty-fifty chance of meeting the National Emission Ceiling. However, new insights may alter the picture: a recent field study indicates that working manure into the soil results in lower reductions in ammonia emissions than previously assumed. If this study proves representative, mee-ting the NEC target in 2010 looks even less likely.
Despite the reduction in ammonia emissions, many nature conservation areas are still subject to high levels of nitrogen deposition and only 15-25% of the total conservation area is adequately protected. Streams, dry heath, wet heath and nutrient-poor heath and grassland are least protected against high nitrogen deposition. Area-based poli-cies (ammonia zoning and relocation of livestock farms) currently contribute little to improving environmental quality in conservation areas because the background con-centration is too high. Moreover, the fragmented nature pattern makes the area to be covered too large for an effective area-based policy.
Manure and fertiliser use standards for 2009 adequate for reports on meeting nitrate target after 2009
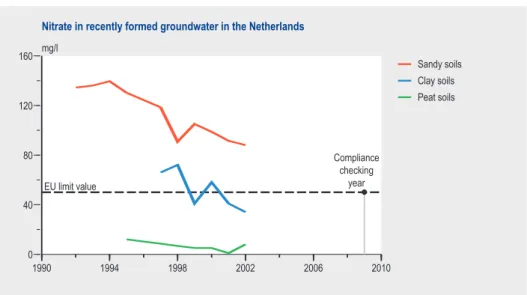
The use standards for 2009 will presumably result in a nitrogen surplus low enough to meet the 50 mg/l target for nitrate in groundwater. Time-lag effects mean that meas-urements confirming the target can probably only be reported after 2009. At the moment the Netherlands reports concentrations in the top metre of groundwater to the EU, whereas the draft monitoring directive permits deeper sampling up to five metres below the water table. If samples are taken at these greater depths, the chan-ces of meeting the target for nitrate in groundwater in 2009 are greater. However, tar-gets to be drawn up under the Water Framework Directive could impose further res-SUMMARY ENVIRONMENTAL BALANCE 2005
regions the average nitrate concentration in groundwater in 2002 was about 90 mg/l (Figure 5).
The transition to the use standard system will mean a considerable tightening of the phosphate limits. Unless manure processing, transfer and exports rise, manure pro-duction will have to fall 20% from current levels by 2015.
1998 2002 2006 2010 120 160 200 240 280 kg/ha Nitrogen
Surplus on agricultural land
Export Fertiliser Efficiency - dairy Efficiency - pigs and poultry Volume Reference Actual 1998 2002 2006 2010 30 40 50 60 70 80 kg/ha Phosphate Export Fertiliser Efficiency - pigs and poultry
Volume Reference
Actual
Figure 4 Nitrogen and phosphate surpluses on agricultural land.
Figure 5 Average nitrate concentrations in recently formed groundwater per soil region.
1990 1994 1998 2002 2006 2010 0 40 80 120 160 mg/l Sandy soils Clay soils Peat soils l Nitrate in recently formed groundwater in the Netherlands
Compliance checking
year EU limit value
Air quality
Particulate matter considerably above European limits; NO2slightly too high
Concentrations of particulate matter in the air exceed European air quality standards to a considerable extent across wide areas of the Netherlands. Average annual con-centrations of nitrogen dioxide near roads in and around the cities are still slightly above the air quality standards. Urban air quality in the Netherlands, measured by nitrogen dioxide concentrations, is comparable with other European cities, but regional background concentrations in the Benelux and the German Ruhr region are relatively high (Figure 6). The air quality limits for particulate matter will still be exceeded on a large scale in 2010.
Dutch implementation of European Air Quality Directive relatively strict
The Dutch Air Quality Decree represents a strict implementation of the European Air Quality Directive, particularly because of its integration with the spatial planning leg-islation. In the past two years the Council of State delayed or nullified dozens of plans by virtue of the Air Quality Decree. These judgements clearly show that the impacts of site development plans, land use plans and road alignments should be carefully assessed against the provisions of the Air Quality Decree. This stands in contrast to the SUMMARY ENVIRONMENTAL BALANCE 2005
NO concentrations in Europe in 2002
Regional background Street stations (urban)
global evaluation of the effects of development proposals and plans on local air quali-ty that the public and private sectors have been used to making.
Additional point source pollution policy insufficient to meet NO2emission platform and air quality targets
Under currently adopted policies, the Netherlands will probably not meet its National Emission Ceiling for nitrogen dioxide, even though Dutch policy on point source emissions is more stringent than in other EU member states. Several other European countries will also fail to meet their national ceilings. The Netherlands supports an approach based on additional European policy, which could reduce the degree to which air quality standards in the Netherlands are exceeded. It is doubtful, though, that other European countries will support a tightening up of emission policy if they are already able to meet European air quality requirements. Additional Dutch mea-sures, such as those described in the policy documents ‘Traffic Emissions’ (Verkeers-emissie) and ‘Make or Break’ (Erop of eronder, on emission ceilings), do not appear in a concrete form in the National Air Quality Plan. Once the details have been deter-mined, they could contribute to reducing excess emissions. Local measures can improve urban air quality by reducing ambient NO2concentrations but have little or no effect on particulate matter.
Urban environment
Noise nuisance around Schiphol airport stable until 2010
While air traffic has doubled during the last fifteen years, noise nuisance near Schip-hol airport has been almost halved and will remain more or less stable until 2010. The number of homes within the location-based risk contours has been halved by the con-struction of the fifth runway, and is now lower than in 1990. By 2010 the societal risk will almost double because of the growth in flight movements, and expansion of offi-ces and industry near the airport.
At current progress the soil remediation programme will run until 2065
Recent estimates indicate that 55,000 to 65,000 heavily contaminated sites will have to be cleaned up. Most of these sites are in urban areas. At the current rate of progress of about 1000 sites per year, the programme will not be completed until 2065, where-as current policy aims at 2030. The total cost of cleaning up the remaining sites is esti-mated at 18 billion euro, about half of which is currently borne by the private sector. To complete the soil remediation programme in 2030 with the available government funds, the private sector contribution will have to rise to 75%. Market interest in clea-ning up contaminated land depends on a change in permitted uses. Spending on soil remediation in the Netherlands (per head or as per cent GDP) is among the highest in Europe.
Trends in environmental policy
More modest goals but firmer control over environmental pressure; further tightening-up of point-source measures
The emission reduction ambitions following the First National Environmental Policy Plan have not always been equally ambitious. But the transposition of European direc-tives into national law has given them a stronger legal basis. Point-source measures have been repeatedly tightened up, and the associated increase in policy pressure is reflected in improved eco-efficiency. Some of the delay in transposing European envi-ronmental directives into Dutch law has been partly made good.
SUMMARY ENVIRONMENTAL BALANCE 2005
Table 2 Key environmental quality data for the Netherlands.
Unit 1990 2000 2003 EU target
2010
Social trends
index (1985=100)
Population 103 110 112
Vehicle-kilometres road traffic 120 153 163
Energy consumption 113 126 131
Livestock 102 92 82
Waste 108 125 131
Gross Domestic Product 118 157 159
Environmental costs/GDP % 1.7 2.6 2.8
Environmental expenditures % 1.0 1.8 2.1
central govt / Total expenditures central govt
Green taxes % 8.6 13.8 13.4
Emissions
Climate change
CO21) billion kg 162 172 176
Total greenhouse gases1) billion kg CO
2-eq 216 217 213 200/2202) Acidification SO2 million kg 191 75 65 50 NOX million kg 576 414 393 260 VOC million kg 493 269 224 185 NH3 million kg 249 152 130 128 Eutrophication
Tabel 2 (continued)
Unit 1990 2000 2003 EU target
2010 Environmental quality
Eutrophication
Total nitrogen deposition mol/ha 3200 2480 2160 16503) P surface water mg P/l 0.2-0.5 0.1-0.3 0.1-0.39) 0.154)
N surface water mg N/l 4-5 4-5.5 2-59) 2.24)
Shallow groundwater
Natural habitats on sandy soils mg NO3/l 30 20 10
Agriculture on sandy soils mg NO3/l 1506) 105 90 50 Air quality5)
Exposure to particulate matter µg/m3 426) 31 34 4010)
Exposure to NO2 µg/m3 27 21 22 4010)
Exposure to ozone
No. days limit exceeded 40 9 20
No. people affected by noise % 50 43 44
Waste
Landfill billion kg 14 5 3 27)
Nature conservation Area protected against
- acid deposition % 5 10 10 20-308)
- nitrogen deposition % 10 10-20 10-20 20-308) (NER)
1) Temperature corrected.
2) Total Kyoto target/Kyoto domestic target.
3) Average for Dutch habitats; reformulated NEPP targets. 4) Goal of the Fourth National Environmental Policy Plan.
5) National average. Local hotspots may contain concentrations substantially above the limit. 6) 1992.
7) Target for 2012 in the Waste Management Plan. 8) Level of protection derived from deposition targets. 9) 2002.