International Masters of Science in Environmental Technology and Engineering
Master’s dissertation submitted in partial fulfilment of the requirements for the joint degree of EU Erasmus+ Master course organized by
University of Chemistry and Technology, Prague, the Czech Republic IHE Delft Institute for Water Education, Delft, the Netherlands
Ghent University, Ghent, Belgium
Academic year 2018-2020
A NOVEL WAY OF WATER REUSE IN
A DECENTRALIZED WASTEWATER
TREATMENT SYSTEM, APPLICABLE
IN THE CITY OF THE FUTURE
Host institutions: Ghent University, Ghent, Belgium & PureBlue Water, Hulst, the NetherlandsLuiz Henrique Da Silva Corrêa
ES-IMETE.20-20
Deze pagina is niet beschikbaar omdat ze persoonsgegevens bevat.
Universiteitsbibliotheek Gent, 2021.
This page is not available because it contains personal information.
Ghent University, Library, 2021.
II
Acknowledgment
First and above all, I would like to thank God to whom may I own my very existence for his faithfulness and love from the moment I was born up to now. Additionally, I wish to express my deepest gratitude to all of those who somehow contribute to this dissertation. I would like to thank my mentor at PureBlue Water, Mr. Dries van Aken for all the help, from building the pilot experiment to the revisions, insights, suggestions, teachings, and corrections of my thesis. Truly, this study would be impossible without your help, dedication, expertise, and guidance. Moreover, I would like to thank my Supervisor at Pureblue Water, Mr. Kevin van de Merlen, who has the substance of a genius in wastewater treatment, for your insights, revisions, discussions, suggestions, teachings, and counseling. Your guidance was crucial to the success of this study. Furthermore, I would like to express my sincere admiration and gratitude to Prof. Dr. Ir. Erik Meers for being my academic Supervisor in this study. It goes without saying that your insights, suggestions, guidance, expertise, and revisions proved monumental for the completion of this master’s thesis. Moreover, I would like to thank, my PureBlue Water mentor Mr. Nelis de Rouck for promoting discussions, insights, and revision of my thesis work. I would like to pay my special regards and deepest gratitude to Dr. Aurore Assaker for your many revisions of this dissertation, your corrections, insights, and suggestions, which were invaluable, enriching, and well-welcomed. Additionally, I would like to thank my dear friend Joel Aldrighettoni for revisions, discussions, insights, and support. Also, I would like to thank immensely Mr. Angelo De Mul, a dedicated/visionary/humble leader (Pureblue Water’s C.E.O) who opened the doors of his company to host my thesis work. Your work is an inspiration to me. I would like to thank all my colleagues at Pureblue Water for being so helpful and welcoming. Last, but not least, my deepest gratitude to my family and my IMETE friends for their love, help, and support.
III
Abstract
The increase in the water and energy demand in urban cities comes with the need to develop smart eco-friendly solutions to promote the best use of these resources. Greywater reuse can contribute as an important practice in sustainable cities to reduce the pressure on water and energy resources. This study aimed to design and evaluate the performance of a decentralized pilot-treatment system composed of a moving bed biofilm reactor (MBBR) followed by an up-flow filter and UV disinfection to treat greywater from showers and hand basins for toilet flushing. Additionally, a heat exchanger was placed before the MBBR to study its performance on promoting energy recovery for water heating. The pilot was located in Hulst, the Netherlands, at the Pureblue Water company’s installations. The monitoring of the overall system performance, as well as its units, in removing organic matter, nutrients, total suspended solids (TSS), and recovering energy from greywater were performed. Results showed that the system was able to reduce all the parameters analyzed (chemical oxygen demand - COD, total nitrogen -TN, total phosphorus (TP - PO4-P), pH,
and turbidity) to most of the greywater reuse safety standards found in the literature. Moreover, the system presented COD, TN, and TP removal efficiencies of 69%, 42%, and 53%, respectively corresponding to a population equivalent of 120 inhabitants. The filter showed TSS removal from 44% to 52% associated with a suspended solids loading capacity of 4 TSS COD g/L (with a breakthrough time of 21 hours). While the MBBR was able to treat the organic load of 2.58g COD/m2.d. In addition, the heat exchanger presented from moderate to high efficiencies (from 39% to 92%) in recovering heat for water heating. The pilot plant showed to be an excellent way to promote sustainable water and energy use in the cities of the future.
IV Table of Contents 1 Introduction ... 1 1.1 Background ... 1 1.2 Objectives... 5 2 Literature Review ... 6
2.1 Greywater Treatment Technologies ... 6
2.1.1 Greywater ... 6
2.1.2 Conventional Technologies Applied to Treat Light Greywater for Domestic Purposes ... 8
2.1.3 Moving Bed Biofilm Reactor – MBBR ... 11
2.1.4 Filtration ... 14
2.1.5 UV Disinfection ... 16
2.2 Advantages of Decentralized Greywater Treatment System for the Sustainable Urban Water-Energy Management: Cities of the Future ... 19
2.3 Energy-Water Recovery: Greywater Reuse and Energy Recovery in Buildings ... 21
2.4 European Legislation: Recycled Water Applications Limits in Europe ... 23
3 Material and Methods ... 25
3.1 Site Description and Material Set-Up ... 25
3.2 Operational Conditions of the MBBR and Filter ... 25
3.3 Analysis ... 28
3.3.1 Biofilm Cultivation ... 28
3.3.2 Feed Composition ... 28
3.3.3 Bioreactor Performance: Greywater Analysis ... 30
3.3.4 Flow Measurements ... 30
3.4 Filter Performance ... 31
3.4.1 TSS removal performance and TSS COD Load Capacity ... 31
3.4.2 Turbidity versus TSS COD ... 32
3.4.3 Filter’s Breakthrough and Saturation Time ... 33
3.5 Heat Exchanger Performance ... 33
3.6 Overall Performance ... 36
3.6.1 Pilot’s Influent versus Effluent Quality ... 36
3.6.2 Mass Balance ... 36
4 Results ... 39
4.1 MBBR Performance on Organic Matter and Nutrient Removal: Definition of the Optimal Loading Rate in Inhabitants Equivalent ... 39
4.2 Water Analysis of the Optimal System’s Feed and Synthetic Greywater Composition ... 41
4.3 Filter Performance ... 42
4.3.1 The Filter’s TSS Removal Efficiency ... 43
V
4.3.3 Turbidity and TSS COD Correlation ... 45
4.4 Heat Exchanger ... 46
4.4.1 Flowrates and Temperatures Measurements: Heat Exchanger ... 46
4.4.2 Heat Exchanger Efficiency at Different Flowrates and Temperatures ... 47
4.5 System Performance... 49
4.5.1 The System Performance Water Analysis (Bioreactor + Filter) ... 49
4.5.2 System and Filter Mass Balance ... 50
5 Discussion ... 52
5.1 Synthetic Greywater Characterization... 52
5.2 Bioreactor Performance ... 53
5.3 Filter Performance ... 55
5.4 Heat Exchanger Performance ... 58
5.5 System Performance... 59
6 Conclusion and Recommendations ... 62
7 Appendices ... 70
7.1 Appendix 1 ... 70
VI
List of Figures
Figure 1.1 - Schematic Layout of Greywater Treatment Technology to Reuse Treated Greywater and Recover
Energy from Buildings ... 4
Figure 2.1.3 - Stages of Pseudomonas aeruginosa Biofilm Development………...………….12
Figure 2.1.3.1 - MBBR Technology Process Diagram ... 12
Figure 2.1.5 - UV Disinfection Process ……….………..17
Figure 2.3.1 - Stainless Steel Coil Heat Exchanger Diagram………...22
Figure 3.2.1 - Carrier,Type K5……….………..……….………….26
Figure 3.2.2 - PID Layout of the Pilot Experiment Set-up…………..……….………27
Figure 3.3.4 - Flowmeter……….……….……….30
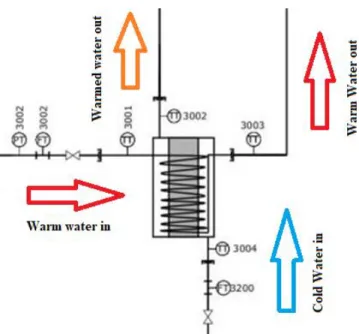
Figure 3.5.1 - Heat Exchanger’s P&ID with the Water Fluxes During the Experiment ... 34
Figure 3.5.2 - Temperature Sensor ... 34
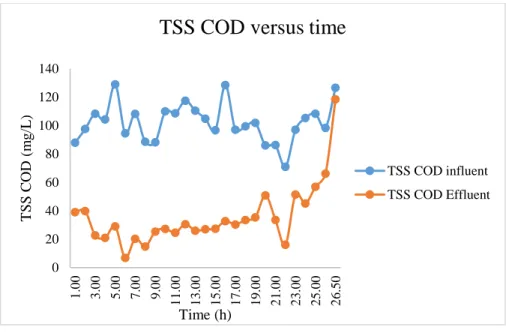
Figure 4.3.2 - Filter’s Influent and Effluent TSS COD Concentrations over 27 hours………...….45
Figure 4.3.2.1 - Filter’s Influent and Effluent Turbidity over 27 hours………45
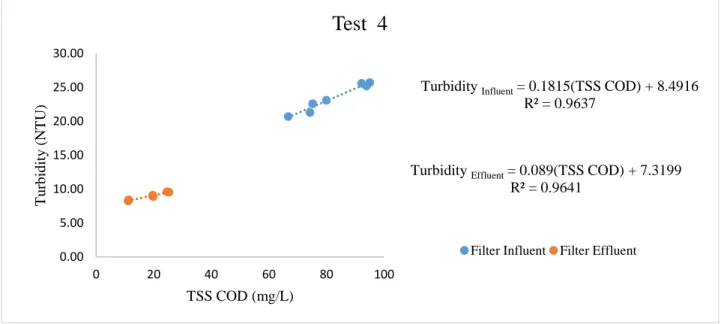
Figure 4.3.3 - The Turbidity and TSS COD Correlation……….…………...46
Figure 4.4.1 - Temperatures of Warm and Cold Water Flows Before and After the Heat Exchanger……….47
Figure 4.5.2.1 - Pilot Plant’s Mass Balance (72-hours Cycle) ... 51
VII
List of Tables
Table 2.1.1 - Physico-Chemical Composition of Domestic Greywater in Different Countries ... 7
Table 2.1.2 - Conventional Technologies to Treat Greywater (Source: Boano et al., 2019) ... 10
Table 2.1.3 - Advantages and Limitations of MBBR Technology ... 13
Table 2.1.4 - Advantages and Limitations on Treatment and Recycling of Greywater Filtration...14
Table 2.1.4.1 - Treatment Efficiencies for Filtration as Greywater Treatment Technology ... 16
Table 2.1.5 - Advantages and Limitations of UV Disinfection on Greywater Treatment and Recycling ... 18
Table 2.4.1 - Limits for greywater reuse ... 24
Table 3.3.2.1 - Product Composition... 28
Table 3.3.2.2 - Product Loads...29
Table 3.3.2.3 - Daily Synthetic Greywater Formulation...29
Table 3.4.1 - Filter’s Specifications ... 31
Table 3.5.1 - Heat Exchanger Setups ... 35
Table 4.1.1 - The MBBR Influent and Effluent Water Analysis for Different Numbers of Inhabitants Equivalent ... 40
Table 4.1.2 - MBBR’s Removal Efficiency for Different Numbers of Inhabitants Equivalent ... 40
Table 4.2.1 - The Feed’s Water Analysis for the 120-Inhabitants Load ... 42
Table 4.2.2 - The Average Synthetic Greywater composition for the 120-Inhabitants Load ... 42
Table 4.3.1 - The Filter’s Average Influent versus Effluent Unfiltered, Filtered, and TSS COD Values ... 43
Table 4.3.2 - The Filter’s Efficiency in Removing Suspended Solids ... 44
Table 4.4.2 - The Heat Exchanger Efficiency at Different Flowrates...48
VIII List of Units °C Celsius degree d Day g Gram J Joule K Kelvin kg Kilogram kton Kiloton h Hour L Liter m Meters m2 Square meters m3 Cubic meters min Minute mg Milligram mL Milliliter
MPN Most probable number NTU Nephelometric turbidity unit S Siemens
y Year
IX
List of Abbreviations
AC Activated carbon
BOD Biochemical oxygen demand COD Chemical oxygen demand DAF Dissolved air flotation DNA Deoxyribonucleic acid
DO Dissolved oxygen
EEC European economic community EEA European economic area
F COD Filtered COD
GW Greywater
HE Heat exchanger
HRT Hydraulic retention time MBBR Moving biofilm bed reactor P&ID Piping and instrument diagram
TN Total nitrogen
SALR Surface area loading rate SLR Solid loading rate
TP Total phosphorus
TSS Total suspended solids
TSS COD Total suspended solids chemical oxygen demand UF COD Unfiltered chemical oxygen demand
UV Ultraviolet
RNA Ribonucleic acid SD Standard deviation
SS Suspended solids
VSS Volatile suspended solids WFD Water framework directive WHO World health organization
WW Wastewater
1
1 Introduction
1.1 Background
Water and energy resources are fundamental to social and economic development. Rapid urbanization, industrial activities, and agriculture growth have resulted in increased demand for these resources. (Fang & Chen, 2017). By 2050, there will be insufficient water and energy to satisfy the growing need at the global level. Global energy demand is estimated to increase by over 80%, while water demand is estimated to increase by 50%, causing insecurity in providing water and energy. The most affected zones by this process are the most populated areas, urban areas (Tsolakis & Anthopoulos, 2015). This is exacerbated by the shifts in the population lifestyle and an increase in the consequent need for water-energy demand (Tsolakis & Anthopoulos, 2015). The main consumers of water and energy resources for domestic use are cities and urban areas (Wanjiru & Xia, 2017). In the 2018 revision of World Urbanization Prospects by the United Nations, it was estimated that by 2050, 68.4% of the world’s population will be residing in urban areas (United Nations, 2018). According to Bulkeley & Betsill, 2005, cities consume 70% of the world’s resources. In addition, to the depletion of resources such as water and energy, cities are major contributors to water pollution, greenhouse gas emissions, air pollution, soil contamination among many others. The mechanism of how society consumes and discharges or wastes water-energy has to be changed. Innovative and more effective mechanisms in water technologies and infrastructure will be needed in these areas to mitigate the impacts of growing water shortages while ensuring water allocation efficiently and securely. From here emerged the need to develop a smart, sustainable, and eco-friendly way to use water and energy in urban areas to mitigate environmental, social, and economic problems threatening cities (Bibri & Krogstie, 2017).
Sustainable cities, the so-called green-cities or cities of the future, are cities designed with consideration for social, environmental as well as economic aspects aiming to achieve sustainability through the balance of resources consumption and minimization or mitigation of environmental adverse effects, environmental-friendly lifestyle, social equality, and sustainable urban management (Bibri & Krogstie, 2017; Liu & Jensen, 2018). One of the major challenges of
2
these cities is how to supply potable water and energy sustainably (Wanjiru & Xia, 2017). Greywater treatment and recycling are the key practices to overcome these challenges.
Normally in a conventional centralized system, the treatment of greywater causes many adverse impacts on urban water management. Adding to that, the impact caused by heavy rainfall may decrease wastewater (WW) treatment performance in wastewater treatment plants (WTTP). Because not only stormwater can bring a high number of pathogens, but it also increases the wastewater flowrate to the WTTP exceeding its capacity and reducing by this mean the WTTP’s effluent quality (McMahan, 2006). This because after reaching its full capacity, the WTTP would not be able to treat the incoming extra pollutants load, resulting in the pollution of water bodies (Díaz et al, 2016; Rashid & Liu, 2020).
On the contrary, when treated and recycled in a decentralized manner, this unconventional approach can bring many benefits. For example, positioning the wastewater treatment plant close to the WW contributors, in a decentralized manner would reduce the cost of WW transportation due to a smaller WW collection system. This guarantees an economic benefit, on the contrary to centralized treatment systems placed in remote areas. The other advantage is that the relocation of WW treatment would also allow the reuse of energy and treated WW by the decentralized system’s contributors/users due to the proximity of the treatment plants which results in the dropping of potable water and energy demands (Wanjiru & Xia, 2017). Furthermore, examples of environmental benefits would be the reduction of WW discharges to water bodies, and pollutants load to the WTTP which avoids water bodies pollution when its capacity is exceeded because of heavy rainfalls (Wanjiru & Xia, 2017). These benefits emphasize the need to treat greywater in a decentralized manner and recover energy from the treated to optimize the energy-water consumption in the cities (Plappally et al.,2012; Ackerman et al., 2013; Feng et al., 2014; Spang et al, 2014). Thus, attention has been made worldwide and more specifically in Europe on decentralized systems combining both energy recovery and wastewater treatment (Wanjiru & Xia, 2017).
Besides the existence in Europe of a legal framework that supports greywater reuse and energy recovery (such as the Directive 91/271/EEC on urban wastewater treatment, the Water Framework Directive (WFD), 2000/60/EC, WFD, and the EU action plan for the circular economy) little is known yet on how to implement greywater treatment, greywater reuse limits,
3
and energy recovery throughout this process. However, scientists, environmentalists, and policymakers commonly agree that greywater treatment and possible ways to recycle and reuse water are great examples of using water and energy sustainably in cities.
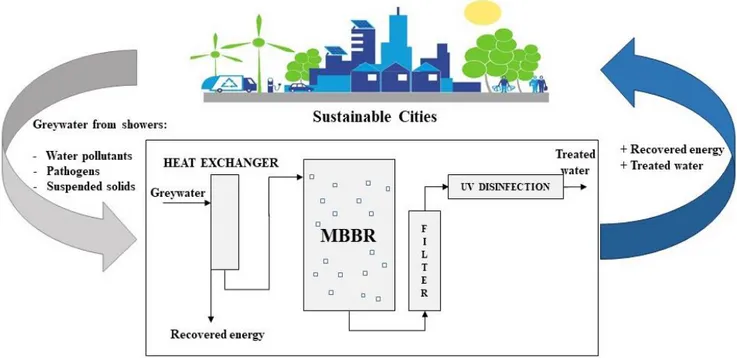
Many technologies, such as membrane reactors, filters, and electrocoagulation, may potentially be applied for greywater treatment and energy recovery (Barzegar et al., 2019, Parjane and Sane, 2011, Chrispim and Nolasco, 2017). Membrane technology, for example, can be applied in several sorts of wastewater treatment applications. However, although this technology is known by the production of high-quality effluent, it is also acknowledged as an expensive technology due to its high operational cost (Merz et al., 2007). Making its application for domestic greywater treatment less attractive (Boano et al., 2019). Other processes such as filtration and electrocoagulation, often applied to the removal of suspended solids in wastewater treatment, would not be able to reduce the dissolved organic pollutants from greywater significantly (Barzegar et al., 2019; Gross et al., 2007). Making their application in greywater treatment often accompanied by a second biological step, such as Moving Bed Biofilm Reactors (MBBR), for organic matter degradation and nutrient removal (Chrispim et al., 2017). Many studies showed that MBBR followed by filtration and a disinfection step is the optimal way to treat greywater for non-potable uses (McNabola & Shields, 2013; Van Blommestein et al. ,2013; Chrispim et al., 2017; Saidi et al., 2017; Mazhar et al., 2018). To achieve that, the greywater treatment system, proposed in this study, was designed to remove organic matter/nutrients (by a MBBR), suspended solids (by a filter), and kill pathogens (by UV disinfection) from the greywater originated in showers and hand basins for toilet flushing in buildings. Moreover, to promote energy recovery from the greywater shower, a heat exchanger was added to the system allowing an optimal recovery of energy (Saidi et al., 2017; Chrispim et al., 2017). The proposed system can be considered as an essential contribution to sustainable water and energy use in the cities of the future. Figure 1.1 shows a schematic layout of the proposed greywater treatment technology integrated with cities of the future.
4
Figure 1.1 - Schematic Layout of Greywater Treatment Technology to Reuse Treated Greywater and Recover Energy from Buildings
In other words, this study, based on results obtained from a pilot plant at PureBlue Water facilities in Hulst, Netherlands, consists of a first attempt to promote water and energy savings in sustainable cities using a system that can treat greywater for toilet flushing, while recovering energy. The proposed research aims to test and evaluate the performance of this MBBR-Filter system by performing a physico-chemical analysis of the system's influent and effluent. The specific objectives were testing the MBBR performance in removing organic matter from synthetic greywater, at different feed concentrations, and test the filter performance in removing suspended solids from the MBBR effluent. Additionally, the efficiency of the heat exchanger at different flowrates rates was determined to find its optimal operational flowrate and temperature. Thus, the main goals of this study were to evaluate the pilot system performance in treating greywater (from showers and hand basins for toilet flushing) and recovering energy (for water heating).
5
1.2 Objectives
The main objective of this research was to study and develop a system for greywater treatment and energy recovery from buildings to promote sustainable water and energy reuse in the implementation of cities of the future. This goal has been reached through the design and evaluation of a pilot system composed of a moving bed biofilm reactor followed by a new up-flow filter concept and a disinfection unit for toilet flushing and a heat exchanger to recover energy.
This thesis was divided into 2 parts. The first part provides a review of technologies such as MBBR, filtration, and UV disinfection used to date in treating greywater for toilet flushing as well as the use of heat exchangers to recover energy from domestic wastewater. The second part deals with the performance analysis of the pilot plant to treat synthetic greywater and recover energy from it. For this purpose, the following specific objectives were defined:
To evaluate the pilot MBBR performance in removing organic matter and nutrients (COD, TN, TP, NH4-N, and NO3-N) from synthetic greywater.
To test and analyze the pilot filter performance in removing suspended solids from the MBBR effluent (TSS removal efficiency, turbidity removal, TSS COD loading capacity, and filter’s saturation and breakthrough time).
To determine and evaluate the pilot heat exchanger performance in recovering energy for water heating as well as its optimal operational flowrate and temperatures.
To find the optimum operating conditions and determine and evaluate the overall system performance in treating synthetic greywater for toilet flushing (Pilot’s influent versus effluent characterization, overall removal efficiencies, and mass balances).
6
2 Literature Review
This section consists of a literature review on a) the technologies applied in this study, b) advantages of decentralized systems to treat greywater in the cities of the future, c) the contribution of this study to the energy-water nexus, and d) the existing legal framework on water reuse and energy recovery.
2.1 Greywater Treatment Technologies 2.1.1 Greywater
Greywater (GW) is the amount of domestic wastewater except for toilet flushing and accounts for 75% of total household wastewater (Ghaitidak and Yadav, 2013). It is normally divided into two types: light GW, which sources are bathrooms, showers, tubs, and hand basins and dark GW which includes laundry facilities, dishwashers, and sometimes kitchen sinks (Boano et al, 2019; Fowdar et al, 2017; Hourlier et al, 2010). Usually, greywater contains personal care products (e.g. shampoo, shaving cream, and toothpaste), human-derived compounds (e.g. hair and skin), and traces of urine and feces (Eriksson et al., 2002). Though by definition greywater does not include feces and urine, some traces of them can be found in greywater, indicating urine and feces contamination. Dark GW contains high concentrations of chemical products, non-biodegradable fibers, food, oils, and fat, while light GW does not (Ghaitidak and Yadav, 2013). This facilitates the recycling of light GW because it reduces the complexity of the treatment needed. Table 2.1.1 shows the physico-chemical composition of domestic greywater in different countries (Boano et al, 2019).
7
Table 2.1.1 - Physico-Chemical Composition of Domestic Greywater in Different Countries
Minimum-Maximum (Average) Country COD TP TN pH mg/L Belgiumc 225 - 364 - - (7.6) Brazila (1,031.4) (21.15) (14.4) (8.9) Canadab 301 - 557 - - 6.7 - 7.6 Francec 176 - 323 - - 6.46 - 7.48 Germanyd (109) (1.6) (15.2) (7.6) Japand (675) (1.1) (25.6) (-) Marrocoe 25 - 300 2.8 - 11.3 - 7.5 - 7.9 Netherlandsh 425 - 1,583 5.7 - 9.9 17.2 - 47.8 (7.5) Norwayf (241) (1.03) (10.61) (7.1) United Kingdomd 33 - 587 0.4 - 0.9 4.6 - 10.4 6.6 - 7.8 Western Europeg 25 - 1,583 0 - 11 3 - 75 6.1 - 9.6 Yemend 1,200 - 2,000 - - 6
Source (a: Pansonato et al, 2007; b: Finley et al., 2009; c: Hourlier et al, 2010; d: Ghaitidak and Yadav, 2013; e: Merz et al., 2007; f: Eregno et al, 2017; g: Boutin and Eme, 2016; h: Hernandez et al, 2007)
As seen in Table 2.1.1, greywater composition varies differently between the cited countries. No variations were found in the pH values because the greywater pH depends on a large extent on the water supply pH which is generally around 7 (Oteng-Peprah et al, 2018). COD values were observed in the order of some hundreds with only a few exceptions such as Yemen. Developing countries usually present high COD concentrations in greywater if compared to developed ones (Ghaitidak and Yadav, 2013). This shows a link between the greywater composition and the countries' characteristics. Additionally, total nitrogen and phosphorus were relatively low. Although many studies assessed greywater and provided extensive figure on the composition/sources, many important factors should be considered such as seasonal variations, greywater quality, country selected for the study, population lifestyle, wastewater infrastructure, water availability, population
8
income, and environmental awareness among many others (Boano et al., 2017, Eriksson et al., 2002 and Ghaitidak and Yadav, 2013). As shown in Table 2.1.1. the greywater composition varies country-by-country. Therefore, greywater characterization should be performed before the treatment definition since it is hard to find a common pattern applicable to all countries
2.1.2 Conventional Technologies Applied to Treat Light Greywater for Domestic Purposes
Currently, the reuse and recycling of light greywater are receiving more attention not only due to the low levels of pathogens, nitrogen, and phosphorus but also because of the urge to reduce potable water demand (Li et al., 2004). Many studies were carried on different technologies that can be applied to treat greywater for non-potable applications (Boano et al., 2019; Cureau and Ghisi, 2019; Ghaitidak and Yadav, 2013; Li et al., 2009). Factors such as operational conditions and greywater composition seemed to be important parameters that determine the efficiency of the treatment (Boano et al., 2019). In an extensive literature review, Boano et al., 2019, summarized the main technologies used to treat greywater in the last 21 years. Table 2.1.2 shows the most relevant technologies applied in greywater treatment. The treatment technologies were classified according to the adopted processes: physical, chemical, and biological.
According to Table 2.1.2, coagulation presented high removal efficiency for phosphorus (>90%) and moderate for COD removal (>60%) from synthetic GW. Filtration generally had high efficiencies in the COD (>80%) and phosphorus removal (>70%) from synthetic GW. As expected, biological technologies showed high COD removal values (up to 90%) and from moderate to high values of nitrogen removal (from 40% to 72%) from real GW.
Boano et al., 2019, concluded that among chemical treatment processes coagulation and flocculation are the most commonly applied technologies to treat greywater (Ghaitidak and Yadav, 2013). Among the physical technologies, filtration is the most commonly applied in greywater treatments (Noutsopoulos et al., 2018). In the case of biological treatments, rotating biological contractors, MBBR, sequencing batch reactors, and membrane bioreactors are optimal technologies to treat greywater (Chrispim and Nolasco, 2017; Rodda et al., 2011; Wu, 2019).
Though, many technologies seem to be suitable to treat light greywater. Li et al. ,2009, showed that physical treatments alone cannot reduce organics and surfactants to safe standards. While, for example, chemical treatments can efficiently remove them. Therefore, the authors concluded that the combination of an aerobic biological treatment with physical filtration, and
9
disinfection is the most economical and feasible solution to treat and recycle greywater for domestic use.
Having that in mind, MBBR technology (aerobic biological treatment) followed by an up-flow filter (physical filtration), and UV disinfection was the treatment combination chosen in this thesis to treat greywater from buildings in the cities of the future. This study will discuss in-depth the MBBR, physical filtration, and UV disinfection technologies in further sections.
10
Table 2.1.2 - Conventional Technologies to Treat Greywater (Source: Boano et al., 2019)
Conventional/Advanced Process GW Origin Treatment Efficiency Reference
Minimum-Maximum (Average)
COD TP NO3--N NH4+-N pH
%
Chemical Coagulation: FeSO4 Synthetic GW: shower and sink (63.59) (96.39) (8.96) - - Pidou et al., 2008 Coagulation: Al2(SO4)3 Synthetic GW: shower and sink (63.72) (94.58) (14.93) - - Pidou et al., 2008 Electro-coagulation O3 Real GW: shower and sink (85) - - - - Barzegar et al., 2019 Physical Filtration: crushed dolomite and
plastic filter media
Synthetic GW: bath, laundry, and kitchen
- (73.68) (48.57) (16.67) - Gross et al., 2007
Filtration: coconut shell, sawdust, and charcoal
Synthetic GW: kitchen (82.26) (100) (68.66) (73.42) - Parjane and Sane, 2011
Filtration: AC Synthetic GW: bath and laundry - - - - 6.1-7.8 Ghaitidak and Yadak, 2013 Biological Rotating Biological Contactor Real GW: laundry, bath, and
kitchen
21.48-60.36 - - - - Xio et al.,2018
MBBR Synthetic GW: bath and laundry (70) (12) - - - Chrispim and Nolasco, 2017 Membrane Bioreactor Real GW: shower (86.24) (18.75) - (72.03) - Merz et al., 2007
Sequencing Batch Reactor Synthetic GW: shower (90) - - - - Weitao et al., 2006 Up-flow Anaerobic Sludge
Blanket
11
2.1.3 Moving Bed Biofilm Reactor – MBBR
The MBBR has its origin in Norway and emerged from the need to address pollution control in small Norwegian communities. The need to upgrade existing wastewater treatment was the main driver behind its development (Di Biase et al., 2019). Currently, more than 400 large-scale wastewater treatment facilities in 22 different countries operate with MBBR technology (Rusten et al., 2006). In 2014, more than 1,200 wastewater treatment installations used MBBR technology serving as a great example of the success of MBBRs in the wastewater treatment sector (Biswas et al., 2014).
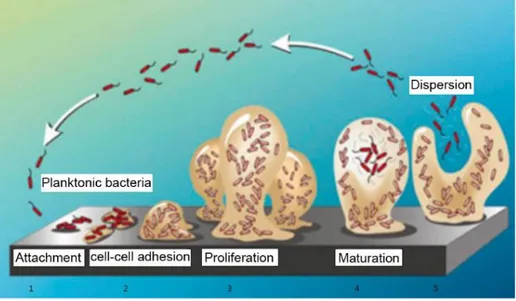
A MBBR is a biological technology for high organic matter degradation and nutrient removal (Chrispim et al., 2017). The degradation/removal mechanisms are based on biofilms attached growth on carriers that are kept in suspension by the aeration system. The carriers are small polyethylene with a high surface area that accommodates biofilm development. The bacterial growth in the MBBR is described by four phases: lag phase, exponential phase, stationary phase, and death phase. The biomass and growth kinetics are described by the Monod curve, a curve that relates microbial growth with the concentration of limiting nutrient (Kawan et al., 2016). The lag phase corresponds to the acclimatization stage where the microorganisms adapt themselves to growth conditions. During the exponential phase, the cells grow by doubling due to the excess of nutrients. As soon as the nutrient concentration is limited the stationary phase is reached. The population dies then because of inappropriate living conditions. This is the death phase. Figure 2.1.3 illustrates the biofilm devolvement of Pseudomonas aeruginosa. Figure 2.1.3.1 shows the MBBR technology process diagram. According to Kawan et al., 2016, more than 90% of the biomass stays in the system. Hence, there is no need for sludge recirculation. This is one of the many advantages of MBBR. Table 2.1.3 lists the advantages and limitations of MBBR systems.
12
Figure 2.1.3 - Stages of Pseudomonas aeruginosa Biofilm Development [acclimatization stage: attachment and cell-cell adhesion; exponential phase: proliferation; stationary phase: maturation; death
phase: dispersion] (Source: Karaguler et al., 2017)
13
Table 2.1.3 - Advantages and Limitations of MBBR Technology
Advantages Limitations
Possibility to upgrade existing wastewater treatment plant with low cost a
High energy cost due to aeration and carriers mixing c
Sludge does not need recirculation since the biomass is retained on the carriers a
Long time for biomass cultivation might be required b
Long start-up period may be required b
Small footprint a
The biofilm is resilient to variations in the influent characteristics such as load, pH, and temperature a
Low sludge production b
Low maintenance required b
No clogging problems b
Easy and simple design to operate b
Source : a: Dezotti et al., 2018; b: Kawan et al, 2016; c: Ødegaard, 2016.
Many researchers agree that MBBR performance may be affected by many factors. These are carrier size and shape, carrier percent fill, hydraulic retention time (HRT), surface area loading rate (SALR), dissolved oxygen (DO), mixing, and aeration rate. Odegaard et al., 2000 studied the influence of carries’ sizes and shape on the MBBR performances. The authors concluded that no distinction in the treatment efficiency happened in carriers with different shapes and the same surface area. Other researchers investigated the relation between carrier percent filling and removal of contaminants. They estimated that the optimum carrier filling percentage for COD removal was approximately 50%. Moreover, it was recommended that the DO levels should be maintained higher than 2 mg/L for optimal COD removal (Hajipour et al., 2011; Wang et al, 2005).
Additionally, Hajipour et al., 2011, advised HRTs from 12 to 16.5 hours to guarantee higher pollutants removal in MBBRs. Moreover, Aygun et al, 2008, in a lab-scale experiment found that a rise in organic loading from 6 to 96 g COD/m2/d was followed by a decline in organic removal from 95.1 removals to 45.2%. The mixing in MBBRs is done by aeration; requiring an extra cost and adding a disadvantage to the technology (Di Biase et al., 2019).
14
As a result, MBBR is an excellent technology to treat greywater due to its many benefits. However other factors such as DO level, carrier filling, HRT, aeration rate, and others could affect the MBBR performance. These factors need to be taken into account in the MBBR designing. Normally MBBR technology is followed by additional steps to achieve quality standards more specifically when the purpose is for domestic greywater treatment. The polishing steps are commonly filtration and disinfection. Thus, these steps will be discussed in the next sections of this literature review.
2.1.4 Filtration
Filtration consists of a separation process in which a liquid passes through a medium or layer such as sand, gravel, activated carbon, pine bark, to be purified. Filtration, in the context of greywater treatment and recycling, aims to remove particulate matter that was not removed by prior steps in the greywater treatment. Filtration can be done by physical or biological means (Ghaitidak and Yadav, 2013). Physical filtration for removal of solids is applied to the greywater treatment, more frequently. Like any technology, filtration presents advantages and limitations. The following table summarizes the most relevant advantages and drawbacks of filtration on greywater treatment and recycling.
Table 2.1.4 - Advantages and Limitations on Treatment and Recycling of Greywater Filtration
Advantages Limitations
Simple operation Not all germs and contaminants are removed High particulate matter removal Surface loading rate: 3 - 5 m/h
Inexpensive Solids Loading Rate: 30 - 50 mg/L.VSS
Effluent with potential for reuse Backwash volumes: 2.5 - bed volumes Properly designed vertical flow bed systems can
remove 90% of BOD and 80% COD, approximately
Clogging problems
Small footprint
Source (Ghaitidak and Yadav, 2013; Verma et al., 2017; Noutsopolos et al., 2018; Hamoda et al, 2002; Rajala et al., 2003)
Many factors might interfere in the performance of a filter such as greywater characteristics, surface loading rate (3 - 5 m/h), total suspended solids load (150 mg/L TSS), chemical addition (to boost TSS removal efficiencies), and media characteristics (Verma et al.,
15
2017; Noutsopolos et al., 2018). For example, Rajala et al., 2003, studied the application of a rapid sand filter followed by UV disinfection to remove suspended solids from wastewater. They evaluated the filter’s performance with two different surface loading rates of 5 m/h and 10 m/h, respectively. The researchers observed that at the higher surface loading rate (10 m/h), the filter presented lower TSS removal efficiencies (from 30% to 80%) if compared to the SRL of 5 m/h (50% to 80%). In the same line, Hamoda et al, 2002, studied the performance of a full-scale rapid sand filter (SRL of 5 m/h) in removing suspended solids from three wastewater treatment plants in Kuwait. The filter presented COD removal efficiencies lower than 30% and TSS removal efficiencies lower than 70%. They attributed those efficiencies to the fact that just a pre-chlorination step was placed before the filter to prevent clogging due to algae. Additionally, Noutsopolos et al., 2018, studied different factors that can interfere in a sand filter’s TSS removal performance. The authors observed that high TSS COD (Total Suspended Solids’ Chemical Oxygen Demand) loads were accompanied by low TSS reductions. The researchers also concluded that filtration combined with aluminum chemicals can boost suspended solids removal efficiencies. In the same study, the filtration without chemical additions presented effluent’s turbidity and TSS concentration higher than 10 NTU and 10 mg/L, respectively. While, the filtration with the incorporation of coagulation dropped the effluent’s turbidity and TSS concentration to 2 NTU and 3 mg/L, respectively. The same differences were observed by Hamoda et al, 2002. Therefore, the examples aforementioned indicate a correlation between the filtration performance in removing TSS and parameters such as SRL, coagulants addition, and TSS COD load. Therefore, the filter applied in this study was designed to overcome such limitations.
Many studies were found in the literature on filtration as a polishing step on greywater treatment. In a study, Friedler et al, 2005, investigated a pilot plant consisting of a biological reactor followed by sand filtration and disinfection units to treat light greywater from seven flats. The results showed that the TSS, turbidity, BOD, and COD were reduced by 82%, 98%, 96%, and 75%, respectively, resulting in an effluent with quality standards for toilet flushing. Additionally, Jabri et al, 2019, investigated the performance of a full-scale MBRR, followed by filtration and UV disinfection, to treat domestic greywater for toilet flushing. The system showed COD, BOD, TN, and TSS removal of 93%, 99%, 78%, and 98.8%. Moreover, in a study Al-Hamaiedeh and Bino et al., 2010, tested the use of filtration as the only technology to treat greywater. The system applied four barrels of up-flow filtration units in series. The first, second, and third barrel removed
16
grease, oil, pollutants, and suspended solids. The fourth barrel functioned as a polishing step. The results showed that the correspondingly initial influent concentrations of COD, BOD, TSS, and TN of 1,172 mg/L, 942 mg/L, 275 mg/L, and 52 mg/L were reduced to 489 mg/L, 108 mg/L, 128 mg/L, and 11 mg/L, respectively. Although the final effluent concentrations did not reach the standard limits for domestic greywater reuse, the study was a good example to show the influence of filtration in the reduction of pollutants in domestic greywater treatment. The table below summarizes the filtration efficiency as a polishing step for greywater treatment and recycling from different studies mentioned previously
Table 2.1.4.1 - Treatment Efficiencies for Filtration as Greywater Treatment Technology
Parameters (mg/L) Percentage Removal
Total Suspended Solids (TSS) 53 - 93%
BOD5 89 - 98%
COD 37 - 94%
TN 5 - 98%
TP Up to 100%
Source: Oteng-Peprah et al., 2018; Al-Hamaiedeh and Bino, 2010; Dalahmeh et al.,2012; Finley et al., 2009; Gross et al., 2008
It can be seen that filtration is a fundamental step in greywater treatment and recycling in green cities. It is important to mention that filtration helps to reduce the number of pathogens from wastewater, but it cannot eliminate them. Thus to guarantee safety in the domestic greywater reuse, in the cities of the future, an additional disinfection step is necessary (Jabri et al, 2019). A brief discussion of disinfection will be done in the next section of this literature review.
2.1.5 UV Disinfection
After the biological (MBBR) and physical (Filtration) steps, a low concentration of pathogens such as bacteria, viruses, and microbes might be found on treated light greywater (Jabri et al, 2019). Their removal depends on many factors such as type of media, the thickness of the filtration layer, hydraulic retention time. Although filtration might be able to remove efficiently bacteria and viruses, a disinfection step is still needed to promote the reuse of domestic greywater. A well-established method for disinfection should be applied in the greywater treatment ensuring
17
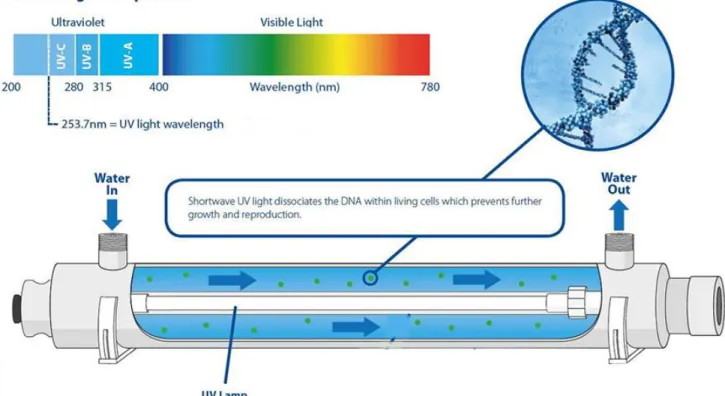
safe domestic reuse (Gibson et al., 2017). Among many technologies used to kill or inactivate microorganisms, many studies proved that Ultraviolet (UV) disinfection is an efficient step for a total elimination or inactivation of pathogens making this technology applied commonly on full-scale installations (Oh et al., 2018; Gibson et al., 2017; Couto et al., 2013).
UV disinfection damages the DNA and RNA of microorganisms and prevents replication and inability to infect in treated wastewater (Gibson et al., 2017). Figure 2.1.5 illustrates the UV disinfection process and Table 2.1.5 shows the advantages and limitations of the ultraviolet disinfection technology in greywater treatment.
18
Table 2.1.5 - Advantages and Limitations of UV Disinfection on Greywater Treatment and Recycling
Advantages Limitations
Kill pathogens in seconds Pathogens might develop resistance No hazardous by-products formation High TSS and turbidity might reduce the
effectiveness of UV disinfection No chemicals needed Expensive if compared to chlorination1
Low maintenance and easy operation Low operation cost
1 – Chlorination is a disinfection method in which chlorine is added to water to kill bacteria and other microbes.
Source: Gibson et al., 2017
The advantages of UV disinfection as shown in Table 2.1.5 make this technology an interesting option to be applied in greywater treatment in green cities. Although its application might be expensive when compared to other disinfection steps such as chlorination, UV disinfection presents high efficiency in removing pathogens without the necessity of chemical addition. Additionally, the development of pathogens’ resistance could be overcome by increasing the applied radiation dose. Thus, making this technology an efficient way to disinfect greywater with low-cost maintenance and easy operation (Gibson et al., 2017).
Some studies showed that UV disinfection is commonly applied after MBBR and filtration steps (Jabri et al, 2019; Saidi et al., 2017, Jabornig et al, 2013). Friedler et al, 2010, evaluated the performance of a UV disinfection step, preceded by biological and filtration steps, on pathogens removal to treat light greywater for toilet flushing. The results indicated that the UV phase was efficient to remove completely fecal coliforms and Staphylococcus aureus. In addition, UV removed all the viral indicators injected into the system. Moreover, in a review of technologies to disinfect light greywater for domestic reuse, Oh et al., 2018, indicated that UV light disinfection is capable of eradicating pathogenic bacteria. Furthermore, Couto et al., 2013, proved in a study on greywater from a mid-size airport in Brazil that UV light disinfection removed 100% of E. coli from 80% of the greywater samples (in the other 20% of samples, E. coli concentrations were found to be lower than of 1 MPN/100 mL). The authors concluded that the treated greywater met the non-potable water reuse limits and its use provided great water savings in the airport. Therefore, UV disinfection showed to be an essential step after the MBBR and filtration system
19
for domestic greywater treatment and recycling. Thus, its application justifies the use of disinfection to promote sustainable water reuse in sustainable cities.
2.2 Advantages of Decentralized Greywater Treatment System for the Sustainable Urban Water-Energy Management: Cities of the Future
This section provides some examples of existing decentralized infrastructures of greywater treatment to have a better idea of how water and energy should be managed in the so-called sustainable cities.
Nowadays expensive conventional centralized water and energy management are being replaced by decentralized solutions for recycling and reuse of water and energy close to the site of origin (Díaz et al, 2016). This shifting to a decentralized water treatment and energy recovery system relies on the many benefits that a decentralized approach brings (Wanjiru & Xia, 2017). These advantages are cost reduction (on the sewage system, drinking water, and wastewater treatment collection), resource efficiency improvement (by optimizing water and energy consumption), and environmental benefits over centralized systems (by minimizing untreated wastewater discharges on water bodies due to stormwater overflow) (Wanjiru & Xia, 2017). Ni et al., 2012, demonstrated that decentralized systems seem to be the most efficient way to recover energy and recycle water. The researchers analyzed the feasibility of a residential greywater energy recovery system for domestic use in 14 cities in the United States. Their results showed that the energy and the potable water consumption in those cities would be reduced by 17- 57.9% and 14 – 34.1%, respectively when decentralized systems in the buildings to recover water and energy from greywater are adopted. Furthermore, a pilot study in the Netherlands showed that recovery heat from greywater, in a decentralized system, can save 4% of the total annual energy consumption in Amsterdam and help to reduce 54 kton per year of CO2 emissions in the city. The
same study proved that the heat recovery remains the same in both winter and summer periods and has an estimated payback period of 4 years for 4 people size households and 2 years for multi-family habitations. (Deng et al., 2016). Thus recovering energy from greywater, in a decentralized system, reduces the energy consumption of cities and its carbon footprint. This will take the cities of the future to another level of sustainability by optimizing their resources from water to energy to waste allowing their preservation for future generations.
20
In a case study, Lam at al., 2017, evaluated the economic and environmental aspects of four water management options to reuse non-potable water for toilet flushing in domestic buildings in Hong Kong, China. These were a) a freshwater flushing system; b) a seawater flushing system; c) an aerobically treated greywater flushing system, and d) an anaerobically greywater flushing system. The eco-efficiency analysis revealed that the scenarios in which greywater was treated aerobically or anaerobically by bioreactors were the most eco-efficient water management options to reuse domestic greywater. The latter reduced the volume of sewage treated as well as the supply of freshwater while minimizing the cost. Thus, greywater reuse and recycling should be at the core of sustainable water management in green cities (Al-Jayyousi et al., 2003; Figuères et al., 2003; Lam at al., 2017).
Another study was conducted by Cureau at al. in 2019 in Joinville, Brazil to assist the decision-making on water management and reduce potable water consumption and sewage generation. Four strategies were studied and compared a) the replacement of the potable water use for toilet flushing by rainwater harvesting; b) the reuse of treated greywater for toilet flushing; c) the application of dual-flush toilet flushing; and, d) the combination of the three strategies. The results showed that the potential for potable water savings ranged from 1.7% to 50.5%, and the potential for sewage generation reduction ranged from 2.1% to 52.1%. In conclusion, the authors indicated the greywater reuse as the best viable strategy to save water for non-potable use such as toilet flushing, and when a large catchment area is available rainwater harvesting is recommended. In European countries, drinking water and wastewater treatment present net energy consumption of 34 and 88 kWh/y/person respectively, accounting for 7.6% of the overall energy consumption (EEA, 2014). Many researchers agreed that this ratio can be reduced if greywater recycling and energy recovery are adopted (Plappally et al.,2012; Ackerman et al., 2013; Feng et al., 2014; Spang et al, 2014). Wakkel et al., 2016, made a review and compared several studies tackling energy consumed within the water sector. They concluded that energy should be taken into account when managing water resources is fundamental to promote sustainability in sustainable cities. Therefore, greywater has to be perceived as a valuable source of water and energy for non-potable uses in the cities of the future (Wong et al., 2010; Meggers et al., 2011; Van Blommestein et al., 2013; Mazhar et al., 2018).
21
2.3 Energy-Water Recovery: Greywater Reuse and Energy Recovery in Buildings
The advantage of a compact treatment unit with high pollutant removal efficiency makes MBBR technology an interesting option to treat domestic greywater. In this perspective, biological treatments are the most appropriate methods for greywater treatment due to high organic removal (Jefferson et al., 2004; Patil, et al., 2016). The post-treatment after a biological treatment for greywater reuse is usually defined by the use of the treated wastewater. Filtration or settling after the MBBR is commonly applied for uses such as irrigation (Hadei et al., 2015; Al-Wasifya et al., 2018). Furthermore, for greywater reuse in households an additional step of disinfection, such as UV technology or chemical dosing, should be applied (Jabornig et al, 2013; Saidi et al., 2017; Jabri et al., 2020).
A 6-months pilot study performed in Brazil to verify the viability of greywater recycling, tested different types of synthetic greywater in a MBBR of 83.3 L followed by a settling tank implemented in a building at the University of Sao Paulo. The results showed that the MBBR system removed 59% and 70% of BOD and COD, respectively in a system with the influent flow rate of 300 L/d. The raw greywater presented an average initial COD concentration of 270 mg/L. While the system effluent presented 11 mg/L of COD concentration. This allowed the greywater to be used in irrigation, pastures, cereals, and other crops considering the Brazilian safety standards. Though, the treated wastewater did not meet the safety criteria to be used for domestic purposes (Chrispim et al., 2017). This confirms the need for a disinfection step to promote the reuse of treated greywater for domestic purposes such as toilet flushing.
Saidi et al., 2017, performed a detailed investigation on a full-scale MBBR of 11.7 m3 followed by sand filtration and UV disinfection used to treat and recycle domestic greywater from a small community of 223 inhabitants that been operating in Berlin since 2006. The results showed that the average loading rate was 3.7 kg COD/d. While the removal rate was 3.4 kg COD/d. In terms of BOD, the loading rate of 2.8 kg BOD/d was almost completely removed. The system with an area of 0.15 m2/person was used to treat greywater for toilet flushing. Therefore, this study
showed that the configuration of MBBR technology followed by filtration and disinfection is an excellent way to promote sustainable water use in smart cities.
In a literature review, Arora et al., 2016, investigated many treatment configurations for greywater recycling. The researchers showed that the MBBR followed by the DAF system could
22
be an excellent alternative to treat greywater for non-potable use. On the other hand, Ødegaard et al., 2012, studied the MBBR followed by DAF for greywater reuse in a pilot study in Norway. The results showed that the treatment configuration presented a compact efficient solution for greywater recycling. However, few studies have been found on the application of a MBBR followed by DAF for greywater treatment.
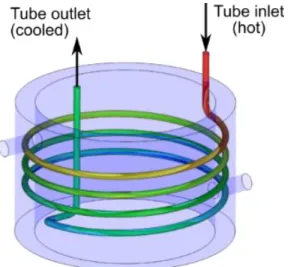
Regarding energy recovery from domestic greywater, a heat exchanger is commonly applied to recover energy in buildings from showers, washbasins, and wash machines (McNabola & Shields, 2013; Van Blommestein et al. ,2013; Mazhar et al., 2018). A great amount of the energy used in a household is consumed for heating water (Meggers et al., 2011). As an example, the temperature of water discharged from a typical shower varies between 30 and 38 °C and reaches 60 °C when discharged from washing machines (Wong et al., 2010). To date, only heat exchangers and heat pumps are viable options to recover energy from non-industrial use (Mazhar et al., 2018). Both technologies are applied in different scales, with heat exchanger more commonly applied in smaller scales. Figure 2.3.1 illustrates a simple heat exchanger commonly applied in buildings.
Figure 2.3.1 - Stainless Steel Coil Heat Exchanger Diagram (Source: Azore CFD, 2019)
The potential of energy recovery from greywater is quite high and reaches in some cases 3.5 kWh/person/day (Mazhar et al., 2018). In a study, McNabola & Shields, 2013, evaluated the performance of a heat exchanger in a water heat recovery system from showers for domestic use. The results showed efficiencies over 50% in heat recovery. Moreover, the assessment of energy and economic savings proved the viability of the system to recover energy from greywater.
23
Hence, greywater reuse and energy recovery in buildings are crucial practices that decrease the demand for potable water and energy. Greywater reuse may decrease all the infrastructure needed to collect, transport, and treat greywater. Consequently, decreasing the urban wastewater discharge and environmental impacts in the whole life cycle of water and energy production-consumption (Chrispim et al., 2017).
2.4 European Legislation: Recycled Water Applications Limits in Europe
The quality requirements for greywater reuse depends on the type of water used, the source of greywater, and the likelihood of human contact with the recycled water (Boano et al, 2019). Edwin et al., 2014, showed in a study that there are many recycled greywater standards for different countries.
- In Europe, the Directive 91/271/EEC on urban wastewater treatment and the Water Framework Directive (WFD) (2000/60/EC, WFD) encourages greywater reuse., The EU action plan for the circular economy also includes water reuse of treated wastewater for irrigation and aquifer recharge.
- Directive 91/271/EEC aims to protect the environment, especially in nutrient-sensitive areas, from adverse effects due to discharges from urban wastewater from households and industries. Moreover, this Directive states that all treated wastewater should be reused whenever appropriate and the Member States should minimize any environmental effect caused by wastewater reuse.
- The WFD established a framework, to protect water bodies, that provides guidelines to integrate water reuse and water management.
One of the barriers to promoting domestic greywater reuse is the lack of a clear and precise legislative framework to tackle that matter within the European Union (Li et al., 2009). For instance, many countries such as Germany, Italy, and Slovenia developed their standards for greywater reuse while others such as the Netherlands and Belgium, follow other developed countries’ standards (e.g. the US EPA greywater reuse limits). This reveals that the EU legislative framework on domestic greywater reuse should be developed. Although, as discussed previously, the greywater characteristics may vary in country-by-country, a greywater reuse guideline for the whole EU would blaze a trail to the European countries which did not develop a reuse standard to reuse greywater. As an example, the United States has a stringent guideline for greywater reuse
24
that is applied for the entire country. However, some American states (e.g. California) have developed their own standards, adapted to local greywater characteristics, that could be more stringent or not than the US EPA guideline for greywater reuse (Cook, 2016). Similarly, it would be helpful to have a general guideline for Europe as well as national legislation adapted to each EU country. In other words, although many directives promote the reuse of treated greywater, none of these provides specific guidelines of how greywater recycling should be done or defines the limits for greywater reuse. For instance, the guideline for the safe use of wastewater, excreta, and greywater by the World Health Organization (WHO) lacks standards or limits for greywater reuse (WHO, 2006). Thus, there is an urgent need to set clear standards for greywater recycling for all EU Member States. Therefore, policies, legislations, specific guidelines need to be created and shared to popularize greywater reuse for the current and future generations.
Table 2.4.1 below shows the limits of a few European and Non-European countries for greywater reuse.
Table 2.4.1 - Limits for Greywater Reuse
Minimum-Maximum (Average)
Country COD TP TN pH Turbidity
mg/L (NTU)
Canada (280) - - 7 - 9 < 2
China (15) - 10 - 20 6 - 9 < 10
Germany - - - 6 - 9 Near Clear
India (250) - - 6 - 9 -
Japan - 1 - 4 20 - 30 6 - 9 Clear
Italy (100) (2) (15) 6 - 9.5 -
Slovenia (200) (1) - 7 - 9 -
US EPA 20 - 90 - 1 - 30 6 - 9 < 5
25
3 Material and Methods
3.1 Site Description and Material Set-Up
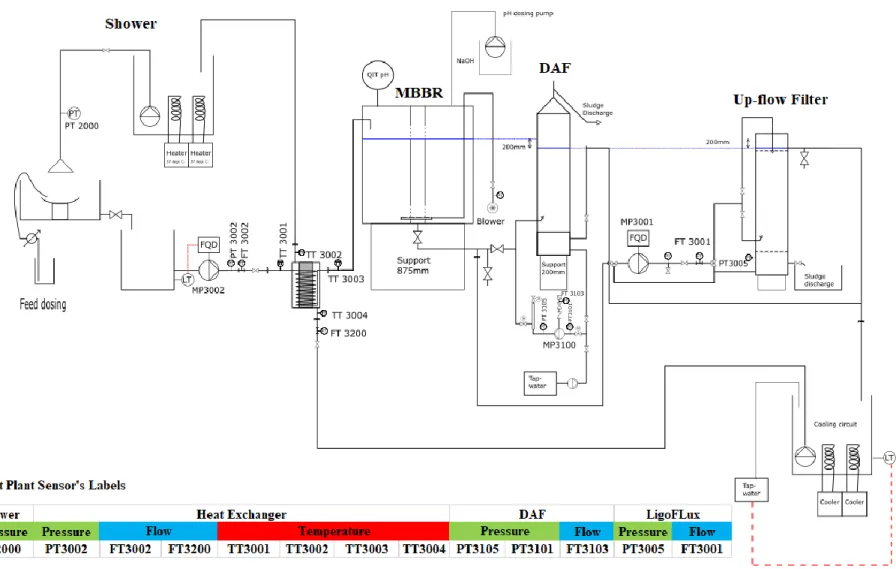
A pilot experiment unit for greywater treatment and energy recovery was built in the frame of this study, in the facilities of the company PureBlue Water in Hulst, the Netherlands. The pilot set-up took 50 days to be finalized, approximately. After that, the carriers (type K5) with the attached biofilm from the company’s full-scale bioreactor were added into the MBBR. During the system’s operation, influent and effluent were sampled regularly for a period of 2 months. The pilot set-up consisted of a feed tank, shower, an equalization tank, a biological wastewater treatment unit (an aerobic MBBR), an up-flow filter (called LigoFlux), a DAF, one heat exchanger, two heaters, two coolers, and five plastics reservoirs (one cubic meter each). Figure 3.2.2 illustrates the pilot experiment set-up. Pictures of the pilot plant can be found in appendix 2.
As seen in the schematic Figure 3.2.2, the synthetic greywater (soap, shampoo, carbon source, toothpaste, shaving cream, and ammonium chloride) was added to the feed tank and pumped to the first reservoir (shower reservoir) to simulate a shower. Warm water was pumped to the first reservoir through the shower from the heating reservoir. Then, after the greywater mixing in the shower reservoir, the greywater was conducted to an equalization tank by gravity. Subsequently, the greywater was pumped to the MBBR (for nutrient removal) passing through a heat exchanger (for heat recovery). After the biological treatment unit, the flow was divided equally between the DAF and the filter (for the removal of particulate matter). After the filtration and flotation, the treated wastewater was sent to a reservoir for cooling, and the sludge was sent to two collection reservoirs. In the cooling reservoir, tap-water was added only to compensate water losses (e.g. water leaves the system when sludge is removed from the DAF and the filter ensuring a constant level of water). Then, the water from the cooling reservoir, containing the treated cooled water, was pumped to the heating reservoirs through the heat exchanger. Finally, the water was heated up in the heating reservoir and pumped up back to the shower, closing the system loop.
3.2 Operational Conditions of the MBBR and Filter
Before going into details on the operation conditions of the MBBR reactor and filter, which are described in this section, it is important to mention that the study of the DAF system (with an inner diameter, height, and nozzle’s height are 0.215m, 1.68m, and 0.62m, respectively) is out of
26
the scope of this study. The system investigation is focused on the MBBR system followed by filtration only. The presence of the DAF in the system was used to feed the company’s database. Therefore, although the DAF is present in the pilot system, its description and analysis will not be discussed in this study.
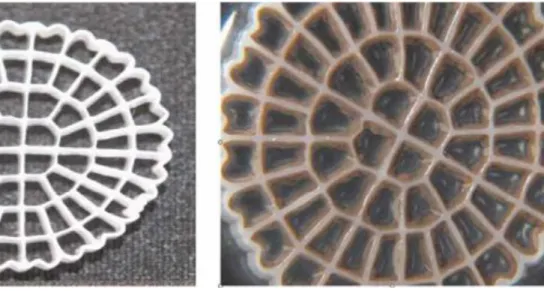
In this way, moving to the MBBR/Filter system description. The bioreactor had a total active volume of 1.6 m3. A volume of 0.5 m3 carriers (type K5, biofilm surface is of 800 m2/m3)
was used for the MBBR, this means a filling ratio of 31,25%. The same type of carrier was used for the filter. Figure 3.2.1 illustrates the disc carriers used in the filter and MBBR. The DO levels in the MBBR were kept from 2 mg/L to 4 mg/L, while the temperature at 27.5 °C, throughout all the pilot plant operation. The greywater flowrate to the bioreactor was set on 300 L/h, to be later on increased gradually to 600L/h. Furthermore, the filter (inner diameter of 0.27 m) had an active volume of 82.7 L. The active filter volume is the volume between the screens (at the bottom of the filter) and the top of the carrier bed layer. The carrier volume in the filtration unit was 52 L, thus the filling ratio was 62.85%. Normally, a higher filling ratio would not allow a proper backwash of the filter due to not enough room for the carriers to move. The LigoFlux, filter designed by PureBlue Water, was set at a filtration speed and HRT of 5 m/h and 11 min, respectively. The wastewater flowrate to the filter was 300 L/h (because after the MBBR, the flow was equally divided between the DAF and the filter).
27
28
3.3 Analysis
3.3.1 Biofilm Cultivation
Prior to the experiment, the carriers with the cultivated biofilm from the company’s full-scale MBBR reactor, to treat greywater for ships, were used to start up the system (a picture of the full-scale reactor can be found in appendix 2). The tank of 15 m3 was filled with synthetic greywater and carriers. The system was fed with synthetic greywater continuously for 3 months, approximately.
3.3.2 Feed Composition
The synthetic greywater formulation, used to understand the performance of the present pilot system, originated from the synergy of many studies (Boano et al., 2019; Scheumann and Kraume, 2009; Liu and Mabury, 2019; Spychała et al., 2019; Eriksson et al., 2003; Ghaleh Khondabi et al, 2019). Table 3.3.2.3 shows the synthetic greywater formulation used in the experiment. The average water consumption, for showering and bathroom sinks, considered in the study was approximately 60 L/person/day. The number of inhabitants first assumed, in this study, was 240 inhabitants.
To calculate the product loads to the system shown in Table 3.3.2.2, the following procedure was performed: As a first step, COD, total nitrogen, and total orthophosphate of the products (shampoo, shower gel, toothpaste, and shaving cream) were measured to have an idea of the synthetic greywater composition in this study. The measurements followed the procedure described in Appendix 1. The following table shows the results for the feed composition:
Table 3.3.2.1 - Product Composition
Considering the greywater maximum flowrate for the pilot experiment as 600L/d (14.4 m3/d) and assuming that the greywater’s COD concentration from a 240 inhabitants-system as 150
Product Brand COD TN Orthophosphate
g/L
Shampoo jumbo 184 1,412 27.8
Shower gel jumbo 260 1,848 50.8
Toothpaste jumbo 520 620 604.8
29
mg/L (Boutin and Eme, 2016), the pilot COD load was calculated by multiplying the pilot flowrate and the influent’s COD concentration: 2.16 kg/d of COD.
From the product composition (Table 3.3.2.1), loads of COD, N, and P per day of the products from a system of 240 inhabitants were calculated as showed in Table 3.3.2.2. It is important to notice that a carbon source (methanol; trade name: carbo 60) was added to reach the total load of 2.16 kg/d of COD. Moreover, ammonium chloride (NH4Cl; load: 112 g/d of N) was
added to simulate urea. Furthermore, the C/N/P ratio aimed in this study was 144/6.48/1. To achieve the latter, 5 grams of monosodium phosphate and 17 grams of sodium dihydrogen phosphate dehydrate were daily added to the GW formulation.
Table 3.3.2.2 - Product Loads
Parameter Value Unit
Daily average water consumption 60 Liter/person
Number of Inhabitants 240 Inhabitants
COD load from products 503.11 g/d of COD
N load from products and NH4Cl 116.11 g/d of N
P load from products 0.14 g/d of P
COD load from carbo 60 1,656.89 g/d of COD
Finally, the maximum amount of product to be fed into the system was calculated to obtain the desired loads (Table 3.2.2.3). The system’s feeding started at an organic load corresponding to 24 inhabitants which was gradually increased to the maximum feed concentration that the system could handle.
Table 3.3.2.3 - Daily Synthetic Greywater Formulation
Products Quantity Unit
Shower gel 600 mL Shampoo 600 mL Toothpaste 66.12 mL Shaving cream 538.12 mL Carbo60 1.74 L NH4Cl 428 g NaH2PO4 5 g NaH2PO4.2H2O 17 g
30
3.3.3 Bioreactor Performance: Greywater Analysis
The synthetic greywater was fed to the system continuously for approximately two months for the organic loads corresponding from a population of 24 inhabitants to 168 inhabitants. During this 73-days pilot experiment (from May 13th, 2020 until July 24th,2020), the samples were taken
from the following points: the heating tank, the MBBR reactor (influent and effluent), the filter (influent, effluent, and backwash), and the cooling tank.
To assess the system effectiveness, the following parameters were analyzed in wastewater samples pH, dissolved oxygen (DO), and conductivity using a multi-meter device for Hach (model HQ40d) with automatic calibration directly after sampling. For each parameter, a specific probe was used and results were obtained in mg/L for DO and µS/cm for Conductivity. COD, total ammonium, total nitrate, and total orthophosphate using Nano Color test tubes
from the company Macherey Nagel (Macherey Nagel, 2020). A description of these experiments can be found in Appendix 1.
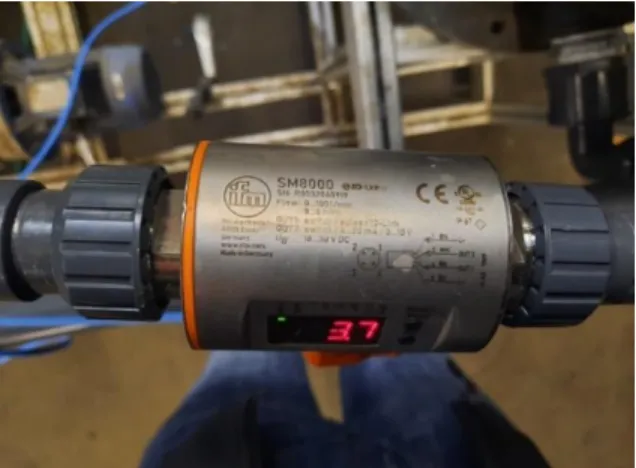
3.3.4 Flow Measurements
The flow measurements of the pilot-scale were done by the flowmeter sensors, which computed all the measured data into an Excel file. The flowmeters were labeled as FT3002, FT3200, FT3103, and FT3001 as shown in Figure 3.2.2. Figure 3.3.4 shows the flowmeter used in this study.