Social cost-benefit analysis of
regulatory policies to reduce
alcohol use in The Netherlands
RIVM Report 2016-0065Colophon
Dr. G.A. de Wit (author), RIVM Dr. P.F. van Gils (author), RIVM Dr. E.A.B. Over (author), RIVM
Drs. A.W.M. Suijkerbuijk (author), RIVM Dr. J. Lokkerbol (author), Trimbos Instituut Prof. Dr. F. Smit (author), Trimbos Instituut Dr. I. Mosca (author), Ecorys
Drs. W.J. Spit (author), Ecorys
Prof. dr. mr. S.M.A.A. Evers (author), Maastricht University Dr. R.J.A. de Kinderen (author), Maastricht University
Contact: Dr. G.A. de Wit RIVM/V&Z/VPZ/KZG ardine.de.wit@rivm.nl
This investigation has been performed by order and for the account of ZonMW, within the framework of “Maatschappelijke kosten-baten analyse alcoholgebruik” project number 50-53100-98-055. © RIVM 2016
Parts of this publication may be reproduced, provided
acknowledgement is given to: National Institute for Public Health and the Environment, along with the title and year of publication.
This is a publication of:
National Institute for Public Health and the Environment
P.O. Box 1 | 3720 BA Bilthoven The Netherlands
Preface
In the Netherlands, government policy is directed at curbing alcohol consumption. One example is the recent increase of the minimum age to buy alcohol from 16 to 18 years. Alcohol policies induce much debate in society, with parties defending and parties offending
policies to further decrease alcohol consumption active in this debate. The Ministry of Health, Wellbeing and Sports has commissioned a number of studies via the Netherlands Organization for Health Research and Development (ZonMw) with the aim to inform Parliament about different aspects of alcohol policies. The current research report concerns a study on costs and benefits of alcohol and alcohol policies. First, information on costs and benefits of alcohol consumption in the Netherlands is given. A great number of data and figures have been collected, e.g. about traffic accidents, productivity losses and costs of police and justice related to alcohol consumption. All costs and benefits of alcohol have been quantified for one year, 2013. Despite the fact that some evident societal benefits of alcohol are present, e.g. for producers and retailers of alcohol, alcohol appears to have net costs for our society.
A second research question concerns the social costs and benefits of further strengthening of Dutch alcohol policies. Costs and benefits of three policy measures have been estimated for a period of 50 years after introduction of such measures. These policies are (1) a further increase of excise taxes for alcohol, (2) a reduction of the number of sales venues of alcohol and (3) a total mediaban for alcohol. These policy measures will have net social benefits for society, but its magnitude differs for the different policies. Furthermore, policies differ with regard to the stakeholders in society that pay for its costs and profit from its benefits.
In this study, Social Cost-Benefit Analysis (SCBA) was used as analytic technique. Since a number of years, government asks the SCBA framework to be used in (ex-ante) evaluation of government policies. Although RIVM has ample experience with economic evaluation of (public) health policies, actual use of the SCBA framework was limited until recently. The current study was performed in close cooperation with three other research partners (Trimbos Institute, Ecorys and Maastricht University). Within this consortium, an SCBA on the subject of tobacco control was performed concurrently and within RIVM, several other SCBA projects are
ongoing. These different research projects contribute to RIVM’s knowledge base in the field of SCBA, as well as to good relationships with other research institutes.
However, this specific study could not have been performed without the close cooperation with the three other institutes. I would like to thank all colleagues involved for their effort. I hope that the current report will contribute to the discussion on alcohol policies in our country.
A.M.P. van Bolhuis, MA
Synopsis
Social cost-benefit analysis of regulatory policies to reduce alcohol use in The Netherlands
If all costs and all benefits of alcohol are expressed in monetary terms, the net costs were 2,3 to 2,9 billion euro in 2013. Examples of the costs of alcohol are less productivity at work, costs of police and justice and traffic accidents. Alcohol also has benefits, for instance excise tax income for government. The feeling of wellbeing that consumers may experience from drinking alcohol has also been expressed in monetary terms. The monetary benefits of alcohol have been subtracted from the costs of alcohol to arrive at the final
estimate of net costs for society.
Regulatory policies aimed at reducing the amount of alcohol
consumed, such as a further increase of excise taxes, a reduction of the number of sales venues and a total mediaban, will result in savings for society at large. Some examples of such positive effects are less mortality and improvement of quality of life because some diseases associated with alcohol are prevented, more productivity, less traffic accidents and less efforts to be taken by police and justice. In the long run, over a period of 50 years, an increase in excise taxes of 50% will result in societal benefits of 14 to 20 billion euro, an increase of excise taxes of 200% will result in societal benefits of 37 to 47 billion euro. The societal benefits of closure of 10% of sales venues are estimated at 3 to 5 billion euro after 50 years, and at 8 to 12 billion euro when 25% of sales venues would be closed. The societal benefits of a mediaban would amount to 7 billion euro after 50 years, but there is more uncertainty about this result.
This appears from a study led by RIVM. The three regulatory policies have been modelled using the Social Cost-Benefit Analysis (SCBA) approach. By expressing the net welfare effect of government policies and interventions, SCBAs can support policy makers in taking
decisions on implementation of future policies.
Keywords: Social Cost-Benefit Analysis, alcohol, Cost of Illness, increase of excise taxes, closure of sales venues, mediaban
Publiekssamenvatting
Maatschappelijke kosten-batenanalyse van
beleidsmaatregelen om alcoholgebruik te verminderen
Als alle kosten en baten van alcohol in geld worden uitgedrukt, waren de kosten in 2013 ongeveer 2,3 tot 2,9 miljard euro. Kosten kunnen bijvoorbeeld ontstaan door een lagere arbeidsproductiviteit, door inzet van politie en justitie, en door verkeersongevallen. Deze kosten zijn verminderd met de baten van alcoholgebruik, bijvoorbeeld in de vorm van accijnzen voor de overheid. Maar ook het geluksgevoel dat consumenten kunnen ontlenen aan alcohol is in dit onderzoek in geld uitgedrukt.
Maatregelen zijn mogelijk om mensen minder alcohol te laten drinken, zoals een accijnsverhoging, een beperking van het aantal verkooppunten en een totaalverbod op alcoholreclame en –
sponsoring. Zulke maatregelen kunnen de samenleving forse besparingen opleveren en hebben daarmee netto een positief effect op de Nederlandse samenleving. Voorbeelden van die positieve effecten zijn minder sterfte en betere kwaliteit van leven doordat ziekten die met alcoholgebruik samenhangen worden voorkomen, een hogere arbeidsproductiviteit, minder verkeersongevallen en minder inzet van politie en justitie.
Op de lange termijn, over een periode van 50 jaar, levert een
accijnsverhoging van 50 procent tussen de 14 en 20 miljard euro op, een accijnsverhoging van 200 procent 37 tot 47 miljard euro. Het saldo van kosten en baten na 50 jaar is 3 tot 5 miljard euro wanneer 10 procent van de verkooppunten worden gesloten. Dit bedrag loopt op tot 8 tot 12 miljard euro bij een sluiting van 25 procent van de verkooppunten. Een mediaban levert de samenleving circa 7 miljard euro op na 50 jaar, maar hierover bestaat meer onzekerheid. Dit blijkt uit onderzoek geleid door het RIVM. Met een zogeheten maatschappelijke kosten-batenanalyse (MKBA) zijn deze drie
beleidsmaatregelen doorgerekend. MKBA’s zijn een hulpmiddel om de welvaartseffecten van maatregelen in kaart te brengen en kunnen beleidsmakers ondersteunen bij hun beslissingen over toekomstig overheidsbeleid.
Kernwoorden: MKBA, alcohol, Cost of Illness, accijnsverhoging, sluiting verkooppunten, mediaban
Contents
Summary — 13 Introduction — 171 Background to the methods used in this report — 21
1.1 Background to social cost-benefit analysis (research question 2) — 21
1.2 SCBA modeling approach — 25
1.3 RIVM Chronic Diseases Model — 27
1.4 Assumptions made for modelling costs and effects of alcohol policies (research question 2) — 30
1.5 Approach to determining net contributors and net receivers — 35 1.6 Approach to splitting monetary costs and benefits in financial and
non-financial euros — 36
1.7 Sensitivity analyses — 36
2 The costs and benefits of alcohol consumption in 2013 — 39
2.1 General methods for the cross-sectional assessment of costs and benefits of alcohol use (research question 1) — 39
2.2 Consumers — 41
2.2.1 Benefits: Consumer surplus — 41 2.2.2 Costs: Traffic accidents — 44 2.2.3 Costs: Premature mortality — 46 2.2.4 Costs: Productivity losses — 47 2.2.5 Loss of quality of life — 50
2.2.6 Summary costs and benefits for consumers of alcohol — 50 2.3 Production and distribution of alcohol — 51
2.3.1 Turnover and profit — 51
2.3.2 Summary costs and benefits from production and distribution of alcohol — 53
2.4 Taxes and duties — 54
2.4.1 Summary taxes and duties — 54
2.5 Healthcare — 55
2.5.1 Costs of diseases associated with alcohol use — 55 2.5.2 Costs of primary healthcare — 57
2.5.3 Costs of accidents — 58
2.5.4 Costs of diseases not valued in this section — 58 2.5.5 Summary of healthcare costs — 58
2.6 Education — 59
2.6.1 Study delay — 59
2.6.2 School dropout — 61
2.6.3 Study support — 61
2.6.4 Summary of costs and benefits in the field of education — 61
2.7 Police, justice — 61
2.7.1 Costs of prevention, tracing and justice — 61
2.7.2 Detention — 63
2.7.3 Summary of costs and benefits in the field of police, justice — 63
2.8 Government — 63
2.8.1 Education/campaigns — 63
2.8.2 Costs of enforcement — 64
2.9 Others in society (victims) — 64
2.10 Overview of costs and benefits of alcohol in 2013 — 65
3 Describing the reference scenario — 69
4 Social Cost-Benefit Analysis of a policy measure to increase
alcohol excise taxes — 73
4.1 Evidence on effectiveness of excise taxes — 73 4.2 Policy scenarios with regard to excise taxes — 73 4.3 Assessing the costs of the policy measures — 73 4.4 Main appraisal of costs and benefits — 74
4.5 Sensitivity analyses — 80
4.6 Conclusions — 82
5 Social Cost-Benefit Analysis of reducing availability
of alcohol — 83
5.1 Evidence on the effectiveness of reducing the number of venues where alcohol is sold — 83
5.2 Policy scenarios to reduce the number of venues where alcohol is sold — 83
5.3 Assessing the costs of the policy measures — 83 5.4 Main appraisal of costs and benefits — 84
5.5 Sensitivity analyses — 90
5.6 Conclusions — 91
6 Social Cost-Benefit Analysis of a Ban on Advertisements — 93
6.1 Evidence on the effectiveness of banning advertisements for alcohol — 93
6.2 Policy scenario to ban advertisements — 96 6.3 Assessing the costs of the policy measures — 96 6.4 Main appraisal of costs and benefits — 96
6.5 Conclusions — 99 7 Discussion of results — 101 7.1 General discussion — 101 7.2 Research agenda — 108 Acknowledgements — 111 Abbreviations — 113 References — 115
Appendix 1: Explanation of concepts used in this report — 123 Appendix 2A: Relative risks used in the RIVM-CDM — 124 APPENDIX 2B: Background data on diseases related to alcohol — 128
APPENDIX 2C: Estimate of number of cancer cases related to alcohol (2013) — 131
APPENDIX 3A: Results of sensitivity analyses for the increase of excise taxes policy scenario — 132
APPENDIX 3B: Results of sensitivity analyses for the reduction of alcohol sales venues policy scenario — 135
Summary
Alcohol consumption is very common in the Netherlands.
Consumption of alcohol is associated with positive and negative effects for society. These effects stretch out in many domains / sectors of society, such as taxes, healthcare, productivity, education and police and justice. The study described in this report addresses two main research questions:
1. What are the economic costs and benefits of current alcohol use?
2. What is the (economic) impact of new policies to reduce alcohol use relative to a reference scenario without implementation of such new policies?
Question 1 has been answered by providing a cross-sectional analysis of costs and benefits for the year 2013. Question 2 entails a
prospective analysis of changes in all societal domains associated with alcohol after implementation of these new policies. The three new policies considered are:
1. An increase of excise taxes with 50% and 200%. 2. A reduction in outlet density of 10% and 25%.
3. A total ban on advertisements (media ban) for alcohol. This study uses the method of Social Cost-Benefit Analysis (SCBA). Within this SCBA, projections for a period of 50 years after
implementation of new policy measures are made, using modelling techniques. This period was chosen to also include the long term effects of alcohol on health in the analysis.
Although some obvious benefits (i.e. income from excise duties) are present, alcohol is associated with a net cost to society. This net cost is estimated to be between 2.3 and 2.9 billion euro for the year 2013. Costs are mainly borne by consumers of alcohol, following costs of traffic accidents, premature mortality from diseases associated with alcohol, loss of quality of life associated with diseases that are associated with alcohol and productivity losses. At the same time, consumers experience a considerable benefit in terms of welfare gains associated with (the pleasure of) consuming alcohol, the so-called consumer surplus. Annual tax income for the government was over 1 billion euro. Producers and retailers experience benefits from production and distribution of alcohol, the so-called producer surplus, that was estimated at 0.7 billion euro in 2013.
Within the prospective analysis, the SCBA, policy measures were compared to a reference scenario, reflecting the current state of play and autonomous trends without implementation of the policy
measures, that is the most likely changes in alcohol consumption without interventions. As current alcohol trends are pointing at different directions, we choose to keep current alcohol consumption patterns stable over time. Compared to this reference scenario with stable alcohol consumption patterns, annual (undiscounted) benefits of a 50% tax increase are expected to be roughly between 350 and
850 million euro over the 50 years considered. The cumulative discounted net monetary benefit over a period of 50 years is 17 billion euro (95%CI 14-20 billion euro). In the 200% tax increase scenario, annual benefits are between 1,000 and 2,300 million euro, with cumulative (discounted) social benefits of 42 billion euro (95%CI 37-47 billion euro). Both scenarios represent an overall benefit to society. These monetary benefits are unequally spread over the different stakeholders involved, with alcohol consumers being largest net payers. Benefits are redistributed to all consumers (including those who consume alcohol) because of reduced insurance premiums and higher wages following higher productivity. The government sector also experiences benefits from higher excise taxes, because of reduced costs in the fields of education and police and justice. These results are fairly robust in sensitivity analyses with regards to
discount rate, valuation of QALY losses, either or not including productivity losses and different price elasticities.
The second policy scenario, focusing on less availability of alcohol through limiting the number of outlets where alcohol is sold, has positive social benefits as well, albeit somewhat less high than in the scenarios involving an increase in excise taxes. The cumulative discounted value to society of a 10% decrease in outlet density over a 50-year period amount to 4 billion euro (95%CI: 3-5 billion euro). All three main stakeholder groups (alcohol consumers, all consumers and government) experience benefits from this reduction in number of outlets that sell alcohol. In the 25% decrease in outlet density scenario, these effects are somewhat stronger, with a cumulative discounted value to society over a 50-year period amounting to 10 billion euro (95%CI:8-12 billion euro).
Finally, the third policy scenario involving a total media ban was modelled using limited evidence on effectiveness of such a ban for alcohol advertisements. Best available evidence points at a decrease of alcohol use with 4% after implementation of a ban. Our best guess, for the scenario that a media ban leads to a 4% reduction in alcohol consumption, shows that the yearly (undiscounted) benefits may fall roughly between 0.1 and 0.4 billion euro over the 50 years considered, corresponding to a cumulative discounted value to society over a 50-year period of 7 billion euro.
Overall, our estimates for the policy scenario of increasing excise taxes are rooted into sound evidence on the effectiveness of such policies. Sensitivity analyses consistently show societal benefits of such policies, with no major deviations from the results in the base-case analysis. Our results for the other two policy scenarios are more uncertain. Effects of a reduction of outlet density will most likely be positive (net benefits for society) but depend heavily on the expected reaction of consumers on the limitation of the number of sales
venues. These so-called elasticities, that reflect the reaction of consumers to changes, are more uncertain for the policy scenario involving a reduction of the number of outlets selling alcohol than for the excise tax increase scenarios. Our best guess for the policy measure of a total media ban is that this will have net social benefits, but this result is only to be considered as a tentative result.
Calculations as made in this report may be used to underpin possible changes in alcohol policies in the Netherlands. However, final
decisions on changes in policies are political decisions, and many more aspects than estimates of welfare effects of policies alone should be taken into account in such decisions. We have included some rather extreme scenarios, e.g. a 200% increase of excise taxes and closure of 25% of all sales venues. Social acceptability of such rigid measures may be sub-optimal. Nevertheless, our research shows that policy measures targeted at reducing alcohol consumption may lead to net social benefits.
Introduction
The Netherlands Organization for Health Research and Development (ZonMw) has commissioned this study to assess the costs to society of alcohol consumption, and to assess the effect of policy measures. The policy measures are evaluated using a Social Cost Benefit
Analysis (SCBA) approach. The analysis is performed for the Ministry of Health, Welfare and Sports (VWS), with the aim to inform
Parliament.
Alcohol consumption is very common in the Netherlands and most of the alcohol consumption is not problematic. Alcohol misuse and dependency, however, is often associated with a chronic course and is associated with a substantial disease burden. In 2014, 76.7% of Dutch adults consumed alcohol on a regular basis, with 10% of the population being classified as “heavy user”. A heavy user drinks at least once a week four (females) or six (males) glasses1 of alcohol (Van Laar et al., 2015). Use of alcohol is associated with more than 60 different diseases, among which breast cancer, liver disease, cognitive decline and dementia, depression and anxiety disorders. According to the National Public Health Forecast 2014 (VTV, 2014), 2.8% of total Dutch disease burden expressed in Disability Adjusted Life Years (DALYs), is attributable to alcohol. This excludes the contribution of alcohol to accidents. The disease burden stemming from alcohol use not only affects lives of consumers and their families, but also has substantial financial and economic impact. According to the Global Burden of Disease study, the economic costs due to alcohol are estimated at 1.4% of the gross domestic product (GDP) in high income countries (Rehm et al., 2009). A Dutch study estimated these “Cost of Illness” at €2.5 billion in 2001 (KPMG, 2001). Alcohol consumption not only leads to costs in the health sector, but also for other government sectors, such as the criminal justice system, and in victims of alcohol related accidents and violence. Moreover, it affects productivity of the drinkers, thereby affecting economic production.
A recent RIVM review of cost-effectiveness studies of alcohol
interventions concluded that an SCBA is needed to map all relevant costs and benefits of alcohol use (Suijkerbuijk et al., 2014). A social cost-benefit analysis takes a well-structured and systematic approach to reviewing all pertinent costs and benefits in order to be able to assess the full impact of an intervention on welfare at the macro level of a country. When the costs of the intervention are lower than the willingness to pay for its benefits, the intervention will increase general welfare. Such an evaluation demands that all consequences of a policy are being mapped and valued in monetary units, for all stakeholders, over a relevant period of time.
1 Throughout this report, a glass of alcohol represents the Dutch standard glass per type of alcohol (beer, wine spirit), implying an intake of 10g of alcohol
The methodology of social cost-benefit analyses was only recently introduced in the field of (public) health, where cost-effectiveness analyses (CEA) and cost-utility analyses (CUA) are more commonly applied. Although guidelines for health economic evaluation state that a societal perspective should be taken, studies often do not include costs beside healthcare costs, productivity losses and patient costs. Other costs, e.g. costs related to reduced school attendance or costs incurred by the criminal justice system, often are not incorporated in analyses (van Gils et al., 2010). Traditionally, CEAs and CUAs include health outcomes as main outcome parameters. An SCBA evaluates all outcomes in monetary units and summarizes the results into a single net benefit estimate. Furthermore, small methodological differences exist between CEA/CUA guidelines and guidelines for SCBA, mainly regarding the valuation of productivity losses, discounting, and extent of uncertainty analysis. In 2013, a Dutch guideline (“leidraad”) was published to assure the quality and methodological consistency of Dutch SCBAs performed in different sectors of society (Romijn & Renes, 2013). How this Dutch guideline for SCBA relates to methods for health economic evaluation as practiced within healthcare was discussed in a RIVM report by Pomp and colleagues (Pomp et al., 2014). Pomp et al. concludes that SCBAs are expected to make a useful contribution to informing healthcare policies and decisions therein.
The aim of this study is to assess the costs of alcohol consumption to society as well as to analyze the welfare impact of three different regulatory approaches to reduce alcohol consumption in the
Netherlands, using the evaluation framework of SCBA. The analysis aims to support decision-making on possible regulatory policies. The following policy measures are analyzed:
(1) increasing prices of alcoholic drinks by taxation; (2) reducing outlet-density for alcohol-selling venues; and (3) a total ban on advertisements (media ban) for alcohol.
The choice for these three policy measures was made by the Ministry of Health and ZonMw.
The SCBA addresses two central research questions:
1. What are the economic costs and benefits of current alcohol use in the Netherlands?
2. What is the (economic) impact of new policies to reduce alcohol use relative to a reference scenario without implementation of such new policies?
Both costs and benefits have been mapped and are valued in monetary terms. These relate to, among others, healthcare use, changes in labor productivity, changes in traffic accidents costs, violence and crime, and changes in the government’s tax revenues. Costs and benefits are analyzed for the short and longer-term, by comparing a reference scenario (current state of play and
autonomous trends without policy changes) with an alternative scenario in which the new regulatory policy has been implemented.
A consortium consisting of RIVM, Maastricht University, Trimbos Institute and Ecorys has performed this SCBA. At the same time, several consortium members are involved in other SCBAs, on issues such as Tobacco control (led by Maastricht University, consortium members RIVM and Trimbos Institute), addiction care for alcohol addiction (RIVM) and addiction care for cannabis addiction (RIVM). These SCBAs studies use similar methods. Because the SCBAs have been commissioned by different parties, each SCBA is published separately. However, specific parts of these reports, mainly in the methods section, use similar wording, reflecting that similar methodological choices were made for the different SCBAs.
Structure of this report
Chapter 1 provides some general notes on the methods used to address the research questions, e.g. with regard to the approach to modelling. In this chapter, we discuss the general framework of an SCBA and the models used to estimate costs and benefits of alcohol policies. Detailed notes on methods will be provided in Chapter 2 discussing the welfare implications of alcohol consumption for society in one year (2013). Research question 1 is answered in Chapter 2. Chapters 3 through 6 cover the second research question, the economic impact of policy measures directed at diminishing alcohol consumption. In Chapter 3 the reference scenario is described, i.e. expected developments under the current set of policies including autonomous trends in alcohol use. Chapters 4, 5 and 6 present and discuss the results of the three different policy measures. Chapter 4 is concerned with the increase of excise taxes, chapter 5 covers the implications of decreasing outlet density and chapter 6 discusses the consequences of a total media ban. Chapter 7, finally, presents the main findings of this research project along with a discussion of these findings and a research agenda addressing the most important gaps in current knowledge.
1
Background to the methods used in this report
1.1 Background to social cost-benefit analysis
(research question 2)
An SCBA is a systematic method to value the impact of policy measures. SCBA is rooted in welfare economics. Related to alcohol, this classical economic approach assumes that people consume alcohol to fulfill a (perceived) need: they derive utilities from alcohol use in terms of e.g. (perceived) well-being. Thus, in the short run, the expenses for alcohol are justified by consumers on the basis of this perceived well-being. Alcohol consumption leads to revenues for various parties involved in supplying the alcoholic drinks, such as the Government (taxes, duties), retailers, and producers of alcoholic beverages. Restrictions in the consumption of alcohol, e.g. by
increasing excise taxes or restricting outlet points, will then lead to a loss of welfare for consumers; they suffer a loss of “consumer
surplus”. Producers and retailers may suffer a loss of welfare as well, as their revenues will be reduced, possibly affecting their “producer surplus”. The effect on the Government’s income will depend on the price elasticity of demand for alcohol, the relative change in
consumption occurring with a relative change in price: it may reduce, because of lower consumption; alternatively, it may remain stable or even rise, when loss of sales is compensated for by the increase in duties. These economic concepts are explained in more detail in Appendix 1.
However, in the longer term, the welfare impact of a change in alcohol consumption is much wider. This is due to various reasons such as the occurrence of addiction to alcohol (making consumption a less voluntary choice) and social, psychological and medical effects of alcohol consumption. Effects of alcohol consumption do no only occur in the consumer of alcohol, but others in society may be affected as well, e.g. after traffic accidents or violence following alcohol use. Such effects can, in welfare theoretic terms, be called external effects. To illustrate: as alcohol may adversely impact on the health of individuals, this may lead to an increase in healthcare costs, which is only partially incurred by the consumer. Substantial effects of alcohol consumption are only visible in the long run and may be (largely) external to the consumer, as others in society also pay for the costs associated with these adverse health effects via health insurance premiums. Additionally, the consumer does not take these costs into account when deciding on consumption and may
underestimate the risk of future healthcare costs rising as a
consequence of his behavior. Similarly, changes in crime rates and labor productivity may occur, with substantial effects not only for the consumer, but also for other parties in society.
Following the Dutch guideline for SCBA (Romijn & Renes, 2013), we have structured our research strategy along the following eight steps:
1. Scoping the problem.
3. Define policy alternatives.
4. Define and value the benefits of the alternative scenario vis à vis the reference scenario.
5. Define and value the costs of the alternative scenario vis à vis the reference scenario.
6. Conduct sensitivity analyses to assess the robustness of outcomes.
7. Assess the present value of costs and benefits and their distribution over stakeholders.
8. Present the outcomes.
These steps are explained in more detail below.
Step 1: Scoping the problem
As a first step, we ‘set the stage’ by describing the width and breadth of alcohol use in the Dutch population in terms of its prevalence and consequences, and the trends under the current set of alcohol-related policies. The main aim of this step is to describe the state of affairs of the current regulatory policies for alcohol in the Netherlands. This serves as the starting point for the SCBA. In order to come to an assessment of policy options to reduce (excess) use of alcohol, an overview of the various economic consequences of alcohol use will be given first. Here, we benefit from the work that was done in the context of answering the first research question, the cross-sectional assessment of costs and benefits of alcohol for the year 2013
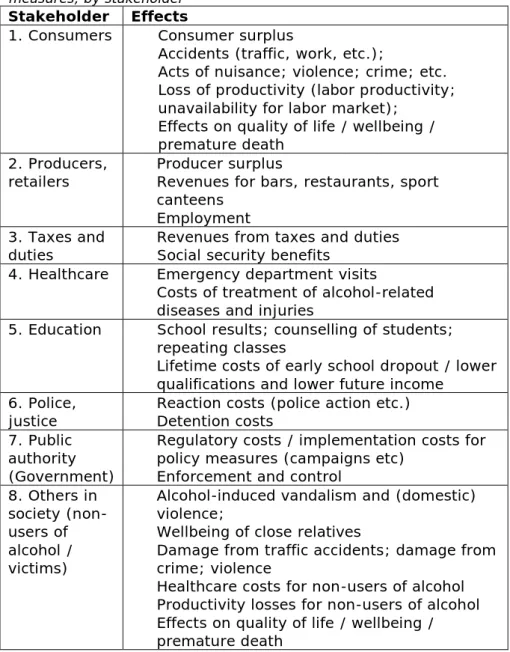
(Chapter 2). Much of the data collected to answer research question 1 show to be very relevant for the first step of the SCBA process. To map out all these effects and their consequences is the prime task in step 1 of the SCBA (scoping the problem). These data relate to the following effects of alcohol:
Table 1.1 Inventory of effects to be quantified in an SCBA of alcohol policy measures, by stakeholder
Stakeholder Effects
1. Consumers • Consumer surplus
• Accidents (traffic, work, etc.);
• Acts of nuisance; violence; crime; etc. • Loss of productivity (labor productivity;
unavailability for labor market); • Effects on quality of life / wellbeing /
premature death 2. Producers,
retailers • • Producer surplus Revenues for bars, restaurants, sport canteens
• Employment 3. Taxes and
duties • • Revenues from taxes and duties Social security benefits 4. Healthcare • Emergency department visits
• Costs of treatment of alcohol-related diseases and injuries
5. Education • School results; counselling of students; repeating classes
• Lifetime costs of early school dropout / lower qualifications and lower future income
6. Police,
justice • • Reaction costs (police action etc.) Detention costs 7. Public
authority (Government)
• Regulatory costs / implementation costs for policy measures (campaigns etc)
• Enforcement and control 8. Others in
society (non-users of alcohol / victims)
• Alcohol-induced vandalism and (domestic) violence;
• Wellbeing of close relatives
• Damage from traffic accidents; damage from crime; violence
• Healthcare costs for non-users of alcohol • Productivity losses for non-users of alcohol • Effects on quality of life / wellbeing /
premature death
Step 2: Determine the reference scenario based on current policies
Defining the reference scenario is crucial, because this will be the scenario to which the impacts of the new regulatory policies will be compared. Therefore, the reference scenario describes the current state of affairs (status quo) and how this will autonomously develop over time, i.e. without changes in alcohol policy but taking into
account the demographic changes and autonomous trends (if any). In this SCBA, the time horizon is set at 50 years. This time-horizon was chosen as we wanted to model the long-term impact of policy
measures.
Step 3: Define policy alternatives (alternative scenarios)
In this step, the possible regulatory policies are described. Broadly speaking, policies may impact on alcohol use by (1) increasing prices of alcohol, (2) reducing outlet-density for alcohol-selling venues, and
(3) implementing a ban on advertising for alcoholic drinks. Details of these policies will be described in Chapters 4 to 6.
Step 4 and Step 5: Define and value the benefits and costs of the alternative scenario vis à vis the reference scenario
In this step, the economic costs of implementing and maintaining the new policies are assessed relative to the reference scenario. First, it is assessed to what extent the policy measure will affect future
consumption of alcohol, and, if possible, by which groups of consumers (e.g., young adults, adults or elderly; incidental users, mild users, excessive drinkers, etc.). Next, the impact on alcohol use per type of consumer is translated into positive and negative
consequences that may stem from the new regulatory policies. Here, we take the step of assigning a monetary value (in €) to the costs and benefits for the various stakeholders relative to the reference scenario. Whenever possible, we used standard unit costs, e.g. for health economic evaluations (Zorginstituut_Nederland, 2015) or for inter sector economic evaluations (Drost et al., 2014). Another source of information for cost estimates was the “Werkwijzer MKBA in het sociaal domein”, a guideline detailing methods and unit prices for SCBA within the social sector (Koopmans et al., 2016b; Koopmans et al., 2016a), commissioned by the Ministries of VWS, SZW, OCW and BZK. All costs and benefits are expressed in 2013 euros. Future costs and benefits are discounted at 3%, in line with a Government
statement in reaction to the publication of Dutch guidelines for SCBA (Romijn & Renes, 2013; Dijsselbloem, 2015). At this stage, it is crucial to avoid double counting of benefits (e.g. preventing
transplantations of the liver and preventing hospital admissions).
Step 6: Conduct sensitivity analyses to assess the robustness of outcomes
The main analysis conducted in step 4 and 5 is subjected to
sensitivity analyses to assess the robustness of the study’s outcomes in relation to the different assumptions made.
Step 7: Assess the present value of costs and benefits and their distribution over stakeholders
At this step, we compute the net present value of all costs and benefits for the appropriate base year 2013. Costs and benefits are shown for each group of stakeholders. Costs and benefits will be reviewed over a time period of 50 years. Some intangible costs and benefits cannot be meaningfully converted into monetary terms. One example relates to family members of alcoholics, who may be
potential victim of domestic violence. Those costs will be not be valued monetarily but listed as pro memori (PM) costs or benefits.
Step 8: Present the outcomes
We report the outcomes of the main analysis and the sensitivity analyses in agreement with the guideline for reporting economic evaluations in a transparent and replicable way (Husereau et al., 2013). This is done for each of the policy options under review and includes a list of the non-monetized costs and benefits.
1.2 SCBA modeling approach
Our SCBA model is implemented as a Microsoft Excel model. The Excel model synthesizes all available input and transforms this into the overall costs and benefits associated with the regulatory policies considered in this project.
The model includes:
1. The costs of implementing (and enforcing) alcohol policies. 2. The effects of alcohol policies on alcohol intake.
3. The costs and benefits associated with reduced alcohol intake for the different domains as listed in Table 1.1. For the domain “others in society”, data were inadequate to split effects in consumers of alcohol from effects in non-consumers of
alcohol. For instance, for traffic accidents we had access to the number of people affected by alcohol at baseline (before introduction of policies), but not at the level of detail required to split these numbers into alcohol consumers and
non-consumers. A positive change in the number of alcohol-related traffic accidents following a policy measure could not be split the two groups of consumers. As this was quite often the case, we chose to discuss and value total effects under the domain “consumers”, and to leave out “others in society” as a
separate domain.
The RIVM-Chronic Diseases Model (RIVM-CDM) has been used to model the development of age- and gender-specific drinking behavior over time, which has consequently been used to estimate the costs and benefits in the different domains (see Figure 1.1). Further
information on the RIVM-Chronic Disease Model is given in paragraph 1.3. of this report.
As the RIVM-CDM also generates QALYs and healthcare costs related to chronic diseases, this output is used to directly estimate the impact of alcohol policies in the healthcare domain. As the RIVM-CDM does not include all diseases that are linked to alcohol (see paragraph 1.3.), health effects of alcohol not covered through RIVM-CDM, e.g.Korsakov disease following heavy alcohol use, are covered in the Excel model.
Figure 1.1: Conceptual model
For most domains, the development of effects has been linked to the highest, or highest two risk classes (see paragraph 1.3 for a definition of these risk classes). When the costs in a certain domain are fully alcohol-related and direct, the development of the costs in such a domain has been linked one-on-one with the development over time of the prevalence of the highest (or highest two) risk classes. If the costs in a domain are wider than just alcohol-related (as is the case in costs in the domains police and justice), or if the effects of alcohol were expected to develop over time rather than having a direct effect, correlation rates based on Wagenaar et al. (2010) have been applied, resulting in a cushioning of the effects. This implies that a reduction in the consumption of alcohol would lead to a smaller
reduction in the costs in such domains. Lastly, certain effects, such as consumer surplus or taxes and duties, have been linked to the total number of consumptions, which was obtained by translating
prevalence of the age- and gender-specific risk classes into a total number of alcohol consumptions.
The Excel model estimates the incremental costs and benefits of regulatory policies by comparing the reference scenario (with no additional policies) with alternative scenarios (with additional regulatory policies aimed at curbing alcohol consumption). The incremental costs and benefits are determined by simply looking at the difference between the costs in the alternative and the reference scenario. Within an SCBA, the incremental cost or benefit is
1.3 RIVM Chronic Diseases Model
The first step in the calculations is to model alcohol consumption in the Dutch population and the incidence and prevalence of chronic diseases that are related to alcohol consumption. This analysis has been performed with the RIVM‐Chronic Diseases Model (RIVM-CDM) (Hoogenveen et al., 2010). The RIVM-CDM is a Markov‐type, dynamic population‐based model developed at the RIVM). The RIVM-CDM describes the Dutch population with age- and sex specific prevalence of risk factors for the occurrence of chronic diseases. Risk factors described by the model are e.g. smoking behavior, physical activity and hypertension. The most important chronic diseases related to lifestyle are incorporated into the RIVM-CDM. This includes diabetes, acute myocardial infarction and stroke. The model also describes mortality and morbidity associated with the diseases that are related to risk factors, among which alcohol consumption (Baal et al., 2005). The RIVM‐CDM has been used extensively for economic evaluations of interventions to reduce risk factors for chronic diseases, e.g. in the field of smoking cessation and increasing physical activity (Baal, 2005; Feenstra et al., 2005; Jacobs-van der Bruggen et al., 2009). Alcohol is included in the RIVM‐CDM in four categories of alcohol consumption. For each class of alcohol consumption, background data on positive and negative health effects of alcohol consumption are specified in the RIVM‐CDM.
There are several types of input data to the RIVM-CDM: 1. demographic data,
2. relative risk data,
3. alcohol prevalence data, 4. alcohol transitions data, 5. cost data,
6. quality of life data.
Demographic data contain information about birth, mortality, and migration. They originate from statline.cbs.nl. Alcohol prevalence and transition data were adapted from Health Survey
[Gezondheidsenquête] 2011 (statline.cbs.nl) and
Peilstationsonderzoek 2011 (peil.trimbos.nl). Data on relative risks associated with alcohol consumption are taken from meta-analyses as recently summarized by the Health Council (Gezondheidsraad, 2015a) and from a TNO report about lifestyle factors and cancer (Lanting et al., 2014a) (See Appendix 2A). Cost data are derived from the RIVM Cost of Illness Studies (www.kostenvanziekten.nl) and quality of life losses that result from having one or more of the chronic diseases are adapted from Dutch and global burden of disease studies (Stouthard et al., 2000). More information on these input data can be found in a background report on using the RIVM-CDM for cost-effectiveness analysis (Van Baal et al., 2005).
The RIVM-CDM distinguishes four categories of average alcohol consumption. The four categories of alcohol consumption in the RIVM-CDM are:
1. Class 1: <0.5 drinks per day, both for men and women. 2. Class 2: on average ≥ 0.5 and < 3.5 drinks per day (men),
on average ≥ 0.5 and < 2.5 drinks per day (women), 3. Class 3: on average ≥ 3.5 and < 5.5 drinks per day (men),
on average ≥ 2.5 and < 3.5 drinks per day (women),
4. Class 4: on average ≥ 5.5 drinks per day (men); on average ≥ 3.5 drinks per day (women).
The RIVM-CDM contains a number of diseases that is associated with alcohol use. To model this association between the risk of these diseases occurring and the average daily consumption of alcohol, we used data from published meta-analyses. Appendix 2A provides with background data on these risks as a function of consumption of alcohol. Each class is associated with different relative risks for the occurrence of:
• total mortality (independent of occurrence of diseases), • acute myocardial infarction (AMI),
• stroke (cerebrovascular accident, CVA), • cancer of the esophagus,
• breast cancer,
• cancer of the larynx, • oral cavity cancer.
Depending on the disease associated with alcohol consumption and the class of alcohol consumption, risks may vary positively or negatively with alcohol consumption, i.e. a disease may occur more often or less often as a consequence of differing levels of alcohol use. To calculate the incremental effects of policy measures on drinking behavior within the RIVM-CDM, it is important to know what the average number of drinks per day in each of the four categories of alcohol consumption is. Average numbers of drinks per day are usually not integer values, and therefore we set the boundaries between the different categories of alcohol consumption at
0.5/2.5/3.5/5.5 drinks per day, see Table 1.2. This implies that the average number of drinks in, for example, the lowest class is not equal to zero, but instead a number between zero and a half, corresponding to the fact that even in the “no alcohol on a daily basis” category (class 1), people occasionally may consume some alcohol. Table 1.3 presents the proportion of total alcohol
consumption per class and per gender.
Table 1.2 Average number of alcoholic standard drinks per day per class of alcohol consumption, by sex (range of average drinks per day)
Class 1 Class 2 Class 3 Class 4
Men 0.21 (0-0.5) 1.59 (0.5-3.5) 4.27 (3.5-5.5) 8.18 (>5.5) Women 0.18 (0-0.5) 1.21 (0.5-2.5) 2.94 (2.5-3.5) 5.64 (>3.5)
Table 1.3 Population numbers (proportion of total) that falls in each of the four drinking classes, by sex
Class 1 Class 2 Class 3 Class 4 Total
Men 2,080,000 (0.144) 4,530,000 (0.312) 490,000 (0.034) 206,000 (0.014) 7,310,000 (0.504) Women 3,490,000 (0.241) 3,230,000 (0.223) 278,000 (0.019) 190,000 (0.013) 7,190,000 (0.496) Total 5,570,000 (0.385) 7,760,000 (0.535) 768,000 (0.053) 396,000 (0.027) 14,500,000 (1.000)
Source: own calculations based on Health Survey [Gezondheidsenquête] 2012-2014
From Table 1.3, it is clear that the vast majority of the population in the Netherlands belongs to classes 1 and 2 and thus that most citizens are moderate consumers of alcohol.
Successful policy measures aimed at lowering alcohol use will result in some downward changes between these four categories of alcohol use, as some people will shift to a lower class of alcohol use. The data from the Health Survey [Gezondheidsenquête] also enable to
calculate the relation between an average decrease of alcohol consumption and a change in class distribution. We estimated this relation assuming a linear relation. Table 1.4 below shows the results:
Table 1.4 Class transitions because of drinking one glass per day less, with confidence intervals
Class 4 -> class 3 Class 3 -> class 2 Class 2 -> class 1
Men 0.060 (0.059 - 0.060) 0.127 (0.126 - 0.128) 0.149 (0.147 - 0.151) women 0.084 (0.083 - 0.085) 0.147 (0.146 - 0.148) 0.282 (0.279 - 0.285) If the total population drinks on average 0.1 glass per day less, 0.6%
of the total male population shifts from class 4 to class 3, 1.27% from class 3 to class 2, and 1.49% from class 2 to class 1. For women, 0.84% shifts from class 4 to class 3, 1.47% from class 3 to class 2, and 2.82% from class 2 to class 1. These shifts were used to
implement the scenario calculations in the RIVM-CDM, along with the default input alcohol transitions of the RIVM-CDM.
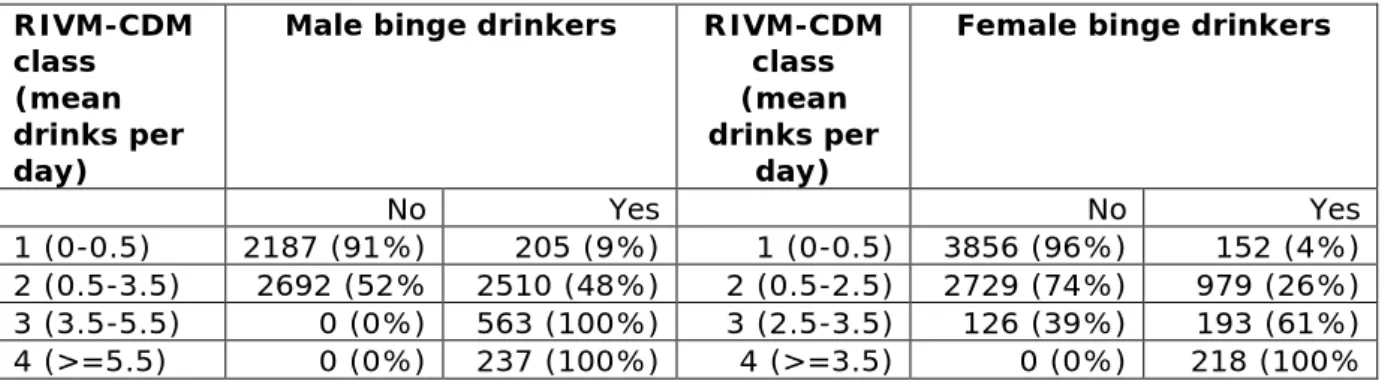
Although the RIVM-CDM does not explicitly distinguish between binge drinking or not, binge drinking is comprised in the highest RIVM-CDM classes of alcohol consumption. Because relative risks as included in the RIVM-CDM (from meta-analyses, see Appendix 2A) have been derived from populations including both consumers with and without binge drinking patterns, health effects of binge drinking are assumed to be included (averaged) in the (highest) classes of alcohol
consumption in the RIVM-CDM. In our calculations, we adopt the most commonly used Dutch definition for binge drinking of five or more standard drinks per occasion during the last two weeks (Van Laar, 2015). This definition results in 100% binge drinkers in the highest RIVM-CDM class of alcohol consumption, for both men and women. For men, the second highest class of alcohol consumption consists of 100% binge drinkers too, see Table 1.5.
Table 1.5 Proportion of binge drinkers in the alcohol consumption categories of RIVM-CDM RIVM-CDM class (mean drinks per day)
Male binge drinkers RIVM-CDM
class (mean drinks per
day)
Female binge drinkers
No Yes No Yes
1 (0-0.5) 2187 (91%) 205 (9%) 1 (0-0.5) 3856 (96%) 152 (4%)
2 (0.5-3.5) 2692 (52% 2510 (48%) 2 (0.5-2.5) 2729 (74%) 979 (26%)
3 (3.5-5.5) 0 (0%) 563 (100%) 3 (2.5-3.5) 126 (39%) 193 (61%)
4 (>=5.5) 0 (0%) 237 (100%) 4 (>=3.5) 0 (0%) 218 (100%
Source: own calculations, based on Health Survey [Gezondheidsenquête] 2012-2014
The policy scenarios are implemented in the RIVM-CDM as a change in the initial prevalence of the alcohol consumption classes that corresponds to the expected altered alcohol consumption levels caused by the policy, with every drinking person consuming an equally smaller number of drinks. The policy scenarios therefore start with a smaller part of the population in the high alcohol consumption classes and a larger part in the low consumption classes. The
demographic parameters are not altered, neither are the Relative Risks for disease and mortality, nor the transition probabilities between the classes of alcohol consumption. The fact that transition probabilities remain unchanged implies that in the course of time the prevalence of alcohol consumption classes will gradually return to the prevalence in the reference scenario.
1.4 Assumptions made for modelling costs and effects of alcohol
policies (research question 2)
Below, we list some of the assumptions made to estimate effects of the policy measures.
Valuation of quality of life: Alcohol impacts on incidence and
prevalence of a number of diseases and these diseases in turn impact on quality of life. Avoidance of disease through low alcohol
consumption may have a positive impact on quality of life while occurrence of diseases that are associated with moderate to high intake of alcohol impacts negatively on quality of life. For all diseases that have an association with alcohol (see Appendix 2B), utility weights reflecting the impact that this disease has on quality of life have been incorporated in our models. A utility weight of 1 reflects good health, while lower utility weights, between 0 and 1, reflect the relative impact the disease has on quality of life. A utility weight of 0.82, for instance, reflects a disease with 18% loss of quality of life, relative to normal health. A utility weight of 0.37 reflects a 63% loss of quality of life. Hence, the lower the utility weight, the more serious the impact of disease on quality of life. As the average Dutch
population also has disease and disorders, background quality of life is not set at 1, but somewhat lower. Here, the average utility for the Dutch population is taken from a recent publication of Versteegh et al. (Versteegh M, 2016), i.e. 0.869. For diseases occurring in
value, the disease specific utility was used. For diseases above this baseline value, the baseline value was used in calculations. In case of more than one disease, utility values were taken as the cumulative value of diseases concerned. The effects on quality of life were considered for the average period that patients live with a certain disease. This has been modelled as total prevalence in year x divided by incidence in year x (see appendix 2B).
Valuation of Quality Adjusted Life Years: For each policy
measure, the RIVM-CDM generates estimates of the incremental QALYs resulting from that policy measure, compared to the reference scenario. In addition, the SCBA model estimates QALYs for those diseases that were not modelled through RIVM-CDM. For calculations involving the monetary value of Quality Adjusted Life Years, we used an estimate of € 50,000 in base-case analyses, following guidelines for SCBA from SEO (Koopmans, 2016). SEO recommends to vary this value to € 100,000 per QALY in sensitivity analyses, as was done by us.
Consumer surplus following increase of excise taxes: Changes
in consumer surplus have been estimated in the case of an increase in excise duties. An increase in excise duties leads to an increase in price and, through the price elasticity of demand, a decrease in demand. As consumers consume less at a higher price, this leads to a decrease in consumer surplus, equal to 50% of the average (before and after) consumption multiplied by the increase in total price (‘rule of half’). In the RIVM-CDM, the effect of this policy is modelled as a change in the initial distribution of the population over the four risk classes of alcohol consumption. This new prevalence within the four risk classes then undergoes a yearly regression towards the initial pre-policy distribution, as annual transition probabilities remain unchanged in our modelling.
Consumer surplus following decrease in outlet density:
Changes in consumer surplus have been estimated in the case of an decrease in outlet density. A decrease in outlet density is expected to result in a decrease of alcoholic consumption. This implies that the ‘cost’ (or effort needed) of buying an alcoholic consumption increases for some of the drinks, for instance because alcoholic drinks are not available at all times or because the average distance, as the average distance that consumers have to travel to their outlet increases. The loss of consumer surplus in this scenario has been calculated as if a price increase occurred that via the price elasticity would have resulted in the expected decrease in demand in this scenario. With this hypothetical increase in price (of acquiring the drinks) and the expected level of decrease in demand, the loss in consumer surplus could be estimated by taking 50% times the decrease in consumption multiplied by the ‘increase’ in price (‘rule of half’). In the RIVM-CDM, the effect of this policy is modelled as a change in the initial
distribution of the population over the four risk classes of alcohol consumption. This new prevalence within the four risk classes then undergoes a yearly regression towards the initial pre-policy
distribution, as annual transition probabilities remain unchanged in our modelling.
Consumer surplus following a total media ban: Consumer
surplus was assumed to be zero in case of a ban on marketing. For this latter regulatory policy, it is assumed that 100% absence of exposure to marketing for different alcoholic products leads to a true change in preference of consumers, which results in a change in demand, without affecting the total utility that consumers gain from their consumption.
Producer surplus: In line with the recommendations in the CPB
Netherlands Bureau for Economic Policy Analysis guideline for SCBA, changes in producer surplus have been assumed to be zero in the scenarios considered. Following the introduction of alcohol policy measures, a decrease in alcohol consumption (sales, production) is to be expected. This will cause a reduction in production and a decrease in producer surplus within the alcohol producing industry and within the retail sector. However, the means of production (labor, capital, entrepreneurship, etc.) may be assumed to be redirected to other sectors and generate producer surplus in these sectors. Therefore, the decrease in producer surplus is expected to be compensated for by an increase in producer surplus of the same order of magnitude in other sectors, when the means of production are redirected to other sectors.
Duties and taxes: In every policy scenario, the total value of duties
and taxes received by the tax authority changes as a result of
changes in consumption. In case of a regulatory policy that increases excise duties, duties and taxes are additionally changed by a per-consumption increase in duties and taxes. The change in duties and taxes is therefore calculated in two steps. First, the 2013 level in duties and taxes is multiplied by the factor by which demand is expected to decrease as a result of the regulatory policy. Second, in the case of an increase in excise duties per consumption, an
additional increase in excise duties is taken into account for the level of consumption in the alternative scenario. This overall change in duties and taxes as a result of the regulatory policy is then multiplied by 1.42, to include the resulting change in value added tax and other spin-off effects that are expected to arise from the change in
consumption and price. This multiplication factor of 1.42 is taken from the 2016 guideline for SCBA within the social sector, published by SEO Economisch Onderzoek (Koopmans, 2016b).
Costs of alcohol-related traffic accidents: the development of the
costs of alcohol-related traffic accidents was linked to the development of the prevalence of risk class 3 and risk class 4.
Productivity loss directly linked to alcohol consumption: We
distinguish two routes by which a change in alcohol use can affect work productivity: (1) a direct route and (2) an indirect route. A
direct impact of alcohol on productivity occurs when people stay
absent from their work or are less efficient while working as a direct consequence of their drinking on the same or previous day(s) (i.e. absenteeism and presenteeism). For each of the four alcohol drinking severity classes in the RIVM-CDM, we have obtained estimates of their association with the number of working days lost. These
estimates have been obtained from the literature, principally from Roche and colleagues (Roche et al., 2008). When a new regulatory policy generates a shift in the number of people in the alcohol drinking severity classes, then the corresponding changes in
productivity can be assessed, as well as the economic value of these productivity changes. These costs were based on the prevalence of consumption classes 2, 3 and 4, which according to Roche et al. are all associated with productivity losses due to alcohol consumption.
Productivity loss due to indirect health effects of alcohol consumption:
An indirect impact of alcohol on productivity occurs when people experience a lesser degree of health-related quality of life as a consequence of illnesses or disorders that are caused by drinking alcohol over longer periods. This is relevant because harmful alcohol use is a risk factor for a range of illnesses and disorders that usually occur later in life (e.g. cancer of the larynx, cirrhosis of the liver). These illnesses, in turn, will have an impact on labor productivity via QALY changes. Hence, we need to know how QALY changes are associated with corresponding changes in productivity.
QALY changes as a consequence of policy measures are modelled in this SCBA both through the RIVM-CDM and through the SCBA model in Excel. For the estimation of the relationship between a change in QALYs and a corresponding change in productivity, we relied on a sub-sample from the Netherlands Mental Health Survey and
Incidence Study (Nemesis-2 study), which was restricted to the Dutch workforce (de Graaf et al., 2010). Nemesis-2 has data on productivity losses (due to absenteeism and presenteeism) and has, in addition, data on QALYs. The latter were derived from the Medical Outcome Study Short Form (SF-36) (Ware & Sherbourne, 1992), and Brazier’s algorithm (Brazier et al., 2002) was used to translate these SF-36 scores into QALYs. Finally, by regressing the number of annual workdays lost on QALYs, we obtained the parameter of interest: the degree in which productivity losses change as a function of a change in QALYs. This method was adapted from Krol (Krol et al., 2014). The following simple equation was obtained:
AWLDs = QALY * (-318.0672) + 234.599,
where AWLDs is the number of annual work-loss days (owing to both absenteeism and presenteeism) and QALY are quality adjusted life years. This equation is used to quantify how the impact of a new policy affects drinking and subsequently affects the quality of life of the working population, and how that, in turn, affects productivity. To calculate the costs of productivity losses based on QALY changes, the difference in average QALY (relative to the reference scenario) per person within the labor force population are multiplied by the estimated mean work-loss days and the cost per workday lost as per the Dutch guideline for SCBA (Koopmans, 2016b).
Productivity costs (traffic-accident related): these costs were
linked to developments in the prevalence of risk class 3 and 4, following implementation of policy measures.
Productivity costs due to domestic violence: No correction factor
was applied, as the productivity costs due to domestic violence were deemed fully contributable to alcohol consumption and assumed to be immediate.
RIVM-CDM healthcare costs: The incremental healthcare costs as
estimated by the RIVM-CDM following the implementation of policy scenarios are straightforwardly integrated in the Excel-model without any further modifications, except a consumer price index (CPI) correction to reflect 2013 price levels.
Primary healthcare costs: Primary healthcare costs of alcohol were
modelled in the Excel SCBA model. The healthcare costs in primary care are linked to the prevalence of risk class 4. A change in
consumption following policy measures does not immediately lead to a corresponding change in healthcare use, as detrimental health effects do not immediately disappear when alcohol consumption diminishes. A change in the prevalence of risk class 4 is moderated by the Wagenaar et al. (2010) factor, assuming that a decrease in the consumption of alcohol leads to a decrease in health-related morbidity that is about 70% of the decrease in consumption, thus “cushioning” the effect.
Emergency department visits: Emergency department visits
following alcohol use were modelled in the Excel SCBA model. The costs relating to emergency department visits have been linked to the prevalence of risk class 4. No additional diminishing factor was
applied as the effects of a decrease in alcohol consumption on the use of the emergency department were considered to be immediate.
Additional healthcare costs: The additional healthcare costs
regarding diseases that were not modelled explicitly within the RIVM-CDM (see Paragraph 2.5), have been linked to the prevalence in risk class 4, while the change was diminished using the ±70% factor of Wagenaar et al. (2010), similar to the approach for primary
healthcare costs. These costs were incorporated in the SCBA model in Excel.
Education: The cost of study delay have been linked to the
prevalence of risk class 4, with no additional diminishing factor applied, as study delay was considered a fairly short-term effect following excessive drinking.
Police and justice: Costs of police and justice have been linked to
the prevalence of risk class 4, while the resulting change in costs was then diminished using the Wagenaar et al. (2010) factor for a change in alcohol consumption on crime-related effects. This reduced the effect to only 14% of the reduction in the prevalence of risk class 4, under the assumption that alcohol is not the sole causal factor behind the costs related to police and justice.
Effectiveness of policy measures: For all policy measures, we will
assume that once implemented, policy measures will not be changed anymore, implying continuation of these policies for the lifetime horizon of the model. However, the strength of the effects of the policy measure will fade out over time, as described above under “consumer surplus”.
1.5 Approach to determining net contributors and net receivers
At the end of each chapter discussing the effects of regulatory policies, we will present how the costs and benefits are distributed across different stakeholders. To determine which stakeholders have net payments and which stakeholders have net monetary benefits, three different stakeholders were considered, namely:
• alcohol consumers;
• all consumers, including alcohol consumers (being a
combination of “others in society” and “alcohol consumers”); • Government.
Each cost type is attributed to one of these three stakeholders. Here, we follow the reasoning that intermediate parties, such as insurance companies, will eventually adapt insurance premiums when, as a result of less consumption of alcohol, less traffic accidents occur and fewer people are absent from work. As long as the insurance market is an efficient market, with multiple supplying parties, this
assumption holds. For example, a decrease in material damage as a result of less alcohol-related traffic accidents is redistributed to all consumers through a decrease in monthly payments. Another
intermediate party, employers, will transfer increased productivity as a result of less alcohol related absenteeism and less alcohol related accidents at work in higher wages, benefiting all consumers, including those who drink alcohol. Table 1.6 shows the ultimate redistribution of costs to three stakeholder groups.
Table 1.6: Redistribution of costs and effects over different stakeholders
Stakeholder Type of costs/effects
1. Alcohol
consumers • • Premature mortality (traffic related) Consumer surplus • Quality of life
2. All consumers • Premature mortality (other causes / non-traffic related)
• Productivity losses (accident related) • Productivity losses (violence)
• Productivity losses (direct) • Productivity losses (indirect) • Duties and taxes
• Healthcare costs
• Alcohol related traffic accidents (material costs) • Alcohol related traffic accidents (traffic jams)
3. Government • Education
• Police and justice
• Alcohol related traffic accidents (handling cost) • Implementation costs, enforcement and control
1.6 Approach to splitting monetary costs and benefits in financial and non-financial euros
Central to the concept of SCBA is that all costs and all effects are valued monetarily. This equally concerns “real” costs, such as damage to vehicles after a car accident and “virtual” costs, such as the value put on a Quality Adjusted Life Year. To accommodate for this difference, we will present the net cumulative costs and benefits over a 50 year time horizon for all stakeholders, split into financial and non-financial €’s. Non-financial euros are those that stem from premature mortality, QALYs lost or gained and congestion costs after traffic jams. Furthermore, a part of valuation of consumer surplus is non-financial as well. Consumer surplus consists of demand effects and price effects. Price effects reflect the fact that consumer surplus will be lower because of higher prices of alcohol in (some) policy scenarios, while demand effect reflects the fact that lower
consumption results in lower consumer surplus. The demand effect will be covered as non-financial euros, the price effect as financial euros. All other costs and benefits are regarded as financial euros.
1.7 Sensitivity analyses
Probabilistic and one-way sensitivity analyses were performed to estimate the impact of uncertainty in model parameters. Probabilistic sensitivity analysis was based on the uncertainty regarding the development of the distribution of risk classes in the population throughout the time horizon of 50 years, as captured in the CDM. This results in one hundred random draws from the underlying distributions, resulting in one hundred possible risk class
distributions, healthcare cost estimates, and quality of life estimates, over the time horizon of 50 years. For each of the 100 CDM draws, an additional 100 random draws are taken from each of the cost
components for which a minimum and maximum estimate is known. Using these 10,000 simulations, outcomes in the SCBA are reported with 95% confidence intervals, representing the uncertainty in the outcomes as a result of the uncertainty in these underlying input parameters.
Next to probabilistic sensitivity analysis, one-way sensitivity analyses were performed by changing parameter values as used for the base-case analysis. The following parameters were changed in order to estimate their impact on the outcomes:
1. Discount rates are set at 3% in the base-case analysis. In one-way sensitivity analyses, results are presented when changing the discount rates to either 4% for both costs and effects or to 1.5% for both costs and effects.
2. One-way sensitivity analysis was performed with respect to impact of alcohol consumption on both direct and indirect productivity. In the base-case, such productivity losses related to alcohol consumption were included. In our calculations, we had to rely on foreign data on the relationship between alcohol use and productivity. However, Dutch data from the Nemesis population study (de Graaf et al., 2011) show a reverse relationship between alcohol abuse (not alcohol dependence) and productivity, implying a higher productivity in people with
a higher level of alcohol consumption. Such a relationship is most likely a result of correlation, rather than causation, and unmeasured confounders may be important to explain this finding. Given the uncertainty in our estimate of productivity, we performed a one-way sensitivity analysis in a situation where a link between alcohol consumption and productivity is assumed to be absent.
3. For calculations involving the monetary value of Quality Adjusted Life Years, we used an estimate of € 50,000 in base-case analyses, following guidelines for SCBA from SEO
(Koopmans, 2016b). SEO recommends to vary this value to € 100,000 per QALY in sensitivity analyses. This has been done in a sensitivity analysis.
4. A final set of sensitivity analyses concerns the impact on demand as a consequence of policy measures. In the base-case analysis, we used a point estimate from Wagenaar et al (Wagenaar et al., 2009). In sensitivity analyses, we varied the impact on demand by using higher and lower price
elasticiticities to reflect more impact on consumption (higher price elasticity) or less effect on consumption (lower price elasticity). These lower and higher elasticities were also taken from the same review of Wagenaar.