Potential measures against
microplastic emissions to
water
RIVM Report 2017-0193
A.J. Verschoor | E. de Valk
Potential measures against
microplastic emissions to water
Colophon
© RIVM 2018
Parts of this publication may be reproduced, provided acknowledgement is given to: National Institute for Public Health and the Environment, along with the title and year of publication.
DOI 10.21945/RIVM-2017-0193 A.J. Verschoor (author), RIVM E. de Valk (author), RIVM Contact:
Anja Verschoor
Centre for Safety of Substances and Products anja.verschoor@rivm.nl
This investigation has been performed by order and for the account of Ministry of Infrastructure and Water Management, within the framework of the Circular economy project M/250051.
This is a publication of:
National Institute for Public Health and the Environment
P.O. Box 1 | 3720 BA Bilthoven The Netherlands
Synopsis
Potential measures against microplastic emissions to water
Microplastics are plastic particles that are smaller than 5 millimetres; through the use of plastic or rubber products these microplastics can end up in the environment (surface water, soil, and air). The uncertainty about the effect of microplastics for humans and ecosystems is still large. Therefore, precautionary measures are considered to reduce the emission of microplastics. RIVM has taken stock of the advantages and disadvantages of potential measures. This study focusses on three sources: abrasion of tyres (the biggest source) and paint, and microplastics added to abrasive cleaning agents (a minor source). It is difficult to devise effective and feasible measures that significantly reduce such emissions. This is because abrasion cannot be completely prevented. A car tyre must have a short braking distance, and this is not possible without abrasion of the tyres. This example also illustrates how producers are confronted with many and often contradictory
requirements in the area of effectiveness, safety, and environmental impact. In addition, influencing consumer behaviour is possible only to a limited degree. For example, abrasion of car tyres can be reduced by ensuring that the tyre pressure is maintained at the appropriate level. However, many drivers do not ensure that this is the case.
Preventive measures in particular would seem to be effective in reducing the emission of tyre wear particles. Such measures could include
introduction of information provided to consumers about the
susceptibility to abrasion of different types of tyres. Measures aimed at optimising tyre pressure, such as tyre pressure monitoring systems, can also significantly reduce emissions. Whether or not these measures are cost-effective will depend on how they are implemented. For example, they can be supported by legal regulations, encouraged via financial rewards, or brought to the attention of the public via an information campaign.
Keywords: microplastic, tyre abrasion, paint, abrasive cleaning agents, reduction potential, measures, feasibility, multicriteria.
Publiekssamenvatting
Potentiële maatregelen tegen microplastic emissies naar water
Microplastics zijn plastic deeltjes die kleiner zijn dan 5 millimeter; deze kunnen door het gebruik van producten van plastic of rubber in het milieu terechtkomen (oppervlaktewater, bodem en lucht). Er zijn nog veel onzekerheden over de effecten van microplastics voor mens en milieu. Daarom worden uit voorzorg maatregelen ontwikkeld die de uitstoot van microplastics kunnen verminderen. Het RIVM heeft de voor- en nadelen van mogelijke maatregelen op een rij gezet. Deze studie richt zich op bandenslijtage (een grote bron), verfdeeltjes en
microplastics in schurende reinigingsmiddelen (een kleine bron). Het is moeilijk om effectieve en haalbare maatregelen te bedenken die de uitstoot aanzienlijk verminderen. Dit komt onder andere omdat slijtage niet volledig te voorkomen is. Een autoband moet een korte remweg hebben, wat niet kan zonder dat de banden slijten. Dit
voorbeeld illustreert ook hoe producenten worden geconfronteerd met, soms tegenstrijdige, eisen op het gebied van werkzaamheid, milieu en veiligheid. Verder is gedragsverandering bij consumenten maar in beperkte mate te beïnvloeden. Zo slijten autobanden minder als de bandenspanning goed is.
Vooral preventieve maatregelen lijken effectief om de uitstoot van slijtagedeeltjes te verminderen. Een voorbeeld is om de
informatievoorziening over de slijtagegevoeligheid van verschillende soorten banden te verbeteren. Ook maatregelen die de bandenspanning optimaliseren, zoals controlesystemen, kunnen de uitstoot sterk
verminderen. Of deze maatregelen kosteneffectief zijn, zal afhangen van de manier waarop deze worden geïmplementeerd. Ze kunnen
bijvoorbeeld worden ondersteund door een wettelijke regeling,
gestimuleerd worden door een financiële prikkel of onder de aandacht gebracht worden door een voorlichtingscampagne.
Kernwoorden: microplastic, bandenslijtage, verf, schurende
reinigingsmiddelen, reductiepotentieel, maatregelen, haalbaarheid, multicriteria.
Contents
Summary — 9
1 Introduction — 11
1.1 Background — 11 1.2 Goal — 12
2 Emissions and environmental impact in the absence of measures — 15
2.1 Tyre wear particles — 16 2.2 Paint particles — 17
2.3 Abrasive cleaning agents — 18
3 Potential measures — 19
4 Assessment framework — 21
4.1 Assessment criteria — 21
4.2 Scoring and rating method — 22
4.3 Uncertainties in the effectiveness of measures — 23
5 Results and discussion — 25
6 References — 29
Appendix 1 Organisations consulted — 31
Appendix 2 Potential measures against emissions from tyre abrasion — 32
Calculation method for reduction potential — 32 T1 - Legal threshold value for tyre abrasion — 38 T2 - Tyre label — 38
T3 - Reducing abrasion factor of road surface — 39 T4 - Sustainability tool for road surface — 40
T5 - Street cleaning campaigns in the urban areas — 41 T6 - Summer and winter tyres — 43
T7 - Tyre pressure — 44 T8 - Wheel alignment — 46 T9 - Maximum speed limit — 49 T10 - Kilometre tax — 49
Appendix 3 Potential measures against emissions of paint particles — 51
P1 - Subsidies for research into degradation of paint — 52 P2 - Legally required guarantee period for paintwork — 52
P3 - Raising public awareness with regard to rinsing of brushes — 53 P4 - Regulations for replacing older sanding machines — 53
P5 - Covenant on residual emissions at shipyards — 54
P6 - Reduction of paint emissions from recreational vessels — 54
Appendix 4 Measure in relation to abrasive cleaning agents — 56
Appendix 5 MCA scoring method — 57
Appendix 6 MCA scores for ‘environment & safety’ and ‘feasibility’ — 59
Summary
At the request of the Ministry of Infrastructure and Water Management, RIVM has prioritised potential measures for the reduction of microplastic emissions into water on the basis of a transparent assessment method. The Ministry aims to have detailed cost-effectiveness analyses (CEA) carried out for some of these measures. This report is intended to facilitate the selection of measures that will be subjected to such a CEA. The measures involve the following emission sources: tyre and paint abrasion, and microbeads in abrasive cleaning agents. On the basis of a earlier ‘quick scan’ by RIVM , these sources were selected by the
Ministry of Infrastructure and Water Management after a discussion in Parliament(Ministerie van Infrastructuur en Milieu 2016).
Abrasion of tyres and paint contribute significantly to the emission of microplastic particles into the soil, water, and air. Within the OSPAR framework, it was estimated that, after plastic litter, tyre abrasion is one of the biggest sources of microplastic emissions to water, followed by paint abrasion. Abrasive cleaning agents contribute much less (<0.1%). Based on the precautionary principle and the ambition to realise a circular economy, organisations in Europe are involved in formulating measures to reduce the emission of microplastics. This ambition is also shared by the Netherlands.
RIVM has described 17 measures, 10 of which are intended to reduce tyre abrasion, 6 to reduce the dispersion of paint particles, and 1 to reduce microbeads in abrasive cleaning agents.
In this report, the reduction potential of the various measures is estimated, in other words the potential reduction in the quantity of microplastics released in tonnes per year. To do so, it was necessary to make assumptions about the effectiveness of various measures, because limited information was available. As a consequence, the estimated reduction potential is associated with a significant level of uncertainty, which can only be reduced via specific measurements. The estimated reduction potentials should therefore be interpreted as indicative values, that point out and rank opportunities for the reduction of microplastic emissions.
Measures aimed at reducing microplastic emissions caused by abrasion of tyres and paint are not simple. Most measures to prevent the
formation of microplastic particles are difficult to realise, although not impossible, for several reasons. Firstly, the formation of such particles is inherent to the use of the products in question. Secondly, producers of such products are already having to deal with a large number of, often contradictory, requirements with regard to effectiveness and
environmental and safety issues. Finally, consumer behaviour can be influenced only to a limited degree. Measures targeting tyre abrasion show the highest reduction potential. Preventive measures in particular are effective when it comes to reducing the emissions of abrasion particles, for example setting requirements with which tyres must comply in terms of susceptibility to abrasion, as well as providing
product information in that regard. Measures aimed at the optimisation of tyre pressure can also make a potentially significant contribution to emission reduction. Whether or not such measures are also cost-effective will depend upon how such measures are implemented, for example supported by legal regulations, with encouragement from financial incentives, or by focusing public attention on the topic at hand via an information campaign. Measures aimed at reducing the dispersion of paint particles have received less attention, although various
approaches were raised that need further discussion and development in collaboration with stakeholders. A legal ban of microbeads in abrasive cleaning agents can only be taken within a European framework, but such measures contribute relatively little to reducing the overall emission of microplastics into water, because it is only a small source. During workshops held with stakeholders, policymakers, and NGOs, it became clear that, in addition to the reduction potential, other issues such as practical feasibility and favourable or unfavourable side-effects for the environment and safety must also be taken into account. For example, what effects will the measures have on the reduction of energy consumption and the emission of greenhouse gases or on other aspects such as air quality, safety issues, and noise pollution? This information was added in a qualitative way (in the form of associated scores) in order to facilitate policy discussions related to the advantages and disadvantages of potential measures.
1
Introduction
1.1 Background
Plastic and microplastic (plastic particles smaller than 5 mm) (Verschoor 2015) in the environment are receiving a great deal of public attention. Campaigns such as ‘Beat the microbead’, which targets microplastic in cosmetic products, and ‘The ocean cleanup’ project by Boyan Slat have focused the attention of broad sections of the public on the issue. If present production and consumption trends continue, the quantity of plastic in the environment will continue to increase. The amount of plastic that ends up in the sea each year all over the world is estimated at between 4.8 and 12.7 million tonnes (Jambeck et al. 2015). There are presently both national and international ambitions and agreements that aim to reduce the emission of plastic and microplastic into the
environment (EC 2013, EC 2015, EC 2017).
Figure 1 Estimated emissions of microplastics in Netherlands in tonnes/year. Derived from (OSPAR 2017). The columns show the uncertainty margins, and the white dot shows the average value.
Within the OSPAR framework, an inventory was made of a number of important sources of microplastics in the North-East Atlantic Ocean and the North Sea (OSPAR 2017). The conclusion was that, after plastic litter, tyre abrasion is one of the biggest sources of microplastic
emissions to water, followed by paint abrasion. Abrasive cleaning agents are only a minor source (<0.1%). Microplastics are difficult to measure in the environment and are often difficult to trace back to the original sources. Therefore, the emissions are calculated based on production and product consumption data in combination with dispersion models. The estimates have a significant margin for error as a result of
uncertainties and variations in product quality, consumer behaviour, geography, weather, infrastructure, and hydrology et cetera.
Nevertheless, the emission estimates provide an overall view of the
0 1 10 100 1,000 10,000 100,000
Land-based litter fragmentation Tyre wear Paint particles Preproduction pellets Cosmetic microbeads Laundry fibres Rubber infill and artificial turf fibres Abrasive cleaning agents
relative contributions from the various sources of microplastic emissions that can be used for prioritising sources and measures.
The presence of tyre particles in the environment is confirmed by measurements, but the number of studies focusing on their presence in the marine environment is limited (Wik et al. 2009, Norén 2011). Paint particles have been measured in freshwater as well as marine
environments (Norén 2011, Takahashi et al. 2012, Song et al. 2015, Imhof et al. 2016). Microbeads that could have originated from abrasive cleaning agents have not been found in the marine environment.
The effect of plastic particles on organisms and humans is not clear, and assessment of the environmental and human health risks is a complex matter (Koelmans et al. 2017). Until now, effects have not been demonstrated for realistic concentrations in the environment. It is not known what effect the presence of increasing amounts of microplastics will have on humans and the environment in the long term. Based on the precautionary principle and the ambition to realise a circular
economy, organisations in Europe are involved in formulating measures to reduce the emission of microplastics. This ambition is also shared by the Netherlands.
1.2 Goal
The goal of the report at hand is to select a number of measures for which, in a follow-up project, a cost-effectiveness analysis (CEA) has been carried out. The measures should lead to a reduction of
microplastic emissions to water originating from tyres, paint, and
abrasive cleaning agents. The report at hand was preceded by a process involving research and policy-making decisions as visualised in Figure 2.
Figure 2 Process of research and policy-making leading to the selection of emission-reducing measures for microplastics. This report deals with step 3 in the above process
Step 1: Tyre wear particles (TWP), paint particles, and abrasive cleaning agents were selected after an analysis and prioritisation of microplastic emissions (Verschoor et al. 2014). The prioritisation was based, among other factors, on the extent of the microplastic emissions, the ability to influence consumer actions, the perception of risk, and the possibility of reducing emissions via relevant measures. Other sources that were assigned a high priority included waste materials and litter, clothing fibres, cosmetics, and microplastic pellets. These sources were not included in the present study, as they are already receiving attention from governments, researchers, stakeholders, and NGOs, for example in projects targeting litter at beaches (Green deal Schone Stranden), and in rivers (Aanpak Schone Maas), shipping waste (Green deal
Scheepsafvalketen), fishing nets (project Vis Pluis Vrij), laundry fibers (Mermaids-project), ballons (www.dieballongaatnietop.nl) and
microbeads in cosmetics (Beat the microbead Campaign).
Step 2: In 2016, RIVM carried out an in-depth study into the three selected sources of microplastics, namely tyres, paint, and abrasive cleaning agents (Verschoor et al. 2016). The goal of the study was to quantify the emissions and migration routes from these sources in the
RIVM report 2014-0110 :
Quick scan and prioritization of microplastic sources and emissions
RIVM report 2016-0026:
Emission of microplastics and potential mitigation measures. Abrasive cleaning agents, paints and tire
wear
RIVM report 2017-0139: Potential measures against microplastic
emissions to water
Arcadis 2018 : Cost-effectiveness of selected measures
Ministry of Infrastructure and Watermanagement: Selection of 3 sources: tyres, paint and
abrasive cleaning agents.
Ministry of Infrastructure and Watermanagement: Selection of measures for cost-effectiveness
analyses Government: Implementation yes/no Step 1 Step 2
Step 3
Step 4Netherlands and to determine how these emissions can be reduced.
The result was a long-list of approximately 40 possible solutions/approaches.
The above-mentioned RIVM report (Verschoor et al. 2016) served as the basis for further development of the proposed measures; a process in which representatives from the national government, civil society organisations, and sectoral organisations were consulted (see appendix 1). Within this context, the criteria were also discussed that should be considered of importance in comparing various measures. The
involvement of stakeholders does not by definition mean that they completely support the content of this memorandum. After participating in consultations, RIVM made its own independent choice with regard to the assessment method used for the various measures.
This RIVM advisory report for the Ministry of Infrastructure and Water Management prioritises potential measures on the basis of their reduction potential. In addition to cost-effectiveness, policy choices made for the implementation of specific measures aimed at reducing microplastic emissions also depend on other factors. These include synergy with other environmental goals, the need for international collaboration, the length of time required to achieve results, and
enforceability. This report also presents scores for these aspects, which can be taken into account by the Ministry in arriving at a decision.
Step 4: The cost-effectiveness of selected measures is a follow-up study by Arcadis; the results have been described in a separate report
2
Emissions and environmental impact in the absence of
measures
The RIVM report on the emissions of microplastics from tyres, paint, and abrasive cleaning agents estimated that tyre abrasion is the largest of these three sources of emissions [13]. Most of these emissions end up in the soil, whereas a small part is emitted directly to the surface water. Part of the microplastic emissions that end up in the sewer system will eventually also end up in surface water. Based on the information
available about the treatment yield of sewage treatment plants, overflow frequencies, and dry matter concentrations in sewage water and drains, we estimate that between 16% and 34% of the dry matter emissions discharged to the sewer system eventually end up in surface waters.1 In
Figure 3 we show the quantities that are discharged to the sewer system separately, as reducing the pollution load on the sewer system can be a criterion for assessing various measures.
Emission estimates are associated with uncertainties. The complex reality is simplified and represented by a mathematical model that estimates the formation and dispersion of particles. This model is based in part on measured input parameters and in part on assumptions. Existing mathematical models were used to estimate emissions insofar as possible, such as those developed by the National Pollutant Release and Transfer Register and the OECD Emission Scenario Documents. More information about the emission estimates can be found in the 2016 RIVM report [13]. The sections below briefly deal with the three
separate sources.
Figure 3 Origin and dispersion of microplastic emissions from tyres, paint, and abrasive cleaning agents (based on Verschoor et al. (2016)).
160% of rainwater discharge in urban areas flows into the sewer system, 72% of which is diverted to sewage treatment plants, 8% to drains, and 20% to overflows. Treatment yield = 50% to 90%. Emission to surface water via sewer system = 72% x (1 - treatment yield) + 20% (see [8, Verschoor et al, 2016])
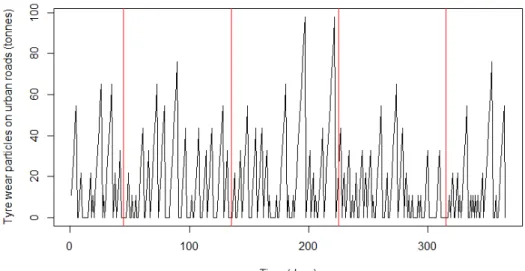
2.1 Tyre wear particles
The estimated total emission from tyre wear particles is 17,000 tonnes (Verschoor et al. 2016), of which approximately 10,000 tonnes ends up in the environment and 7000 tonnes ends up in porous asphalt (ZOAB). During the process of abrasion, part of the rubber becomes stuck to road surface particles. These heavy, combined abrasion particles, also referred to as Tyre and Roadwear Particles (TRWP), will therefore be deposited on the roadside surface or become incorporated into the porous asphalt. Another fraction of the particles produced consists of rather small free particles that can migrate into the environment via water. The origin of the particles and their dispersion in the environment is shown in Figure 4 and in Table 4 in Appendix 2. The graph shown on the left in Figure 4 makes it clear that most of the emissions originate from passenger cars (circa 60%). In addition, the largest quantity of tyre wear particles (circa 50%) is generated on motorways. This is because most kilometres are driven on motorways. However, a large part of the tyre wear particles generated on motorways are incorporated into porous asphalt. These particles are not free to migrate into the environment. Accordingly, the emission of particles into the environment from motorways is less than from country roads or from roads in urban areas (see graph on the right). The graph on the right in Figure 4 also makes it clear that most particles end up on or in the soil. In urban areas, a large part (circa 60%) ends up in the sewer system.
Figure 4 Formation and dispersion of tyre wear particles in the environment.2
2 The emissions resulting from tyre abrasion and their dispersion into different environmental compartments was calculated in accordance with the method used by the National Emission Registration. This method is based on an emission factor that depends upon the vehicle and type of road in question and on the distances driven (traffic statistics) for 9 different types of vehicles on 3 different road types. The dispersion of the emissions into the environment is based on dispersion coefficients such as those used in the National Pollutant Release and Transfer Register (PRTR). The dispersion coefficients of the PRTR are based in part on research, such as studies into the performance of sewage systems, and in part on expert judgement and model calculations.
In urban areas, between 16% and 34% of the emissions end up in surface water via the sewer system (see footnote on page 15). This amounts to between 600 and 1300 tonnes per year. The dispersion of tyre wear particles into the environment is based on generic dispersion coefficients. In reality, the dispersion into different environmental compartments will be subject to significant variation, depending upon local circumstances such as the nearby presence of ditches, slopes, soil type and presence of vegetation, and the amount and intensity of rainfall. In spite of local or temporal deviations in the dispersion coefficients, this is the best estimate available of the dispersion into water, air, and soil on average at the national level in the long term. The dispersion of tyre wear particles also means that chemical
compounds such as metals, polycyclic aromatic hydrocarbons (PACs), benzothiazoles, and aromatic amines end up in the environment. In 2007, for example, it was calculated that 40% of the zinc emissions into the soil and 27% of the sink emissions into water have their origin in traffic, in particular due to tyre abrasion (Mennen et al. 2010). Measures that reduce tyre abrasion provide an additional benefit by also reducing the emission of these compounds.
2.2 Paint particles
The total emission of microplastic paint particles is estimated at approximately 790 tonnes per year. Although the necessary measures have been taken at shipyards and marinas to reduce emissions, the remaining emission of such microplastic particles into water is estimated at 90 and 20 tonnes, respectively, per year. Depending upon the wind direction, approximately the same quantity ends up on the soil. In the building sector, the emissions end up primarily in the soil and the sewer system. Direct emissions into surface water are relatively minor. As is the case for tyre particles, between 16% and 34% of these emissions into the sewer system are estimated to end up in surface water (see footnote on page 15). The total emission into surface water resulting from paint used in the building sector is estimated at 10 to 30 tonnes per year in the do-it-yourself sector and 30 to 60 tonnes per year in the professional sector.
2.3 Abrasive cleaning agents
The quantity of microplastics present in abrasive cleaning agents in the Netherlands is minor. The Dutch Association of Soap Manufacturers states that its members, who supply approximately 90% of the Dutch market, do not use any microplastics in their products. It’s possible that microplastics are present in products that are supplied along with other products, for example with new kitchens, or products that can be
ordered via web shops. The emissions via these channels is estimated at between 2 and 3 tonnes per year (also see (Verschoor et al. 2016)). These emissions are discharged almost entirely into the sewer system.
3
Potential measures
The long-list of solutions/approaches contained in the RIVM
report ’Emission of microplastic and potential mitigation measures’ (Verschoor et al. 2016) has been refined and aggregated to provide a list of 17 potential reduction measures. Only measures in which the government can play a role have been included. Measures that are already being utilised by branch-specific organisations or in which normal market forces can lead to emission reductions have not been included in this report.
Potential measures against emissions and dispersion of tyre
abrasion (see Appendix 2):
T1. Legal threshold value for tyre abrasion T2. Tyre label with tyre abrasion indicator T3. Reducing abrasion factor of road surface T4. Sustainability tool for road surfaces T5. Street cleaning campaigns in urban areas T6. Prohibiting the use of winter tyres in summer T7. Tyre Pressure Monitoring System in cars
T8. Including wheel alignment in periodic vehicle inspections T9. Reducing maximum speed limits
T10. Kilometre price
Potential measures against emissions and dispersion of paint
particles (see Appendix 3):
P1. Raising public awareness with regard to rinsing of brushes P2. Regulations for replacing older sanding machines
P3. Covenant on residual emissions at shipyards P4. Subsidies for research into degradation of paint P5. Legally required guarantee period for paintwork
P6. Reduction of residual emissions at marinas and storage facilities
Potential measure targeting microplastic in abrasive cleaning
agents (see Appendix 4):
ACA European legislation prohibiting the use of microplastic in abrasive cleaning agents.
The measures are described in greater detail in Appendices 2, 3, and 4. There are 10 measures targeting tyre wear particles. These focus on the properties of the tyre, the road surface, the vehicle, the pressure of the tyre, wheel alignment, the use of summer tyres and winter tyres, driving behaviour, and vehicle characteristics. For paint, 6 measures have been worked out in more detail. These focus on paint innovation, durability of paintwork, the cleaning of brushes and rollers, equipment, and
shipyards. One measure has been formulated in relation to abrasive cleaning agents, namely prohibiting their use in Europe.
A general point of departure in formulating environmental policy is the principle of proportionality. At the European level, the tendency is to implement additional regulations at the product level and to increase the
responsibility of the producer. The concept of Extended Producer Responsibility (EPR) is set down in the European Waste Framework directive. Examples of EPR in the Netherlands include the requirement to pick up and recover plastic bottles and collection systems for products (waste disposal fee and disposal/collection facilities). The use of EPR as a measure in itself is not specifically described in this report, but some of the measures described in this report are of a technical nature and can serve as input for EPR.
In general, when formulating environmental policy, preference is given to preventive measures, i.e. source-based measures. If source-based measures are difficult to implement, then a measure implemented at the sewage treatment facility could be a cost-effective method to reduce some of the microplastic emissions into water. To avoid charging the public for these costs via taxation, a method would have to be found to charge the polluter for the extra costs.
During a stakeholders meeting on 13 September 2017 organised at the request of the European Commission, it became apparent that various numbers are in circulation regarding the percentage of microplastics removed from wastewater by wastewater treatment facilities in the EU (treatment yield). Eunomia Consultants carried out a literature study into treatment efficiency for microplastics and concluded that the removal rates vary between 53% and 84%. The sector itself (Eureau) claims that the yields vary between 80% and 99%. This includes unpublished data. The sector is making an effort to publish its own results.
In addition to the treatment technologies presently in use, there are also technologies available that are effective in removing microplastics in the nano-range. Eureau, the representative of the European companies active in the water and wastewater sector, refers to the following technologies in this regard: disc filtration, sand filtration, membrane microfiltration, and membrane bioreactors. These technologies are rarely used in Europe for the treatment of wastewater. The cost of setting up and using these methods is estimated at between €0.08 and €0.20 per cubic metre of water. An estimated 38 billion m³ of water is treated each year in Europe.
The conclusion of the workshop was that the first priority is to ensure that the European guideline on the treatment of urban wastewater (91/271/EEG) is fully implemented. After that, the infrastructure can be improved (i.e. upgrading sewer systems and wastewater treatment facilities to include secondary treatment). Finally, additional measures could be implemented at the wastewater treatment facilities. In view of the fact that secondary wastewater treatment is utilised throughout the Netherlands and the preference for implementing measures closer to the source, this report will not deal any further with the improvement of supplemental treatment technologies.
4
Assessment framework
4.1 Assessment criteria
At the request of the Ministry of Infrastructure and Water Management, RIVM held discussions with stakeholders (Appendix 1) for the purpose of working out the measures from a previous RIVM report [4] in more detail and for making a list of the criteria considered important when it comes to comparing and setting priorities for potential measures. During these discussions, a great many aspects were mentioned that can be divided into four groups. These groups are explained further below.
• Reduction potential: The reduction potential is an indication of
how much of a reduction of microplastic emissions (tonnes/year) can be achieved via a measure. The reduction potential depends on the technical nature of the measure and the target group at which the measure is aimed (for example a specific vehicle type, consumers, or the industry). As it turns out, the effectiveness of measures is difficult to describe in generic terms (Bemelmans-Videc et al. 2003). The degree to which the reduction potential is actually realised depends on a great many factors, including support level, price elasticity, and the manner and intensity of enforcement.
• Environment & safety: Are there any side effects associated
with the measure? Can the measure have a synergetic effect on other policy goals or does it actually conflict with them? Attention points include energy savings and reduction of CO2 emissions,
reduction of other prioritised substances, contribution of the measure to circularity, and its influence on safety and/or health aspects for human beings, including the inhalation of particulate matter, noise pollution, and road safety.
• Practical feasibility: The following aspects play a role in this
respect: 1) The playing field: Can the Netherlands introduce the measure autonomously at the national level or is a collective European approach needed? 2) The timeframe: How long will it take to implement the measure? 3) Compliance: The need and possibilities for enforcement. The criteria are explained further in Appendix 5. The technical feasibility is not included as a criterion but is viewed as a precondition. All the measures mentioned are considered to be technically feasible. The economic feasibility is dealt with under the aspect of cost effectiveness. The level of support is not taken into account here, as this can be influenced to a high degree. The goal of providing information to the public is to raise the level of awareness and support.
• Cost-effectiveness: This is an aspect that determines the
economic feasibility of a measure. The cost effectiveness of a selection of potential measures chosen by the Ministry of
Infrastructure and the Environment will be estimated in a follow-up study. The report at hand provides arguments on which this selection can be based.
4.2 Scoring and rating method
We used the reduction potential as the primary criterion for prioritising the measures. The aspects practical feasibility and side effects on
environment & safety are secondary in this memorandum. However,
these aspects are relevant for the final policy-based selection process, as is the cost effectiveness of a measure.
Reduction potential
The reduction potential is expressed as the reduction of microplastic emissions to water in tonnes per year. The reduction potential is based on statistics and technical information on paints and tyres. The reduction potential of the measures aimed at reducing tyre abrasion has been estimated for 9 vehicle types and 3 areas. With regard to paint, we differentiate between emissions from the maritime sector (marinas and shipyards) and the building sector (professional and do-it-yourself activities), as these are the sectors in which the most paint is used (Verschoor et al. 2016). The calculation of the reduction potential is explained per measure in Appendix 2 (tyre abrasion), Appendix 3 (paint particles), and Appendix 4 (abrasive cleaning agents).
Side-effects on environment & safety and practical feasibility
In order to get an idea of the side-effects for environment & safety and
practical feasibility, it was decided to use a Multi-Criteria Analysis (MCA)
(Huang et al. 2011). MCA is a research method that is used to make rational choices between options when several goals or criteria, each with a different character, are considered. In an MCA, these are
associated with a value judgement in order to ensure that qualitative as well as quantitative aspects are added together to provide a total. One of the strengths of this method is that each step and decision in the evaluation process can be made transparent and explicit. This is important as prioritisation of the measures on the basis of an MCA requires one to make value judgements.
Appendix 5 indicates which options are available for scoring a measure for each criterion. An initial scoring round has already taken place on the basis of literature, talks with branch associations and policymakers, and information available on the Internet. This was followed by a feedback round, and the scores were adjusted if new information became available.
Final assessment
The process of arriving at a list of ‘top 10’ measures consisted of two steps:
1. Per emission source, the measure with the highest reduction potential was chosen. This satisfies the wish of policymakers to select at least one measure for each source.
2. Next, an additional 7 measures were chosen from the remaining group on the basis of reduction potential.
A total score for the MCA was calculated in order to quickly obtain insight into promising and less promising measures. A low MC total score can then result in further discussions regarding the weak points and the desirability of implementing such a measure. The total MCA
score is a maximum of 10, whereby environment & safety and practical
feasibility each contribute a maximum of 5 points. 4.3 Uncertainties in the effectiveness of measures
The uncertainty in the estimated reduction potential of the measures is rather large in all cases. This can be the result of uncertainties regarding the influence of the measure on the emission factor or of uncertainty with regard to the fraction of the emission (derived from the consumers, roads, vehicles, ships, buildings, and paint) targeted by the measure. Behavioural effects in particular are very difficult to estimate. For example, to what extent will people change their behaviour as a result of financial incentives (penalties, kilometre tax) or as a result of being better informed (information, TPMS). This will depend in part on the size of the penalty or reward and the nature and intensity of the information campaign.
A number of measures focus (in part) on enlarging the knowledge base and raising the level of information and awareness. Various overview studies clearly demonstrate the influence of information campaigns on behaviour. The direct changes in behaviour range from a few percent to over 15% (Snyder et al. 2004, Abroms et al. 2008, Anker et al. 2016). A meta-analysis by Snyder et al. (2004) of health-related campaigns shows that, on average, 8% of the target group exhibited the desired change in behaviour as the result of a campaign. However, there are large differences between different campaigns. The effectiveness of the various campaigns investigated (primarily in the area of health)
correlates most strongly with the campaign topic. In addition, the
effectiveness depends upon the goal of the campaign. For compliance or enforcement campaigns, effectiveness was an average of 17%; for non-enforcement campaigns, it was 5%, for prevention campaigns it was 3%, and 3% for campaigns focused on ending undesirable behaviour. The average effectiveness of the Postbus 51 campaigns of the Dutch government was 2% (Renes et al. 2011).
Behavioural aspects were taken into account in calculating the uncertainty margins. This report therefore presents a best-case scenario, whereby the focus is primarily on revealing the technical potential of the measures and assuming that all consumers and/or stakeholders comply with the measure. In addition, there is also a more realistic scenario in which, depending upon the type of measure, the effectiveness is lower because consumers and/or stakeholders do not implement the measure. The effectiveness of voluntary measures is less than that of mandatory measures. Behavioural effects can be influenced by external factors, depending upon the amount of time and money invested in creating a support base. The ease with which the consumer can actually comply with the measure also influences behaviour. When relevant, other aspects that have a significant impact on the reduction potential were also taken into account in the uncertainty margin. In general, more information is available about tyre abrasion and the effect of measures targeting such abrasion than about paint particles. This is because a great deal of research has been carried out on the influence of various types of vehicles and roads on abrasion. Over the
last decades, all kinds of measures have also been evaluated aimed at improving road safety and reducing traffic congestion, fine particles, and CO2 emissions. These measures also often have an effect on tyre
abrasion. In addition, the tyre industry and the VACO trade association have made information and statistics available on tire pressure, summer and winter tyres, and wheel alignment.
The topic of ‘microplastics’ is a fairly new one for the paint sector. There is therefore less data available that can serve as a basis for estimating the reduction potential in this area. It is therefore difficult to quantify the influence of paint quality, substrate quality, and paint application method on the emission of paint particles. In describing the measures, the aim was to provide an initial global estimate of the emissions and the effectiveness of relevant measures.
Uncertainties also apply to the assessment of environment & safety and
practical feasibility. However, these are largely taken into account by
using low-medium-high categories with scores of 1-2-3. There are possibilities for quantifying the criteria instead of assigning scores. However, this would require a significant research effort, which is not considered necessary for these secondary assessment criteria at this stage.
5
Results and discussion
In this report, the reduction potential of measures is estimated, in other words the potential reduction in the quantity of microplastics released in tonnes per year. To do so, it was necessary to make assumptions about the effectiveness of various measures because limited information was available. As a consequence, the estimated reduction potential is
associated with a significant level of uncertainty. The reduction potential should be interpreted as an indication of where the biggest opportunities lie for the reduction of microplastic emissions. In order to reduce the uncertainties in the emission estimates and to check the effectiveness of the measures, we recommend carrying out system-focused
measurements that contribute to a better understanding of dispersion models for specific sources such as tyre and paint abrasion.
An overview of the estimated reduction potential of the measures and the multi-criteria score of side effects for environment & safety and
practical feasibility is shown in Table 1.
Table 1 Reduction potential and Multi Criteria (MC) score for the potential measures to reduce microplastic emissions.
No Description Reduction
potential water (tonnes/y)
MC Score
Tyres
T1 Legal threshold value for tyre abrasion 200 (60-400) 5.9 T2 Tyre label with tyre abrasion indicator 200 (6-400) 5.3 T7 TPMS (Tyre Pressure Monitoring Systems)
a. in all cars 100 (5-300) 9.1
b. in old cars 70 (5-100) 9.1
T8 Wheel alignment as part of periodic vehicle
inspections 50 (1-90) 9.7
T10 Kilometre price 10 (7-20) 7.7
T4 Sustainability tool for road surface 10 (<1-20) 7.2 T5 Street cleaning campaigns in the urban areas 10 (<1-20) 3.7 T9 Reducing maximum speed limits 9 (7-10) 8.2 T6 Banning the use of winter tyres in summer 9 (<1-20) 8.2 T3 Reducing abrasion factor of road surface 2 (<1-4) 6.1
Paint particles
P5 Covenant on residual emissions at shipyards 50 (9-90) 5.2 P1 Subsidies for research into degradation of paint 30 (1-60) 8.0 P4 Replacing older sanding machines 20 (2-30) 5.7 P6 Reduction of residual emissions of marinas and
storage facilities 10 (2-20) 5.7
P3 Campaign aimed at raising public awareness with
regard to rinsing of brushes 5 (<1-9) 6.0 P2 Legally required guarantee period for paintwork 4 (<1-8) 6.7
Abrasive cleaning agents
The measures are arranged per source going from the highest to the lowest reduction potential in water.
A total score for the MCA was calculated in order to quickly obtain insight into promising and less promising measures (see Appendix 6). In order to be able to evaluate the reduction potential and the MC scores for environment & safety and practical feasibility at the same time, they have been plotted against each other in figure 6. Each point corresponds to a measure.
Figure 6: The estimated reduction potential of each measure for emissions to water (directly and via the sewer system) is plotted against the associated MC score. Uncertainty margins and codes are presented in Table 1.
The measures presented in the upper right corner of Figure 6 have the highest reduction potential and perform the best in the categories
environment & safety and practical feasibility. In contrast, the measures
shown in the lower left corner have the lowest reduction potential and perform the worst in the categories environment & safety and practical
feasibility.
The measures with the highest reduction potential per product groups are:
• T1: Legal threshold value for tyre abrasion • P5: Covenant on residual emissions at shipyards • ACA: Banning products with microplastics
The measures with the highest reduction potential all target tyre
abrasion. Measures that target the susceptibility to abrasion of the tyre (T1 and T2) and tyre pressure (T7a and b) have the highest reduction potential.
As tyres contain other chemical substances besides rubber, reduced abrasion also results in fewer emissions of chemical substances such as polycyclic aromatic hydrocarbons, heavy metals, and phthalates. The measures therefore also contribute to realising other water quality goals, as a result of which their cost-effectiveness increases. The same also applies to paint, which contains biocides, pigments, and solvents. The measures with the highest reduction potential per source have a relatively low MC score. However, this does not mean that these measures are not feasible; with regard to certain aspects, they simply score less well than do other measures. These are aspects that can play a role in the political process. A low MC total score can then result in further discussions regarding the weak points and the desirability of implementing such a measure. The measures with the highest reduction potential for the three different sources (tyres, paint, and abrasive cleaning agents) are explained further below.
• The reason for the relatively low MC scores of measures T1 and T2, ‘Legal threshold value for tyre abrasion’ and ‘Introduction of tyre abrasion indicator on the tyre label’, is that they require international collaboration, which means that it will take quite some time to implement them. In addition, enforcement would be necessary but no consensus yet exists on how tyre abrasion can best be measured. The cost-effectiveness analysis must make it clear whether the reduction of microplastics achieved by the measure justifies the efforts that are required to implement the measure.
• The relatively low MC score for measure P5, ‘Strengthening compliance with environmental guidelines at shipyards and marinas’, is due to the fact that it does not yield any benefits in terms of energy and material consumption. In addition, it is not a preventive measure. The production of paint particles remains the same, but their dispersion is reduced. The measure scores well in terms of safety, as it results in less exposure by humans to particulate matter.
• The measure ACA, ‘Ban on microbeads in abrasive cleaning agents’, does not have a high reduction potential in absolute terms. The use of abrasive cleaning agents with plastic
microbeads is minimal in the Netherlands, and the reduction of the emission to water is estimated at 1 tonne/year. The measure also scores poorly in terms of practical feasibility, as it would require international agreement and an enforcement system. This measure was nevertheless selected, as it is in line with a source-based approach and because a CEA (Cost-Effectiveness Analysis) can support the political decision-making process for
implementing or not implementing this measure.
In order to make a good comparison of the cost-effectiveness of different measures, we recommend selecting several measures per
source with as high a reduction potential as possible and as high a multi-criteria score as possible. This is not possible for abrasive cleaning agents, as only one measure is described for this source. The cost-effectiveness of this measure can be compared only to the cost effectiveness of measures that target other sources.
6
References
Abroms, L. C. and E. W. Maibach (2008). "The Effectiveness of Mass Communication to Change Public Behavior." Annual Review of Public Health 29(1), p. 219-234.
Anker, A. E., et al. (2016). "Measuring the Effectiveness of Mass-Mediated Health Campaigns Through Meta-Analysis." Journal of Health Communication 21(4), p. 439-456.
Arcadis/SEO (2018). Verkenning economische effecten maatregelen bandenslijtage (microplastics). Rapport in opdracht van het Ministerie van Infrastructuur en Waterstaat, Report no. pages.
Bemelmans-Videc, M.-L., et al. (2003). "Carrots, sticks and sermons. Policy instruments and their evaluation." Comparative Policy Evaluation 7, p. 280.
Bruinsma, F., et al. (2002). Mobiliteit en beleid, Koninklijke van Gorcum. Davari, M. M., et al. (2017). "Energy efficiency analyses of a vehicle in
modal and transient driving cycles including longitudinal and vertical dynamics." Transportation Research Part D: Transport and
Environment 53, p. 263-275.
Deltares and TNO (2016). Emissieschattingen diffuse bronnen. Emissieregistratie. Bandenslijtage wegverkeer. versie mei 2016, Rijkswaterstaat-Waterdienst, 22 pages.
EC (2009). REGULATION (EC) No 661/2009 OF THE EUROPEAN
PARLIAMENT AND OF THE COUNCIL of 13 July 2009 concerning type-approval requirements for the general safety of motor vehicles, their trailers and systems, components and separate technical units intended therefor, 24 pages.
EC (2013). Groenboek over een Europese strategie voor kunststofafval in het milieu. Brussel, 24 pages.
EC (2015). Maak de cirkel rond - Een EU actieplan voor de circulaire economie, 24 pages.
EC (2017). Roadmap. Strategy on Plastics in a Circular Economy, 4 pages.
Gomes Correia, A., et al. (2016). "A review of sustainable approaches in transport infrastructure geotechnics." Transportation Geotechnics 7, p. 21-28.
Hooghwerff, J. and G. J. van Blokland (2007). Opwervelend stof van wegen. Congres: Geluid, trillingen en luchtkwaliteit, 7 pages. Huang, I. B., et al. (2011). "Multi-criteria decision analysis in
environmental sciences: Ten years of applications and trends." Science of The Total Environment 409(19), p. 3578-3594.
Idaea (2013). AIRUSE. The scientific basis of street cleaning activities as
road dust mitigation measure. Life 11. Action B7, Report no. LIFE11 ENV/ES/584, 31 pages.
Imhof, H. K., et al. (2016). "Pigments and plastic in limnetic
ecosystems: A qualitative and quantitative study on microparticles of different size classes." Water Research 98, p. 64-74.
Jambeck, J. R., et al. (2015). "Plastic waste inputs from land into the ocean." Science 347(6223), p. 768-771.
Koelmans, A. A., et al. (2017). "Risks of Plastic Debris: Unravelling Fact, Opinion, Perception, and Belief." Environmental Science & Technology
Lieftink, E. and H. de Man (2017). EmissieRegistratie Afvalwaterketen. Achtergrondrapport bij de in 2017 geactualiseerde factsheet
‘Effluenten RWZI’s, regenwaterriolen, niet aangesloten riolen, overstorten en IBA’s’. Report no. Deltares02_R_170615, 93 pages. Mennen, M. G., et al. (2010). Emissies en verspreiding van zware
metalen, Report no. 609100004, 120 pages.
Michelin (2010). "Rendement en veiligheid van banden. Presentatie MCTI 2010." p. 19.
Minister van Verkeer en Waterstaat (2009). " Vaststelling van de begrotingsstaten van het Ministerie van Verkeer en Waterstaat (XII) voor het jaar 2009." Kamerstuk Tweede kamer der Staten Generaal
31700( XII ).
Ministerie van Infrastructuur en Milieu (2016). "Landelijk afvalbeheerplan. Vergaderjaar 2015-2016, 30872, nr. 206." NHTSA. "Tire Rating Lookup, United States Department of
Transportation, National Highway Traffic Safety Administration, ." Retrieved 15 -7-2017, from https://www.safercar.gov/Vehicle-Shoppers/Tires-Rating.
Norén, F. (2011). Survey of microscopic anthropogenic particles in Skagerrak. Pilot study October-November 2010,
Havforskningsinstituttet, Report no. TA2779, 22 pages. OSPAR (2017). Assessment document of land-based inputs of
microplastics in the marine environment, Report no., 94 pages. Renes, J. J., et al. (2011). Vergroten effectiviteit campagnes, Dienst
Publiek en Communicatie - Ministerie van Algemene Zaken, Report no. EP030012, 71 pages.
Snyder, L. B., et al. (2004). "A Meta-Analysis of the Effect of Mediated Health Communication Campaigns on Behavior Change in the United States." Journal of Health Communication 9(sup1), p. 71-96.
Song, Y. K., et al. (2015). "Occurrence and Distribution of Microplastics in the Sea Surface Microlayer in Jinhae Bay, South Korea." Archives of Environmental Contamination and Toxicology 69(3), p. 279-287. Takahashi, C. K., et al. (2012). "Persistence and metallic composition of
paint particles in sediments from a tidal inlet." Marine Pollution Bulletin 64(1), p. 133-137.
van Blokland, G. J. and J. Hooghwerff (2009). Wegdekeffect op PM10. Invloed wegdek op stofemissie als gevolg van band- en
wegdekslijtage, Breijn, Report no. 09.03.1, 18 pages. Verschoor, A. (2015). Towards a definition of microplastics.
Considerations for the specification of physico-chemical properties, Report no. 2015-0116, 27 pages.
Verschoor, A., et al. (2016). Emission of microplastics and potential mitigation measures. Abrasive cleaning agents, paints and tire wear, RIVM/TNO, Report no. 2016-0026, 76 pages.
Verschoor, A., et al. (2014). Quick scan and prioritization of microplastic sources and emissions, RIVM National Institute for Public Health and the Environment, Report no. 20140110, 40 pages.
Wik, A. and G. Dave (2009). "Occurrence and effects of tire wear particles in the environment - A critical review and an initial risk assessment." Environmental pollution 157(1), p. 1-11.
ZTA Expertise and Macaro (2015). TPMS (Tyre pressure Monitoring System) in een wegtransport voertuig. Onderzoek rapport voor het Programma Beter Benutten / Intelligente transportsystemen, 41 pages.
Appendix 1 Organisations consulted
Ministry of Infrastructure and Water Management o Directorate for Sustainability, Environment, and
International policy
o Directorate for Climate, Air, and Noise o Directorate for Safety and Risks o Directorate for Water and Soil
o Directorate for Roads and Traffic safety
o Human Environment and Transport Inspectorate Directorate-General for Public Works and Water Management
[Rijkswaterstaat]
o Water Traffic and Environment o Directorate for Sea and Delta
o Department for Large Projects and Maintenance RecyBEM/NVR (Dutch Association of Rubber Manufacturers) Industry organisation for the tyre and wheel sector (VACO) Apollo Vredestein
BOVAG ANWB
Nederlandse Rubber en Kunststofindustrie (NRK) (Dutch Rubber and Plastics Industry)
Plastic Europe
Plastic Soup Foundation
Nederlandse Vereniging van Zeepfabrikanten (NVZ) (Dutch Association of Soap Manufacturers)
Vereniging Verf- en Drukinktfabrikanten (VVVF) (Association of Paint and Printing Ink Manufacturers)
OnderhoudNL (Maintenance NL)
Netherlands Maritime Technology (NMT)
Unie van Waterschappen (UVW) (Association of Water Boards) STOWA (Foundation for Applied Water Research)
Deltares TNO
Royal Haskoning/DHV Arcadis
Appendix 2 Potential measures against emissions from tyre
abrasion
Calculation method for reduction potential
This appendix describes potential measures that aim to reduce the emission or dispersion of tyre wear particles, namely:
T1. Legal threshold value for tyre abrasion T2. Tyre label with tyre abrasion indicator T3. Reducing abrasion factor of road surface T4. Sustainability tool for road surfaces T5. Street cleaning campaigns in urban areas T6. Prohibiting the use of winter tyres in summer T7. a. TPMS in all cars
b. TPMS in old cars
T8. Including wheel alignment in periodic vehicle inspections T9. Reducing maximum speed limits
T10. Kilometre price
The reduction potential is calculated as the difference between the emission if no measures are taken (see Table 2) and the emission after implementation of the measure (see formula 1). The emission of tyre wear particles is determined by the mileage, the abrasion factor, and the dispersion factor. Emission reduction measures can target one or more of these factors. The emission after implementation of the measure is calculated as follows:
Formula 1:
𝐸𝐸𝑀𝑀 = 𝐸𝐸0× 𝐹𝐹. 𝑎𝑎𝑎𝑎𝑎𝑎𝑎𝑎𝑎𝑎𝑎𝑎𝑎𝑎𝑎𝑎𝑎𝑎𝑎𝑎𝑎𝑎 × 𝐹𝐹. 𝑟𝑟𝑟𝑟𝑟𝑟𝑟𝑟𝑎𝑎𝑎𝑎𝑎𝑎𝑎𝑎𝑎𝑎 + 𝐸𝐸0× (1 − 𝐹𝐹. 𝑎𝑎𝑎𝑎𝑎𝑎𝑎𝑎𝑎𝑎𝑎𝑎𝑎𝑎𝑎𝑎𝑎𝑎𝑎𝑎𝑎𝑎𝑎𝑎)
in which:
𝐸𝐸𝑀𝑀 = emission (tonnes/year) after implementation of the measure
𝐸𝐸0 = emission before implementation of the measure (see Table 2)
𝐹𝐹. 𝑎𝑎𝑎𝑎𝑎𝑎𝑎𝑎𝑎𝑎𝑎𝑎𝑎𝑎𝑎𝑎𝑎𝑎𝑎𝑎𝑎𝑎 = fraction of the total emission that falls under the measure 𝐹𝐹. 𝑟𝑟𝑟𝑟𝑟𝑟𝑟𝑟𝑎𝑎𝑎𝑎𝑎𝑎𝑎𝑎𝑎𝑎 = relative reduction as a result of the measure
The formula simply expresses the fact that a part (𝐹𝐹. 𝑎𝑎𝑎𝑎𝑎𝑎𝑎𝑎𝑎𝑎𝑎𝑎𝑎𝑎𝑎𝑎𝑎𝑎𝑎𝑎𝑎𝑎) of the total emission (𝐸𝐸0) falls within the scope of the measure and can
therefore be reduced by a certain percentage (𝐹𝐹. 𝑟𝑟𝑟𝑟𝑟𝑟𝑟𝑟𝑎𝑎𝑎𝑎𝑎𝑎𝑎𝑎𝑎𝑎)). The remaining part (1 − 𝐹𝐹. 𝑎𝑎𝑎𝑎𝑎𝑎𝑎𝑎𝑎𝑎𝑎𝑎𝑎𝑎𝑎𝑎𝑎𝑎𝑎𝑎𝑎𝑎) of the total emission (𝐸𝐸0) remains
unchanged.
The calculation of the reduction potential of the measures is based on the following dispersion of emissions. See calculation method in Verschoor et al. (2016).
Table 2 Estimated emissions of tyre wear particles based on emission factors and mileages from the emission registration (Deltares et al. 2016) and scope of application of the measures T1 up to and including T10.
Emissions (tonnes/year) Scope of application of the measures (X = yes) Soil Air Water direct via sewer To water
system1 T1 T2 T3 T4 T5 T6 T7 T8 T9 T10 Urban areas Mopeds 8 1 0 3-7 Motorbikes 9 1 0 4-7 X X X Passenger cars 1050 138 0 428-882 X X X X X X Vans 159 21 0 65-134 X X X X X X Tractors 118 15 0 48-99 X X X Lorries 66 9 0 27-55 X X X Buses 54 7 0 22-46 X X X
Special vehicle (light) 1 0 0 0.6-1.2 X Special vehicle (heavy) 17 2 0 7-14 X
Rural areas Mopeds 5 0 1 0 X Motorbikes 35 2 4 0 X X X Passenger cars 2655 155 295 0 X X X X X X Vans 458 27 51 0 X X X X X X Tractors 218 13 24 0 X X X Lorries 302 18 34 0 X X X Buses 44 3 5 0 X X X
Special vehicle (light) 4 0 0 0 X Special vehicle (heavy) 32 2 4 0 X
Motorways Mopeds 0 0 0 0 Motorbikes 5 2 1 0 X X X X X X Passenger cars 449 236 54 0 X X X X X X X X X Vans 101 53 12 0 X X X X X X X X X Tractors 81 43 10 0 X X X X Lorries 162 85 19 0 X X X X Buses 2 1 0 0 X X X X
Special vehicle (light) 1 0 0 0 X X Special vehicle (heavy) 12 6 1 0
1 A refinement and improvement of the arguments upon which the dispersion of dry matter via the sewer system is based was published in the emission registration in 2017 (Lieftink et al. 2017). These data were not taken into account here, but the estimated emission is expected to fall within the range mentioned here. The above refinement applies only to emissions to the sewer system in urban areas.
𝐹𝐹. 𝑎𝑎𝑎𝑎𝑎𝑎𝑎𝑎𝑎𝑎𝑎𝑎𝑎𝑎𝑎𝑎𝑎𝑎𝑎𝑎𝑎𝑎 as well as 𝐹𝐹. 𝑟𝑟𝑟𝑟𝑟𝑟𝑟𝑟𝑎𝑎𝑎𝑎𝑎𝑎𝑎𝑎𝑎𝑎 consists of several factors. The relevant formulas are described below.
Formula 2:
𝐹𝐹. 𝑎𝑎𝑎𝑎𝑎𝑎𝑎𝑎𝑎𝑎𝑎𝑎𝑎𝑎𝑎𝑎𝑎𝑎𝑎𝑎𝑎𝑎 = 𝐹𝐹. 𝑎𝑎𝑎𝑎𝑟𝑟𝑡𝑡𝑟𝑟𝑎𝑎 × 𝐹𝐹. 𝑟𝑟𝑎𝑎𝑎𝑎𝑟𝑟 × 𝐹𝐹. 𝑣𝑣𝑟𝑟ℎ𝑎𝑎𝑎𝑎𝑎𝑎𝑟𝑟 × 𝐹𝐹𝐹𝐹𝑟𝑟ℎ𝑎𝑎𝑣𝑣𝑎𝑎𝑎𝑎𝑟𝑟𝑟𝑟
in which:
𝐹𝐹. 𝑎𝑎𝑎𝑎𝑟𝑟𝑡𝑡𝑟𝑟𝑎𝑎 = relative emission for the selected vehicles and road types (see crosses in Table 3) compared to the total emission
per environmental compartment (see Figure 7 and Table 3).
𝐹𝐹. 𝑟𝑟𝑎𝑎𝑎𝑎𝑟𝑟 = fraction of the selected roads on which the measure can have an effect
𝐹𝐹. 𝑣𝑣𝑟𝑟ℎ𝑎𝑎𝑎𝑎𝑎𝑎𝑟𝑟 = fraction of the selected vehicles on which the measure can
have an effect
𝐹𝐹. 𝐹𝐹𝑟𝑟ℎ𝑎𝑎𝑣𝑣𝑎𝑎𝑎𝑎𝑟𝑟r = fraction of or the degree to which the stakeholders will comply with the measure. This is actually the behavioural factor. As this factor is very variable and uncertain, we assume a best-case scenario for the prioritisation whereby F.stakeholder is 100%, unless specific information is available from comparable measures.
Formula 3:
𝐹𝐹. 𝑟𝑟𝑟𝑟𝑟𝑟𝑟𝑟𝑎𝑎𝑎𝑎𝑎𝑎𝑟𝑟 = 𝐹𝐹. 𝑎𝑎𝐹𝐹𝑟𝑟𝑎𝑎𝑎𝑎𝑎𝑎𝑎𝑎𝑎𝑎 × 𝐹𝐹. 𝑟𝑟𝑎𝑎𝑎𝑎𝑎𝑎𝑟𝑟𝑟𝑟𝑎𝑎𝑎𝑎𝑎𝑎𝑎𝑎 in which:
𝐹𝐹. 𝑎𝑎𝐹𝐹𝑟𝑟𝑎𝑎𝑎𝑎𝑎𝑎𝑎𝑎𝑎𝑎 = Relative abrasion after implementation of the measure (1 is no effect, <1 is reduction, >1 is increased abrasion) 𝐹𝐹. 𝑟𝑟𝑎𝑎𝑎𝑎𝑎𝑎𝑟𝑟𝑟𝑟𝑎𝑎𝑎𝑎𝑎𝑎𝑎𝑎 = Relative dispersion of tyre wear particles after
implementation of the measure
In Table 3 there is an overview of the input parameters for the calculation of the reduction potential. This appendix explains the
arguments underlying these factors for each measure. The results of the reduction calculations are summarised in Table 4.
The reduction potential of measures T3 and T4 is time-dependent. The maximum reduction potential of T3 and T4 is realised only after 50 years (lifespan of DAB (non-porous asphalt) roads before replacement). To compare the reduction potential of all the measures we therefore use the average annual reduction over the first 10 years. This would seem to be a reasonable period of time for assessing the benefit derived from policy measures.
Figure 7 Fraction of the emission of tyre wear particles in the environmental compartment concerned to which the measure applies (F.target).
Table 3 Input parameters for estimating the reduction potential of the measures. Explanation in appendix T1 up to and including T10.
Measure F.target F.road F.vehicle F.behaviour F.abrasion F.dispersion T1 Legal threshold value for tyre abrasion 0.98 1 1 0.99-1 0.8-0.95 1 T2 Tyre label with tyre abrasion indicator 0.98 1 1 0.1-1 0.8-0.95 1 T3 Reducing abrasion factor of road surface 0.51 0.01-0.11 1 0.99-1 1.3 0.5 T4 Sustainability tool for road surface 0.77 0.01-0.11 1 0.1-1 1.3 0.5 T5 Street cleaning campaigns in urban areas 0.23 1 1 0.1-1 1 0.98-0,998 T6 Banning the use of winter tyres in summer 0.75 1 0.02-0.066 0.99-1 0.8-0.95 1
T7a Direct TPMS in all cars 0.75 1 1 0.1-1 0.8-0.9 1
T7b Direct TPMS in old cars (built before 2014) 0.75 1 0.5 0.1-1 0.8-0.9 1 T8 Wheel alignment as part of periodic vehicle
inspections 0.75 1 0.22-0.44 0.1-1 0.85-0.95 1
T9 Reducing maximum speed limits 0.35 0.9 0.6 0.99-1 0.7-0.8 1
Page 37 of 60
Table 4 Estimated reduction potential of measures to prevent (dispersion of) tyre wear particles [tonnes/year]. Average over the first 10 years after implementation of the measure.
Minimum total soil air Water
direct effluent total
T1 800 300 40 30 30 50 T2 80 30 4 3 3 6 T3 -30 3 2 0 0 0 T4 -4 2 0 0 0 0 T5 0 0 0 0 0 0 T6 1 0 0 0 0 0 T7a 100 50 6 4 5 9 T7b 60 20 3 2 2 5 T8 10 5 1 0 1 1 T9 600 60 30 7 0 7 T10 600 60 30 7 0 7
Maximum total soil air water
direct effluent total
T1 3000 1000 200 100 200 300 T2 3000 1000 200 100 200 300 T3 -300 30 20 4 0 4 T4 -400 200 20 20 0 20 T5 0 30 4 0 20 20 T6 200 60 8 5 10 20 T7a 3000 1000 100 80 200 300 T7b 1000 500 60 40 100 100 T8 800 300 40 30 70 90 T9 900 90 50 10 0 10 T10 1000 100 70 20 0 20
Average Total Soil Air water
direct effluent total
T1 2000 700 100 60 100 200 T2 2000 600 90 50 100 200 T3 -200 20 9 2 0 2 T4 -200 90 10 10 0 10 T5 0 10 2 0 10 10 T6 80 30 4 2 6 9 T7a 1000 500 70 40 100 100 T7b 700 300 30 20 50 70 T8 400 200 20 10 30 50 T9 800 70 40 9 0 9 T10 1000 100 50 10 0 10
T1 - Legal threshold value for tyre abrasion
Description: Introduction of a legal threshold value for tyre abrasion.
F.target F.road F.vehicle F.behaviour F.abrasion F.dispersion
0.99 1 1 0.99-1 0.8-0.95 1
Minimising tyre abrasion has an immediate effect in reducing the quantity of microplastic emissions. However, modifying tyre
characteristics in order to reduce abrasion can result in reduced tyre performance with regard to the present indicators of the tyre label such as fuel consumption (rolling resistance), safety (grip), and noise
emission. It is assumed that the safety standards for tyres will be maintained. It is possible to introduce a legal threshold value for tyre abrasion whereby the tyres most susceptible to abrasion are phased out of production while maintaining acceptable characteristics for the tyre label. Experts from the tyre sector estimate that the wear characteristics of tyres with an EU label vary by 10% to 20% (personal
communication). An American database containing over 4000 tyres states a variation of roughly the same size for the ‘wear rating’ (mileage) characteristic (NHTSA). There is no European or Dutch database available with tyre wear characteristics. We therefore use the American database, which may include tyres not available on the European market, only for verification of the estimate provided by European experts. It should be noted in this regard, however, that mileage characteristics are not always the same as wear characteristics. As a good alternative may not always be available for all types of tyres, we assume that the reduction may be less than the 10% mentioned earlier. We therefore assume a reduction in the range of 5%-20% (F.abrasion = 0.8-0.95). The measure is assumed to be applicable to all vehicles except the special light and heavy vehicles (F.target = 0.99). Within this selection, the measure is applicable to all roads (F.road = 1) and all vehicles (F.vehicle = 1).
The tyre label is international, and an enforcement system will be needed.
An international consensus must be reached in order to ensure that a harmonised and validated method for measuring abrasion can be developed and applied.
T2 - Tyre label
Description: Raising the level of awareness under consumers by supplementing the EU tyre label with an indicator for abrasion.
F.target F.road F.vehicle F.behaviour (best-case)
F.abrasion F.dispersion
0.99 1 1 0.1-1 0.8-0.95 1
This measure is less binding and more voluntary than the measure involving a legal threshold value (see T1). The maximum reduction