AFRICAN FOOD SUPPLY IN
PERSPECTIVE
National-level food supply and land-use dynamics in
10 African countries under a growing demand for food
Lotte Huisman, Martijn Vink, Martha van Eerdt
African Food Supply in Perspective
© PBL Netherlands Environmental Assessment Agency The Hague, 2016
PBL publication number: 1724 Corresponding author martha.vaneerdt@pbl.nl Authors
Lotte Huisman, Martijn Vink and Martha van Eerdt Graphics
PBL Beeldredactie
Production coordination PBL Publishers
This publication can be downloaded from: www.pbl.nl/en. Parts of this publication may be reproduced, providing the source is stated, in the form: Huisman et al. (2016), African Food Supply in Perspective. PBL Netherlands Environmental Assessment Agency, The Hague. PBL Netherlands Environmental Assessment Agency is the national institute for strategic policy analysis in the fields of the environment, nature and spatial planning. We contribute to improving the quality of political and administrative decision-making by conducting outlook studies, analyses and evaluations in which an integrated approach is considered paramount. Policy relevance is the prime concern in all of our studies. We conduct solicited and
Inhoud
SUMMARY
4
1
INTRODUCTION
6
1.1 Problem statement 6
1.2 Aim and scope of the report 8
1.3 Structure of the report 9
2
THEORIES OF LAND-USE DYNAMICS
10
2.1 Different scales – different effects 10
2.2 Population pressure and land-use dynamics 11
2.3 The role of institutions 12
2.4 An empirical basis for theories of land-use change 13
2.5 Land use in Sub-Saharan Africa 14
2.6 ‘Sometimes-true theories’ 14
3
LAND USE AND FOOD SUPPLY DYNAMICS; AN EMPIRICAL
APPROACH
16
3.1 The relationship between land use and food supply in Sub-Saharan Africa 16
3.2 The relationship of expansion and land scarcity 25
4
DISCUSSION AND CONCLUSIONS
28
4.1 Looking beyond the average; glimmers of hope 28
4.2 African agriculture – a need for a revised policy perspective? 30
5
IMPLICATIONS FOR POLICY MAKERS
33
5.1 So, what’s new? 33
5.2 Perspectives for policy action 34
Summary
The findings of this study contradict the alarming image of Africa’s increasing dependence on imports and its large-scale agricultural expansion as the most important developments in relation to food supply. The analysis reveals glimmers of hope and points towards
opportunities for more country-specific approaches in international development cooperation to tackle food security and economic development. Maintaining soil fertility appears to be a universal issue of concern throughout most of the countries included in this study.
Triggered by the picture of Sub-Saharan Africa as a food-insecure continent not able to feed its own population without engaging in large-scale agricultural expansion and compromising biodiversity this study analysed country-specific trends in agricultural production and food supply. To identify the drivers of agricultural development and food supply, 10 countries were selected with contrasting social and agro-economic trajectories. The evaluated factors include the food-demand side (population, income and diet) as well as the supply side (trade, cropland expansion and agricultural intensification).
The analysis shows that average food supply per capita increased in Sub-Saharan Africa, despite high population growth between 1990 and 2010. In addition, Africa-wide average figures mask country-specific successes. Areas of productivity growth are often viewed as ‘pockets of success’ rather than indications of a trend break. In the countries studied, over 90% of food supply increases were caused by a growth in domestic production rather than by increases in food imports. Intensification and, more specifically, yield growth were the dominant factors in the growth in domestic production. Agricultural expansion only played a minor role in food supply increases. Whether these positive developments will continue into the future, however, remains uncertain. In most of Sub-Saharan Africa, nutrient availability is limiting crop yield growth. However, at locations where not all of the harvested nutrients are replaced, the sustainability of yield increases is threatened. In order to further close the crop yield gaps, it is still much more important to solve nutrient limitations than to address water shortages.
The picture of a continent with an immense potential for agricultural expansion needs nuancing, as well. The distribution of potentially available underutilised cropland (PAC) is highly skewed across the continent. Most of the PAC is located in large, sparsely populated countries, often characterised by weak governance and limited opportunities for economic development. There is also considerable inter-country variability in patterns of food supply, food production and land-use change that could not be explained by biophysical and demographic factors or socio-economic and institutional factors alone. Different countries appear to fit different development theories; some countries show similarities with classic Malthusian patterns of population growth leading to high expansion rates and no innovation, while other countries show more Boserupian trends where population growth coincides with intensification. We found no evidence of correlation between intensification and land sparing, suggesting that additional measures beyond agronomic interventions are paramount when facing the challenge of improving food supply in Sub-Saharan Africa while conserving nature. Local and international policy should therefore take a country’s context as a whole into account when facing such a challenge, instead of focusing on universal solutions. Hence, the quality of policies and interventions to achieve sustainable food production could be
improved by understanding national variability, avoidance of the average, understanding the institutional context and enhancement of the diagnostic capacity of governments.
1 Introduction
By 2050, the world population is estimated to reach 9.5 billion, 2.3 billion more than the current level. Almost half of this population growth is expected to occur in Sub-Saharan Africa (FAO, 2016). The question of how to feed the growing population in a sustainable manner is high on the international policy agenda. Hunger and malnutrition have proven to be persistent problems despite the fact that the global food production level would be sufficient to feed the world population (2851 kcal per person per day, at a roughly estimated daily minimum of 2100 kcal, according to the UN World Food Programme, (FAO, 2016; WFP, 2016). While the Millennium Development Goal (MDG) to halve the proportion of people suffering from hunger was reached in the developing world (United Nations, 2016), 795 million people were still undernourished in 2015 (FAO, 2016). Of these people, a
disproportionate 28% live in Sub-Saharan Africa, a region housing only 13% of the world’s current population (FAO, 2016). In line with these figures, the successor of MDG 2,
Sustainable Development Goal (SDG) 2 aims to end world hunger. At the same time, SDG 15 aims to halt biodiversity loss. In the light of the staggering population growth rates in many African countries, both SDGs touch upon a widely debated trade-off between increased agricultural production through expansion and the resulting loss of biodiversity (Tilman et al., 2011; Stevenson et al., 2013; Hertel et al., 2012; Tscharntke et al., 2012; Ellis et al., 2013; Foley et al., 2011; Lambin et al., 2001; Angelsen and Kaimowitz, 2001; and Chomitz et al., 2007).
1.1 Problem statement
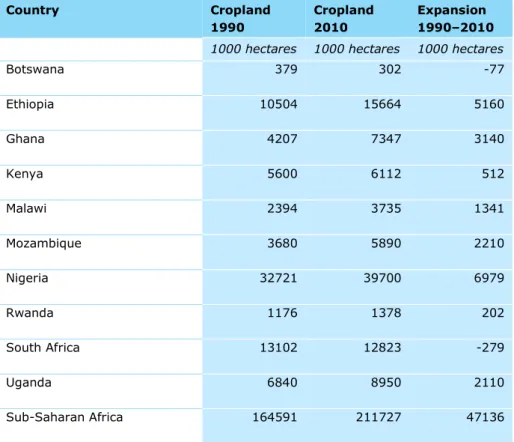
Over the past two decades, nature areas have been converted into cultivated land on a grand scale, with a total global cropland expansion of around 68 million hectares (more than 16 times the size of the Netherlands). Cropland expansion in Sub-Saharan Africa accounted for no less than 47 million hectares, around three quarters of the total (FAO, 2016) (Table 1.1). Agricultural expansion is viewed as a main cause of biodiversity loss. For Sub-Saharan Africa, half of the additional loss over the 2000–2030 period may be attributed to agriculture (Hilderink et al., 2012). A widely held view on the cause of Africa’s expected high level of expansion is that of large population growth combined with yields that lag behind those observed in other parts of the world (AUC and NEPAD, 2013, p. 17). While global yields have increased considerably during the second half of the 20th century, those in Africa have been lagging behind and have only begun to improve in recent years (Frankema, 2014;
InterAcadamy Council, 2004; Burch et al., 2007).
Apart from population growth, other developments such as high economic growth rates, rapid urbanisation and the rise of the middle class are expected to drive a strong increase in the demand for food and a related run on potentially suitable agricultural land (Hilderink et al., 2012). The issue of large-scale land acquisition, or ‘land grabbing’, by foreign investors has been raised by non-governmental organisations and researchers as another matter of concern (e.g. OXFAM, 2016; GRAIN, 2016), although the term conceals large differences in its origins, manifestation and impact of large-scale land acquisitions (Hall, 2011; Van Leeuwen et al., 2014; Mehta et al., 2012). In addition, increasing competition with non-food uses of agricultural land, such as for fibres and biofuels, could aggravate land scarcity for food production. Land availability, in terms of quantity, is not the only issue Sub-Saharan Africa faces with respect to the sustainability of its food production.
Table 1.1 Cropland expansion Country Cropland 1990 Cropland 2010 Expansion 1990–2010 1000 hectares 1000 hectares 1000 hectares
Botswana 379 302 -77 Ethiopia 10504 15664 5160 Ghana 4207 7347 3140 Kenya 5600 6112 512 Malawi 2394 3735 1341 Mozambique 3680 5890 2210 Nigeria 32721 39700 6979 Rwanda 1176 1378 202 South Africa 13102 12823 -279 Uganda 6840 8950 2110 Sub-Saharan Africa 164591 211727 47136
Source: FAO (2016) FAOSTAT Land database 1) Data for Ethiopia from 1994 instead of 1990
The quality of agricultural land is also an issue for feeding a growing population. Soil erosion and intensification of farming systems without replenishment of nutrients (soil mining) result in land degradation and lead to increased pressure on the land available for food production (Place et al., 2013, Tittonell and Giller, 2013). Degraded soils also retain less water and, thus, increase the impact of climate-change-induced drought on crop production. The increasing scarcity of land suitable for agriculture is expected to cause rising land prices, which in turn will make it much harder for the poor to have access to land. This is especially relevant in Sub-Saharan Africa, where over half of the people depend on agriculture for their livelihoods (FAO, 2014).
In addition to issues of land quality, the availability of water resources is also important for food production. Most of the food in Sub-Saharan Africa comes from rain-fed agriculture, and in many areas, the amounts and timing of rainfall are uncertain. This uncertainty is
exacerbated by climate change in many regions.
As stated above domestic food production, foreign investments, non-food production purposes and the substitution of degraded land, all have a certain claim on land. And in addition, there is Sustainable Development Goal 15, which requires land for conservation of biodiversity. And although the general trends in land-use changes related to food production are known, to a certain extent, and countless case studies are described in the literature, the intermediate, national dynamics in Sub-Saharan Africa are not well understood – even though it is precisely the national level that is most relevant for national public policymaking. While the general trends show rapid growth in many areas – such as in agricultural
expansion, population, economy, and urbanisation – these developments vary greatly between and even within African countries. In addition, the high growth rates often mask the fact that the initial level of growth was very low. Moreover, Sub-Saharan Africa is a region of
high diversity and stark contrasts. It has the highest population growth rates, while being one of the least populated regions of the world. Despite some of its staggering economic growth rates it houses most of the world’s poor and receives the greatest share of Official Development Assistance (ODA).
1.2 Aim and scope of the report
For decades, international organisations, scientists and donor countries have investigated agricultural development in relation to poverty, hunger and more recently loss of biodiversity (IAC, 2004; Burch et al., 2007). The ongoing attention for African agriculture in relation to food, land and biodiversity has yielded a vast amount of reports about the African continent and studies focused on agricultural production at community or plot level. Most of these studies present clear storylines, stressing how African agriculture needs a ‘green revolution’. The analyses appear to have less attention for the large differences between trends in food supply on national levels. Therefore, for this report, we chose to focus on food supply and related land dynamics, on a national level. Our analysis was designed to study national trends, in order to go beyond general statements and average figures about continent-wide trends, although we realise that this still produces rather generic figures that ignore societal and regional inequalities in access to food, land, water and other means of production. General statements may encourage the commitment of donors to combat poverty and hunger, but are less important in the selection of development project proposals or choice of development cooperation partners. In addition, analysis of national level trends in food supply may shed light on differences in how African nations take part in the organisation of their national food supply. Because of the highly complex cause-and-effect relationships of national trends, our analysis did not enable us to explain these different trends in food supply or to identify the role of the various African nations and their policies and practices in these trends. Instead, our analysis should be seen as a first step in highlighting issues, relationships and possible causality, thus offering opportunities for practitioners to take a closer look and enable them to better assess the issues or relationships that affect food supply in more or less sustainable ways.
We conducted a literature study into the drivers of agricultural land-use change and food production increase, set against an empirical study of the trends and patterns in cropland change and food production in 10 Sub-Saharan African (SSA) countries. The insights derived from the analysis are intended to gain a better understanding of the relevance of the
theoretical underpinnings of the general thinking about sustainable agricultural development, to better inform policymakers about the consequences and trade-offs related to the various pathways of agricultural development, and to point to a broader pallet of policy options that better fit in with the diversity of national contexts. For our analysis, we qualitatively assessed mainstream theories about land-use change in relation to developments in food production, and quantitatively assessed land-use dynamics, developments in food supply and the implications of land dynamics for food supply and production in 10 SSA countries, over the 1990–2010 period. We based our analysis on state-of-the-art scientific, peer-reviewed literature and data from the UN Food and Agriculture Organisation.
We opted to focus on the national scale, in order to compare inter-country variability in trends. We investigated whether certain Sub-Saharan African countries managed to improve food security, more or less without being dependent on cropland expansion and/or food imports. To answer this question, we performed a historical analysis, guided by three sub-questions. First, we studied how the food supply had changed over the period under study, and put the developments in the context of the food-demand side (population, income, diet). Then, we analysed the proximate causes of these food supply developments, in terms of
trade and domestic production. Finally, we analysed the relationship between these
developments and their effect on land-use change, with a focus on cropland expansion and intensification.
The selected countries reflect a wide range of biophysical as well as socio-economic
conditions. We selected SSA countries, from low- to high-income economies (as defined by the World Bank, http://data.worldbank.org/about/country-and-lending-groups), as follows: Low-Income Countries (LIC), Lower Middle-Income Countries (LMIC), Upper Middle-Income Countries (UMIC) and High-Income Countries (HIC) (Figure 3.1). From each group, where possible, we selected at least one country with an above-average availability of cropland (arable land and permanent crops) and one with a below-average cropland availability (Figure 3.1, based on the 0.22 ha of cropland that is available per capita, when dividing the world’s cropland area over its population), taking into account data availability (e.g. for Burundi and Democratic Republic of the Congo (DRC), structural data on food supply were not available). Furthermore, we took each country’s share in the total Sub-Saharan
agricultural production into account, making sure to select some large producers as well as some smaller ones. This factor reflected both a country’s size and its focus on agriculture. Where possible, we selected countries that would be in partnership with the Dutch Ministry of Foreign Affairs, irrespective of whether this would be a development aid relationship
(Rwanda), a trade relationship (South Africa) or a transitional relationship (Ethiopia, Ghana, Kenya, Mozambique and Uganda). Together, the selected countries accounted for 54% of the Sub-Saharan African population and 26% of the region’s land surface.
1.3 Structure of the report
To provide a context for the analysis, the report first describes the prevalent theories about the drivers of agricultural expansion. The report shows how most prevalent theories point out how issues of population dynamics, poverty, hunger, land use and ecological quality are all highly interrelated; a change in one of these factors is likely to affect all others.
Subsequently, it presents an analysis of FAO data, showing country-specific trends in land use and food production. We found that the factors driving these issues were highly localised and variable, which made it difficult if not impossible for causal relationships to be inferred. Keeping these matters in mind, the discussion section provides an interpretation of the data, to infer several important signs/hypotheses that could be related back to the discussed theories of land-use change. Finally, this report describes the implications for policymakers. Conclusions are drawn about the significance of these insights, and a number of policy perspectives are derived for policymakers active in the field of international development.
2 Theories of land-use
dynamics
Many researchers and policymakers consider the improvement in yields in underperforming regions, such as Sub-Saharan Africa, through effective technology transfer from rich nations as the key to sustainable food production in the future. It is argued that such a strategy would significantly reduce agricultural expansion, greenhouse gas emissions and nitrogen use, while meeting global food demands and improving socio-economic conditions (Tilman et al., 2011; Stevenson et al., 2013). However, intensifying agriculture on a large scale is easier said than done. The question arises why intensification has occurred in certain parts of the world, but not in others.
Moreover, there is no conclusive evidence of intensification automatically leading to more sustainable land use or a lower expansion rate, and some studies even show the opposite to be true, especially in Sub-Saharan Africa (Hertel et al., 2012; Tscharntke et al., 2012). Recent research suggests that the relationship between intensification and expansion is determined by local circumstances, such as biophysical conditions and market integration (Hertel et al., 2014). In addition, effects of globalisation have made the dynamics between intensification and expansion even more complex, in recent decades, with displacement of land use as an example of an indirect land-use-change effect that is related to globalisation (Meyfroidt et al., 2013). The displacement effect occurs when countries that previously produced agricultural products within national borders start importing them from elsewhere; land may be spared within a certain country, but, from a global point of view, the land use was merely shifted to another location, leading to more pressure at that location. All in all, the true nature of the dynamics of expansion and intensification is not well understood. This section considers several theories that describe intensification-expansion dynamics and the potential mechanisms that cause either one or the other factor to be dominant in land use.
2.1 Different scales – different effects
The Borlaug hypothesis, named after the ‘father of the Green Revolution’, states that the only way to meet increased food demand without compromising natural vegetation and biodiversity is to increase crop yields. Its proponents claim that the Green Revolution in Asia – with its high yielding crop varieties combined with increased use of fertilisers, pesticides and irrigation – has not only been responsible for the success of agricultural development, but also for preserving millions of hectares of natural vegetation (Stevenson et al., 2013). The land- and biodiversity-sparing effect of the Green Revolution might hold true on a macro level, but, on a smaller scale, other dynamics may predominate. The so-called Jevons effect offers a plausible argument against the Borlaug perspective. In agriculture, this effect occurs when larger crop yields lead to higher profitability, thus creating an incentive to take more rather than less land into cultivation. This is especially relevant at the forest frontier, in relatively small areas where the effect of yield increases on farm income is not counteracted by an output price decrease, because output prices are determined globally or regionally and
the area of yield increase is too small to affect price equilibration significantly (Angelsen and Kaimowitz, 2001; Hertel et al., 2012; Hertel et al., 2014).
Macro trends in expansion–intensification dynamics ultimately depend on the cumulative effect of decisions made on farm level, which, in turn, are determined by the biophysical, institutional and cultural context in which farms operate. It depends on whether farmers produce for themselves or for the market or both? For subsistence farmers who operates in an imperfect market, it is conceivable that increased crop yields will indeed lead to less expansion, because less land is needed to feed the family. However, for a profit-oriented farm that is fully integrated into the market, the decision to expand when profitability
increases seems very reasonable. Of course, the type of farm does not have to be one or the other. Most smallholders in tropical countries operate at a level somewhere between
subsistence farming and fully market-oriented production (FAO, 2014). At the same time, intermediate and large-scale operations that produce commodities for an international market are on the rise (Meyfroidt et al., 2014; DeFries et al., 2010). The resulting higher level dynamics depend on the overall structure of the agricultural sector, which is often highly complex and difficult to unravel.
Focused on an intermediate scale (both in space and time), the so-called Environmental Kuznets Curve offers yet another hypothesis on the relationship between development, food security and sustainable production. It is widely agreed that agricultural improvements positively affect economic development (Burch et al., 2007). This, in turn, could lead to improvements in resource management and decreased pressure on the natural environment. Therefore, although agricultural development initially may lead to environmental
degradation, subsequent economic growth will stimulate solutions to this problem – a phenomenon that can be observed in many of the rich countries in the late 20th and early 21st century, some of which are undergoing a so-called forest transition (Angelsen and Kaimowitz, 2001; Angelsen, 2007). However, any indirect impact of land-use effects
mediated by globalised trade, such as the displacement effect described above, are not taken into account in this hypothesis.
2.2 Population pressure and land-use dynamics
Several theories focus on the relationship between population pressure, agricultural expansion and intensification. Intuitively, one would expect the amount of land under cultivation to increase under an increasing population density. However, the relationship between population and the area of land under cultivation appears to be non-linear. While the global demand for food has been growing rapidly, the growth in the demand for land, per capita, needed to produce food is decreasing due to higher crop yields per hectare ofcultivated land (Ellis et al., 2013; Foley et al., 2011). The precise relationship between population pressure and agricultural development is still debated, and several contradicting theories exist.
At the end of the 18th century, Malthus posed that the inelasticity of agricultural production necessarily limits population growth. By means of ‘misery and vice’, population numbers would be kept at the limits of subsistence (Malthus, 1798). The population collapse Malthus foresaw never occurred on a large scale, and the world population kept increasing. However, in the decades following WWII, when population growth rates were exceptionally high and the environment became a concern, Malthus’ ideas experienced a revival, with Ehrlich’s
Ester Boserup countered this wave of Neo-Malthusianism in her 1965 book The Conditions of
Agricultural Growth. Her theory reverses Malthus’ line of causality, in stating that it is not
agricultural productivity that caps population growth, but that the latter factor drives increases in productivity through agricultural intensification. According to Boserup,
intensification only occurs when land is so scarce that it is the only option to increase output, as the intensification measures in her theory are all labour-intensive. She describes a
development from labour- and land-extensive systems (e.g. shifting cultivation) to ever-shorter fallow periods and finally to multi-cropping systems. Farmers will only move towards a more intensive system of cultivation when land is so scarce that it is absolutely necessary. Parallel to Boserup’s work, the micro-economic model of the Russian economist A.V.
Chayanov also describes the interaction between demographics, labour productivity and intensification. In his theory, the ‘drudgery adverse’ farmer seeks for a way to maximise income while minimising the work. This theory assumes absence of a labour market (so all work has to come from family members) and flexibility in access to land. The consumer– worker ratio of a household or community effectively determines agricultural productivity. Under this theory, increases in family size lead to more land being taken into cultivation.
2.3 The role of institutions
The induced innovation theory by Hayami and Ruttan (1985) further examines and formalises the relationship between population and land use, in terms of factors of production. This theory states that the emergence of relative resource scarcities causes changes in relative factor prices. These price changes induce innovations aimed at saving on the most expensive resource (Ellis, 1993; Turner et al., 1996). Thus, in areas where labour is the most expensive resource, innovations will save labour, whereas in countries where land is the scarcest factor of production, innovations tend to save land. From this, Boserup’s conclusions follow, which say that when land is abundant and labour is scarce, shifting cultivation is a reasonable production strategy, but when labour becomes more easily available and land becomes scarcer due to population growth, farmers will look for ways to intensify. Hayami and Ruttan, in fact, argued that the Green Revolution was so successful in Asia because it came exactly at the moment that land became scarce relative to labour (Hayami and Ruttan, 1985; Otsuka and Place, 2013). While Boserup assumes a direct link between population pressure and intensification, the induced innovation theory recognises the importance of institutions; relative factor prices induce public and private research into resource-saving innovations and institutional arrangements enable farmers to influence research priorities. The theory does assume the existence of some basic institutions in which these innovations can be developed as well as a fairly well-functioning market, both of which may be absent or malfunctioning in many developing countries.
The importance of institutions also features prominently in more recent theories of land-use change. Lambin et al. (2001) argue that the assumption of straightforward relationships between population pressure, poverty, infrastructure and land-use-change dynamics offer an oversimplified picture and rarely contribute to a better understanding. Instead, expansion– intensification dynamics follow economic opportunities that are mediated by institutional factors and are increasingly influenced by global conditions (Lambin et al., 2001, Lambin and Meyfroidt, 2010; Meyfroidt et al., 2013). An example is the dynamics that Lambin and Meyfroidt (2010) describe as the globalisation pathway. This occurs when a developing economy becomes increasingly integrated in global markets. On the one hand, exports of forest and agricultural products increase, possibly leading to elevated pressures on local land (i.e. the displacement effect). At the same time, growing global tourism leads to an influx of people with different ideologies about the way nature should be. Increased tourism combined
with private investment leads to a growing focus on forest conservation, for example on private land, mediated by international NGOs, multilateral conventions and aid agencies. At the same time, migration patterns shift from an orientation on nearby cities to more distant, economically advanced countries. The shift away from agricultural activities and the
increased amount in remittances sent back home by these migrants further add to a decrease in the pressure on local land (Lambin and Meyfroidt, 2010). The resulting net effects from this complex interplay of dynamics are difficult to predict and indeed much less straightforward than any of the simpler theories described above.
The authors of a 2005 meta-analysis of 100 studies on agricultural intensification in the tropics also found this complexity (Keys et al., 2005). Some local cases follow a Malthusian pattern while others show evidence of Boserupian land-use change dynamics. According to the authors, even the notion of population growth itself is too simplistic, as seasonal, generational and permanent migration affect land use in a highly dynamic fashion. In some cases, population pressure was a significant factor, while in others, different institutional factors (e.g. markets, government programmes, structural adjustment policies) outweighed this significance of population pressure. In addition, local and/or urban markets were found to have a different effect on land use than global markets. Nearby urban markets appear to increase the focus on intensification in high-value horticulture and fruit production, while international markets mainly stimulate specific arboricultural products, such as coffee, tea, cocoa and vanilla. There is also a relationship between market types and land tenure, since cultivating trees that take several years to bear fruits implies a certain degree of tenure security, revealing once again the interdependence of the factors of the intensification– expansion dynamics and the heavy dependence on context. A pattern that did emerge was the overall importance of institutions for intensification, leading the authors to conclude that future studies should take into account a broad range of institutional factors, including property regimes and government and NGO programmes.
However, the interactions between institutions, governance and policy measures and their outcomes make it very difficult to distinguish cause and effect, which means that results should be interpreted with caution (Lambin et al., 2014). In addition to stressing the importance of institutions, Keys and McConnell, as well as many other researchers, call for standardisation of research protocols so that individual cases can be compared and
conclusions can be scaled. One important gap in the data, emphasised by Keys and
McConnell, is the absence of reliable and comparable data on the biophysical aspects of land-use systems, which makes it very hard to set a baseline for analysis (Keys et al., 2005).
2.4 An empirical basis for theories of land-use change
The emerging interdisciplinary field of land change science (LCS) addresses the issues of integration and generalisation in its search for a more general theory on land-use change that is founded on empirical data (Turner et al., 2007; Verburg et al., 2013). One of the great challenges faced in this field of research is that most of the scientific repertoire consists of individual case studies that differ widely in scope, scale, aim and method. Integration of quantitative and qualitative analyses and explicit geographic location are important issues for synthesis of land-use change studies, and a lack of biophysical data is a shared concern. A first step to overcome these challenges involves systematic identification of ‘a robust array ofpossible cause–effect relationships involving the land change phenomenon of interest and providing operational definitions for each variable’, thus setting a common standard for
researchers involved in this area (Magliocca et al., 2015). A starting point includes the rigorous coding of existing meta-studies according to method (e.g. literature review, remote sensing analysis), goal (e.g. theory formation, modelling, policy-orientated), topic (e.g.
agricultural expansion, land degradation), geographic extent (e.g. global versus regional), discipline (e.g. agricultural science, forestry science, development studies) and explanatory focus (causal, consequential or a combination of both) to create a systematic knowledge base (Magliocca et al., 2015). The GLOBE (Global Collaboration Engine) platform offers an online environment that facilitates building such a knowledge base and offers tools to integrate local studies with global data (GLOBE, 2016). The increased focus on integration and standardisation is relatively recent, ongoing and unfinished, but it reflects a widely shared need for comparability and scaling in the scientific community.
2.5 Land use in Sub-Saharan Africa
Several studies specifically focused on Sub-Saharan Africa reveal some clues about the potential roles of biophysical circumstances (e.g. land scarcity, fertility constraints) and local institutions (e.g. land tenure, market integration) as drivers of land-use change in the SSA region. Otsuka and Place found that landownership rights and tenure security significantly impact agricultural expansion rates as well as investments in the sustainable use of land already under cultivation. In their results, uncultivated land that is not individually owned or institutionally managed often counts as a free-for-all, leading to agricultural expansion, deforestation and the disappearance of communal grazing lands (Otsuka and Place, 2001; Otsuka and Place, 2013). Secure, individual tenure rights cause farmers to invest in measures that will assure long-term usability of their land, such as tree planting and soil conservation, a phenomenon confirmed by several case studies (e.g. Holden et al., 2009; Holden and Otsuka, 2014; Deininger and Jin, 2006; Deininger and Ali, 2007). This theory is contested, however, as the general property literature stresses that privatisation is not a universal remedy for unsustainable land use (neither ecologically nor socially). According to many studies (e.g. Ostrom, 1990; McKean, 2000; Keys et al., 2005), improvements in the governance of common property on a community level rather than in individualised land rights combined with market- or state-driven governance are thought to be more favourable for natural resource management and inclusive agricultural development.
In a multivariate regression-based analysis, Nkonya et al. looked at the relationship between cropland expansion, agricultural potential, population density, economic growth,
expenditures on agricultural R&D, agricultural exports, market access, poverty, international development aid, land tenure and government effectiveness in Sub-Saharan Africa (Nkonya et al., 2013). They found, for example, a positive correlation between poverty in densely populated areas and agricultural expansion. They also found a positive association between increased market access and expansion. However, their model also showed that agricultural potential, tenure security and exports had a negative effect on the rate of expansion. In addition, they found a quadratic relationship between expansion and population density, agricultural R&D and development aid, meaning that although these variables initially lead to expansion, they ultimately result in agricultural contraction after a certain threshold. This is consistent with Boserup’s theory of initial expansion due to population growth, followed by intensified land use and less agricultural expansion.
2.6 ‘Sometimes-true theories’
As we can see from the above, there are numerous theories to explain the dynamics of land-use change, but none of them succeeds in capturing all the mechanisms involved. Potential drivers of land-use change that are recurrently mentioned in the literature are biophysical circumstances, land scarcity and population growth, agricultural intensification and
causes their internal dynamics. The absence of an overarching theory of land-use change reflects the complexity of this issue, and many of the theories appear true in some cases, but not in others. Perhaps they can be best captured by what Coleman (1964) describes as ‘sometimes-true theories’: ‘general models that can adequately account for the results or
regularities in some specific cases’ (Coleman, 1964; Hedstrom and Swedberg, 1998).
Throughout our analysis of the available data, as described in the following chapter, we kept these theories in mind, in order to assess what mechanisms would play a role in which case, aimed at understanding the dynamics on a national scale and drawing conclusions about what type of policy intervention would be more or less likely to achieve an effect in which case.
3 Land use and food
supply dynamics; an
empirical approach
3.1 The relationship between land use and food supply in
Sub-Saharan Africa
Focus of the analysis
This section describes our exploratory analysis, based on aggregated FAO data, and the trends in food demand and food supply as well as their implications for land use, in order to provide a first insight into the underlying dynamics, and to reveal general patterns that confirm or contradict the theories outlined in Chapter 2. FAO presents in their Statistical Yearbook 2012 an analysis of growth in crop production that shows an equal contribution of about one third for expansion, cropping intensities and yield growth over a period of 50 years (1961-2009). The analysis in this report encompasses a cross-country analysis of the most recent historical trends only.
We focused on a selection of 10 countries based on covering several income classes and levels of land scarcity. The motivation for focusing on a selection was that we aimed at Figure 3.1
identifying patterns in the data that could be related to national-scale dynamics. The countries in our selection were Malawi, Mozambique, Ethiopia, Rwanda, Uganda, Kenya, Ghana, Nigeria, South Africa and Botswana (in order of GNI 2012 per capita) (Figure 3.1). We grouped these countries with cropland availability below the world average of 0.22 hectares per capita and above this average from each income class as defined by the World Bank (Low Income LIC, Lower Middle Income LMIC, Upper Middle Income UMIC and High Income HIC).
Unless mentioned otherwise, observations are based on (changes in) 3-year centred moving averages. We limited the scope to the years between 1990 and 2010, because we were interested in the most recent developments and for most indicators data were only available until 2010. For reasons of data availability and because of their limited share to Sub-Saharan African agricultural production, fragile states were not included in our analysis.
For the land-use-dynamics analysis, we chose to focus on cropland expansion rather than total agricultural land. The main consideration is the problematic nature of the concept of meadows and pastures (Ramankutty et al., 2008). It is challenging to determine whether a given area is managed and cultivated as a meadow used for livestock or whether it is a low grazing intensity natural grassland area. Consequentially the national level land data for livestock systems are often unreliable, a symptom which may be aggravated by limited statistical capacity in African countries (Jerven, 2012). For many of the countries in this study for example, the area of meadows and pastures has remained exactly equal over the entire period under study, which contradicts other reports on cropland being a constraining factor for grazing land (Rufino et al., 2013). Especially in countries with large areas of meadows and pastures this causes underestimation of the agricultural expansion rate. An additional motivation for the focus on cropland is that meat forms only a minor part of the average diet in most of the countries in this analysis. Hence, in the context of food
availability cropland changes are the most relevant land use dynamics. In spite of signals of a growing middle class in Africa, in most countries the average per capita meat intake has not changed much during the period under scrutiny implying that major dietary shifts have not taken place. In the years to come however, this phenomenon might start playing a larger role in African food production (Westhoek et al., 2016) with potential effects on land use change dynamics.
Data caveats
It is widely known that African data on agriculture and land use should be approached with caution. Data compiled by FAO are generally based on inputs from national statistics, which might be inaccurate. African data are often problematic due to capacity limitations of national statistical bureaus (Jerven, 2012. Political interests also play a role; data may be biased towards overestimation of production increases or underestimation of minor crops or farms that are not within a national Ministry’s focus (Wiggins, 2014).
Unfortunately, there are no evident alternatives for national-scale agricultural statistics yet. Therefore, many researchers and most of the international modelling community use the FAO data. FAO has the most comprehensive and consistent time series available on agricultural production and agricultural areas. We are aware of the discussions on the reliability of these data (FAO, World Bank and United Nations Statistical Commission, 2012) and on the definitions used (Ramankutty et al., 2008). Some data on land use might be cross-referenced with remote sensing studies, but even in these cases FAO data is often used as a reference. Data on food supply can be checked with the results of Demographic and Health Surveys, as is demonstrated by Wesenbeeck, Keyzer and Nube (2009). The
Living Standards Measurement Study – Integrated Surveys on Agriculture (LSMS-ISA) is also a potentially valuable source for cross-reference but time series are not available yet. FAO uses in its outlooks from 1995 on (Alexandratos, 1995; Bruinsma, 2011) adjusted figures on arable land and cropping intensities because it is believed that FAO statistics for cropland areas are too low and therefore estimated cropping intensities are too high. Cropping intensity is the ratio between harvested area and cropland area. We compared the cropping intensities from FAO statistics with recent data from LSMS-ISA surveys in
Binswanger et al. (2014) and these survey data confirmed our estimated cropping intensities from the FAO statistics. Therefore we used the original data on arable land and harvested land for our analysis.
One of the most ardent critics of FAO data, Morten Jerven, advises to not overly rely on FAO statistics and take into account qualitative reports and expert knowledge to reach a better understanding of African agricultural dynamics. When possible we checked our main
conclusions with peer-reviewed literature. We used different statistics from FAO and from the World Bank. From FAO data, we used Food Balance Sheets that are a compilation of statistics on production, trade and consumption. The compilation ensures that cross-references and consistency checks are made. However, this analysis should be interpreted as a means to explore the value of different national level statistics and as a search for a consistent explanation for the dynamics under study.
Data and analysis
Changes in food demand
To assess the changes in food demand we looked at the changes in total population and income (GNI per capita) between 1990 and 2010. Change was defined as the three-year rolling mean in 2010 over the three-year rolling mean in 1990. To study the changes in diet we looked at the percentage of animal products in the diet over time and the percentage of protein derived from animal sources over time. Again, change is based on the differences between 1990 and 2010.
Changes in food supply and its proximate causes
To assess the role of changed food supply in food and nutrition security development we looked at the supply of vegetal food over time – in kg of dry weight – in absolute and per capita terms. The data were derived from FAO’s Food Balance Sheets. In addition, we assessed the roles of imports and domestic production in supply change. To calculate these roles, we calculated the share of the difference in net imports (total imports – total exports of vegetal foods) between 1990 and 2010 in the total supply difference over that period. The share of domestic production was calculated in a similar way.
Changes in production and its proximate causes
To study production changes and the factors playing a role, we looked at FAOSTAT’s production database. We defined total production and total area harvested as the sum of these variables for all crops in a given year (be aware that this includes crops that are not necessarily used for food). We used the data on the number of hectares of land used for arable land and permanent crops, from FAOSTAT’s land database, to assess total cropland expansion. First, production growth was determined as the difference between 1990 and 2010 (in tonnes). The role of expansion was calculated as the share of the expansion rate, times the production in 1990 in total production growth. The role of intensification was determined as the difference between production growth and production growth due to expansion. The role of intensification was further split up into the role of yield growth and that of land use intensification. The former was defined as the change in production per area
harvested of all crops. The latter was defined as the change in area harvested per total cropland area. Roles of these factors were determined as their respective shares in intensification.
Results
Population growth and income growth dominate over dietary shifts as drivers of changes in food demand
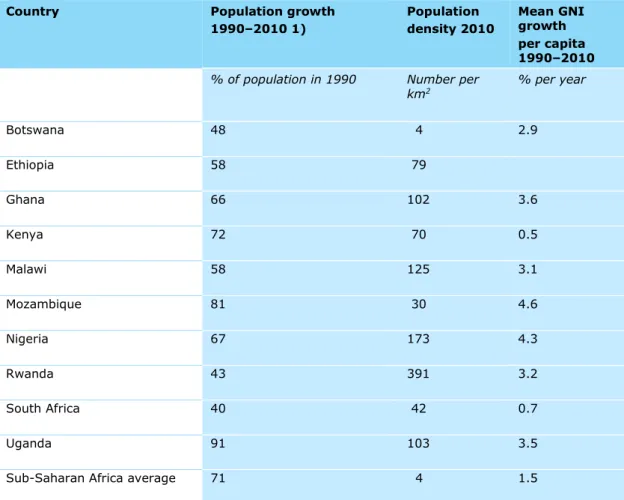
Population growth in Sub-Saharan Africa averaged 71% between 1990 and 2010, while global population growth was 30% during that period (Table 3.1, data from United Nations, 2015). Several countries in this study – most notably Uganda and Mozambique – even surpassed this exceptionally high population growth rate. Income – the other main
determinant of food demand – also grew significantly. Although Sub-Saharan Africa’s mean annual per capita income growth over the 1990–2010 period, was below the world average of 2.4%, the fast-growing countries exceeded this rate (Table 3.1). Ghana, Mozambique, Nigeria and Uganda’s food demand growth was among the highest in the world; both population and income growth rates are in the global top quartiles.
Table 3.1 Drivers of changes in food demand; population growth and economic growth
Country Population growth
1990–2010 1) Population density 2010 Mean GNI growth per capita 1990–2010 % of population in 1990 Number per
km2 % per year Botswana 48 4 2.9 Ethiopia 58 79 Ghana 66 102 3.6 Kenya 72 70 0.5 Malawi 58 125 3.1 Mozambique 81 30 4.6 Nigeria 67 173 4.3 Rwanda 43 391 3.2 South Africa 40 42 0.7 Uganda 91 103 3.5 Sub-Saharan Africa average 71 4 1.5
Source: United Nations (2015) Population growth and World Bank and OECD (2016) national accounts data1
1 Data for Ethiopia start at 1994 instead of 1990 and data on GNI per capita annual growth
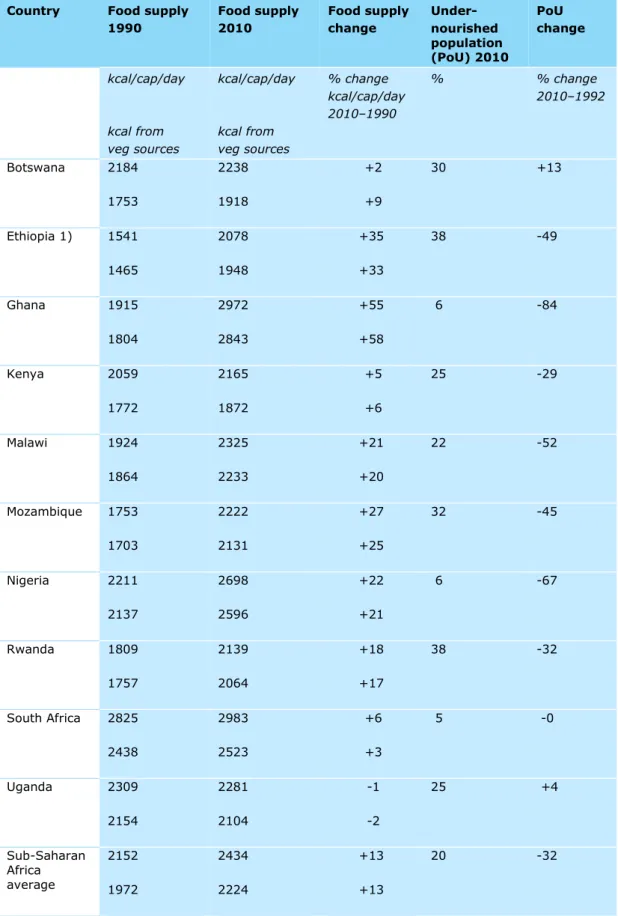
Table 3.2 Change in dietary energy supply and percentage of undernourished population (PoU)
Country Food supply
1990 Food supply 2010 Food supply change Under- nourished population (PoU) 2010 PoU change kcal/cap/day kcal from veg sources kcal/cap/day kcal from veg sources % change kcal/cap/day 2010–1990 % % change 2010–1992 Botswana 2184 1753 2238 1918 +2 +9 30 +13 Ethiopia 1) 1541 1465 2078 1948 +35 +33 38 -49 Ghana 1915 1804 2972 2843 +55 +58 6 -84 Kenya 2059 1772 2165 1872 +5 +6 25 -29 Malawi 1924 1864 2325 2233 +21 +20 22 -52 Mozambique 1753 1703 2222 2131 +27 +25 32 -45 Nigeria 2211 2137 2698 2596 +22 +21 6 -67 Rwanda 1809 1757 2139 2064 +18 +17 38 -32 South Africa 2825 2438 2983 2523 +6 +3 5 -0 Uganda 2309 2154 2281 2104 -1 -2 25 +4 Sub-Saharan Africa average 2152 1972 2434 2224 +13 +13 20 -32
Source: FAO (2016) Food Balance Sheets (food supply), food security statistics (PoU) 1) Food supply data for Ethiopia from 1994 instead of 1990
In spite of the high income growth rates, animal product consumption has remained
relatively low and stable in most countries in this study. Half of the countries derive less than 20% of their daily per capita protein intake from animal sources (the global average in 2010 was 45%).
Botswana and South Africa, the most affluent countries, top the list with an animal protein fraction over 30%. The largest increase rates occurred in South Africa and Uganda, the latter of which witnessed the highest overall growth in food demand when all three factors are taken into account. Interestingly, relative animal product consumption decreased in Ghana in spite of its high income growth. All in all, we can conclude that population and income growth are dominant over dietary shifts as drivers of changes in food demand for this subset of countries as well as for Sub-Saharan Africa as a whole.
Figure 3.2
Protein intake derived from animal sources between 1990 and 2010
Food supply improved, but cross country differences remain large
In order to gain a better understanding on the developments in food and nutrition security we analysed the developments in food supply between 1990 and 2010. The World Food Program states that ‘On average, the body needs more than 2,100 kcal per day per person to allow a normal, healthy life. Extra energy is needed during pregnancy and while nursing’ (WFP, 2016). In 1990 the average per capita food availability was below the 2100 calorie threshold in Kenya, Malawi, Mozambique, Rwanda, Ethiopia (1994) and Ghana. In 2010, only Ethiopia remained slightly below the threshold with an average food availability of almost 2080 kcal per capita. This reveals that in spite of the high population growth, ranging from an average yearly growth rate of 2% (South Africa) to 4.5% (Uganda), most of the countries managed to increase their food availability significantly.
With a 55% increase in per capita food supply (and a 58% increase in vegetal food supply in kcal per capita per day) (Table 3.2) Ghana is showing most evident growth, in spite of a population growth of 66%. Ethiopia, Mozambique, Nigeria and Malawi witnessed impressive per capita growths of 20% to 30%, as well. Growth was weaker – albeit still significant – in Rwanda. South Africa, Kenya and Botswana, all of which already had a relatively high food
supply in 1990, had growth levels of below 10%. Uganda was the only country where per capita food supply decreased. At the
same time this was also the country with the highest population growth (and in fact the highest population growth in the world), hinting at a possible Malthusian scenario (see also section 2.2).
Figure 3.3
Vegetal food supply changes per capita and the roles of domestic production and imports
This figure (a) shows the changes in the per capita supply of vegetal foods from 1990 to 2010
The figure below (b) shows the shares of domestic production growth and increased imports in the absolute supply change of vegetal food per capita
Imports only explain a minor part of the improved food supply
To assess the proximate causes of food supply developments, the roles of domestic production and net imports in absolute vegetal supply were analysed. Similar to vegetal supply in kcal, absolute vegetal food supply also grew in every country, but the per capita
changes differed widely between countries. Figure 3.3a shows the changes in the annual per capita supply of vegetal foods (kg).
While the average Sub-Saharan African growth in supply per capita is below the global mean of 175 kg, several countries in this selection – Ghana, Malawi, Rwanda, Mozambique and Nigeria – easily surpass this average. Figure 3.3b shows the relative shares of domestic production and net imports in supply growth. For example, an average Ghanaian citizen had more than 1.5 kg of vegetal food more available on a daily basis in 2010 than in 1990. Of the added supply, 96% was domestically produced and 4% was imported. A Botswanan on the other hand, saw daily availability increase by only 153 grams, of which 95% was
imported. In Uganda, an average citizen had 44 grams of vegetal food less available per day, even though the absolute supply did increase. Of the absolute increase, 97% was produced domestically.
While these figures show a wide range of per capita supply increases, there is an obvious agreement in the data on the shares of domestic production and imports. In the majority of countries, domestic production increases form the largest share in supply growth by far – irrespective of the magnitude of supply growth. The relative contributions of domestic production and imports for Sub-Saharan Africa as a whole are similar to the patterns observed in the individual countries. Botswana – a country with a relatively low supply per capita increase forms the exception to the rule with a dominant contribution of increased imports.
Figure 3.4
Changes in cropping intensity
This figure shows the development of the ratio of the total area harvested (the sum over all crops) over the total cropland area (arable land and permanent crops). A ratio above 1 implies the occurrence of multiple harvests in one year
Cropland area has increased, but agricultural intensification plays the key role in increasing food supply
To understand the relationship between food supply, land use and loss of natural areas, we studied the relative contribution of cropland expansion and intensification to production growth. We divided intensification into yield increase (growth of production per area
harvested) and cropping intensification (growth of area harvested per ha of cropland (Figure 3.4)). In contrast to the results for food supply growth, we can distinguish widely varying patterns here. The Sub-Saharan African average shows a minor increase in production per capita, but again, the fast growers exceed this mean growth by far (Figure 3.5a). Malawi had the highest yield increase but despite this, expansion rate in Malawi is also among the highest after Ghana and Mozambique. Yield growth is the dominant contributor to SSA’s production increase, with a significant role for expansion and a slightly negative role for cropping intensification (Figure 3.5b). The latter means that the area of cropland that was Figure 3.5
Crop production changes and the roles of expansion and intensification
This figure (a) shows the per capita changes in the production of all crops between 1990 and 2010.
The figure below (b) shows the contribution of cropland expansion, yield increases and cropping intensification to the production changes. Cropland expansion is defined as the rate of change of the cropland area (arable land and permanent crops). Yield increase is the change in the production of all crops over the total area harvested (in terms of weight per area). Cropping intensification is defined as the change in the ratio of the total area harvested to the total cropland area.
harvested decreased, relative to the total area under cropland cultivation. Generally, the contribution of cropping intensification to production growth is minor.
In all selected countries intensification was dominant over expansion but the relative contributions of cropland expansion and yield growth differ from country to country. In Uganda for example, the contribution of cropland expansion was almost equal to that of intensification, while in the other countries where production increases did not keep up with population growth (Botswana, Kenya and South Africa), expansion played a minor role. The contribution of expansion also differed between countries with a relatively high production growth. In Rwanda – a country with a much higher population density than Ghana – the contribution of yield growth was 19% compared to 38% for Ghana.
Different countries explained by different theories
Regarding production growth (Figure 3.5a) two groups of countries can be distinguished: those where food production does not keep up with population growth (South Africa,
Uganda, Kenya and Botswana) and the majority of countries where production per capita has increased (Ghana, Malawi, Rwanda, Mozambique, Ethiopia and Nigeria). The first 4 countries had a quite favourable starting point in 1990 with above average food supplies. Only South Africa managed to stay well above the Sub-Saharan average in 2010. Botswana kept up because it compensated the production decrease by imports. Uganda and Kenya fell below the Sub-Saharan African average in 2010. In Uganda, not only progress was slow but this progress also came with a significant loss of over 2 million hectares in natural areas. The four countries in our selection that had the largest agricultural production increases can be grouped into two categories: the most land-abundant countries (Mozambique and Ghana) and the most land-constrained countries on the African continent (Malawi and Rwanda) (Deininger and Byerlee, 2011). The situation in these four countries follows the Boserupian theory according to which there is more expansion in land-abundant countries and more intensification in land-constrained countries.
3.2 The relationship of expansion and land scarcity
Results show contrasting developments with respect to the respective contributions of cropland expansion and intensification to production growth in land-abundant countries such as Mozambique and land-constrained countries such as Rwanda. However, also between land-constrained countries such as Rwanda and Uganda, patterns of intensification and expansion are rather different. Many of the theories outlined in chapter 2 relate expansion and intensification to population pressure and hence, the scarcity of land. Therefore, we looked at the current availability of suitable cropland as a proxy for land scarcity over the past 20 years (unfortunately time series data are not available for this period).Before we go into the national-level analysis of land scarcity, it is important to be aware of several aspects of the current scientific discourse on land scarcity in Sub-Saharan Africa. Africa is often viewed as a land-abundant continent, where ongoing agricultural expansion is indeed a realistic option for increased food production. A widely cited World Bank report by Deininger and Byerlee from 2011 estimates the amount of Potentially Available Cropland (PAC) in Sub-Saharan Africa to be between 68 and 202 million hectares, almost half the global stock of 198 to 446 million hectares (Deininger and Byerlee, 2011, Fischer and Shah, 2010). PAC is hereby defined as uncultivated, unforested land. However, if we project PAC onto the expected population growth, it turns out that for every person expected to be added to the Sub-Saharan African population between 2010 and 2050, there is only between 0.07 and 0.22 hectares of uncultivated suitable cropland available, which puts SSA’s land abundance into perspective.
The estimations by Deininger and Byerlee (2011) are further qualified by other studies and observations, with the main message that estimating potentially available cropland (PAC) is heavily dependent on assumptions (Chamberlin et al., 2014). These assumptions include the demarcation of the concept of suitability (e.g. Deininger and Byerlee look only at rain-fed agriculture of only 5 crops and only use IIASA/GAEZ as a source), estimations of area of non-forested land and the population density below which land is assumed to be available (e.g. Deininger and Byerlee look at 5, 10 and 25 people per km2). Furthermore, there are also a number of economic constraints that renders expansion into some areas unprofitable even though it is suitable and available. These constraints include (but are not limited to) locally variable market access, output prices and production costs. Profitability constraints reduce PAC in Sub-Saharan Africa by as much as 67% under the most stringent assumptions (Chamberlin et al., 2014). This raises the question of what proportion of local farmers realistically have access to the land that is available, given the wider socio-economic and agricultural system.
Apart from these uncertainties and constraints, the distribution of available land is so highly skewed that speaking of Sub-Saharan Africa as a land-abundant region does not do justice to the more complex reality of land availability. Half of all PAC (according to Deininger’s
maximum estimations) is located in only 4 countries; Sudan (23%, former Sudan), DRC (11%), Mozambique (8%) and Madagascar (8%). About 92% of SSA’s PAC is situated in 17 countries that together account for 60% of the rural land area. This means that the
remaining 5 to 16 million hectares of PAC are spread out over 32 countries that together represent 40% of the rural land area. Thus, most of the PAC exists in large (sparsely populated) countries.
Table 3.3
Potentially available cropland (PAC) in the 5 selected countries with the largest area of underutilised cropland
Data on Potentially Available Cropland (PAC) is based on Chamberlin et al., 2014.
Chamberlin et al. established their baseline data using the definition formulated by Lambin (2013) of PAC as ‘land that is not currently cultivated, not forested, not part of National Park systems or other gazette areas, and which currently has very low rural population densities’ (Chamberlin et al., 2014). The method used to estimate PAC is based on Fischer and Shah 2010, who use geospatial data on population densities and suitability for agriculture from GAEZ 2010, but Chamberlin et al. (2014) averaged land suitability over the (significantly variable) data from three databases (GAEZ, GlobCover, MODIS and MODIS+).
Country PAC Share of total
PAC capita (2010) PAC per Cropland per capita (2010)
1000 ha % of SSA PAC ha ha Mozambique 21400 8.7% 0.88 0.24 Ethiopia 4716 1.9% 0.05 0.18 South Africa 4577 1.9% 0.09 0.25 Kenya 4458 1.8% 0.11 0.15 Ghana 3555 1.4% 0.15 0.30
Source: PBL calculations from Chamberlin et al. (2014)
For the countries abundant in PAC, we can see that economic constraints are of major importance for how much land is considered to be profitable, with large inter-country variability. For example, Sudan’s PAC is reduced by over 90% when Chamberlin’s strictest profitability constraints are applied. In contrast, PAC in DRC is only reduced by 29% and in Central African Republic the extent of profitable land is even 21% larger than the space that
is suitable. This happens when areas are not necessarily ideal for production in a biophysical sense, but economic variables (such as closeness to markets) make them nevertheless profitable for crop production.
For the countries selected in this study, Mozambique is by far the most abundant in PAC, in absolute terms but also for PAC as a share of total land area and per capita (Table 3.3). This offers an explanation for the high expansion rate that is in line with Boserup who does not expect a labour-intensive intensification approach when land is not a limiting factor.
4 Discussion and
conclusions
We started this report with the question of whether there are Sub-Saharan African countries that have managed to improve their food supply per capita while being relatively
independent of cropland expansion and food imports. We attempted to answer this question by looking back at how the populations of 10 African countries have been feeding themselves between 1990 and 2010 and how this is related to agricultural and other land use and productivity. The following section first answers the research questions, and then discusses the results in view of the broader sustainable development challenge and policy theories.
4.1 Looking beyond the average; glimmers of hope
In spite of the pessimistic prospects emerging from reports mentioned in the introduction (p5), the improvements in food supply in Sub-Saharan Africa are worthy of attention.Indeed, reductions in hunger have been slower than in large parts of Asia and South America but nonetheless there was progress rather than deterioration over the period under study. Of course, this does not mean that hunger is now absent from these countries, because this analysis is about averages and it does not address the distribution of the available food, but still the increases in average food supply are no small feat for countries witnessing mean annual population growth rates that are very high. However, mean trends for SSA appear to mask large differences between countries, so that the improvements at the national level are overshadowed. Analysis on the national scale reveals that in the countries that did manage to improve dietary energy supply and food supply in absolute terms, progress has been nothing but impressive. For example, an average Ghanaian citizen had more than 1.5 kg of vegetal food (= over 80%) more available on a daily basis in 2010 than in 1990. In contrast, an inhabitant of Botswana saw daily availability increase by only 153 grams and a Ugandan had 44 grams of vegetal food less available per day.
Most of the increases in supply were caused by domestic production growth. The results from the current analysis put the relevance of increased import dependency into perspective by showing that in spite of the major rise in imports in absolute terms, the largest part of increased supply was driven by increased domestic production, with over 90% for the whole of SSA.
Low yields and high dependence on cropland expansion are viewed as a major threat to sustainability of African food and nutrition security and ecosystems, especially given the looming land scarcity in many countries (Lambin and Meyfroidt, 2010). This analysis shows that this picture is more complex. In fact, yield growth was the main cause of crop
production growth in all selected countries but one and in the region as a whole. However, there are clear differences between countries if we consider the respective roles of cropland expansion and yield growth on changes in food supply per capita. Figure 4.1 shows the selected countries and their relative change in food supply, expansion rate and yield growth. Thus, a win–win situation would be a dark blue country in the upper left corner. However, such a country is unfortunately absent. In fact, expansion seems to be quite a good explanatory variable for supply growth. We can distinguish different clusters of countries.
Botswana and South Africa do well on the land sparing front, but less so in terms of supply growth. For South Africa, this does not matter too much, since its food supply was already quite high, but Botswana’s food supply was rather average in 2010 (Table 3.2). Botswana is a relative wealthy country (Figure 3.1) so this does say something about its priorities. Uganda is closest to a lose–lose situation, with a high expansion rate giving its negative achievements in food supply. Kenya, Rwanda and Nigeria have similar rates of expansion and made progress in food supply with Nigeria and Rwanda coming closest to a win–win situation. Mozambique, Malawi and Ethiopia halved their hunger rate, but at the cost of a lot of land. Interestingly, average yields almost doubled in Malawi, but the country has also one of the highest expansion rates. Finally, Ghana made the largest progress in terms of food supply, but it also had the largest expansion rate.
Figure 4.1
Relative change in vegetal food supply as a function of expansion and yield growth This figure shows the expansion, the relative change in vegetal food supply (in kcal per capita) and yield (kg per harvested area) growth between 1990 and 2010. Countries with the largest improvements in food supply tend to have large expansion rates.
In spite of the large contribution of African agricultural expansion to the global increase in agricultural land, in Sub-Saharan Africa higher crop yields were a more important contributor to agricultural production growth than expansion in most of the analysed countries. This analysis shows that there are multiple countries where domestic productivity increases are indeed able to meet a growing food demand. In all of the selected countries (as well as in SSA on average), population increased much faster than cropland. Despite this, growth of the domestic productivity of vegetal products (in terms of total weight) exceeded population growth in six out of the 10 countries (Figure 3.5). These findings nuance the dire picture of the state of African agriculture that existed at the end of the 20th century; that of a continent with unsustainably high population growth, exhausting its natural resource base and facing Malthusian catastrophe. It shows that although average progress was limited there were large differences in performance.