DEFINING MAJOR CONTRIBUTORS TO
FUNCTIONAL OUTCOME OF ACUTE
ISCHAEMIC STROKE
A SINGLE-
CENTRE OBSERVATIONAL STUDYD
R.
A
NOUKL
ESENNEStamnummer: 00903665
Promotor 1: Prof. dr. Dieter Mesotten Promotor 2: Prof. dr. Patrick Wouters
Masterproef master in de specialistische geneeskunde
INHOUDSOPGAVE
PREDICTION OF OUTCOME AFTER ACUTE ISCHAEMIC STROKE: COMPARISON OF THE CT-DRAGON SCORE AND A
SIMPLIFIED SCORE, USING MACHINE LEARNING TECHNIQUES. 4
ABSTRACT 4 INTRODUCTION 5 METHODS 7 PATIENT POPULATION 7 OUTCOME MEASURE 7 PREDICTION MODELS 7 STATISTICAL ANALYSES 9 RESULTS 9 DESCRIPTIVE STATISTICS 9
DEVELOPMENT OF THE PROPOSED SIMPLIFIED SCORE 13
ANALYTICAL STATISTICS 14
DISCUSSION 15
HEALTHCARE-RELATED COSTS AND ITS ASSOCIATION WITH HOSPITAL-ACQUIRED INFECTIONS AFTER ACUTE
ISCHAEMIC STROKE: A BELGIAN SINGLE-CENTRE COST-UTILITY STUDY. 19
ABSTRACT 19 INTRODUCTION 20 METHODS 21 DATA COLLECTION 21 COST TREE 22 STATISTICAL ANALYSES 23 RESULTS 23 BASELINE CHARACTERISTICS 23 CLINICAL OUTCOME 23 COST ANALYSIS 24 COST-UTILITY ANALYSIS 26 INFECTION 26 DISCUSSION 28 REFERENCES 31 NEDERLANDSTALIGESAMENVATTING 35
P
REDICTION OF OUTCOME AFTER ACUTE ISCHAEMIC STROKE:
COMPARISON OF THE CT-
DRAGON SCORE AND A SIMPLIFIED SCORE,
USING MACHINE LEARNING TECHNIQUES.
Lesenne A, Grieten J, Ernon L, Wibail A, Stockx L, Wouters P, Dreesen L, Vandermeulen E, Van Boxstael S, Vanelderen P, Van Poucke S, Vundelinckx J, Van Cauter S, Mesotten D.
(Manuscript submitted to Frontiers in Neurology, status: under review)
ABSTRACT
Introduction—The CT-DRAGON score was developed to predict long-term functional outcome after acute stroke in the anterior circulation treated by thrombolysis. Its implementation in clinical practice is hampered by a plethora of variables and by a lack of robust validation. The current study was designed to develop and evaluate an alternative, simplified score based on feature selection by machine learning.
Methods—This single-centre retrospective study included 564 patients treated for stroke, in the anterior and the posterior circulation. At 90 days, favorable (modified Rankin Scale score (mRS) of 0-2) and miserable outcome (mRS of 5-6) were predicted by the CT-DRAGON. Machine learning selected the most relevant parameters of the CT-DRAGON, in order to develop a simplified score. Discrimination, calibration and misclassification of both models were tested. Results—The area under the receiver operating characteristic curve (AUROC) for the CT-DRAGON was 0.78 (95% CI 0.74-0.81) for favorable and 0.78 (95% CI 0.72-0.83) for miserable outcome. Misclassification was 29% for favorable and 13.5% for miserable outcome, with a 100% specificity for the latter.
Through machine learning, National Institutes of Health Stroke Scale (NIHSS), pre-stroke mRS and age were identified as the strongest contributors to favorable and miserable outcome and named the simplified score. While CT-DRAGON was only available in 323 patients (57%), the simplified score could be calculated in 515 patients (91%) (p < 0.001). Misclassification was 25.8% for
0.005), with an AUROC of 0.82 (95% CI 0.79-0.86) and 0.83 (95% CI 0.77-0.87) for favorable and miserable outcome, respectively.
Conclusions—The CT-DRAGON score revealed acceptable discrimination in our cohort of both anterior and posterior circulation strokes, receiving all treatment modalities. The simplified score could be measured in a larger cohort and with better discrimination. The simplified score needs further validation in a prospective, multicentre study.
Clinical Trial Registration-URL: http://www.clinicaltrials.gov. Identifiers: NCT03355690, NCT04092543.
INTRODUCTION
With an incidence of 14 million patients annually, ischaemic stroke is the second largest cause of death globally after ischaemic heart disease. It has a major burden of morbidity as well, with an estimated annual 52 million disability-adjusted life years.(1) Prognostic tools that predict outcome of acute ischaemic stroke potentially provide early identification of patients who are likely to have a good or poor outcome despite treatment. If this tool has a high specificity for miserable outcome, it can guide therapeutic decisions and be helpful in counseling patients and relatives, because estimations of outcome in stroke patients remain largely subjective at this moment. In this view, several prognostic scoring systems have been developed to address this need, such as the ASTRAL, the CT-DRAGON, the iSCORE and the PLAN score.(2) However, they have not been widely implemented in clinical practice, due to several limitations. First, a large number of input variables are required, some of which are hard to determine in the acute setting. Second, these scores are often tailored to subpopulations of stroke patients, depending on the localization of the stroke and/or the treatment received. Third, there is still a lack of validation in large patient populations using real world data.
Treatment options for acute stroke have strongly evolved over the last decade. Most scoring systems were developed in the era of thrombolysis, while thrombectomy and its combination with
thrombolysis only have been implemented over the last years.(3-9) These developments certainly should have influenced reliable estimates of outcome and long-term effect of treatment.
To enhance implementation of prognostic tools, Fahey et al. advised to validate existing prognostic tools in different patient populations and treatment settings, opposed to designing new ones.(10) Notably the CT-DRAGON score (Dense Artery, modified Rankin Scale, Age, Glucose, Onset-to-Treatment and NIHSS) has already been validated in previous studies and adapted to different diagnostics and treatments in stroke patients.(11-17) The MRI-DRAGON score was developed and externally validated to deal with patients, in whom MRI was used as the first-line diagnostic tool.(18, 19) Recently, the DRAGON score has also been modified to deal with patients, undergoing mechanical thrombectomy.(20) These modifications are relevant since decision to perform mechanical thrombectomy in patients with wake-up strokes is often based on MRI diffusion-weighted imaging (DWI). Despite the modifications to specific subpopulations of stroke patients, its potential remains underutilized because of the missing data. A “light version” of the DRAGON score with less input variables, selected by machine learning, might thus be an alternative.
Machine learning has many applications, among which prediction of outcomes in healthcare. Machine learning techniques consist of algorithms able to solve problems by learning from experiences. Mathematical models are built and trained by providing training data. When new data are supplied, the models are able to generalize their learned expertise and make accurate predictions. Dimensionality reduction is a more recent application of machine learning. This process strives to reduce the number of variables under consideration. By ‘feature selection’ input variables from existing scoring systems can be reduced and optimized.(21, 22)
We aimed to validate the CT-DRAGON score in all ischaemic stroke localizations and for all treatment options, including a conservative treatment policy. The predictive power was then compared with a simplified prognostic model, that included a set of the individual components of the CT-DRAGON score, selected by machine learning techniques.
METHODS Patient population
This retrospective study included patients admitted to the stroke centre of Ziekenhuis Oost-Limburg Genk, Genk, Belgium from January 2017 until February 2019. Patients with hemorrhagic stroke and stroke mimics were excluded. The final cohort comprised not only patients with acute ischaemic stroke independent of pre-stroke mRS, stroke localization or treatment, but also patients with transient ischaemic attack (TIA) with symptoms on admission. These patients with TIA were included in the analysis, since its final diagnosis is often impossible to establish in an acute timeframe. Treatment of stroke patients was categorized into (1) conservative therapy, (2) thrombolysis, (3) thrombectomy or (4) a combination of thrombolysis and thrombectomy. This study was approved by the institutional review board of Ziekenhuis Oost-Limburg, Genk (19/0059U) and registered on clinicaltrials.gov (NCT03355690, NCT04092543).
Outcome measure
Functional outcome was determined by the mRS score at 3 months. Patients were contacted by telephone within a timeframe of 3 months ± 2 weeks by the independent stroke study collaborator (EV) who was not involved in the care of the patients. Favorable outcome was defined as a mRS of 0, 1 or 2, miserable outcome as a mRS of 5 or 6.(11)
Prediction models
The data necessary for calculation of the CT-DRAGON score were collected through a search of the electronic patient files. CT scans were evaluated by dedicated radiologists for the presence of a large vessel occlusion and early signs of infarction. A thrombus in the internal carotid artery or in the M1 or M2 segment of the middle cerebral artery on CT angiography was included in the score and was regarded as an alternative to the hyperdense cerebral artery sign (1 point). For strokes in the posterior circulation, the same principle was applied for an occlusion in the vertebral or basilar artery (1 point).
For ischaemic strokes in the vascular territory of the medial cerebral artery, early infarct signs were scored (1 point) when the Alberta Stroke Program Early CT score (ASPECTS) was less than 10. For all other vascular territories, any signs of early ischaemia on CT scored 1 point. Early infarct
signs on CT were defined as hypodense areas in any cerebral artery territory in combination with effacement of the adjacent sulci and loss of differentiation between grey and white matter.
As the sample size of the dataset was fixed, it was decided that the ratio of events (favorable or miserable outcome) per each candidate predictive factor should be at least 10.
While “time onset stroke to treatment” was one of the parameters in the original CT-DRAGON score, we used “time onset stroke to emergency department admission” as we did not want to exclude patients who received conservative treatment. When the time of onset was unknown, it was assumed to be more than 90 minutes and thus scoring 1 point. In this way a complete-case analysis was employed, with missing data from the other parameters of the CT-DRAGON recoded as 0 points.
Through machine learning techniques, we selected the parameters of the CT-DRAGON score that did or did not provide additional predictive value. By use of logistic regression, decision tree analysis and bootstrap forest in sequential order a less complex score with the most powerful predictors of the CT-DRAGON was built. In all three machine learning techniques the 7 components of the CT-DRAGON score were added into the model as a continuum over the entire range of the values (age in years, NIHSS in ordinal points, pre-stroke mRS in ordinal points, glycemia in mg/dL, time to emergency department in hours). Early ischaemia (yes/no) and dense artery sign or its posterior equivalent (yes/no) were entered as dichotomous values. The three models were used to assess the consistency of the prognostic factors in terms of selection and ranking according to contribution importance. In the decision tree analyses a maximum of 4 splits was done. The bootstrap forest analysis fits an ensemble model by averaging many decision trees each of which is fit to a bootstrap sample of the training data. Each split in each tree considers a random subset of the predictors. In this way, many weak models are combined to produce a more powerful model. A minimum of 10 splits per tree and a minimum size of 5 per tree was used. Next, we developed “the simplified score” in a training and a validation cohort. Baseline patient characteristics were compared between training and validation cohorts.
Finally, the predictive performance of the CT-DRAGON and the simplified score were compared for discrimination, calibration and misclassification.
Statistical analyses
The distribution of the data was analyzed. All data were represented as either mean +/- SD or median and IQR. A training (0.75 of study cohort) and a validation cohort (0.25) were established by random selection. We assessed the performance of the CT-DRAGON and the simplified score with the variance and the AUROC for both favorable and miserable outcomes. Calibration of the model was tested by lack of fit. Misclassification rate, sensitivity and specificity were calculated. We estimated the fit of the model with the Akaike Information criterion (AIC). Analyses were performed in JMP Pro, version 14.1.0 (SAS Institute Inc, Cary, NC, USA). Two-sided P-values < 0.05 were deemed statistically significant.
RESULTS
Descriptive statistics
From January 2017 to February 2019 a total of 904 patients with stroke symptoms were admitted (Figure 1). Of these, 564 were diagnosed with ischaemic stroke or TIA with symptoms on admission. The mean age was 73 years (SD 13) and 296 (52%) patients were male (Table 1). The median NIHSS on admission was 6 (IQR 3-14). 344 (61%) patients received conservative treatment. This represents a heterogeneous group of patients with on the one hand no indication for thrombolysis or thrombectomy due to the low severity of the stroke and on the other hand patients with severe symptoms and contraindications for treatment. Ninety-six (17%) patients received thrombolysis, 71 (13%) patients underwent thrombectomy and 53 (9%) patients were treated with the combination of thrombolysis and thrombectomy.
One hundred eighty-two (32%) patients suffered a stroke in the anterior cerebral circulation. Twelve (2%) patients had a proximal posterior ischaemic stroke, 280 (50%) had a lacunar infarction and in 90 (16%) patients no large vessel occlusion could be visualized. The validation cohort did not differ from the training cohort for baseline characteristics.
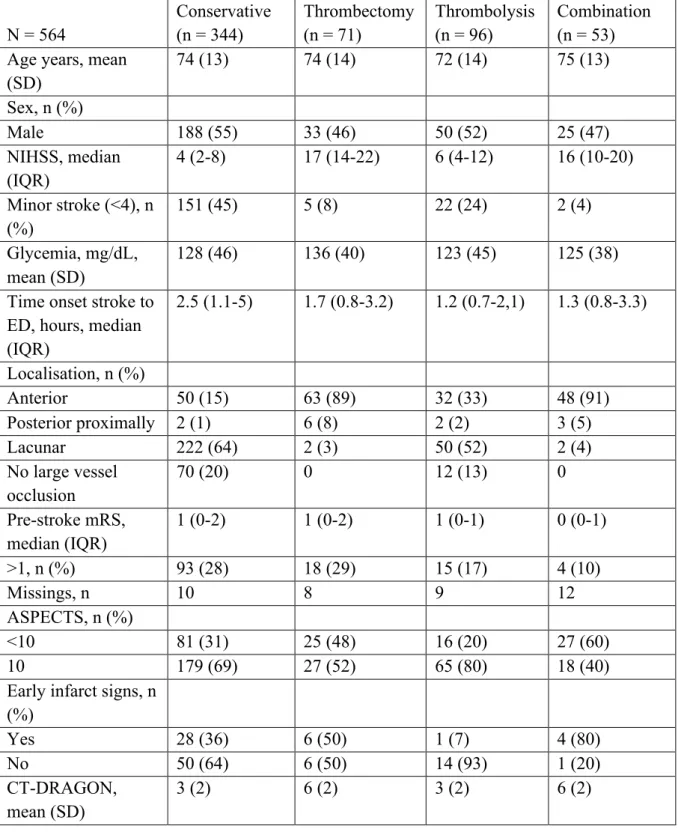
The mean CT-DRAGON score for the whole population was 4±2. The mean CT-DRAGON scores subdivided by treatment group are represented in Table 2. The scores were different between the thrombectomy (± thrombolysis) and the thrombolysis or the conservative treatment group (p < 0.0001).
Figure 1. Flowchart of patients
Inclusion from January 2017 until February 2019
Stroke mimics or intracranial hemorrhage: n = 340 Stroke admission: n = 904 Stroke diagnosis on admission: n = 564 Conservative: n = 344 (61%) Thrombectomy: n = 71 (13%) Thrombolysis: n = 96 (17%) Combination: n = 53 (9%)
Table 1. Baseline patient characteristics N = 564
Missings, n
Age, years, mean (SD) 73 (13)
Sex, n (%)
Male 296 (52)
National Institutes of Health Stroke Scale (NIHSS), median (IQR)
6 (3-14) 29
Glycaemia, mg/dL, mean (SD) 128 (44) 46
Time onset stroke to emergency department (ED) admission, hours, median (IQR)
1.7 (0.9-3.8) 184 Localisation, n (%)
Anterior 182 (32)
Posterior proximally 12 (2)
Lacunar 280 (50)
No large vessel occlusion 90 (16) Pre-stroke modified Rankin Scale score
(mRS), n (%) 39 0 237 (45) 1 158 (30) 2 49 (9) 3 54 (10) 4 19 (4) 5 8 (2)
Alberta Stroke Program Early CT score (ASPECTS), n (%)
<10 149 (34)
Early infarct signs, n (%)
Yes 39 (35)
ASPECTS + early infarct signs, n 16
CT-DRAGON score, mean (SD) 4 (2) 241
Treatment, n (%)
Conservative treatment 344 (61)
Thrombectomy 71 (13)
Thrombolysis 96 (17)
Table 2. Patient characteristics by treatment N = 564 Conservative (n = 344) Thrombectomy (n = 71) Thrombolysis (n = 96) Combination (n = 53) Age years, mean
(SD) 74 (13) 74 (14) 72 (14) 75 (13) Sex, n (%) Male 188 (55) 33 (46) 50 (52) 25 (47) NIHSS, median (IQR) 4 (2-8) 17 (14-22) 6 (4-12) 16 (10-20) Minor stroke (<4), n (%) 151 (45) 5 (8) 22 (24) 2 (4) Glycemia, mg/dL, mean (SD) 128 (46) 136 (40) 123 (45) 125 (38) Time onset stroke to
ED, hours, median (IQR) 2.5 (1.1-5) 1.7 (0.8-3.2) 1.2 (0.7-2,1) 1.3 (0.8-3.3) Localisation, n (%) Anterior 50 (15) 63 (89) 32 (33) 48 (91) Posterior proximally 2 (1) 6 (8) 2 (2) 3 (5) Lacunar 222 (64) 2 (3) 50 (52) 2 (4) No large vessel occlusion 70 (20) 0 12 (13) 0 Pre-stroke mRS, median (IQR) 1 (0-2) 1 (0-2) 1 (0-1) 0 (0-1) >1, n (%) 93 (28) 18 (29) 15 (17) 4 (10) Missings, n 10 8 9 12 ASPECTS, n (%) <10 81 (31) 25 (48) 16 (20) 27 (60) 10 179 (69) 27 (52) 65 (80) 18 (40)
Early infarct signs, n (%) Yes 28 (36) 6 (50) 1 (7) 4 (80) No 50 (64) 6 (50) 14 (93) 1 (20) CT-DRAGON, mean (SD) 3 (2) 6 (2) 3 (2) 6 (2)
While mRS at 3 months was missing in 137 (24%) cases, mortality (16%, mRS 6) was available for all patients (Table 3). 246 (58%) patients had a favorable outcome (mRS 0-2). 84 (19%) patients had a miserable outcome (mRS 5-6).
Table 3. Modified Rankin Scale score at 90 days N = 427 Missings: n = 137 N Proportion 0 97 23% 1 104 24% 2 45 11% 3 44 10% 4 53 12% 5 14 3% 6 70 16%
Development of the proposed simplified score
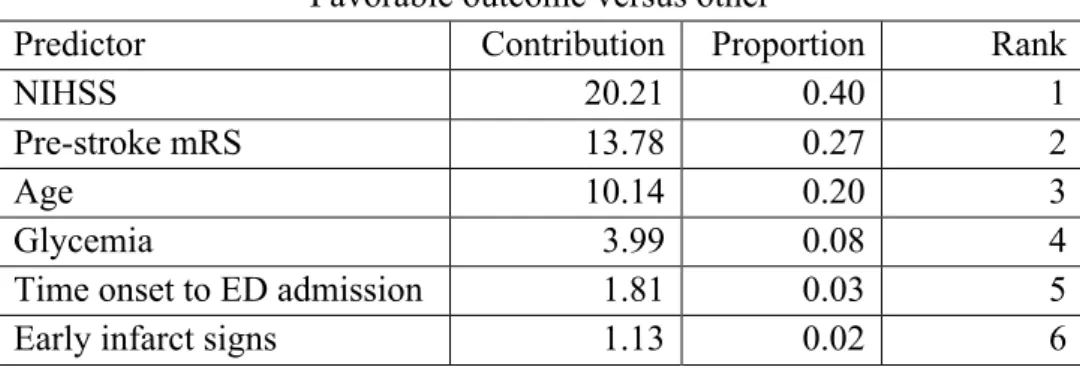
We used three statistical methods to determine which factors of the score contributed most to the prognostics. Logistic regression, bootstrap forest and decision tree analysis showed comparable performance of the individual components in determining both favorable and miserable outcome. Age, NIHSS and pre-stroke mRS were the most predictive parameters from the CT-DRAGON score in all three models, with a proportional contribution to the outcome of 87% for the prediction of favorable outcome and 85% for the prediction of miserable outcome (Table 4).
Table 4. Feature selection by machine learning techniques for favorable and miserable outcome Favorable outcome versus other
Predictor Contribution Proportion Rank
NIHSS 20.21 0.40 1
Pre-stroke mRS 13.78 0.27 2
Age 10.14 0.20 3
Glycemia 3.99 0.08 4
Time onset to ED admission 1.81 0.03 5
Miserable outcome versus other
Predictor Contribution Proportion Rank
NIHSS 14.76 0.43 1
Pre-stroke mRS 9.12 0.27 2
Age 5.03 0.15 3
Glycemia 2.78 0.08 4
Time onset to ED admission 2.18 0.06 5
Early infarct signs 0.40 0.01 6
Analytical statistics
The AUROC for the CT-DRAGON score in predicting favorable outcome was 0.78 (95% CI 0.74-0.81) (Table 5). For predicting miserable outcome, it was 0.78 (95% CI 0.72-0.83). The misclassification rate of the CT-DRAGON in predicting favorable and miserable outcome was 29% and 13.5% respectively. Sensitivity and specificity were 67% and 74% in the prediction of favorable and 10% and 100% in the prediction of miserable outcome. R2 was 0.30 (lack of fit p =
0.91) and 0.22 (lack of fit p = 0.76) for the prediction of favorable and miserable outcome, respectively, by the CT-DRAGON score.
We found a ROC value of 0.82 (95% CI 0.79-0.86) and 0.83 (95% CI 0.77-0.87) in predicting favorable and miserable outcome respectively based on age, NIHSS and pre-stroke mRS (the simplified score). Misclassification rates were 25.8% for favorable and 14.4% for miserable outcome. Sensitivity and specificity were 77% and 73%, respectively, in the prediction of favorable and 23% and 97%, respectively, in the prediction of miserable outcome. R2 was 0.42 (lack of fit p
= 0.34) and 0.29 (lack of fit p = 1.0) for the prediction of favorable and miserable outcome respectively by the simplified score.
For the prediction of favorable and miserable outcome, the AIC was 632 and 397, respectively, based on the CT-DRAGON and 528 and 346, respectively, based on the simplified score.
The simplified score could be calculated in 515 patients (91%) in comparison with the CT-DRAGON score, which could only be determined in 323 patients (57%) (p < 0.001).
Table 5. Area under the receiver operating characteristic curve (AUROC), misclassification rate, sensitivity, specificity, variance and Akaike Information Criterion (AIC) of the CT-DRAGON and the simplified score
Favorable outcome vs. other Miserable outcome vs. other CT-DRAGON score AUROC 0.78 (95% CI 0.74-0.81) Misclassification rate 29% Sensitivity 67% Specificity 74% R2 0.30 AIC 632 AUROC 0.78 (95% CI 0.72-0.83) Misclassification rate 13.5% Sensitivity 10% Specificity 100% R2 0.22 AIC 397 Simplified score AUROC 0.82 (95% CI 0.79-0.86)
Misclassification rate 25.8% Sensitivity 77% Specificity 73% R2 0.42 AIC 528 AUROC 0.83 (95% CI 0.77-0.87) Misclassification rate 14.4% Sensitivity 23% Specificity 97% R2 0.29 AIC 346 DISCUSSION
This study could confirm that the CT-DRAGON score is a useful and validated tool to predict long-term functional outcome after acute ischaemic stroke. Yet the collection of all necessary input data for this score seems challenging in a real-world setting. Dimensionality reduction of the rather complex CT-DRAGON score, using machine learning techniques, yielded a simplified score with similar predictive characteristics. Moreover, the proportion of missing input values to calculate the score decreased dramatically, as the simplified score’s input parameters (age, NIHSS and pre-stroke mRS) can be rapidly obtained by history taking and clinical neurological examination, leading to a much broader implementation potential. The simplified score hence does not depend on radiological findings, which require a specialist’s evaluation.
The original CT-DRAGON score and the simplified score were validated together in a well-controlled single-centre dataset of patients, who suffered from anterior or posterior circulation or lacunar strokes, treated with all modalities, including basic antiplatelet therapy. It has already been shown that discrimination does not differ between anterior and posterior stroke in a large cohort of patients, who received intravenous thrombolysis, with a AUROC of approximately 0.83.(12) A
small study validated the DRAGON score in patients treated with the combination of thrombolysis and thrombectomy.(14) However, neither the AUROC was calculated, nor a development and validation cohort were used. The predictive performance of the CT-DRAGON in the large multicentre Safe Implementation of Thrombolysis in Stroke-International Stroke Thrombolysis Register (SITS-ISTR) showed a similar specificity of 74.1-99.7% for the prediction of good and poor outcome.(13) The CT-DRAGON score also had a better discrimination for miserable outcome (AUROC 0.89) than for good outcome (AUROC 0.79) in a Danish cohort of patients undergoing IV thrombolysis.(15) The predictive performance (AUROC 0.84) of the CT-DRAGON score in a Spanish cohort with more severe strokes was comparable to the latter external validation studies.(16) The discrimination of the CT-DRAGON for good (AUROC 0.73) and miserable (AUROC 0.75) outcome was lower compared to the previous studies and more in line with our study.(17) The lower predictive performance is partially explained by a lower number of patients with high CT-DRAGON scores (> 7). Our study also included many patients with relatively low CT-DRAGON scores, with only 10% of the patients having a CT-DRAGON score of > 7. Taking together the entire body of external validation studies, the CT-DRAGON score can be implemented for the prognostication of functional outcome after acute ischaemic stroke. However, the score seems to perform better in patient with more severe strokes.
Whether the CT-DRAGON score has a better discrimination in patients undergoing thrombectomy, whether or not in combination with thrombolysis, could not be determined in our study, as the number of these patients was too low for subgroup analyses. It can be assumed that the AUROC will at least be in line with the one of the patients undergoing thrombolysis for strokes with higher severity. The study by Ovesen showed that in patients with a M1 occlusion, a typical indication for thrombectomy, the AUROC of the CT-DRAGON score for miserable outcome was 0.89.(15) Despite these merits, the CT-DRAGON is not being applied routinely in daily practice. The lack of availability of some variables at admission and the number of parameters is a potential limitation for clinicians in a usually busy emergency department. This is reflected in the large number of missing values in our data, which excludes patients and their relatives to have benefit from prognostication and which may introduce significant bias into the outcome data. Missing values are rarely random in a clinical context and multiple data imputation to account for missing values,
We therefore used the principle of dimensionality reduction to select the features from the CT-DRAGON score which contribute the most to the predictive power of the original score. The selection of the most predictive parameters - NIHSS, age and pre-stroke modified Rankin Scale - was done by the machine learning techniques logistic regression, decision tree and bootstrap forest. This simplified score could be scored in a larger proportion of the stroke population, increasing its generalizability and applicability in patients suffering from posterior circulation and lacunar strokes as well. Additionally, the simplified score had a better performance, compared to the CT-DRAGON, for the prediction of good and miserable outcome. Due to the limited parameters, the simplified score is less vulnerable to overfitting, reflected by the lower AIC and BIC values. However, the better performance of the simplified score may be biased as missing variables in the CT-DRAGON score were higher, hence impairing its performance. Most likely, the CT-DRAGON would have a better discrimination if all data for the score would be available, which is unfortunately not the case in a real-world setting.
The ‘simple variables model’, using age, pre‐stroke functional status, living alone pre‐stroke, being able to walk unaided, lift both arms off the bed and have a normal verbal Glasgow Coma Score, has also been compared to the CT-DRAGON score.(23) Here the simplified score had a comparable performance for predicting miserable outcome, compared with the CT-DRAGON score. However, its six variables are comparable to the number of variables of the CT-DRAGON score. In contrast, Wouters et al. obtained a similar AUROC for a model using only age and NIHSS in prediction of good outcome (0.82 versus 0.78 in our study).(24) In their study the inclusion of the difference in NIHSS between admission and after 24 hours did not add much predictive power. The variance of NIHSS in the prediction of outcome was 11-25% in the analysis by Rost et al.(25) A slightly better variance for the simplified score was seen in our analysis.
Both the original and the simplified score were much better in predicting miserable outcome with a high specificity. Since none of the prognostic scales are yet incorporated in routine clinical practice, the combination of age, pre-stroke modified Rankin Scale and NIHSS in a simplified score may therefore provide a good alternative. It is immediately available, easier to implement and has a better performance than the original CT-DRAGON, while maintaining an excellent specificity in predicting miserable outcome.
This study has several limitations. The monocentric character and the retrospective analysis of the prospectively collected data prevent to make definitive conclusions on the predictive performance
of the simplified score. Also, the inclusion of the patients who did not receive either thrombolysis or thrombectomy may have affected the performance of both scoring systems, as the reasons for abstinence of therapy have varied strongly. However, the aim of this study was the validation of a score with the knowledge available during the admission to the emergency department. Therefore, the simplified score should still be validated prospectively in a large multicentric study using real-world data. But still then, prediction of outcome at population level, is not equal to its performance in an individual patient. More importantly, it should be assessed which level of uncertainty all stakeholders, such as doctors, nurses, families and the patient him/herself, in the care of patients with acute ischaemic stroke are willing to accept.
In conclusion, a simplified score using the readily obtainable parameters age, pre-stroke functional status and stroke severity, is a promising tool in the prognostication of miserable outcome in stroke patients, receiving all treatments.
H
EALTHCARE-
RELATED COSTS AND ITS ASSOCIATION WITH HOSPITAL-
ACQUIRED INFECTIONS AFTER ACUTE ISCHAEMIC STROKE:
AB
ELGIAN SINGLE-
CENTRE COST-UTILITY STUDY
.
Lesenne A, Chevalier P, Grieten J, Ernon L, Vandermeulen E, Panis E, Mesotten D. (Manuscript submitted to Acta Neurologica Belgica, status: under review)
ABSTRACT
Introduction—Acute ischaemic stroke is associated with important mortality, morbidity and healthcare-related costs. Treatment improvements and the extension of indications for thrombectomy have enlarged the pool of eligible patients for stroke treatment. Therefore, it is hypothesized that, in short-term, stroke severity and pre-stroke functioning are associated with hospital-acquired infections, resulting in prolonged hospitalization and increased healthcare-related costs, irrespective of treatment modalities.
Methods—This single-centre retrospective study included 530 patients treated for ischaemic stroke between January 2017 and February 2019. Antibiotics’ administration was used as a proxy for post-stroke infection. Functional outcome at 90 days was assessed by the modified Rankin Scale (mRS) and converted to quality-adjusted life years (QALY) equivalents. Undiscounted total healthcare costs were recorded for the index hospital stay. Multivariable analysis was done for gender, age, pre-stroke mRS, National Institutes of Health Stroke Scale (NIHSS) and treatment modality.
Results—Median QALY equivalent utility scores were 0.83 (IQR 0.42-0.93) for conservative treatment, 0.93 (IQR 0.42-0.95) for thrombolysis, 0.42 (IQR 0-0.62) for thrombectomy and 0.83 (IQR 0.42-0.93) for the combination (p < 0.0001). Mean total costs were 15374 euro (IQR 3380-18165) and differed between treatment modalities (p < 0.0001). Twenty percent of patients had a post-stroke infection, with a median 90-day mRS of 5 (IQR 3-6) versus 1 (IQR 0-3.5) in patients without infection (p < 0.0001). Mean healthcare-related costs were 31061 euro (IQR 12584-42843) in patients with infection, compared to 11406 euro (IQR 3083-12726) in patients without (p < 0.0001). NIHSS and treatment modality were independent predictors for infection risk and costs.
Conclusions—Hospital admission for acute ischaemic stroke bears high healthcare-related costs. Hospital-acquired infection worsened clinical outcome and increased costs.
INTRODUCTION
Acute ischaemic stroke is associated with a high risk of mortality, morbidity and healthcare-related costs. Globally, it is the second leading cause of death and accounts for an annual 52 million disability-adjusted life years (DALY).(1) In the 27 EU countries, total annual cost of stroke is estimated at 27 billion euro.(26) In the 2016 Burden of Stroke in Europe report, Belgium had a stroke incidence of 50.2 strokes per 100.000 inhabitants annually, representing a healthcare-related cost of 393.7 million euro (35 euro per capita) per year.(27)
Because of the continuous improvement of thrombectomy devices, treatment indications are extended to patients who were previously not eligible. Consequently, in stroke treatment we are confronted with patients with more advanced acute ischaemic stroke and suffering from more comorbidities, poor pre-stroke functioning and eventually complications afterwards.
Due to the aging population, in Europe, by 2035, the incidence of stroke will increase by 34%, mortality from stroke by 45% and the number of DALY lost by 32%, according to the Burden of Stroke in Europe report.(27) The effectiveness of thrombectomy in the elderly is still debatable, due to conflicting evidence.(28, 29) Malhotra et al. showed that the effectiveness of thrombectomy is determined by the comorbidities.(30) Comorbidities and advanced age are also predictors for post-stroke infection.(31) Post-stroke infection is associated with an increased mortalityand is an independent risk factor for poor outcome.(32-34) Prolonged duration of hospitalization and immunological effects of infection could contribute to this worsened long-term functional outcome.(35, 36)
Given the evolving eligibility for expensive stroke therapies of patients, who are older and confronted with more comorbidities, cost-effectiveness analyses with a short-term time horizon may provide us with some insights on the drivers of healthcare-related costs and the value of the
Therefore, in our study, we aimed to investigate if stroke severity and pre-stroke functioning are associated with an increased risk of post-stroke infection and thus increased risk of poor functional and economic outcome despite appropriate treatment.
METHODS Data collection
This retrospective cost-utility study included patients admitted with an acute ischaemic stroke or a transient ischaemic attack with symptoms to the emergency department of Ziekenhuis Oost-Limburg Genk, Genk, Belgium from January 2017 until February 2019. Previously published methodological guidelines were considered.(37-39) All direct healthcare-related costs were calculated by using a bottom-up approach. The cost data were not inflation-adjusted. Financial and drug utilization data were prospectively collected and verified automatically by the billing and warehousing collaborators according to their standard operating procedures. All costs were retrieved from the individual patient invoices simultaneously for the entire study population by using the data warehousing system. For costs that were not included in the patients’ invoice, a daily cost was calculated, based on resource use (operating room, intensive care, general ward). No distinction was made between costs borne by the health insurance and the individual patient co-payments. Only direct healthcare expenses, reflected by the official, nationally fixed, tariffs were included. The perspective of the healthcare payer is recommended in the Belgian pharmaco-economic guidelines and allows a precise cost data analysis based on patient invoices.(40)
Invoices were based on price rates for three different years. Since price fluctuations of measured cost elements were relatively small, no adjustment was made for the price variations during the course of the clinical study. The time horizon for establishing costs was the entire index hospital stay. Therefore, opportunity costs and costs generated in hospitals or rehabilitation centres, to which the patient was referred from the index hospital, were not taken into account. Since the time horizon was less than one year, neither costs nor clinical effects were discounted. Cost data were divided into six categories: (1) hospitalization costs, (2) procedural costs, (3) drug costs, (4) lab costs, (5) imaging costs and (6) honoraria. Total costs were calculated by the sum of all the above. All costs were reported in euro, rounded at zero decimals.
Functional outcome at 3 months was assessed by the mRS. These scores were transformed into QALY equivalents based on the study by Dijkland et al.(41) Index hospital mortality and length of index hospital stay were determined as well.
Stroke severity was derived from the NIHSS: a minor stroke was defined by a NIHSS of less than 4, a moderate stroke by a NIHSS of 4 to 14 and a severe stroke by a NIHSS of more than 14. Baseline risk factors for outcome were gender, age, pre-stroke mRS, NIHSS and treatment modality (conservative treatment, thrombolysis, thrombectomy or the combination of thrombolysis and thrombectomy). These factors were also used to identify drivers of costs through multivariable analysis.
Antibiotic administration during hospitalization was used as a proxy to estimate the incidence of infections and its impact on length of index hospital stay, functional outcome and costs. Antibiotic administration in stroke patients was recorded by a programmed search in the electronic patient files and the administrative data warehousing system, using the Anatomical Therapeutic Chemical (ATC)-coding J01 (antibacterials for systemic use). Cefazoline (ATC J01DB04), as well as J02 (antimycotics), J04 (antimycobacterials) and J05 (antivirals) were not included in the search. Only antibiotics administered within the index hospital stay (ICU and general ward) until 90 days after stroke were used as a proxy for hospital-acquired infection. Pre-admission antibiotic use was omitted. A single dose of antibiotics was not regarded as a therapy for infection. Infections were classified in the following categories: pneumonia, urinary tract infection, COPD-exacerbation, abdominal infection, other infections and unknown focus. Antibiotics were divided in 11 classes: amoxicillin-clavulanic acid, amoxicillin, nitrofurantoin, doxycycline, vancomycin, fluoroquinolones, aminoglycoside, azithromycin, cefuroxime, and broad-spectrum antibiotics (3rd
and 4th generation cephalosporins, meropenem and piperacillin-tazobactam). Duration of antibiotic
administration and time from admission to start of administration were reported.
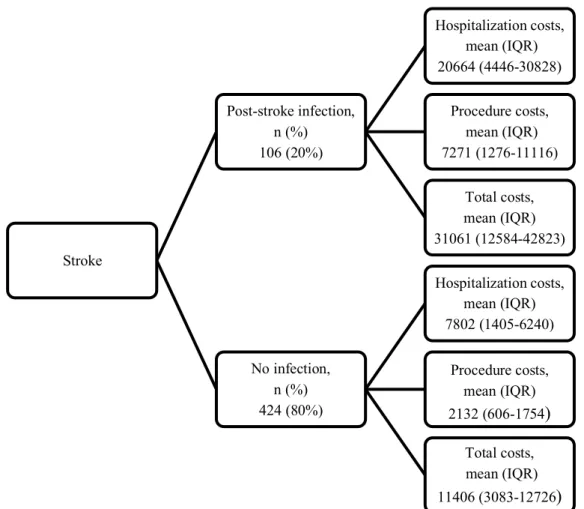
Cost tree
A cost tree enabled further interpretation of the effect of infection on costs.(42) The first branch shows the proportion of patients with a post-stroke hospital-acquired infection and those without. Hospitalization, procedural and total costs are displayed in the second branch as mean (IQR).
Statistical analyses
All variables were tested for normality of data distribution. Normally distributed data were represented as mean (SD) and compared by Student’s t-test/one-way ANOVA, while skewed data were represented as median (IQR) and compared by the Wilcoxon signed rank/Kruskal-Wallis test. Total costs were represented as mean (IQR) and compared by both parametric and non-parametric testing.
Total costs and infection risk were analyzed multivariably by age, gender, NIHSS, pre-stroke mRS and treatment. For costs, a generalized linear model with a gamma (exponential) distribution and a log link function was used. Effects were reported as estimates with corresponding confidence intervals and p-values. A logistic regression model was utilized for infection risk, reported as odds ratios with corresponding confidence intervals and p-values.
Incremental Cost-Effectiveness Ratios (ICERs) associated to each treatment modality were calculated. In this cost-utility analysis, ICERs are synonymous with the cost per QALY.
Two-sided p-values of < 0.05 were deemed statistically significant. Analyses were conducted in JMP, version 15.0.0 (SAS Institute Inc, Cary, NC, USA).
RESULTS
Baseline characteristics
From January 2017 to February 2019, 564 patients were treated for acute ischaemic stroke or transient ischaemic attack with symptoms on admission. Healthcare-related costs and antibiotic data were present in 530 patients. The mean age was 73.5 years (SD 13.5) and 274 (52%) patients were male. 76% of patients had a pre-stroke mRS of 0 or 1. 34% of patients suffered a minor, 41% a moderate and 25% a severe stroke. 322 (61%) patients received conservative treatment. 94 (18%) patients required thrombolysis, 64 (12%) underwent thrombectomy and 50 (9%) patients were treated with the combination of thrombectomy and thrombolysis.
Clinical outcome
Overall, 90-day mortality was 16% (Table 1). Median mRS at 90 days was 2 (IQR 1-4). Median length of index hospital stay was 7 days (IQR 3-23). 90-day mRS differed between stroke severity
groups: median 1 (IQR 0-2) for minor stroke, 2 (IQR 1-4) for moderate and 4 (IQR 3-6) for severe stroke (p < 0.0001). 90-day mortality and mRS were 34% and median 4 (IQR 3-6) in patients with a pre-stroke mRS of more than 1 versus 8% and 1 (IQR 0-3) in those with a pre-stroke mRS of 0 or 1 (both p < 0.0001).
Ninety-day median QALY equivalent utility scores were 0.83 (IQR 0.42-0.93) for conservative treatment, 0.93 (IQR 0.42-0.95) for thrombolysis, 0.42 (IQR 0-0.62) for thrombectomy and 0.83 (IQR 0.42-0.93) for the combined treatment (both p < 0.0001).
Table 1. Outcomes by treatment modality
Overall Conservative treatment Thrombolysis Thrombecto my Combination 90-day mortality, n (%) 87 (16) 46 (14) 46 (14) 21 (33) 8 (16) 90-day modified Rankin Scale (mRS), median (IQR) 2 (1-4) 2 (1-4) 1 (0-4) 4 (3-6) 2 (1-4) Length of index hospital stay, days, median (IQR) 7 (3-23) 20 (3-19) 18 (3-17) 27 (3-40) 30 (3-47) Utility scores, median (IQR) 0.83 (0.42-0.93) 0.83 (0.42-0.93) 0.93 (0.42-0.95) 0.42 (0-0.62) 0.83 (0.42-0.93) Total costs, euro, mean (IQR) 15374 (3380-18165) 12424 (2925-13114) 11682 (3175-11143) 25822 (12219-35805) 28251 (12691-35631) Cost analysis
Mean total costs were 15374 euro (IQR 3380-18165) (Table 1). Hospitalization costs (mean 10937 euro, IQR 1977-12349) represented 71% of total costs compared with procedural costs (3160 euro, IQR 640-2840), imaging (466 euro, IQR 334-534), drug costs (313 euro, IQR 116-327), honoraria (284 euro, IQR 110-389) and lab costs (119 euro, IQR 22-120).
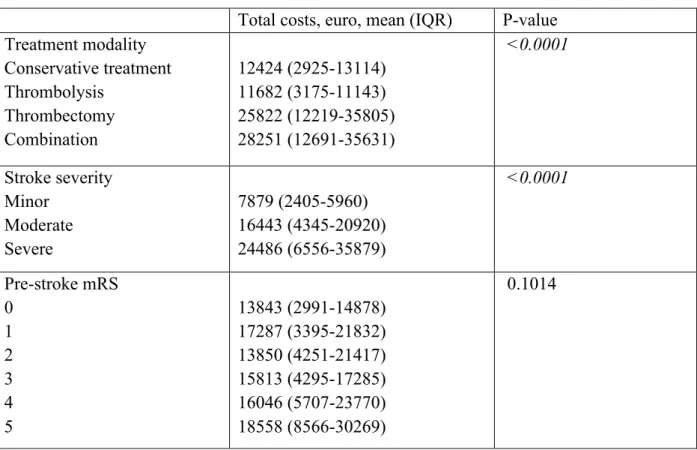
The mean total costs differed between stroke severity groups (p < 0.0001), but not by pre-stroke mRS (Table 2).
Table 2. Univariable analysis by treatment modality, stroke severity and pre-stroke modified Rankin Scale
Total costs, euro, mean (IQR) P-value
Treatment modality Conservative treatment Thrombolysis Thrombectomy Combination 12424 (2925-13114) 11682 (3175-11143) 25822 (12219-35805) 28251 (12691-35631) <0.0001 Stroke severity Minor Moderate Severe 7879 (2405-5960) 16443 (4345-20920) 24486 (6556-35879) <0.0001 Pre-stroke mRS 0 1 2 3 4 5 13843 (2991-14878) 17287 (3395-21832) 13850 (4251-21417) 15813 (4295-17285) 16046 (5707-23770) 18558 (8566-30269) 0.1014
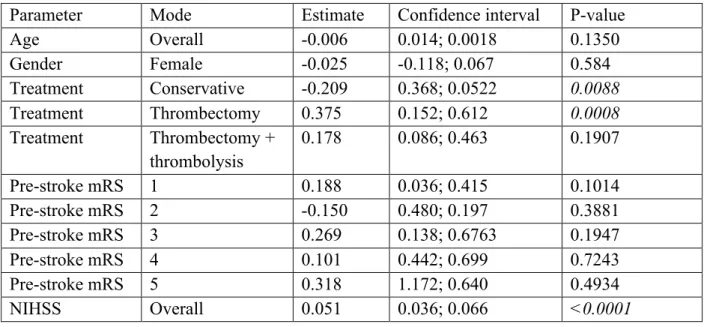
Through multivariable analysis with the five predefined baseline variables, treatment modality remained a predictor of total costs, even when controlling for the predefined covariables (Table 3).
Table 3. Multivariable model for total costs
Parameter Mode Estimate Confidence interval P-value
Age Overall -0.006 0.014; 0.0018 0.1350 Gender Female -0.025 -0.118; 0.067 0.584 Treatment Conservative -0.209 0.368; 0.0522 0.0088 Treatment Thrombectomy 0.375 0.152; 0.612 0.0008 Treatment Thrombectomy + thrombolysis 0.178 0.086; 0.463 0.1907 Pre-stroke mRS 1 0.188 0.036; 0.415 0.1014 Pre-stroke mRS 2 -0.150 0.480; 0.197 0.3881 Pre-stroke mRS 3 0.269 0.138; 0.6763 0.1947 Pre-stroke mRS 4 0.101 0.442; 0.699 0.7243 Pre-stroke mRS 5 0.318 1.172; 0.640 0.4934 NIHSS Overall 0.051 0.036; 0.066 <0.0001 Cost-utility analysis
Thrombolysis was identified as dominant over no intervention with lower costs of 742 euro per increasing QALY of 0.01. Conservative treatment dominated the other treatment modalities (e.g. thrombectomy and the combination of thrombolysis and thrombectomy) regarding cost-effectiveness. Increased costs of 13398 euro per decreasing QALY of 0.07 for thrombectomy and 15827 euro per decreasing QALY of 0.004 for the combination were found.
Table 4. Incremental cost-effectiveness ratios (ICER)
Incremental cost Incremental QALY ICER Thrombolysis versus conservative treatment -742 0.01 Dominant Thrombectomy versus conservative treatment 13398 -0.07 Dominated Combination versus conservative treatment 15827 -0.004 Dominated Infection
days (IQR 3-7). 54% of patients received amoxicillin-clavulanic acid. Mortality at 90 days was 39% in patients with infection versus 11% in patients without (p<0.0001). Length of index hospital stay was median 25 days (IQR 7-62) in patients with infection and 6 days (IQR 3-13) in patients without (p < 0.0001). Median 90-day mRS in patients with and without infection were respectively 5 (IQR 3-6) and 1 (IQR 0-3.5) (p < 0.0001). Mean healthcare-related costs in patients with and without infection were respectively 31061 (IQR 12584-42843) and 11406 euro (IQR 3083-12726) (p < 0.0001) (Figure 1).
Figure 1. Cost tree (cost allocation in the form of a decision tree)
Patients with an infection had higher NIHSS (14, IQR 6-21, versus 5, IQR 2-12), age (77±11 years versus 72±14 years) and poorer pre-stroke functioning (mRS>1) (35 versus 22%), than those without an infection (all p < 0.0078). Infection rate in patients receiving thrombectomy, alone
Stroke Post-stroke infection, n (%) 106 (20%) Hospitalization costs, mean (IQR) 20664 (4446-30828) Procedure costs, mean (IQR) 7271 (1276-11116) Total costs, mean (IQR) 31061 (12584-42823) No infection, n (%) 424 (80%) Hospitalization costs, mean (IQR) 7802 (1405-6240) Procedure costs, mean (IQR) 2132 (606-1754) Total costs, mean (IQR) 11406 (3083-12726)
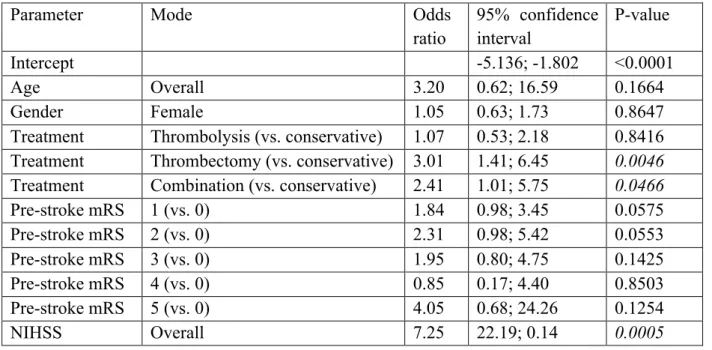
(42%) or in combination with thrombolysis (38%) was higher in comparison with patients treated by thrombolysis (15%) or conservative treatment (14%) (p < 0.0001). Multivariable analysis showed that NIHSS and treatment modality were independent predictors for infection (Table 5) Table 5. Multivariable model for risk of infection
Parameter Mode Odds
ratio 95% confidence interval P-value Intercept -5.136; -1.802 <0.0001 Age Overall 3.20 0.62; 16.59 0.1664 Gender Female 1.05 0.63; 1.73 0.8647
Treatment Thrombolysis (vs. conservative) 1.07 0.53; 2.18 0.8416 Treatment Thrombectomy (vs. conservative) 3.01 1.41; 6.45 0.0046 Treatment Combination (vs. conservative) 2.41 1.01; 5.75 0.0466
Pre-stroke mRS 1 (vs. 0) 1.84 0.98; 3.45 0.0575 Pre-stroke mRS 2 (vs. 0) 2.31 0.98; 5.42 0.0553 Pre-stroke mRS 3 (vs. 0) 1.95 0.80; 4.75 0.1425 Pre-stroke mRS 4 (vs. 0) 0.85 0.17; 4.40 0.8503 Pre-stroke mRS 5 (vs. 0) 4.05 0.68; 24.26 0.1254 NIHSS Overall 7.25 22.19; 0.14 0.0005 DISCUSSION
This single-centre Belgian micro-costing study found that high stroke severity, poor pre-stroke functioning and thrombectomy are associated with hospital-acquired infections, prolonged hospitalization, poorer functional outcome and increased healthcare-related costs.
In contrast to our hypothesis, treatment modality of stroke remained an independent factor for risk of infection and healthcare-related costs. Thrombectomy, whether or not in combination with thrombolysis, was associated with poorer cost-utility ratios in the short time horizon of 3 months. While the balance between cost and outcome may shift in a favorable way in the long term for thrombectomy, this expensive treatment for stroke may benefit from a careful patient selection on the basis of stroke severity and functional status before the stroke in order to remain cost-effective.
stroke and underwent thrombectomy may also be a worthwhile option to strive for cost-effectiveness in this vulnerable patient population.
Indeed, a fifth of our patients developed a post-stroke infection with documented pneumonia being the most common underlying cause, which is in line with other studies.(34, 35, 43) Age and NIHSS score were the common risk factors for post-stroke infection in our and previous studies.(31, 32, 35, 44) Dysphagia, diabetes, mechanical ventilation, COPD and atrial fibrillation were described as additional risk factors in the latter studies. So far, no association between pre-stroke mRS and post-stroke infection has been made. No subgroup analyses for the correlation between these comorbidities (need for mechanical ventilation, COPD, diabetes) and infection were done, as the size of our patient population was too small. While Learoyd et al. found no association between late-onset (up to 76 days) post-stroke infection and mortality or functional outcome, our and other studies showed that pneumonia within days after stroke has a negative impact on outcome.(33-35) The three-fold increase in healthcare-related costs in patients, who contracted a post-stroke infection, are consistent with the findings of Ali et al, where costs with and without infection were respectively 14371 GBP (16979 euro) versus 6103 GBP (7211 euro).(45)
The association between post-stroke hospital-acquired infection and thrombectomy, even after correction for the strong covariates’ pre-stroke functioning and stroke severity, was not observed in other studies.(46)
Cost-effectiveness of thrombectomy in addition to thrombolysis was proven in simulation studies using long-term-Markov models with ICERs varying from 14016 euro to 124419 euro.(47) Time-horizon had the largest impact on these ICERs. A willingness to pay threshold was suggested by two studies with an estimated cost-effectiveness ratio of 30000 euro per QALY in France and 100000 US dollar (92123 euro) per QALY in the United States.(48, 49) No willingness to pay threshold has so far been implemented in Belgium. In our study, with a time horizon of only 3 months, thrombectomy was always dominated by or cost-ineffective in comparison with thrombolysis. Simpson et al. also found short-term ICER for severe and moderately severe stroke of 97303 US dollar (88865 euro) per QALY and 3187805 US dollar (2911374 euro) per QALY, respectively. Baseline risk factors such as stroke severity, pre-stroke functioning and age may play a role in the eventual effectiveness of thrombectomy.(47, 50) Age is still a debatable cost-driver due to inconsistent evidence.(28, 47, 49)
This study has several limitations. First, the single-centre character and the retrospective analysis of the prospectively collected data preclude definitive conclusions on cost-effectiveness and impact of post-stroke hospital-acquired infections. Prospective validation in large multicentre studies in different healthcare systems should be done. Second, the time horizon of such cost-effectiveness studies should be extended to at least one year in order to allow the possibility of full recovery and to assess potential longer-term benefits of the different treatment options, that might not have been captured in the current study. Quality of rehabilitation and social home network may play an underestimated role in the outcome of stroke. Third, the association between treatment modality and cost-effectiveness is most likely influenced by confounders that were not in the equation in this study.
In conclusion, our study confirmed the impact of post-stroke infection on mortality, morbidity and healthcare-related costs. Setting the right indication for expensive treatments such as thrombectomy may need to take into account more baseline patient centered variables, such as pre-stroke functioning and pre-stroke grade, in order to remain cost-effective.
REFERENCES
1. Global, regional, and national burden of stroke, 1990-2016: a systematic analysis for the Global Burden of Disease Study 2016. Lancet Neurol. 2019;18(5):439-58.
2. Drozdowska BA, Singh S, Quinn TJ. Thinking About the Future: A Review of Prognostic Scales Used in Acute Stroke. Front Neurol. 2019;10:274.
3. Goyal M, Demchuk AM, Menon BK, Eesa M, Rempel JL, Thornton J, et al. Randomized assessment of rapid endovascular treatment of ischemic stroke. N Engl J Med. 2015;372(11):1019-30.
4. Jovin TG, Chamorro A, Cobo E, de Miquel MA, Molina CA, Rovira A, et al. Thrombectomy within 8 hours after symptom onset in ischemic stroke. N Engl J Med. 2015;372(24):2296-306.
5. Nogueira RG, Jadhav AP, Haussen DC, Bonafe A, Budzik RF, Bhuva P, et al. Thrombectomy 6 to 24 Hours after Stroke with a Mismatch between Deficit and Infarct. N Engl J Med. 2018;378(1):11-21.
6. Saver JL, Goyal M, Bonafe A, Diener HC, Levy EI, Pereira VM, et al. Stent-retriever thrombectomy after intravenous t-PA vs. t-PA alone in stroke. N Engl J Med. 2015;372(24):2285-95.
7. Berkhemer OA, Fransen PS, Beumer D, van den Berg LA, Lingsma HF, Yoo AJ, et al. A randomized trial of intraarterial treatment for acute ischemic stroke. N Engl J Med. 2015;372(1):11-20.
8. Campbell BC, Mitchell PJ, Kleinig TJ, Dewey HM, Churilov L, Yassi N, et al. Endovascular therapy for ischemic stroke with perfusion-imaging selection. N Engl J Med. 2015;372(11):1009-18.
9. Albers GW, Marks MP, Kemp S, Christensen S, Tsai JP, Ortega-Gutierrez S, et al. Thrombectomy for Stroke at 6 to 16 Hours with Selection by Perfusion Imaging. N Engl J Med. 2018;378(8):708-18.
10. Fahey M, Crayton E, Wolfe C, Douiri A. Clinical prediction models for mortality and functional outcome following ischemic stroke: A systematic review and meta-analysis. PLoS One. 2018;13(1):e0185402.
11. Strbian D, Meretoja A, Ahlhelm FJ, Pitkaniemi J, Lyrer P, Kaste M, et al. Predicting outcome of IV thrombolysis-treated ischemic stroke patients: the DRAGON score. Neurology. 2012;78(6):427-32.
12. Strbian D, Seiffge DJ, Breuer L, Numminen H, Michel P, Meretoja A, et al. Validation of the DRAGON score in 12 stroke centers in anterior and posterior circulation. Stroke. 2013;44(10):2718-21.
13. Cooray C, Mazya M, Bottai M, Dorado L, Skoda O, Toni D, et al. External Validation of the ASTRAL and DRAGON Scores for Prediction of Functional Outcome in Stroke. Stroke. 2016;47(6):1493-9.
14. Wang A, Pednekar N, Lehrer R, Todo A, Sahni R, Marks S, et al. DRAGON score predicts functional outcomes in acute ischemic stroke patients receiving both intravenous tissue plasminogen activator and endovascular therapy. Surg Neurol Int. 2017;8:149.
15. Ovesen C, Christensen A, Nielsen JK, Christensen H. External validation of the ability of the DRAGON score to predict outcome after thrombolysis treatment. J Clin Neurosci. 2013;20(11):1635-6.
16. Giralt-Steinhauer E, Rodriguez-Campello A, Cuadrado-Godia E, Ois A, Jimenez-Conde J, Soriano-Tarraga C, et al. External validation of the DRAGON score in an elderly Spanish population: prediction of stroke prognosis after IV thrombolysis. Cerebrovasc Dis. 2013;36(2):110-4.
17. Zhang X, Liao X, Wang C, Liu L, Wang C, Zhao X, et al. Validation of the DRAGON Score in a Chinese Population to Predict Functional Outcome of Intravenous Thrombolysis-Treated Stroke Patients. J Stroke Cerebrovasc Dis. 2015;24(8):1755-60.
18. Turc G, Apoil M, Naggara O, Calvet D, Lamy C, Tataru AM, et al. Magnetic Resonance Imaging-DRAGON score: 3-month outcome prediction after intravenous thrombolysis for anterior circulation stroke. Stroke. 2013;44(5):1323-8.
19. Turc G, Aguettaz P, Ponchelle-Dequatre N, Henon H, Naggara O, Leclerc X, et al. External validation of the MRI-DRAGON score: early prediction of stroke outcome after intravenous thrombolysis. PLoS One. 2014;9(6):e99164.
20. Ben Hassen W, Raynaud N, Bricout N, Boulouis G, Legrand L, Ferrigno M, et al. MT-DRAGON score for outcome prediction in acute ischemic stroke treated by mechanical thrombectomy within 8 hours. J Neurointerv Surg. 2019.
21. Lundervold AS, Lundervold A. An overview of deep learning in medical imaging focusing on MRI. Z Med Phys. 2019;29(2):102-27.
22. Soffer S, Ben-Cohen A, Shimon O, Amitai MM, Greenspan H, Klang E. Convolutional Neural Networks for Radiologic Images: A Radiologist's Guide. Radiology. 2019;290(3):590-606. 23. Seiffge DJ, Karagiannis A, Strbian D, Gensicke H, Peters N, Bonati LH, et al. Simple variables predict miserable outcome after intravenous thrombolysis. Eur J Neurol. 2014;21(2):185-91.
24. Wouters A, Nysten C, Thijs V, Lemmens R. Prediction of Outcome in Patients With Acute Ischemic Stroke Based on Initial Severity and Improvement in the First 24 h. Front Neurol. 2018;9:308.
25. Rost NS, Bottle A, Lee JM, Randall M, Middleton S, Shaw L, et al. Stroke Severity Is a Crucial Predictor of Outcome: An International Prospective Validation Study. J Am Heart Assoc. 2016;5(1).
26. Di Carlo A. Human and economic burden of stroke. Age Ageing. 2009;38(1):4-5.
27. King's College London for the Stroke Alliance for the Stroke Alliance for Europe. The
Burden of Stroke in Europe 2016 [Available from:
https://www.stroke.org.uk/sites/default/files/the_burden_of_stroke_in_europe_-_challenges_for_policy_makers.pdf.
28. Kunz WG, Hunink MG, Sommer WH, Beyer SE, Meinel FG, Dorn F, et al. Cost-Effectiveness of Endovascular Stroke Therapy: A Patient Subgroup Analysis From a US Healthcare Perspective. Stroke. 2016;47(11):2797-804.
29. Alawieh A, Starke RM, Chatterjee AR, Turk A, De Leacy R, Rai AT, et al. Outcomes of endovascular thrombectomy in the elderly: a 'real-world' multicenter study. J Neurointerv Surg. 2019;11(6):545-53.
30. Malhotra A, Wu X, Payabvash S, Matouk CC, Forman HP, Gandhi D, et al. Comparative Effectiveness of Endovascular Thrombectomy in Elderly Stroke Patients. Stroke. 2019;50(4):963-9.
32. Bustamante A, Giralt D, Garcia-Berrocoso T, Rubiera M, Alvarez-Sabin J, Molina C, et al. The impact of post-stroke complications on in-hospital mortality depends on stroke severity. Eur Stroke J. 2017;2(1):54-63.
33. Learoyd AE, Woodhouse L, Shaw L, Sprigg N, Bereczki D, Berge E, et al. Infections Up to 76 Days After Stroke Increase Disability and Death. Transl Stroke Res. 2017;8(6):541-8. 34. Vermeij FH, Scholte op Reimer WJ, de Man P, van Oostenbrugge RJ, Franke CL, de Jong G, et al. Stroke-associated infection is an independent risk factor for poor outcome after acute ischemic stroke: data from the Netherlands Stroke Survey. Cerebrovasc Dis. 2009;27(5):465-71. 35. Westendorp WF, Nederkoorn PJ, Vermeij JD, Dijkgraaf MG, van de Beek D. Post-stroke infection: a systematic review and meta-analysis. BMC Neurol. 2011;11:110.
36. Chamorro A, Urra X, Planas AM. Infection after acute ischemic stroke: a manifestation of brain-induced immunodepression. Stroke. 2007;38(3):1097-103.
37. Drummond MF, Jefferson TO. Guidelines for authors and peer reviewers of economic submissions to the BMJ. The BMJ Economic Evaluation Working Party. Bmj. 1996;313(7052):275-83.
38. Understanding costs and cost-effectiveness in critical care: report from the second American Thoracic Society workshop on outcomes research. Am J Respir Crit Care Med. 2002;165(4):540-50.
39. Ramsey S, Willke R, Briggs A, Brown R, Buxton M, Chawla A, et al. Good research practices for cost-effectiveness analysis alongside clinical trials: the ISPOR RCT-CEA Task Force report. Value Health. 2005;8(5):521-33.
40. Belgian Health Care Knowledge Centre. Jaarverslag 2008 Federaal Kenniscentrum voor de
Gezondheidszorg 2008 [Available from:
https://www.kce.fgov.be/sites/default/files/atoms/files/1783-4112-08.pdf.
41. Dijkland SA, Voormolen DC, Venema E, Roozenbeek B, Polinder S, Haagsma JA, et al. Utility-Weighted Modified Rankin Scale as Primary Outcome in Stroke Trials: A Simulation Study. Stroke. 2018;49(4):965-71.
42. Vanderheyden S, Casaer MP, Kesteloot K, Simoens S, De Rijdt T, Peers G, et al. Early versus late parenteral nutrition in ICU patients: cost analysis of the EPaNIC trial. Crit Care. 2012;16(3):R96.
43. Badve MS, Zhou Z, van de Beek D, Anderson CS, Hackett ML. Frequency of post-stroke pneumonia: Systematic review and meta-analysis of observational studies. Int J Stroke. 2019;14(2):125-36.
44. Ashour W, Al-Anwar AD, Kamel AE, Aidaros MA. Predictors of early infection in cerebral ischemic stroke. J Med Life. 2016;9(2):163-9.
45. Ali AN, Howe J, Majid A, Redgrave J, Pownall S, Abdelhafiz AH. The economic cost of stroke-associated pneumonia in a UK setting. Top Stroke Rehabil. 2018;25(3):214-23.
46. Balami JS, White PM, McMeekin PJ, Ford GA, Buchan AM. Complications of endovascular treatment for acute ischemic stroke: Prevention and management. Int J Stroke. 2018;13(4):348-61.
47. Xie X, Lambrinos A, Chan B, Dhalla IA, Krings T, Casaubon LK, et al. Mechanical thrombectomy in patients with acute ischemic stroke: a cost-utility analysis. CMAJ Open. 2016;4(2):E316-25.
48. Kabore N, Marnat G, Rouanet F, Barreau X, Verpillot E, Menegon P, et al. Cost-effectiveness analysis of mechanical thrombectomy plus tissue-type plasminogen activator
compared with tissue-type plasminogen activator alone for acute ischemic stroke in France. Rev Neurol (Paris). 2019;175(4):252-60.
49. Simpson KN, Simpson AN, Mauldin PD, Hill MD, Yeatts SD, Spilker JA, et al. Drivers of costs associated with reperfusion therapy in acute stroke: the Interventional Management of Stroke III Trial. Stroke. 2014;45(6):1791-8.
50. Simpson KN, Simpson AN, Mauldin PD, Palesch YY, Yeatts SD, Kleindorfer D, et al. Observed Cost and Variations in Short Term Cost-Effectiveness of Therapy for Ischemic Stroke in Interventional Management of Stroke (IMS) III. J Am Heart Assoc. 2017;6(5)
NEDERLANDSTALIGESAMENVATTING
Ischemisch cerebrovasculair accident (CVA) of beroerte is wereldwijd de tweede grootste oorzaak van mortaliteit na ischemisch hartlijden. Beroerte leidt bovendien ook tot ernstige morbiditeit en daarmee geassocieerde uitgaven voor de gezondheidszorg.
Gelukkig zijn over de voorbije jaren de behandelingsmogelijkheden niet alleen sterk verbeterd, ze kennen nu ook een bredere toepassing door uitbreiding van de indicaties. Vooral de mechanische arteriële thrombectomie laat toe dat patiënten met een zeer laattijdige presentatie van beroerte, zoals bij een wake-up stroke, nog behandeld kunnen worden. Tegelijkertijd speelt er zich een tweede evolutie op de achtergrond af. Door de stijgende levensverwachting dragen de beroertepatiënten meer comorbiditeiten met zich mee, waardoor hun frailty sterk is toegenomen. De impact hiervan op de functionele uitkomst na beroerte op de lange termijn is nog niet helemaal duidelijk. Om de uitkomst van beroertebehandeling tussen verschillende centra te benchmarken in het kader van pay-for-performance programma’s zal in de toekomst rekening gehouden moeten worden met de ernst van acute beroerte en de chronische comorbiditeiten om een juiste correctie voor case-mix van de patiëntenpopulaties te kunnen doen.
Daarom zou het waardevol zijn vroegtijdig en accuraat functionele outcome te voorspellen, dit enerzijds om patiënten en familie juister te informeren en anderzijds om therapiebeleid richting zinvolle zorg te sturen. Prognostische scoresystemen zoals de CT-DRAGON en de ASTRAL score worden echter zeer beperkt aangewend in de klinische praktijk. De reden hiervoor is het grote aantal parameters in de scores, die bovendien niet meteen beschikbaar zijn, en een gebrek aan validatie in het brede spectrum van beroertes en zijn behandelingen. Ter illustratie, de CT-DRAGON score bestaat uit zeven variabelen, waarvoor onder andere een gespecialiseerd radiologisch protocol en een labowaarde vereist zijn.
In dit thesisonderzoek willen we vanuit deze bestaande prognostische scores de belangrijkste factoren voor de functionele uitkomst na acute ischemische beroerte, onder alle beschikbare behandelingsmogelijkheden, definiëren. Door het aantal parameters in de originele score te reduceren aan de hand van selectie van de meest predictieve variabelen, beogen we de implementeerbaarheid ervan in de kliniek te verhogen. De werkhypothese is dat de functionaliteit vóór de beroerte volgens de modified Rankin Scale (mRS), samen met de ernst van de beroerte
volgens de NIH Stroke Scale (NIHSS), de sterkste predictoren voor functionele uitkomst en gezondheidszorgkosten zijn.
De CT-DRAGON score werd retrospectief gevalideerd bij 564 patiënten die zich aanmeldden met een beroerte of een transiënte ischemische aanval in het Ziekenhuis Oost-Limburg Genk tussen januari 2017 en februari 2019. Behandelingsmodaliteiten waren conservatieve therapie, trombolyse, trombectomie en de combinatie van trombectomie en trombolyse. Functionaliteit na 3 maanden werd gecategoriseerd in gunstige (mRS 0-2) en slechte outcome (mRS 5-6). Gezondheidszorg-gerelateerde kosten tijdens de index hospitalisatie werden eveneens geanalyseerd volgens het healthcare payer perspectief. Toegediende antibiotica werden gebruikt als een surrogaat voor het meten van nosocomiale infecties tijdens hospitalisatie na een beroerte. De vereenvoudigde prognostische modellen werden gebouwd op basis van de CT-DRAGON via sequentiële selectie aan de hand van logistische regressie, decision tree en bootstrap forest analyse, machine learning technieken. De combinatie NIHSS, leeftijd en mRS voor de beroerte – de simplified score – bleek het meest voorspellend voor zowel gunstige als slechte outcome. De area under the receiver operating characteristic curve (AUROC) was 0.82 en 0.83 respectievelijk voor gunstige en slechte uitkomst en hoger in vergelijking met de AUROC van 0.78 en 0.78 van de volledige CT-DRAGON. Het grote voordeel is dat die variabelen meteen na anamnese en klinisch onderzoek voorhanden zijn.
De mRS na 3 maanden werd vervolgens omgezet naar quality-adjusted life years (QALY) equivalenten en waren respectievelijk 0.83 voor conservatieve behandeling, 0.93 voor thrombolyse, 0.42 voor thrombectomie en 0.83 voor de combinatie. Gemiddelde totale gezondheidszorg-gerelateerde kosten bedroegen 15374 euro en waren hoger indien de patiënt een thrombectomie onderging. Twintig percent van de patiënten deed een nosocomiale, meestal luchtweg infectie, hetgeen resulteert in een verdubbeling van de gezondheidszorg-gerelateerde kosten. NIHSS en behandelingsmodaliteit waren de sterkste prognostische factoren voor infectierisico en kosten.
Samenvattend kunnen we stellen dat met de eenvoudige, klinische parameters NIHSS en mRS voor de beroerte redelijk accuraat functionele uitkomst, infectierisico en gezondheidszorg-gerelateerde kosten voorspeld kunnen worden. De prognostische kracht is echter wel nog niet voldoende om
Op korte termijn zien we wel een rol weggelegd voor de eenvoudige parameters NIHSS, pre-beroerte mRS en behandelingsmodaliteit, als kern voor case-mix correcties bij benchmarking. Doordat een redelijk accurate inschatting van functionele uitkomst en van de kost van zorg mogelijk is, moet het ook mogelijk zijn dergelijke prognostische modellen te implementeren om zinvolle zorg na te streven (value-based healthcare), vooral bij die kwetsbare populatie die het waarschijnlijk sowieso slecht doet onafhankelijk van behandeling.