CONCENTRATION ON THE AUDIT
MARKET IN BELGIUM
Word count: 15200
Stefanie Van Laere
Student number: 01603066
Supervisor: Prof. Dr. Ignace De Beelde
Master’s Dissertation submitted to obtain the degree of:
Master of Science in Business Economics
Main subject: Accountancy
PERMISSION
I declare that the content of this Master’s Dissertation may be consulted and/or reproduced, provided that the source is referenced.
Acknowledgement
This thesis marks the end of my studies Business Economics at the University of Ghent. Over the past four years, I have been able to truly develop myself and figure out what I would like to do in my future career. I want to thank my family and friends for their unconditional support during this period.
During my studies, I discovered my interest in the audit profession which made the subject of this paper an ideal research topic for me to explore. Furthermore, I believe the knowledge I gained during the construction of this master thesis will be helpful at the start of my career.
I also would like to make use of this opportunity to give a big thank you to my promotor Prof. Dr. Ignace De Beelde for his outstanding guidance, knowledge, expertise and effective aid. His input undeniably contributed to the successful completion of this dissertation.
Lastly, I want to mention that the accomplishment of this master thesis was only slightly impacted by the Covid-19 crisis as most of the external research was already executed before the start of the crisis.
Stefanie Van Laere Ghent, 2 June 2020
Abstract
For more than a decennium, the high concentration level on the audit market has been a hot research topic as it gives rise to significant concerns (for example: barriers to entry for small and mid-tier audit firms). Since the bankruptcy of Arthur Anderson in 2002, the global audit market consists of four major players (the so called Big Four: PwC, KPMG, Deloitte and EY) whose power is particularly very high in the segment of listed companies where they have for example a consistent combined market share exceeding 90% in most EU countries. In 2014, the European Union published the Audit Reform which became valid in June 2016. One of its main goals is to make the top end of the audit market more dynamic.
This thesis investigates the evolution of the concentration on the Belgian audit market for the segment of listed companies (main target goal of the Audit Reform) over the time period 2014-2018 as to analyse if the actions of the Audit Reform are having the desired effect or if adaptions could be necessary. However, to get a complete picture, the concentration on the Belgian audit market is also given, for the year 2018, for the total Belgian audit market and the segment of non-listed companies. Furthermore, this study will investigate the differences between listed and non-listed companies, have a look at the existing market structure in all researched segments, analyse the early consequences of the fee cap on non-audit services (NAS) and define the best proxy to determine market shares if audit fees are unavailable. The market shares were determined by the use of audit fees and two proxies (number of clients and clients’ sales), while the concentration level was measured by the frequently used concentration ratio (CRn) and
Herfindahl index (HHI), as well as the recently more often used Gini coefficient (G) and Lorenz curve (L).
The findings indicate that in the listed segment, during the time period 2014-2018, according to the audit fees, a very high market concentration can be observed although a decreasing trend is detected. Furthermore, according to the audit fees, the total Belgian audit market experiences a medium to very high market concentration in 2018, while on the non-listed segment a medium to high market concentration can be observed. It was also concluded that in all researched segments the same market structure exists, namely a tight oligopoly. Moreover, the inequality in the distribution of market shares on the Belgian audit market between individual audit firms in 2018 is, according to the audit fees, (very) high in all research segments although it is significantly higher in the total audit market and the non-listed segment compared to the listed segment. These findings may indicate that the actions of the Audit Reform might not be strong enough to reduce the concentration levels significantly and that it would be better if the Audit Reform would also effect the non-listed segment (as this segment also shows a significant concentration, as well as a significant inequality in the distribution of market shares between individual audit firms). Furthermore, related to the fee cap on non-audit services (NAS), it was detected that
companies have started to prepare themselves for this fee cap, that there are no clear spillover fees and that the Non-Big Four seem to be receiving more and more non-audit related jobs at the expense of the Big Four. Lastly, when analysing which proxy is the best to measure market shares if audit fees are unavailable, it was observed that clients’ sales is the most appropriate proxy while the proxy number of clients should be avoided.
Key words: audit market concentration, audit market structure, Audit Reform, Belgian audit market, Big Four, NAS
Contents
Acknowledgement ... I Abstract... II Contents ... IV Abbreviations ... V List of appendices ... VI List of tables ... VII List of figures ... VIIIIntroduction ... 1
1 Literature review ... 3
Audit market concentration ... 3
1.1.1 Definition of market concentration ... 3
1.1.2 Causes of audit market concentration ... 3
1.1.3 Consequences of audit market concentration ... 4
Empirical studies about audit market concentration ... 6
1.2.1 General ... 6
1.2.2 Findings specifically for Belgium ... 9
Change in regulation and its effect on the concentration level ... 10
1.3.1 Mechanisms to reduce concentration ... 10
1.3.2 Early effects on the audit market concentration level ... 15
2 Hypotheses ... 18
3 Research methodology ... 20
Variables for measurement of audit firms market share ... 20
Methods for measurement of audit market concentration ... 21
3.2.1 Concentration ratio (CRn) ... 21
3.2.2 Herfindahl index (HHI) ... 22
3.2.3 Gini coefficient (G) and the Lorenz curve (L) ... 23
Data ... 25
3.3.1 Research period ... 25
3.3.2 Population ... 25
3.3.3 Data collection method (Belfirst) ... 27
4 Empirical results ... 30
Audit market concentration ... 30
4.1.1 Concentration on the total audit market ... 30
4.1.2 Concentration on listed and non-listed segment ... 32
4.1.2.1 Concentration on the listed segment ... 32
4.1.2.1.1 Evolution audit fees versus non-audit fees on the listed segment... 34
4.1.2.2 Concentration on the non-listed segment ... 36
Concentration on the audit market compared to other countries ... 38
Market structure ... 40
5 Conclusions, limitations, future research ... 41
Conclusions ... 41
Limitations of the study ... 42
Suggestions for future research ... 43
References ... I Appendix ... 1
Appendix A. Prohibition of the provision of non-audit services... 1
Abbreviations
Big Four PwC, KPMG, Ernst & Young, Deloitte
CRn Concentration ratio, n being the number of largest firms
EU European Union
EY Ernst & Young
G Gini coefficient
HHI (Hirschman-) Herfindahl index
IBR Instituut van de Bedrijfsrevisoren (the Belgian Institute of company auditors) KPMG Klynveld Peat Marwick Goerdeler
L Lorenz-curve
NAS Non-audit fees
Non-Big Four e.g. BDO, Grant Thornton, Moore Stephens and Baker Tilly audit networks
PIE Public interest entity
PwC PricewaterhouseCoopers
List of appendices
Appendix A. Prohibition of the provision of non-audit services ... 1 Appendix B. Audit firms market share ... 3
List of tables
Table 1. Overview recent empirical studies about audit market concentration ... 6
Table 2. Overview recent empirical studies about audit market concentration in Belgium ... 9
Table 3. Overview empirical studies about effects Audit Reform ... 15
Table 4. Interpretation of concrete values for CR4 and CR8 (Stefani, 2006) ... 22
Table 5. Interpretation of concrete values for HHI (Stefani, 2006) ... 23
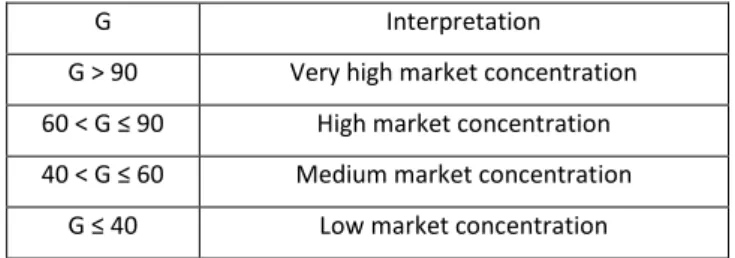
Table 6. Interpretation of concrete values for G (Stefani, 2006) ... 24
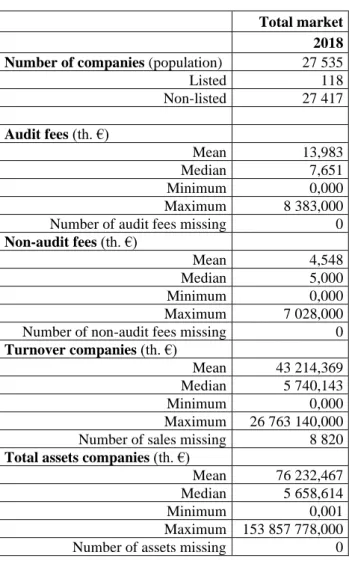
Table 7. Descriptive statistics of total market data (2018) ... 26
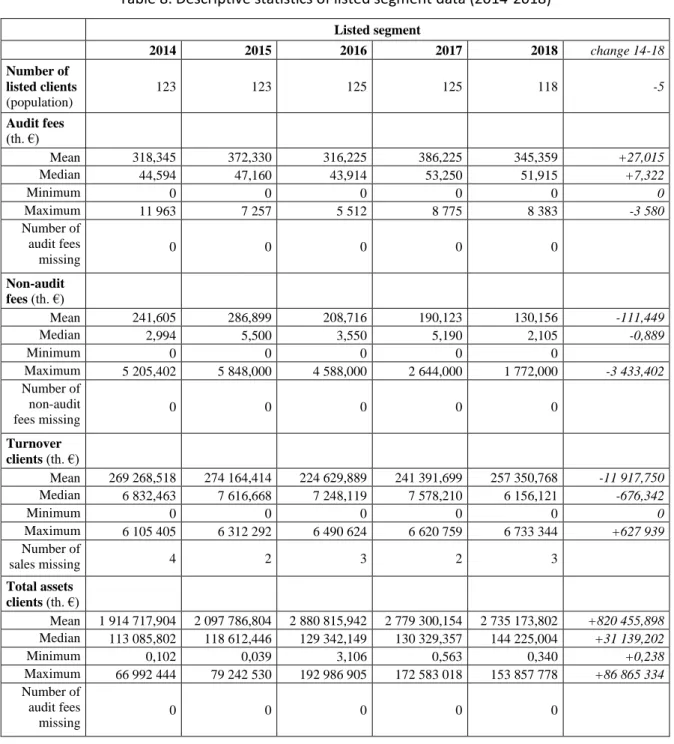
Table 8. Descriptive statistics of listed segment data (2014-2018) ... 27
Table 9. Total concentration in time by audit fees, number of clients and clients’ sales ... 31
Table 10. Concentration on the listed segment by audit fees, number of clients and clients’ sales ... 33
Table 11. Evolution (non-)audit fees on the listed segment ... 35
List of figures
Figure 1. Relation between audit quality and audit tenure ... 13
Figure 2. Evolution of market concentration in the EU PIE audit market 2013-2017 ... 16
Figure 3. Comparison total concentration by audit fees and proxies in 2018 ... 31
Figure 4. Lorenz curves 2014-2018 (listed segment) ... 34
Figure 5. Comparison concentration level listed and non-listed segment in 2018 based on audit fees .... 37
Figure 6. Lorenz curves 2018 for all segments (listed, non-listed and total) ... 38
Figure 7. Concentration Belgium – EU by audit fees (listed segment) ... 39
Introduction
The high concentration level on the audit market has been an important research topic for more than ten years as it gives cause to significant concerns (for example: barriers to entry for small and mid-tier audit firms). Since the bankruptcy of Arthur Anderson in 2002, the global audit market consists of four major players (the so called Big Four: PwC, KPMG, Deloitte and EY) whose power is particularly very high in the segment of listed companies where they have for example a consistent combined market share exceeding 90% in most countries of the European Union (European Commission, 2010).
After the financial crisis of 2008, The European Union (European Commission, 2010) released a Green Paper (“Audit Policy: Lessons from the Crisis”) in which it recognises that, in certain segments, the concentration on the audit market seems to be too high and gives audit clients a limited choice when appointing an auditor.
Finally, in 2014, the European Union published the Audit Reform (Regulation No 537/2014 and Directive 2014/56/EU) as response to these increasing concerns. It proposes several actions that could potentially lead to an increased dynamism at the top end of the audit market (which was one of its main goals), for example through the mandatory firm rotation and joint audits (Dekeyser & Simac, 2019). As the Audit Reform became valid in June 2016, the first preliminary results of its effects are an interesting research topic as to measure its effectiveness to reduce the concentration level on the audit market. This study will make this analysis specifically for Belgium.
The main research question can be formulated as follows: “What is the effect of the Audit Reform on the concentration level on the Belgian audit market for the listed companies?”. Furthermore, this study will give an overview of the complete (total, listed and non-listed) audit market structure and concentration in Belgium, analyse the early consequences of the fee cap on non-audit services (NAS), look at the differences between listed versus non-listed companies and define the best proxy to determine market shares if audit fees are unavailable.
For the empirical part of this thesis, the market shares of all Belgian audit firms were calculated through the audit fees and two proxies (number of clients and clients’ sales). Moreover, to measure the concentration level on the audit market in Belgium, two well-known concentration formulas (concentration ratio and Herfindahl index) were used as well as the recently more frequently used Gini coefficient and Lorenz curve. The calculations were made for the whole Belgian audit population and then repeated for the listed and the non-listed segment. Based on the bounds set by Stefani (2006), a
conclusion was made about the concentration levels on the different segments of the Belgian audit market (total, listed and non-listed).
This thesis adds value to current research in multiple ways. First of all, the analysis of the preliminary results of the effect of the Audit Reform in Belgium could offer valuable and informative evidence for future audit policymaking in the EU. Furthermore, the results of this thesis contribute to the limited available information about the level of concentration on the audit market in Belgium, particularly after the Audit Reform. Thirdly this thesis makes the analyses for 2018 for the complete Belgian audit market or in other words for both listed and non-listed companies, while most research is carried out only for listed companies (due to the fact that public interest companies need to release all the information about their accounts publicly) and as a result there is only a limited number of studies carried out for non-listed companies. Moreover, the thesis contributes to the rather limited research that uses the Gini coefficient and the Lorenz curve to measure concentration on the (audit) market. Lastly, the suitability of two proxies (number of clients and clients’ sales) to calculate the market share of audit firms if audit fees aren’t available is determined.
This thesis exists of five main parts:
The first part of this thesis gives a literature overview related to the concentration on the audit market, the Audit Reform and prior empirical studies (including focus on the specific situation on the Belgian audit market).
In the second section, five researched hypotheses are defined about, among other things, the concentration and structure on the audit market.
Chapter three discusses the methods and data (population, collection procedure and period of research) used in the empirical part of this study to calculate to market shares and concentration on the audit market.
The next part presents the empirical results related to the concentration on the audit market. The found audit market concentration based on the audit fees and the two proxies (number of clients and clients’ sales) is discussed, firstly for the total audit market and secondly for the listed and non-listed segment separately. Next a comparison with the concentration levels in other countries is performed. Finally, the found market structure is stated. The calculated market shares based on the audit fees and the two proxies can be found in Appendix B.
The last chapter closes this thesis with the main findings, the limitations of this paper and suggestions for future research.
1 Literature review
In this part of the thesis, an overview of existing literature about the audit market concentration, the Audit Reform (Regulation No 537/2014 and Directive 2014/56/EU) and prior empirical studies is given.
Audit market concentration
1.1.1 Definition of market concentration
Market concentration assesses the degree of concentration on a market by examining the combined market share of all the top companies in a specific industry (Schaen & Maijoor, 1997). This can be calculated by various concentration formulas, e.g. the concentration ratio (CRn), the Herfindahl index (HHI)
and the Gini coefficient (G) (plus the accessory Lorenz curve (L)). High concentration levels indicate an oligopolistic market which is controlled by a small amount of companies, while low concentration levels imply a competitive market which is quite uniformly divided between market participants (Mijić, Jakšić, & Vuković, 2013). It should be noted that there are two types of relevant oligopolies for this research, a loose (CR4 > 40%) and tight (CR4>60%) oligopoly (Raza, Hussin, & Majid, 2019). A tight oligopoly is typified
by fewer opponents, a higher concentration level, more steady market shares and higher entry barriers, compared to a loose oligopoly (Schaen & Maijoor, 1997). To have a competitive market, an adequate amount of market participants might be required as well as a reasonable level of parity among them (Schaen & Maijoor, 1997), because the larger the size and the fewer the quantity of participants on the market, the higher the concentration level (Dubaere & De Beelde, 2008).
1.1.2 Causes of audit market concentration
There are various potential causes for the high concentration level in the global audit market. Reasons why companies tend to choose for the services of the Big Four are for example the higher quality of provided audit services, higher auditor competences to perform complex audits across the world (complexity of accounting standards), higher international reputation, advantages for international businesses (one audit firm for a whole multinational business) and higher economies of scale (lower audit fees as certain fixed costs can be spread over an expanded client base) (Mijić et al., 2013; UK House of Lords, 2011).
It should be noted that some of these causes may nevertheless be based on perception. For example, when looking at the quality of provided audit services, Boone, Khurana and Raman (2010) findings indicate that there is almost no difference in actual audit quality between Non-Big Four and Big Four but a more noticeable difference in perceived audit quality. Specifically for Belgium, research also found no proof of
significant differences in audit quality between Big Four and Non-Big Four auditors for private companies (Gaeremynck, Van Der Meulen, & Willekens, 2008; Vander Bauwhede, Willekens, & Gaeremynck, 2003).
Another potential cause of the concentration on the audit market could be that it was naturally developed by the specific features of the audit market (Perucca, Mirza, & Schiller, 2018). According to Sirois, Marmousez, & Simunic (2016) there is a crucial difference between the Big Four and Non-Big Four with regards to their audit technology investment strategies which potentially made the audit market a “natural oligopoly” as coined by Shaked & Sutton (1983). In a “natural oligopoly” companies can enhance their contribution margin (determined as price minus marginal cost) by means of fixed strategic capital investments which can improve processes andraise the actual/perceived quality of products/services. As a matter of fact, when a natural oligopolistic market starts to grow, companies participate in a kind of ‘race to invest’ with the aim of increasing the relative value (quality/price ratio) of their products, services and/or processes compared to their competitors. This unavoidably raises the degree of investments necessary to enter and operate successfully in a certain market. This conduct ultimately results in a natural (stable) oligopoly with only a limited amount of large companies active in the market. In particular, these fixed strategic capital investments seem to primarily form a strategic barrier to entry (Sirois et al., 2016). Specifically for the audit market, Perucca et al. (2018) concluded that a “natural oligopoly” will appear, if the variable audit cost is adequately flat pertaining to the level of audit quality. If such a situation occurs, any effort to boost competition will force the audit firms who provide the lowest quality out of the market and will raise concentration.
1.1.3 Consequences of audit market concentration
Concentration on the market has multiple consequences.
A first consequence is that the high concentration on the audit market causes major barriers to enter the market for small and mid-tier audit firms. Market entry is often not alluring to firms outside the Big Four due to, among other things, the prejudices about small/mid-tier audit firms, the high entry costs, a lengthy payback period for investments, substantial business risks, lack of ability to form global networks essential to perform work for multinational clients, the demand for superior technical capability and industry specialization, lack of brand awareness and reputation, insufficientaccess to resources, raised exposure to trials, potentially less scalable business models and greater expansion possibilities for other business characteristics (Oxera, 2006; US Department of the Treasury, 2008).
Secondly, market concentration results in limited choice of audit firms for large companies which raises the probability of conflict of interest (Mališ & Brozović, 2015). As an example, commercial considerations can be pointed out as companies doubt to employ auditors that work narrowly with their competitors (Lords, 2011). Furthermore, firms may necessitate an auditor with a certain technical capacity, for example a big international network or a distinct industry specialism. Choice may also be limited by law, for instance a fee cap on non-audit services (NAS) limits the ability of public reporting companies to appoint audit firms for their statutory audit who also supply them with certain types of non-audit services above a certain amount (for example in most European countries this fee cap is equal to 70% of the averaged three prior consecutive years audit fees (Dekeyser & Simac, 2019; European Union, 2014, Lords, 2011). A consequence of this restricted choice is the infrequent amount of auditor rotations that happen and large familiarity between clients and their auditors, which causes doubt about the auditor independence, their professional scepticism and the quality of audits (Clacher, de Ricquebourg, & May, 2019).
Thirdly, the high concentration level impacts the level of audit quality and audit fees although the exact effect remains unclear because various studies have reported different results (positive, neutral or negative). For example, for audit quality, Francis, Michas and Seavey (2013) found, based on data of 42 countries, that Big Four dominance does not automatically impairs audit quality, and in fact appears to be associated with higher quality audits. Huang, Chang and Chiou (2015) on the other hand found an insignificant overall effect of concentration on audit quality based on data from China. In contradiction with this, Boone, Khurana and Raman (2012) found that, based on a U.S. sample, the concentration on the audit market by the Big Four favours auditor’s complacency causing a milder and less sceptical methodology to audits and a lower audit quality. It can be noted that, concerning the audit fees, research about the impact of audit market concentration on audit fees is rather scarce and often only relies on U.S. data. The Government Accountability Office (2008), for example, used a U.S. sample and found no relation between market concentration and audit fees. Hardies (2016) on the other hand found that, based on Belgian data, a higher concentration level on the audit market leads to higher audit fees. Numan and Willekens (2012) found in contrast that audit market concentration does not increase but even rather decreases audit fees and this based on data from the United States. These inconclusive results could potentially be explained by different research designs and/or countries in which the researches were performed (Mališ & Brozović, 2015). For example, according to van Raak, Peek, Meuwissen and Schelleman (2020) the found effect of market concentration on audit fees and audit quality may depend on the researched segments (e.g. the SME-client segment versus the large-client segment) who tend to have different characteristics (e.g. degree of audit complexity). The study namely concluded that, based on Belgian data, market concentration leads to lower audit quality and higher audit fees in the SME-client
segment (low audit complexity) while in the large-client segment (high audit complexity) no relation between market concentration and audit quality could be found.
Lastly there is the risk of financial system vulnerability (too big to fail). More specifically, there are worries that the Big Four is controlling the market too much and that the downfall of one of the them could lead to significant commotion in the global financial markets (European Commission, 2010; Mališ & Brozović, 2015).
Empirical studies about audit market concentration
There has already been a lot of research on audit market concentration before the Audit Reform. An overview of some recent empirical studies is given in the following paragraphs, ending with some specific findings about Belgium. It should be noted that comparisons between studies have to be done cautiously as research designs (e.g. research periods and sample size/structure) and local laws can affect the reported results.
1.2.1 General
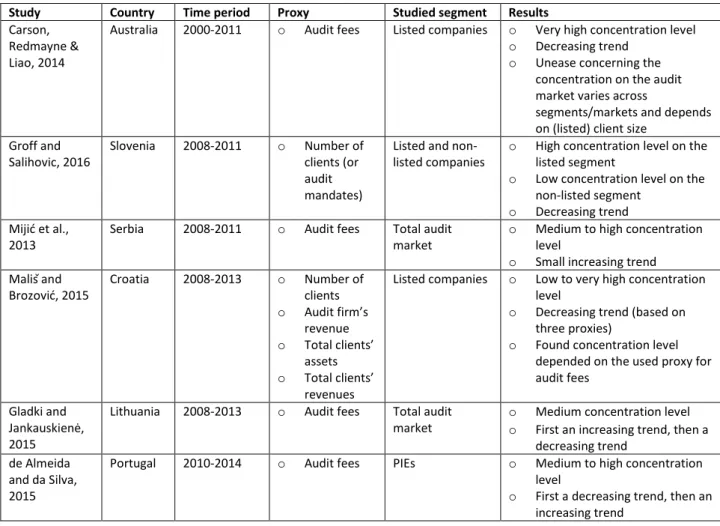
Table 1. Overview recent empirical studies about audit market concentration
Study Country Time period Proxy Studied segment Results
Carson, Redmayne & Liao, 2014
Australia 2000-2011 o Audit fees Listed companies o Very high concentration level o Decreasing trend
o Unease concerning the concentration on the audit market varies across
segments/markets and depends on (listed) client size
Groff and Salihovic, 2016 Slovenia 2008-2011 o Number of clients (or audit mandates)
Listed and non-listed companies
o High concentration level on the listed segment
o Low concentration level on the non-listed segment
o Decreasing trend Mijić et al.,
2013
Serbia 2008-2011 o Audit fees Total audit market
o Medium to high concentration level
o Small increasing trend Mališ and Brozović, 2015 Croatia 2008-2013 o Number of clients o Audit firm’s revenue o Total clients’ assets o Total clients’ revenues
Listed companies o Low to very high concentration level
o Decreasing trend (based on three proxies)
o Found concentration level depended on the used proxy for audit fees
Gladki and Jankauskienė, 2015
Lithuania 2008-2013 o Audit fees Total audit market
o Medium concentration level o First an increasing trend, then a
decreasing trend de Almeida
and da Silva, 2015
Portugal 2010-2014 o Audit fees PIEs o Medium to high concentration
level
o First a decreasing trend, then an increasing trend
Study Country Time period Proxy Studied segment Results Raza et al., 2019 Malaysia 2012-2016 o Number of clients (or audit mandates)
Listed companies o Medium concentration level o Decreasing trend
Šindelář, 2015 Czech Republic
2013 o Audit fees PIEs o (Very) high concentration level
Balcere, De Beelde & Sarens, 2017
Baltic states
2015 o Clients sales Listed and non-listed companies
o Very high concentration level on the listed segment
o Medium concentration level on the non-listed segment Saksonova,
2019
Latvia 2017 o Audit fees PIEs o Very high concentration level
A study (Carson, Redmayne & Liao, 2014) about the concentration on the audit market in Australia reported that, when audit fees were used as a measure, the Big Four dominated the market, with a share of 91% of total fees charged to listed companies in 2000, but the concentration level did decline a bit to 87% in 2011. Additionally, they also analysed the CR4 (based on audit fees) splitting the listed market into
three segments based on client size (large, medium and small). They concluded that the segment of large listed clients was progressively very highly concentrated (a fee-based CR4 over 97% in 2000-2011). For
both the medium-sized listed clients and the small listed clients, the CR4 was considerably lower
(respectively a fee-based CR4 of 65% and 25% in 2011) and also decreased significantly over the
researched time period. In general, this suggests that the unease concerning the concentration on the audit market may vary across segments/markets and could depend on (listed) client size.
Next, a study by Groff and Salihovic (2016) about the concentration on the audit market in Slovenia over the time period of 2008-2011 concluded that, based on the amount of clients (or audit mandates), the listed segment was highly concentrated by the Big Four (CR4 average 70,2%). Conversely, on the non-listed
segment a low concentration level could be observed (CR4 average 42%). It was also reported that there
was a decline in the concentration level in both segments over a 10-year time period (2002-2011).
Mijić et al. (2013) reported that in Serbia, the concentration on the total audit market, based on audit fees, in the time period 2008-2011 was medium to high (for example the CR4 was 65,56% and the HHI was
0,12 in 2011) and they also detected a small increase of this concentration level during the studied time period.
Furthermore, Mališ and Brozović (2015) investigated the concentration on the audit market for listed companies in Croatia over the time period 2008-2013 based on four proxies: number of clients (proxy one), total revenues of clients (proxy two), audit firm’s revenue (proxy three) and total assets of clients (proxy four). It was noticed that the found concentration level depended on the used proxy for audit fees
and ranged from a low to very high concentration level (e.g. CR4 and G were respectively 40,52%/40,
63,62%/71, 67,18%/69 and 82,70%/82 in 2013, when measured through the four proxies mentioned above). Moreover, a significant decline in the concentration level was noticed during the researched time period (2008-2013) when measured through proxy two, three and four while a significant increase was observed when measured through proxy one.
A study by Gladki and Jankauskienė (2015) about the concentration on the total audit market in Lithuania over the time period 2008-2013 concluded that, based on the audit fees, a medium concentration level (e.g. CR4 of 58,35% in 2013) could be observed. Moreover, it was noticed that after an increase in the
concentration level from 2008 to 2011, there was a decline in the concentration level from 2011 to 2013.
De Almeida and da Silva (2015) researched the concentration level on the Portuguese audit market for PIEs over the time period 2010-2014. It was concluded that, based on audit fees, a medium to high concentration level (e.g. CR4, HHI and G were respectively 70,7%, 0,128 and 78,4 in 2014) could be
observed on the audit market in Portugal. It was also noticed that, when looking at the CR4 and HHI, there
was a significant decrease in the concentration levels from 2010 to 2012, while from 2012 to 2014 the concentration levels started to increase slightly again.
A study (Raza et al., 2019) about the concentration on the audit market in Malaysia concluded that the concentration level for listed companies, based on the number of clients (or audit mandates), significantly reduced from 2012 to 2016 (CR4 declined from 54,18% to 48,50%) but was still classified as loose
oligopolistic (medium market concentration). They concluded that the Malaysian audit market seemed to be quite more competitive compared to developed markets like UK and USA as there could be considered to be a Big Eight compared to the usual Big Four.
A study by Šindelář (2015) about the audit market concentration in the Czech Republic in 2013 concluded that, based on the audit fees, there was a (very) high concentration (the CR4 equaled 84% and the HHI
equaled 0,19) in the market of audit services for PIEs in the Czech Republic.
Balcere, De Beelde and Sarens (2017) investigated the concentration levels on the listed and non-listed company audit segment in the Baltic states (Latvia, Lithuania and Estonia) based on client sales. The study observed that the listed segment is significantly more concentrated compared to the non-listed segment. More specifically, it was observed that in all three countries, in 2015, on the listed segment a very high concentration level (CR4 of respectively 80%, 91% and 100%) could be observed while on the non-listed
Lastly, Saksonova (2019) assessed the concentration levels in the market for statutory audits of PIEs in Latvia in 2017 and reported a very high concentration level on the audit market as the CR4 based on audit
fees was over 98%.
1.2.2 Findings specifically for Belgium
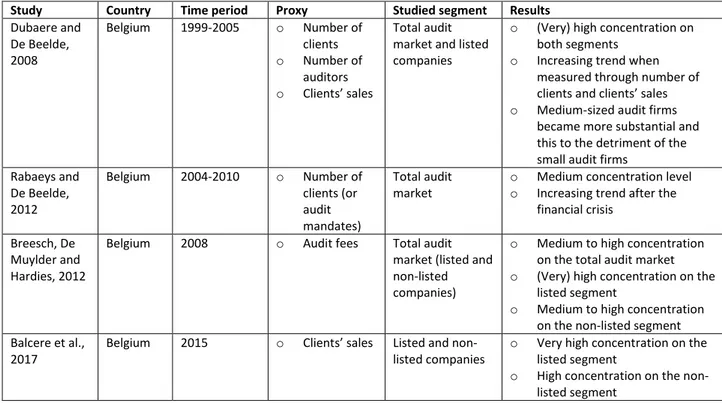
Table 2. Overview recent empirical studies about audit market concentration in Belgium
Study Country Time period Proxy Studied segment Results
Dubaere and De Beelde, 2008 Belgium 1999-2005 o Number of clients o Number of auditors o Clients’ sales Total audit market and listed companies
o (Very) high concentration on both segments
o Increasing trend when measured through number of clients and clients’ sales o Medium-sized audit firms
became more substantial and this to the detriment of the small audit firms
Rabaeys and De Beelde, 2012 Belgium 2004-2010 o Number of clients (or audit mandates) Total audit market
o Medium concentration level o Increasing trend after the
financial crisis
Breesch, De Muylder and Hardies, 2012
Belgium 2008 o Audit fees Total audit
market (listed and non-listed companies)
o Medium to high concentration on the total audit market o (Very) high concentration on the
listed segment
o Medium to high concentration on the non-listed segment Balcere et al.,
2017
Belgium 2015 o Clients’ sales Listed and non-listed companies
o Very high concentration on the listed segment
o High concentration on the non-listed segment
Dubaere and De Beelde (2008) researched the structure and concentration on the Belgian audit market from 1999 to 2005 for the total audit market and the listed segment. The study reports that in both studied segments a (very) high concentration level could be observed (for example CR4 equalled
respectively 70,51% and 88,50% in 2005 when measured by clients’ sales). Specifically, concentration ratios measured by number of clients and clients’ sales indicated a significant increasing concentration level for the total Belgian audit market and the listed segment while measurements based on number of auditors indicated a slight decreasing trend in the total audit market during the researched time period. Furthermore, results showed an interesting evolution in the Non-Big Four segment where it was observed that medium-sized audit firms became more substantial and this to the detriment of the small audit firms. Furthermore, when looking at the used proxies, Dubaere and De Beelde (2008) mentioned that the notion in the literature (e.g. Moizer & Turley, 1987) is that the proxies “number of clients” and “number of auditors” tend to underestimate the market shares on the audit market while the proxy “clients’ sales” tends to overestimate it.
A study by Rabaeys and De Beelde (2012) found that, based on the number of clients (or audit mandates), a medium concentration level (for example the CR4 was 51,53% in 2010) could be observed on the total
audit market is Belgium, based on data from the time period 2004-2010. Moreover, it was noticed that after the financial crisis of 2008, an increasing trend could be observed (+6,36% from 2008 to 2010).
Breesch, De Muylder and Hardies (2012) reported that, based on the audit fees, the total audit market was medium (according to the HHI of 0,135) to highly concentrated (according to the CR4 of 72,80%) in
2008. Furthermore, it was observed that in the same year, based on the audit fees, on the listed segment a (very) high concentration level (CR4 of 88,35% and HHI of 0,227) existed while on the non-listed segment
a medium (according to the HHI of 0,133) to high concentration level (according to the CR4 of 71,80%)
occurred. In other words, it was concluded that the listed segment was significantly more concentrated than the non-listed segment.
The paper by Balcere et al. (2017) reported that, based on clients’ sales, the listed segment was very highly concentrated (CR4 of 98%) while the non-listed segment was highly concentrated (CR4 of 67%) in 2015 in
Belgium, or in other words the listed segment was significantly more concentrated compared to the non-listed segment. The paper predicted that the actions of the Audit Reform would increase the market share of the mid-tier audit firms and decrease the market shares of the Big Four.
Change in regulation and its effect on the concentration level
As a response to the higher concentration level on the audit market in the European Union and all its negative consequences, the EU published the Audit Reform (Regulation No 537/2014 and Directive 2014/56/EU). It should be noted that the Audit Reform only applies to public-interest entities (PIEs) whose definition can vary across countries which can make comparisons difficult. The Audit Reform proposes several actions that could potentially lead to an increased dynamism at the top end of the audit market (one of the main goals of the Audit Reform). This part will go deeper into two of these actions and their early effects on the concentration level on the audit market.1.3.1 Mechanisms to reduce concentration
A first action the EU introduced to make the top end of the audit market more dynamic is the prohibition and capping of non-audit services (Art. 4 and Art. 5 of Regulation No 537/2014). Most European countries put the fee cap equal to 70% of the averaged three prior consecutive years audit fees (Dekeyser & Simac, 2019). The prohibited non-audit services are formulated by means of a blacklist although exemptions for selected tax and valuation services are possible under certain conditions (see appendix A). These
regulations focus on activities that bear an inherent risk to auditor independence (such as self-review threat) and may perhaps raise conflicts of interest for statutory auditors (Dekeyser & Simac, 2019). Another goal of this action is to enhance the believability of audited financial statements from PIEs (Ratzinger-Sakel & Schönberger, 2015).
There has been an increasing amount of research done about the association between non-audit services (NAS) and audit quality/auditor independence, but the empirical findings are diverse (Dekeyser & Simac, 2019). Some studies documented a negative association (e.g. Hohenfels & Quick, 2018; Krauss, & Zulch, 2013) between NAS supplied by statutory auditors and audit quality/auditor independence, but other studies found no association (e.g. Park, Choi, & Cheung, 2017; Zhang, Hay, & Holm, 2016). Some studies even found a positive association (e.g. Bouwens, 2018; Ganesan, Narayanan, Haron, & Pitchay, 2019) since the NAS supplied by statutory auditors can augment audit effectiveness, as knowledge attained from the non-auditing services might be relocated to the audit (economies of scope) (Hohenfels & Quick, 2018). Higher audit effectiveness attained by this knowledge spillover might sequentially lead to enhanced audit quality as auditor’s competence expands (Joe & Vandervelde 2007). So, it could be required to make a compromise between the prohibition/capping of non-audit services and the possible loss of enhanced audit quality via enlarged knowledge through the NAS (Ratzinger-Sakel & Schönberger, 2015). Finally, Hohenfels and Quick (2018) concluded that a cap on NAS fees at 70% of the averaged three prior consecutive years audit fees may be too soft to prevent an impairment of audit quality (in their sample for Germany the effective NAS fee cap was 41%), but they also found that a full prohibition of allowable NAS would not lead to an increase in audit quality in contrast to a moderate permissible level of NAS fees.
A second action is the mandatory audit firm rotation (MFR) (Art. 17 of Regulation No 537/2014) which restricts the amount of years that an auditor or audit firm could perform the statutory audit for a company (Mališ & Brozović, 2015). The rotation period is set by the EU at a maximum of 10 years, but Member States can impose both shorter and longer rotation periods. More specifically for a longer rotation period, Member States have the flexibility to extend the total duration to maximum 20 years in the case of a public tendering and maximum 24 years in the case of a joint audit. After the MFR, there is a cool-off period of four years in which the previous statutory auditor or audit firm (or any associates of their networks within the European Union) is not allowed to perform the statutory audit of the same public-interest entity (European Union, 2014).
The MFR has been recommended as plan to maintain the independence of the auditor and to potentially raise the confidence of the investors in the financial statements (Cameran, Prencipe, & Trombetta, 2016; European Commission, 2010). Furthermore, a MFR could possibly lower concentration on the audit
market to the degree that more chances are granted to small and mid-tier audit firms to compete to deliver audit services to (big) listed companies (Ewelt-Knauer, Gold, & Pott, 2012; Government Accountability Office, 2008). Other potential advantages of the MFR rules are that it offers a fresh view at financial statements and destroys the economic link that endangers the auditor objectivity/independence (Bronson, Harris, & Whisenant, 2016). It was namely said that the secure economic benefits proceeding from possibly unlimited terms jeopardize auditor independence. This can be clarified since auditors want to keep these unrestricted economic gains from clients and as a consequence may rather want to satisfy the client than being impartial. This could cause greater auditor tolerance concerning misrepresented financial statements (Bleibtreu & Stefani, 2018; Brooks, Cheng, Johnston, & Reichelt, 2017).
Opponents of mandatory firm rotation rules, however, argue that the MFR might intensify the threat of audit failure and lower audit quality as auditors are incapable to build up in-depth client- and industry-specific knowledge (Bronson et al., 2016; Ewelt-Knauer et al., 2012; Fontaine, Khemakhem, & Herda, 2016). Another potential disadvantage of the MFR rule is a raise in costs, e.g. set-up costs for the new auditors to comprehend the client’s business model/organisational structure and costs of client management to assist the new auditors in this learning process (Ewelt-Knauer et al., 2012; Velte & Loy, 2018). It is also questioned whether small and mid-tier audit firms possess the required capabilities (e.g. time, resources and competences) to perform an audit of big and complex companies. If this would not be the case, this observation is likely to have a negative effect on the quality of the audit (Harber, & Marx, 2019; Velte, & Stiglbauer, 2012). Lastly, mandatory rotation may not undoubtedly lower concentration levels because large publicly listed firms would probably just turn to another Big Four (Ewelt-Knauer et al., 2012: Government Accountability Office, 2008).
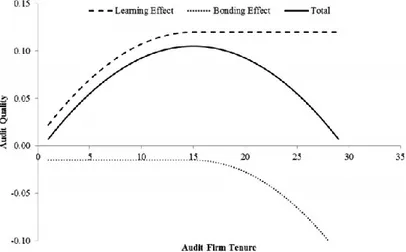
A study by Brooks et al. (2017) summarized the arguments for and against MFR in two factors that impact the relation between audit quality and audit firm tenure: the learning effect (prevailing in the early years of the audit firm’s tenure) and the bonding effect (prevailing in later years). The combined effect of these two factors is an enhancement of the audit quality in the early years and a decline in the later years (see Figure 1).
Figure 1. Relation between audit quality and audit tenure (Brooks et al., 2017)
With this knowledge the study estimated the point at which audit quality starts to decrease (“the turning point”) and the ideal point at which the MFR should happen (“the reference point”) based on an extensive sample of 19 247 observations in 22 countries comprising a time period of 14 years. They determined that the optimal length of an audit contract is 24 years for the countries where there is a high investor protection (or litigation risk) level and 14 years where this level is low. Their findings may suggest that a solider investor protection prolongs the moment at which audit quality starts to decrease and that this may behave as a surrogate for a shorter mandatory audit rotation term (Brooks et al., 2017).
The period of the MFR is allowed to be extended in two ways: tender extension or joint audit extension.
For the tender extension there should be complete transparency in terms of the criteria which determine the auditor selection. Quality and independence should be crucial appointing criteria in every tendering process(European Commission, 2010). Some of the advantages of this extension are that it might enhance transparency in the audit market (Mališ & Brozović, 2015) and that it forms the opportunity for companies to retain the knowledge of the stationary auditor (Deng, Li, Simunic, & Zhou, 2019). On the other hand, one of the disadvantages of this extension is the rising costs for both the audit clients and audit firms (which could punish small/mid‐tier audit firms as they miss critical scale in comparison with the Big Four to cover the expenses of the tendering procedure). Furthermore, intense rivalry between audit firms might allow clients to misuse the situation by bargaining lower audit fees (price wars). Consequently, audit quality could deteriorate (Le Vourc’h & Morand, 2011). It should be mentioned that the research about the impact of audit tendering is still rather limited. The small amount of findings that were published are barely generalizable due to fact that they were acquired in very specific research circumstances (Baumann, Ratzinger-Sakel, & Tiedemann, 2019).
In regards of the joint audit extension, a joint audit could be described as the case where two different audit firms jointly compose an opinion on the financial statements of an audit client and both audit firms are also mutually accountable for the delivered audit opinion (Zerni, Haapamäki, Järvinen, & Niemi, 2012).
The joint audit extension may possibly decrease the level of concentration on the audit market as it grants small and mid-tier audit firms the possibility to become active participants in the market of the audits of large (listed) companies, which could benefit their growth. Consequently, the joint audit extension might help these small and mid-tier audit firms to attain a critical dimension on a national basis (European Commission, 2010; Le Vourc’h & Morand, 2011). In order to be effective however, Mališ and Brozović (2015) stated that a prohibition on the nomination of two Big Four audit firms (i.e. “Big Four‐only” clauses) might be required.
Proponents of joint audits argue that joint audits have the possibility to protect auditor independence as both auditors will have to rationalise their verdicts and choices to each another. In addition, two pairs of eyes may notice more than one (cross-checks) which could enhance the quality of an audit (Holm & Thinggaard, 2018). Opponents of joint audits on the other hand argue that dual audits raise the cost of auditing (e.g. due to a decline in efficiency of manuals and processes) with limited or even no impact on audit quality (Guo, Koch, & Zhu, 2017; Holm & Thinggaard, 2018). For example, Lesage, Ratzinger-Sakel & Kettunen (2017) examined the audit market in Denmark before and after the abolition of the mandatory joint audit system in 2005 and found that the system had led to increased audit fees while it had no significant impact on the audit quality. Moreover, the involvement of two audit firms, could create the danger of evasion of responsibility and the danger of benefit capture of the efforts of the other audit firm, which could cause decreased total audit quality (Holm & Thinggaard, 2018). It is also anticipated that charged audit fees would increase because the involvement of the two auditors raises, among other things, coordination expenses, particularly in a consortium of a bigger and smaller audit firm (Heß & Stefani, 2012).
Recently, research (e.g. Deng, Lu, Simunic, & Ye, 2014; Holm & Thinggaard, 2018;Lobo, Paugam, Zhang, & Casta, 2017) has put more focus on the specific pairing of auditors in a dual audit as differently composed auditor pairs (two big-firm auditors (BB) versus one big-firm auditor paired with one small-firm auditor (BS)) could lead to another level of audit quality. For example, Lobo et al. (2017) found, based on French data, that the quality of audits performed by a BS auditor pair was higher than the quality of BB auditor pair audits. The French audit market is actually an interesting example as all publicly listed firms in France that supply consolidated (group) financial statements are since 1966 obligated to appoint two independent audit firms to perform a joint audit (Francis, Richard, & Vanstraelen, 2009) which means
there is a lot of data available related to the subject of joint audits. A study by Kermiche and Piot (2018) indicated that the joint audit regime in France is effectual in preserving market openness and in weakening the Big Four superiority. The study backs the European Commission’s opinion that joint audits could decrease concentration on the audit market and it also proposes that it might not be essential to impose mixed (BS) joint audits to attain that goal.
It can be concluded, that the actions proposed by the Audit Reform have potential advantages and disadvantages. To verify the success or failure of the Audit Reform on the concentration level on the audit market in EU, it might be useful to analyse preliminary results of the Audit Reform to verify if the actions are having the desired effect or if adaptations might be necessary.
In the next part, an overview is given of some recent reports that have analysed the early effect of the Audit Reform on the audit market concentration.
1.3.2 Early effects on the audit market concentration level
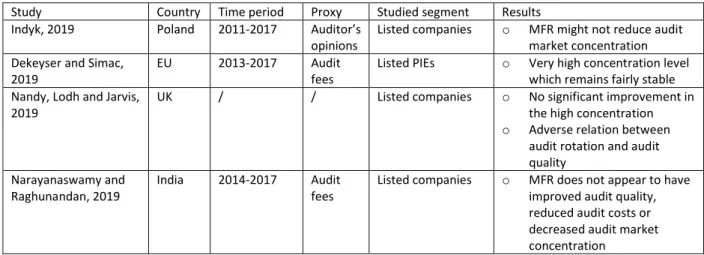
Table 3. Overview empirical studies about effects Audit Reform
Study Country Time period Proxy Studied segment Results
Indyk, 2019 Poland 2011-2017 Auditor’s
opinions
Listed companies o MFR might not reduce audit market concentration Dekeyser and Simac,
2019
EU 2013-2017 Audit
fees
Listed PIEs o Very high concentration level which remains fairly stable Nandy, Lodh and Jarvis,
2019
UK / / Listed companies o No significant improvement in
the high concentration o Adverse relation between
audit rotation and audit quality
Narayanaswamy and Raghunandan, 2019
India 2014-2017 Audit
fees
Listed companies o MFR does not appear to have improved audit quality, reduced audit costs or decreased audit market concentration
Indyk (2019) analysed the early effects of the MFR on the audit market concentration in Poland where the period of the MFR is five years without any allowed extensions. The paper used data from capital groups of which the parent company was listed on the Warsaw Stock Exchange over the period 2011-2017. The findings suggest that the MFR might not lower the concentration levels on the audit market as the largest capital groups are likely to just shift between the Big Four. Secondly, the results of the paper show that it are the Big Four that were the mostactive and present in short-term contracts from one to five years which proposes that their powerful position on the market was not caused by client’s retention but from the short-term alternation of clients and their intense bargaining power throughout the tender process.
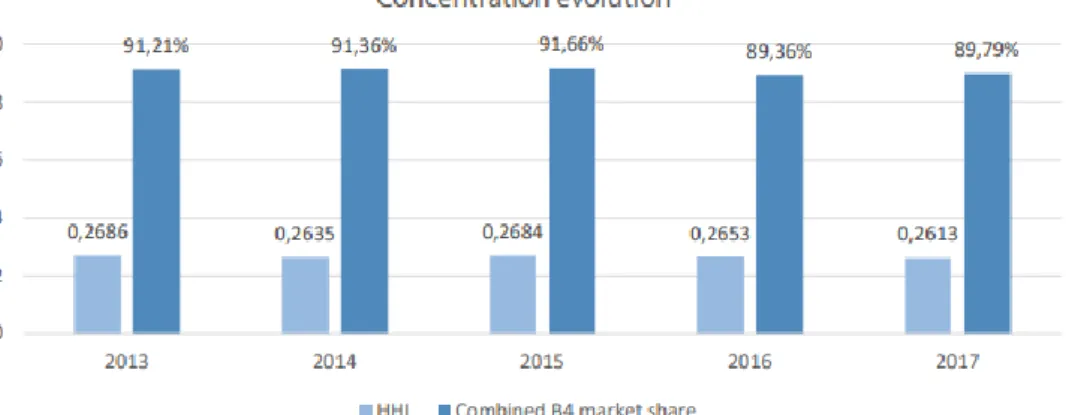
A study of Dekeyser and Simac (2019) investigated the early effects of the Audit Reform on costs, concentration and competition in the EU statutory audit market for listed PIEs for the time period 2013-2017. One of their key findings was that the aggregate EU market concentration, based on the audit fees, stayed quite constant and remained very high after the Audit Reform (see Figure 2). Nevertheless, it was also noticed that the concentration on the audit market did lower in almost half of the EU Member States when looking at the detailed findings.
Figure 2. Evolution of market concentration in the EU PIE audit market 2013-2017 (Dekeyser & Simac, 2019)
Furthermore, they concluded that Non-Big Four audit firms had acquired some market share after the Audit Reform and had been more involved in tender processes. About the MFR, they discovered that only in Member States with a rather strict implementation (with a maximum engagement period of less than 20 years, compared to a flexible one with a maximum engagement period equal to or exceeding 20 year) there was a decline in the concentration level. A small rise in the joint audit rate for the group of Member States permitting an extension of MFR in case of a dual audit (Dekeyser & Simac, 2019) could be noticed too, but it could also be observed that non-financial PIEs that preferred to have a joint audit paid on average 53,4% higher audit fees than those who have chosen for a single auditor. Moreover, it was observed that in the aggregated audit market the most common auditor pair in joint audits were a Big Four with a Non-Big Four. Regarding the fee cap on NAS, Dekeyser and Simac (2019) reported that both the Big Four and Non-Big Four noticed a decline in revenues from non-audit fees and that this decline was more intense when the ratio of NAS fees to audit fees was elevated. Specifically for Belgium, Dekeyser and Simac (2019) reported, based on the audit fees, a small decline in concentration on the audit market after the Audit Reform when calculated through the HHI and the aggregated Big Four market shares. Moreover, they reported that there was a noticeable increase in the amount of joint audits performed in Belgium (from 4,62% in 2013 to 11,21% in 2017). Lastly, related to the fee cap on NAS, audit firms in
Belgium generally tended to see an increase in audit fees, a decline in non-audit fees and a significant drop in the ratio of average NAS fees to average audit fees after the Audit Reform.
A study (Nandy, Lodh, & Jarvis, 2019) about the effects of the MFR in the UK, based on data from the largest 350 companies listed on the London Stock Exchange, observed no significant enhancement in the high concentration levels on the audit market and an adverse relation between audit rotation and audit quality. It should also be noted that in most European countries, private companies don’t fall under the definition of PIE (only listed firms, credit institutions, insurance undertakers and other entities defined by Member States as public-interest entities, for instance undertakings that are of significant public importance because of the nature of their business, their size or their amount of employees) and are in other words not effected by the Audit Reform (Accountancy Europe, 2019; EU Commission, 2014). A research paper by May (2016) noticed that the audit market for non-listed firms in the UK was also controlled by the Big Four when looking at the largest non-listed companies according to data from the time period 2005-2012. So, it was concluded that, regardless the listing status, audit markets seem to be dominated by the Big Four among the largest listed and non-listed companies and it might be unfitting that non-listed companies don’t have to comply with the actions of the Audit Reform.
The preliminary results of the Audit Reform given by these studies, can be useful to regulators to follow-up the actions of the Audit Reform and make adjustments if needed. However, it should be mentioned that a significant limitation of the majority of these studies is that only data from one year after the Audit Reform is used (Dekeyser & Simac, 2019). Furthermore, it should be noted that some of the actions of the Audit Reform were not yet enforced when these reports were assembled. For example, permitted NAS were first capped as of June 2019 (or January 2020, if the PIE end its financial year on 31th of December)
as it is based on the average of the fees paid in the last three consecutive financial years for the statutory audits and the rule came into effect in June 2016. So, there is a substantial continuing need for more academic research to assess the impact of the actions of the Audit Reform on the audit market concentration, especially when all the actions of the Audit Reform will be completely operational for a longer time period and when more comprehensive data will be obtainable.
Finally, it might also be worth it to look at studies performed in other countries or continents about the effects of similar actions, even though comparisons have to be made very cautiously. For example, a study by Narayanaswamy and Raghunandan (2019) about the MFR in India, which was introduced in April 2014, observed that MFR didn’t seem to have enhanced audit quality, lowered audit costs or decreased audit market concentration according to data from 2014-2017.
2 Hypotheses
In the literature, there is a common agreement that the most representative way to determine the market shares (and consequently the concentration) on the audit market is to use the total amount of audit fees paid by the customer. As these might not be available in all countries, proxies (e.g. number of clients and clients’ sales) are used. This study will analyse if some of these proxies are good estimators to determine the market share/concentration on the audit market.
Hypothesis 1: The proxy number of clients tends to underestimate the market shares on the audit market
while the proxy clients’ sales tends to overestimate the market shares on the audit market (Bigus & Zimmermann, 2008; Dubaere & De Beelde, 2008).
The EU introduced the Audit Reform in June 2016 as a response to the high audit market concentration reported by researchers and the potential negative consequences of this situation. This thesis will investigate the current concentration in Belgium and its pattern in time (for the listed segment) to verify if the actions under the Audit Reform are having the desired effects or if modifications could be necessary.
Hypothesis 2: The concentration on the audit market for listed companies in Belgium is still (very) high
but did decrease slightly after the Audit Reform (Dekeyser & Simac, 2019).
Permitted NAS were first capped as of June 2019 or January 2020, if the PIE has December 31 as the financial year end. Most European countries (including Belgium) put the fee cap equal to 70% of the averaged three prior consecutive years audit fees. It could be interesting to analyse the evolution of the average (non-)audit fees and the ratio of average NAS fees to average audit fees before and after the Audit Reform. This can verify the early consequences of this fee cap (e.g. are there spillover fees whereby audit fees somehow become non-audit fees or vice versa) and check if firms have started to prepare themselves for this fee cap (reduced their non-audit fees compared to audit fees if necessary). This study will make this analysis for the listed segment in Belgium over the time period 2014-2018.
Hypothesis 3: Generally, audit firms in Belgium experience an increase in audit fees, a decline in non-audit
fees and a significant drop in the ratio of average NAS fees to average audit fees after the Audit Reform (Dekeyser & Simac, 2019).
According to May (2016), it might be inappropriate that the non-listed companies don’t have to handle conform the actions of the Audit Reform as these only apply to PIEs (which is also the case in Belgium). This is because May (2016) observed that in the UK the audit market for the largest non-listed firms is also controlled by the Big Four. This study will research if the same situation exists on the Belgian market.
Hypothesis 4: The concentration on the non-listed company audit market is significantly lower than the
concentration on the (listed) PIE audit market but is still high (Balcere et al., 2017).
The high concentration on the audit market has resulted in an oligopolistic audit market in many countries which has a significant impact on clients and small or mid-tier audit firms. This study will investigate if the structure of the audit market in Belgium is also oligopolistic.
Hypothesis 5: The structure of the audit market in Belgium is tight oligopolistic (CR4>60%) on the total
3 Research methodology
The first part explains different measurement variables for the market share of audit firms. The second subchapter explains different measurement techniques for the audit market concentration, including their formulas and bounds. In the last part information is given about the research period, population and data collection method.
Variables for measurement of audit firms market share
To be able to use the two well-known concentration formulas (CRn (concentration ratio) and HHI
(Herfindahl index)) and the recently more frequently used Gini coefficient (G) (and the accessory Lorenz Curve (L)) only the market shares of the audit firms are needed (Dubaere & De Beelde, 2008). In the literature, there is a common agreement that the most representative way to determine the market shares on the audit market is to use the total amount of audit fees paid by the audited company. Consequently, audit firms are bigger when they receive more audit fees (Dubaere & De Beelde, 2008).
Since Directive 2006/43/EC was introduced by the EU, companies in the EU are obligated to publish their audit and non-audit fees (Article 49). More concretely companies need to report separately:
(a) the total fees for the financial year charged by the statutory auditor or audit firm for the statutory audit of annual accounts, (b) the total fees charged for other assurance services, (c) the total fees charged for tax advisory services and (d) the total fees charged for other non-audit services. (European Parliament and Council, 2006, Article 49)
In this study category (a) is allocated to audit fees and (b), (c), (d) to non-audit fees. The sum of the audit fees and non-audit fees gives the total fees (Bigus & Zimmermann, 2008).
Even though in Belgium companies need to report this information since 2006, it might not be available in all countries where then proxies (e.g. number of clients and clients’ sales) are used. This study will analyse if some of the most used proxies are good estimators to determine the market share on the audit market. It should be noted that the proxy “number of auditors” couldn’t be used as the IBR doesn’t publish an annual list of their members anymore due to the confidentiality of these personal data.
Methods for measurement of audit market concentration
Audit market concentration can be measured both in absolute and relative terms. The absolute concentration can be calculated by the concentration ratio (CRn) and Herfindahl index (HHI), while the
relative concentration can be calculated by the Gini coefficient (G) and the accessory Lorenz-curve (L) (Bigus & Zimmermann, 2008).
3.2.1 Concentration ratio (CR
n)
The concentration ratio (CRn) assesses the (audit) market concentration as the percentage of market
shares of the n largest firms in the (audit) market (Groff and Salihovic, 2016; Velte & Stiglbauer, 2012). The concentration on the audit market is typically measured by concentration ratio CR4, as there are four
main audit firms (“Big Four”) (Mijić et al., 2013). The formula (Dubaere & De Beelde, 2008) is as followed:
𝐶𝑅
𝑛=
∑ 𝑆
𝑖 𝑛 1∑ 𝑆
𝑘 𝑖1
n = number of largest audit firms
k = total number of audit firms in the market
Si = market share/size of audit firm i measured by audit fees, clients’ sales and number of clients
This concentration measurement is highly liked, as it is simple to compute and to comprehend (Dubaere & De Beelde, 2008). Its main disadvantage is that it doesn’t include information about the total number of (audit) firms in the market since it only covers a small amount of the largest (audit) firms in the researched market which may in some occasions cause imprecise conclusions (Groff & Salihovic, 2016; Velte & Stiglbauer, 2012).
The concentration ratio can take values between 0 and 1. When the ratio is closer to 1, the higher the market shares of dominant companies are and hence the higher the concentration level is (Dubaere & De Beelde, 2008).
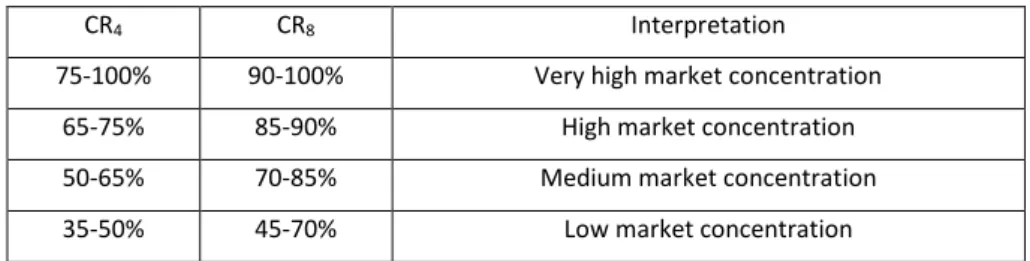
The bounds set by Stefani (2006), listed in Table 4, are chosen for interpreting the CRn outcome as a
significant amount of studies agree with these bounds (e.g. Bigus & Zimmermann, 2008; Dubaere & De Beelde, 2008; Groff and Salihovic, 2016; Šindelář, 2015).
Table 4. Interpretation of concrete values for CR4 and CR8 (Stefani, 2006)
CR4 CR8 Interpretation
75-100% 90-100% Very high market concentration
65-75% 85-90% High market concentration
50-65% 70-85% Medium market concentration
35-50% 45-70% Low market concentration
Although it should be noted that, even though a significant amount of studies agree with these bounds, different bounds can be found in other studies (e.g. Balcere et al., 2017; Le Vourc’h & Morand, 2011). This can be explained by the fact that, according to certain authors, it is not always easy to interpret numbers because a certain degree of subjectivity is involved and as a result it can be tough to declare if there is a high concentration level in a certain market (Dubaere & De Beelde, 2008).
3.2.2 Herfindahl index (HHI)
Another measurement tool for the (audit) market concentration is the Herfindahl index (HHI) which is calculated as the totalof the squares of the ratios of each (audit) firm’s size to the total (audit) market size (Kallapur et al., 2010). The formula (Kallapur et al., 2010) is as followed:
𝐻𝐻𝐼 = ∑ (
𝑆
𝑖∑ 𝑆
𝑘 𝑖 1)
2 𝑘 1k = total number of audit firms in the market
Si = size of audit firm i measured by audit fees, clients’ sales and number of clients
The HHI has a benefit against the CRn since it includes all (audit) firms on the researched market, while
the CRn only comprises a small amount of the largest (audit) firms in the researched market (Groff &
Salihovic, 2016; Velte & Stiglbauer, 2012). On the other hand, a disadvantage of the HHI is that due to the squaring of the market shares, the HHI is controlled by large (audit) firms and only immaterially impacted by small (audit) firms (Mališ & Brozović, 2015).
The value of the HHI can vary between 0 and 1, moving from a case of negligible concentration and equal shares for all market participants to a case of complete concentration where a single (audit) firm dominates the whole market (Groff & Salihovic, 2016; Mališ & Brozović, 2015).
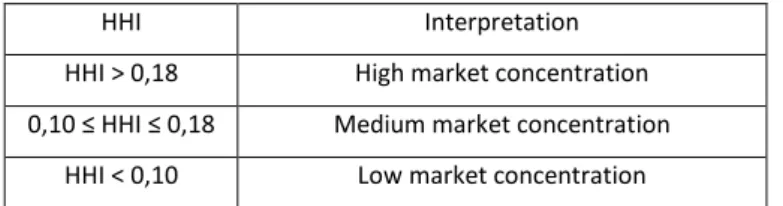
Again, the limits set by Stefani (2006) are used (Table 5), although the same remark mentioned for the bounds of the CRn applies here as well.
Table 5. Interpretation of concrete values for HHI (Stefani, 2006)
HHI Interpretation
HHI > 0,18 High market concentration 0,10 ≤ HHI ≤ 0,18 Medium market concentration
HHI < 0,10 Low market concentration
3.2.3 Gini coefficient (G) and the Lorenz curve (L)
The Gini coefficient (G) follows a slightly different approach compared to the CRn and the HHI. Namely, it
measures the inequality in the market shares distribution on the (audit) market between individual (audit) firms rather than the concentration of the market shares on the (audit) market (Abidin, Beattie, & Goodacre, 2008; Bikker, & Haaf, 2002; Mališ & Brozović, 2015). More specifically, the G aims to assess the deviancy between the actual distribution of aggregated market shares (Lorenz curve) and a hypothetical straight uniform distribution (Line of Equality), which indicates equal market shares for all market participants (Bigus & Zimmermann, 2008; Velte & Stiglbauer, 2012).
The accessory Lorenz-curve (L)graphically represents a frequency distribution (Velte & Stiglbauer, 2012), which maps the aggregated percentage of market shares of the (audit) firms measured through audit fees or proxies (e.g. number of clients and clients’ sales) in relation to the aggregated percentage of the amount of (audit) firms, the smallest audit firms as first (Abidin, 2006; Mališ & Brozović, 2015). The aggregated percentage of the amount of (audit) firms is plotted on the horizontal x-axis while the aggregated percentage of the market shares is put on the vertical y-axis (Abidin, 2006; Mynhardt, Plastun, & Makarenko, 2014). If all (audit) firms would have equal market shares (or have the same size), the Lorenz curve would be a straight diagonal line (Line of Equality). The concentration level is assumed to be higher (which means a higher inequality in the market shares can be observed) when the Lorenz curve slopes further downwards (below the Line of Equality) or in other words when it becomes more convex (Mališ & Brozović, 2015; Marten & Schultze, 1998; Velte & Stiglbauer, 2012).
The formula used to calculate the G in a significant amount of related research papers (e.g. Abidin, 2006; Abidin, Beattie, & Goodacre, 2008; Mališ & Brozović, 2015; May, 2016; Rabaeys & De Beelde, 2012), with the data arranged by increasing amount of market share/size, is as follows: