Netherlands Environmental Assessment Agency (MNP), P.O. Box 303, 3720 AH Bilthoven, the Netherlands; Tel: +31-30-274 274 5; Fax: +31-30-274 4479; www.mnp.nl/en
MNP Report 500114009/2007
Exploring European countries’ emission
reduction targets, abatement costs and measures
needed under the 2007 EU reduction objectives
M.G.J. den Elzen P.L. Lucas
A. Gijsen*
Contact:
Michel den Elzen
Global Sustainability and Climate (KMD)
MNP – Netherlands Environmental Assessment Agency Michel.den.Elzen@mnp.nl
This research was performed with the support of the Dutch Ministry of Housing, Spatial Planning and the Environment as part of the International Climate Change Policy Project (M/500114).
© MNP 2007
Parts of this publication may be reproduced, on condition of acknowledgement: 'Netherlands Environmental Assessment Agency, the title of the publication and year of publication.'
Acknowledgements
This report is part of a research project entitled ‘Options for post-2012 EU burden-sharing and EU-ETS allocation’. The project was conducted by a consortium of three research institutes in the Netherlands, consisting of MNP (Netherlands Environmental Assessment Agency), Ecofys and the Energy Research Centre of the Netherlands (ECN).
The project has been financed by the Dutch Ministry of Housing, Spatial Planning and the Environment (VROM) as part of its National Research Programme on Climate Change (NRP-CC), particularly its sub-programme dealing with ‘Scientific assessment and policy analyses’. This programme was implemented by MNP.
This report has benefited from useful comments of a Steering Committee consisting of Maurits Blanson Henkemans (Ministry of Economic Affairs), Henriette Bersee, Marcel Berk and Erwin Mulders (Ministry of VROM), Paul Koutstaal (Ministry of Finance), Rob Aalbers (University of Amsterdam) and Herman Vollebergh (Erasmus University, Rotterdam). Special thanks are due to Judith Bates (AEA Technology Environment, United Kingdom) for providing detailed data of the non-CO2 greenhouse gas emissions by country, year and source sector of the LREM (long-range energy modelling) baseline scenario. Also special thanks are due to Ernst Worrell and Robert Harmsen (Ecofys, the Netherlands) for providing the
marginal abatement costs and potential information of the GENESIS database, which forms the basis of all the countries’ costs projections given in this report. Finally special thanks to Jeroen Peters (MNP) for further data support.
Finally, the authors would like to thank Marcel Berk (working at MNP up to September 2006), Tom Kram, Ton Manders, Leo Meyer, Joop Oude Lohuis, Ruud van den Wijngaart (MNP), Robert Harmsen and Ernst Worrell (Ecofys, the Netherlands), Stefan Bakker and Jos Sijm (ECN) for their comments on and contributions to this report, and Ruth de Wijs (MNP) for correcting the English text.
Rapport in het kort
Het verkennen van de emissiereductiedoelstellingen, mitigatiekosten en noodzakelijke maatregelen voor de Europese lidstaten onder de 2007 EU-reductiedoelstellingen
Het is technisch mogelijk voor de Europese Unie om de in 2007 aangenomen unilaterale reductiedoelstelling van 20% ten opzichte van het 1990-niveau te halen. De tevens in 2007 aangenomen multilaterale reductiedoelstelling van 30% kan technisch worden gehaald door de inzet van CDM en emissiehandel, maar kan wel leiden tot hogere kosten. Energy
efficiency verbeteringen vormen in beide scenario’s veruit de belangrijkste reductieoptie, gevolgd door veranderingen in brandstofkeuze en de reducties van niet-CO2-broeikasgassen. De reductiedoelstellingen en kosten voor de individuele EU-lidstaten in 2020 verschillen aanzienlijk, en zijn sterk afhankelijk van de methode voor de interne differentiatie van emissiereducties (bijvoorbeeld op basis van gelijke kosten of convergentie in hoofdelijke emissies), en in een mindere mate van de EU-reductiedoelstelling zelf (20% unilateraal of 30% multilateraal). Hierdoor is een afspraak over de interne differentiatiemethode
belangrijker dan de afspraak over de algemene EU reductiedoelstelling.
Trefwoorden: EU-lastenverdeling, reductiekosten, emissie handelsysteem, post-2012 regime, emissie doelstellingen, toekomstige verplichtingen
Contents
Summary...7
1 Introduction ...11
1.1 Background ...11
1.2 Three scenarios ...13
1.3 New circumstances for EU burden-sharing ...14
1.4 Post-2012 EU burden-sharing approaches...16
2 The FAIR EU modelling framework ...21
2.1 The FAIR region model ...22
2.2 The FAIR EU model ...23
2.3 The MAC-EU tool ...24
3 Options for post-2012 EU burden-sharing...31
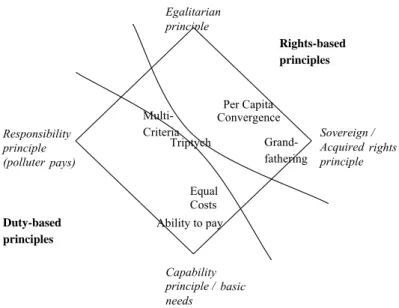
3.1 International burden-sharing regimes and their main equity principles ...31
3.2 Grandfathering ...33
3.3 Per capita convergence...33
3.4 Multi-criteria ...34
3.5 Ability to pay ...34
3.6 Equal costs ...35
3.7 The Triptych approach...36
4 Options for post-2012 EU burden-sharing and ETS allocation ...41
4.1 Three major types of options ...41
4.2 Quantitative aspects ...44
5 Model analysis of EU burden-sharing according to the present system ...47
5.1 Global background...47
5.2 The EU 20% unilateral without CDM scenario...51
5.3 The EU 20% unilateral with CDM scenario ...59
5.4 The EU 30% in a multilateral regime scenario...62
5.5 Abatement measures for the European countries...67
6 Model analysis of EU burden-sharing with ETS allocation at EU level...75
6.2 Step 2: EU and Member State Sectoral ETS Caps...77
6.3 Step 3: Member State non-ETS Caps ...80
6.4 Reduction targets and abatement costs for the individual EU countries for the EU 20% unilateral without CDM scenario...85
6.5 Reduction targets and abatement costs for the individual EU countries for the EU 20% unilateral with CDM scenario...90
6.6 Reduction targets and abatement costs for the individual EU countries for the EU30% in a multilateral regime scenario...93
7 Discussions ...97
7.1 Evaluating the burden-sharing approaches ...97
7.2 Comparing the results with earlier studies...100
7.3 Comparing results with announced emission reduction targets of individual countries...103
7.4 Robustness of the results...104
7.5 Important limitations of the current study...107
8 Conclusions ...111
Appendix A The description of the MAC-EU tool...121
Step 1: the GENESIS files...122
Step 2: from frozen efficiency to baseline...122
Step 3: creating the curves...126
Step 4: converting the curves for FAIR...127
Appendix B Contribution of the sectors to the total domestic abatement...131
Appendix C Contribution of the different reduction measures in total domestic abatement ...137
Summary
Under the Kyoto Protocol, the EU Environment Council adopted a greenhouse gas (GHG) emission reduction target of 8% in 1997 for the EU in 2012 relative to 1990. In March 2007 the EU decided to adopt a unilateral target of reducing its GHG emissions by 20% in 2020 compared to 1990 levels. The EU also declared its willingness to reduce its emissions by 30% as its contribution to a global and comprehensive agreement for the period beyond 2012, provided that other developed countries commit themselves to comparable emission
reductions, and economically more advanced developing countries also contribute adequately according to their responsibilities and respective capabilities.
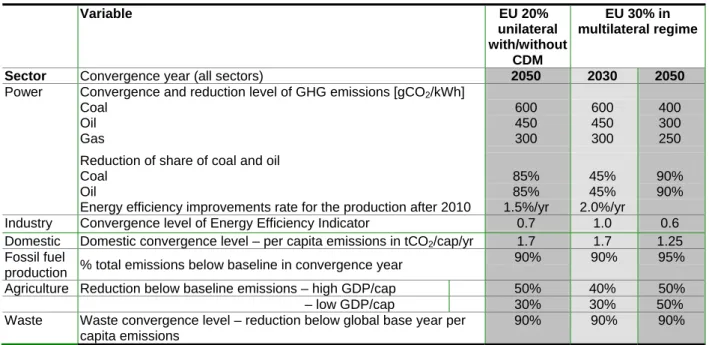
This report explores methods for allocating the EU reduction objectives (20% unilateral or 30% multilateral) adopted by the Council of the European Union among the European Member States to analyse the impacts on costs, reduction efforts and distributional effects. More specifically, the analysis focuses on three scenarios based on different assumptions for the level of international participation and the EU reduction objective, i.e.:
1. ‘EU 20% unilateral without CDM’: The EU implements its 20% reduction target independently and all other countries implement hardly any climate policy beyond 2012. Emission allowances are traded freely between the EU Member States, but this case assumes no availability of JI (Joint Implementation) and CDM (Clean
Development Mechanism) beyond 2012;
2. ‘EU 20% unilateral with CDM’: This case is similar to the ‘EU 20% unilateral without CDM’ case, but now with the availability of international flexibility mechanisms JI and CDM;
3. ‘EU 30% in a multilateral regime’: The EU adopts a 30% reduction target as part of a broader coalition, in which Annex I countries and advanced developing countries adopt comparable reduction efforts by 2020. Emissions trading is only allowed within the coalition. Furthermore there is the availability of JI and CDM beyond 2012. This study also analyses the reduction targets and abatement costs for the 27 EU Member States (the EU-15 countries, i.e. the old EU members, the EU-10 countries, i.e. the new EU members and Bulgaria and Romania, i.e. the latest EU newcomers, hereafter also EU-2 new) in 2020, based on two major types of options for EU burden-sharing and Emission Trading System (ETS) allocation beyond 2012:
1. Present system, i.e. initially sharing the overall EU emission target among its Member States and, subsequently each Member State dividing its national target between the ETS and other sectors.
2. EU burden-sharing with ETS allocation at EU level, i.e. both the top-down ETS cap and the bottom-up allocation rules are set at EU level, while the EU target for the non-ETS sectors is shared among the Member States.
For the option 1, the six different possible post-2012 regimes for internal EU burden-sharing are selected:
(i) Grandfathering, i.e. applying a flat reduction rate for all EU countries to their historic
emissions in a certain reference period (Kyoto targets);
(ii) Per capita convergence, i.e. differentiation of emission reductions based on a
convergence of emission allowances towards an equal per capita emissions in a certain convergence year (2050);
(iii) Multi-criteria, i.e. differentiation of emission reductions based on a convergence of
the indexed value of a mix criteria, notably (i) income per capita, (ii) emissions per capita, and (iii) emissions per unit GDP (equal weighting);
(iv) Ability to pay, i.e. differentiation of emission reductions based on per capita income
(Market Exchange Rates MER);
(v) The ‘Triptych’ approach, i.e. differentiation of emission reductions based on a variety of sector and technology criteria; and
(vi) The Equal costs approach, i.e. differentiation of emission reductions based on equal mitigation costs per country (as a percentage of Gross Domestic Product (GDP) expressed in MER).
For option 2, the allocation between the ETS and non-ETS sector at EU level is based on the allocation schemes (i) Marginal abatement costs (i.e. differentiation of emission reductions based on the same marginal abatement costs per country), (ii) Grandfathering, (iii) Triptych approach. The first option is selected because it reflects the ambition for maximum cost efficiency, the second as this method is used as the present allocation scheme. The third option has been used in the past for the internal EU burden-sharing during the Kyoto negotiations. The allocation of the non-ETS sector is based on Marginal abatement costs,
Grandfathering, Triptych and Per capita convergence approach. The first three are selected
here for the same criteria as described before, and the last is included as it is simple and commonly used.
The report further analyses whether it is technically feasible, and what portfolio of reduction measures (including the Kyoto mechanisms) would be required to meet these EU reduction objectives.
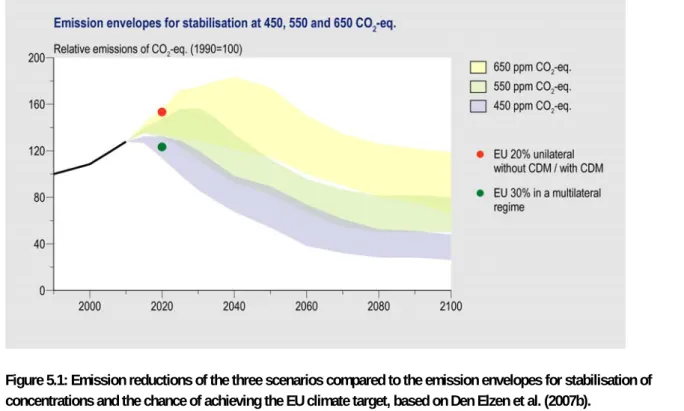
From the aforementioned analysis, the authors draw the following main conclusions: It is technically feasible for the EU to meet the 20% reduction target as part of a
unilateral regime, with abatement costs in the order of 0.2–0.3% of GDP when CDM is excluded. Including CDM would lower to a third under a cost optimal implementation (unrestricted CDM). It should be noted that these costs only capture direct costs of abatement action not taking into account the costs related to a change in fuel trade or macro-economic impacts (such as sectoral changes or trade impacts).
Meeting a 30% reduction objective as part of a multilateral regime leads to higher abatement costs for the EU than meeting its independent 20% reduction target in a unilateral regime. The 20% unilateral scenario and 30% multi-lateral regime scenario lead to the same level of domestic reductions for the EU (i.e. 20% compared to 1990 level). However, for the 30% multi-lateral regime the additional reduction to achieve the
30% reduction will be met through CDM and international emissions trading at relatively high costs.
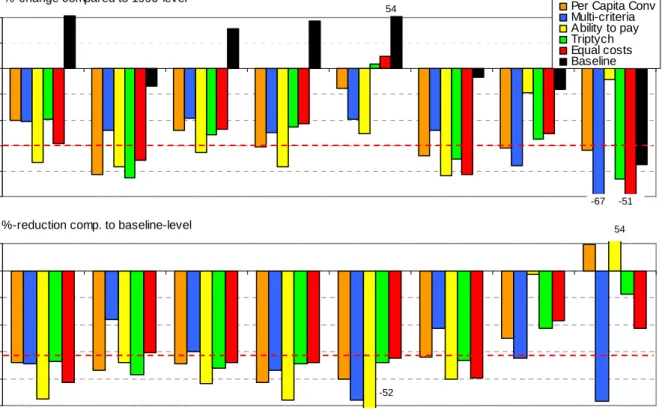
The emission reduction targets for the various European countries caused by the applied burden-sharing approaches show a wide range for EU burden-sharing and ETS allocation beyond 2012 for both major options.
More specifically, a uniform reduction target (Grandfathering) leads to high reductions for the first option for EU burden-sharing and ETS Present system applied to countries which currently have emission growth targets under the Kyoto Protocol; examples are Greece, Portugal and Spain. Per capita convergence and the
Multi-criteria approaches lead to high reductions for countries with relatively high
per capita emissions, while the Ability to pay approach leads to higher reductions for the EU-15 countries. Even though the Equal costs approach leads to high reductions for the EU-10 and some EU-15 countries, the results highly depend on the costs assumptions. The Triptych approach takes a kind of central position in terms of differences in reduction targets between countries compared to the other regimes. Referring to the second option for EU burden-sharing and ETS EU burden-sharing
with ETS allocation at EU level the overall reduction targets of countries also show
a wide range. Grandfathering leads to high reductions for countries with a growth target under Kyoto (see also option 1). The Marginal abatement costs approach leads to high reductions for many EU-10 countries, and Bulgaria and Romania (EU-2 new), and a mixture of high and low reductions for the EU-15 countries. The reductions under the Triptych approach are closer to the middle compared to the reduction of all cases.
The option EU burden-sharing with ETS allocation at EU level leads to more absolute reductions in the non-ETS sectors than in the ETS sectors, as reducing emissions in the non-ETS sector is more cost-effective or more effective in terms of reduction potentials compared to the ETS sector. However, as in the baseline scenario the total emissions in the non-ETS sector (especially from transport) increase more than the emissions in the ETS sector, compared to 1990 levels the reductions the emissions in the ETS sector are larger (especially from industry). For the industry sector the reductions compared to 1990 levers are well above the overall EU reductions (20% or 30%), whereas in the power sector the reductions are just above the overall EU reductions. The reductions for the non-ETS sector show a wide range for all countries.
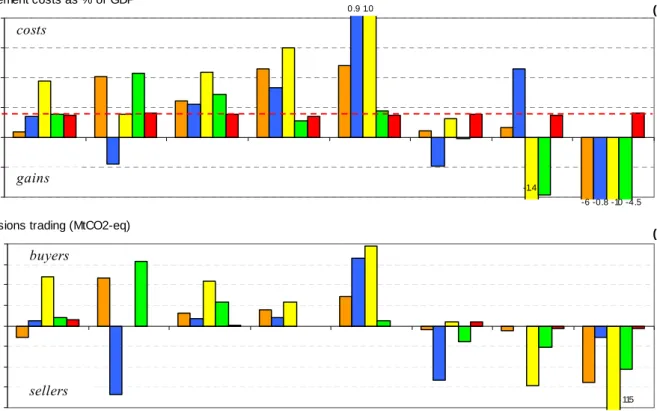
There are also large differences in the countries’ abatement costs between regimes, obviously except for the Equal costs approach. Generally, the EU-15 countries are confronted with medium costs, while many EU-10 countries and the EU-2 new countries (Bulgaria and Romania) may benefit from emissions trading.
The ‘Triptych’ approach seems to result into the most equally spread distribution of reduction efforts and abatement costs among all European countries (more for EU-15 countries and less for EU-10 countries, Bulgaria and Romania) and it also scores high in a qualitative multi-criteria analysis on the basis of environmental criteria, political criteria, economic criteria and technical criteria (compared to the other approaches).
For many countries, the difference between the various approaches aiming for one
overall EU reduction level (of 20% or 30% reduction) can be larger than the difference in reductions needed to reach the overall EU reduction level. Hence, the agreement on the burden-sharing regime may be more significant than the agreement on the overall EU reduction level.
For example, in the Present system for Spain the range covers a reduction of 17% to a growth of 18% for the EU 20% reduction target. This overlaps with the EU 30% reduction target, in which the range covers a reduction of 25% to a growth of 5%. Option 2 EU burden-sharing with ETS allocation at EU level shows a similar pattern.
The EU-15 countries are net buyers on the emissions trading market for the EU 20% unilateral scenarios, while the 10 and 2 new countries are net sellers. Many EU-10 countries become small buyers for the EU 30% multilateral regime scenario.
The United Kingdom’s 2020 reduction target of 27% – 32% (compared to 1990 levels) is consistent with the range of reductions for the United Kingdom associated with the EU 20% reduction objective found in this study, but lower than our United Kingdom range for the EU 30% target.
The Netherlands’ 2020 reduction target for greenhouse gases of 30% is outside the range resulting from various allocation approaches for meeting the 20% EU target [about 10% – 20% emission reduction], but inside the range for the EU 30% target [about 20% – 30% emission reduction].
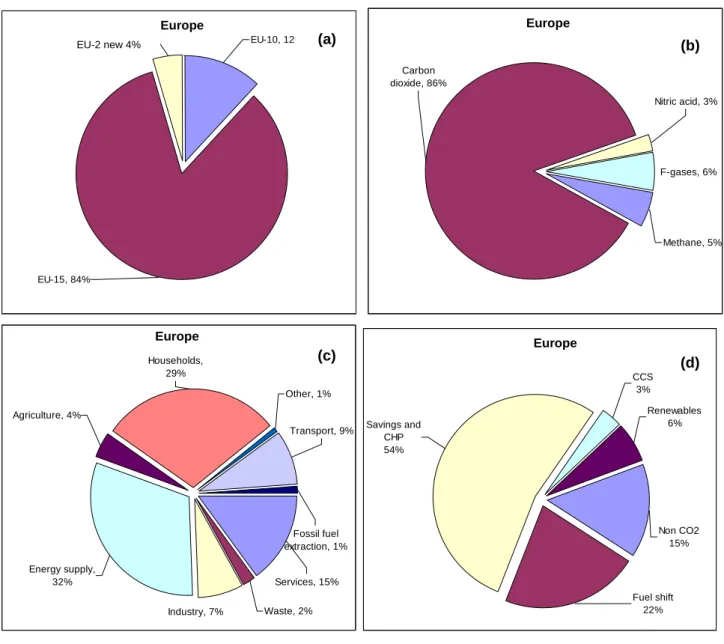
Meeting the EU overall reduction objective requires major changes in the energy system. Energy efficiency improvements represent by far the largest share in emission
reductions, followed by fuel shift switch and non-CO2 reduction options. This study did not analyse the feasibility of the EU 20% renewables target.
1
Introduction
1.1 Background
While there has been much attention in the literature and policy circles for both post-2012 international climate regimes and the – mainly short-term – future of the European Emissions Trading System (ETS), hardly any attention has yet been paid to the issue of future internal EU burden-sharing, and how this may relate to the future of the ETS. The issue of EU burden-sharing has only recently returned to the EU climate policy agenda. One reason for this is that the other issues have generated more immediate concern. This also applies to the international regime, due to uncertainty about the future of the Kyoto Protocol after the withdrawal of the USA, and for the ETS because of its central role in meeting the present EU commitments under the Kyoto Protocol up to 2012.
At the same time, the EU has started defining its medium and long-term international climate strategies. It did so using a ‘top-down’ rather than a ‘bottom-up’ approach and from a global perspective. In December 2004, the EU Environment Council concluded that, in order to have a reasonable chance of limiting global warming to 2°C above pre-industrial levels, global emissions would possibly need to peak within two decades, and subsequently be reduced by at least 15% (and possibly as much as 50%) by 2050, compared to 1990 levels. In March 2005 the EC concluded that, as part of a global effort, industrialised countries would need to adopt emission reductions in the order of 15–30% by 2020, and should consider reductions up to 60–80% by 2050.1 Although these figures are well conditioned by broader participation
and other Annex I Parties taking on similar commitments, the EU sent out a strong signal.
On 10 January 2007 the European Commission went another step further by setting out proposals and options for keeping climate change to manageable levels in its Communication ‘Limiting Global Climate Change to 2° Celsius: The way ahead for 2020 and beyond’.2 More
specifically, it proposes that (in the context of international negotiations) the EU should pursue the objective of 30% reduction in greenhouse gas emissions (GHG) by developed countries by 2020 (compared to 1990 levels). This is considered necessary to ensure that the world stays within the 2ºC limit. Until an international agreement is concluded, and without prejudice to its position in international negotiations, the EU should now take on a firm independent commitment to achieve at least a 20% reduction of GHG emissions by 2020, via
1 http://ue.eu.int/ueDocs/cms_Data/docs/pressdata/en/ec/84335.pdf
2 The January 2007 Communication follows up and builds on a Communication published by the Commission in February 2005
entitled ‘Winning the Battle Against Climate Change’, which highlights the need for broader participation by countries and sectors not already subject to emission reductions, the development of low-carbon technologies, the continued and expanded use of market mechanisms, and the need to adapt to the inevitable impacts of climate change
the EU-ETS, other climate policies and actions in the context of the energy policy. This approach should allow the EU to demonstrate international leadership on climate issues.
The EU Environment Council3 adopted these conclusions at its meeting in February 2007.
More specifically, ‘the Council is willing to commit to a reduction of 30% of greenhouse gas emissions by 2020, compared to 1990, as its contribution to a global and comprehensive agreement for the period beyond 2012, provided that other developed countries commit themselves to comparable emission reductions, and economically more advanced developing countries adequately contribute according to their responsibilities and respective capabilities.’ ‘Until a global and comprehensive post-2012 agreement is concluded, and without prejudice to its position in international negotiations, the EU makes a firm independent commitment to achieve at least a 20% reduction of greenhouse gas emissions by 2020 compared to 1990.’
At the beginning of March 2007 the European leaders confirmed the target of a 20%
reduction in greenhouse gas emissions by 2020, and additionally agreed on the commitment that renewable energy will comprise 20% of EU energy consumption by the same year. These decisions, in particular on the independent 20% reduction commitment, are quite remarkable for two reasons. First, the EU has not yet fully explored the economic implications of such targets via a range of economic and energy-system models 4, especially not for scenarios
under limited participation.5 Second, the EU has still to discuss and agree on the internal
allocation of the emission reduction efforts. This is in contrast to the policy process preceding the agreement on the Kyoto Protocol (COP-3, 1997), when the EU made its proposal for a 15% emission reduction target for the industrialised countries after an internal agreement on internal burden-sharing among its Member States (see for further details, Ringius, 1999). However, as the discussions on the new climate targets in the Environmental Council already indicated, the issue of how to distribute the emission reduction burden internally will again become important. The Council conclusions in March decided that a differentiated approach to the contributions of the Member States is needed, which should reflect fairness, be
transparent and take into account the national circumstances of the Member States. The EU Environmental Council recognises that the implementation of these targets will be based on EU policies and on internal burden-sharing agreements. Finally, it invites the European Commission, in close cooperation with the Member States, to immediately initiate a technical analysis to provide a basis for further in-depth discussion.
3 http://register.consilium.europa.eu/pdf/en/07/st06/st06621.en07.pdf
4 A staff working paper provides the background analysis for the Communication ‘Limiting Global Climate Change to 2° Celsius:
The way ahead for 2020 and beyond’, which can be downloaded from: http://ec.europa.eu/environment/climat/pdf/ia_sec_8.pdf.
5 Russ et al. (2005a) uses a macroeconomic model GEM-E3 (Capros et al., 1997) and an energy model POLES (Criqui et al., 2003)
to analyse the costs for the EU when the EU reduces emissions by 2025 to 20% below 1990 levels, and no other countries take on commitments beyond 2012. Boeters et al. (2007) analysed limited participation scenarios with EU reductions as high as 10% compared to 1990 levels.
1.2 Three scenarios
Given the fact that the EU has already proposed a 20% (independent) reduction target, this report starts from an internal burden-sharing of the 20% reduction target. More specifically, the report analyses the reduction targets and abatement costs for 27 individual European countries, for an overall target of 20% below 1990 levels in 2020, based on different approaches for internal EU burden-sharing. It also presents the reduction measures (i.e. energy efficiency improvements) needed, as well as the role of external abatement measures (Kyoto mechanisms, CDM and emissions trading) in meeting the reduction commitments in a cost-effective way. It should be noted that the costs presented in this study only capture direct costs of abatement action but not taking into account the costs related to a change in fuel trade or macro-economic impacts (including sectoral changes or trade impacts).
This report refers to the subdivision of the EU6 into three groups, i.e. the EU-15 countries, i.e.
the old EU members, the EU-10 countries, i.e. the new EU members and Bulgaria and Romania, i.e. the latest EU newcomers, hereafter also EU-2 new, as presented in Table 1.1. The group of the 27 EU countries is further referred to as the EU.
Table 1.1: The 27 EU countries7 plus the three groupings used in this report. The ‘EU region’ refers to the 27 EU countries as a single group.
EU-15 EU-10 EU-2 new
Ireland Slovenia Bulgaria
Belgium Cyprus Romania
Germany Czech Republic
Denmark Slovak Republic
Spain Hungary Finland Estonia France Poland United Kingdom Malta
Austria Latvia Greece Lithuania Portugal Sweden Luxembourg The Netherlands Italy
This analysis focuses on three scenarios based on varying assumptions for the participation of world countries and the EU reduction objective, i.e.:
1. ‘EU 20% unilateral without CDM’: There is insufficient political will for a collaborative international post-2012 agreement. The EU implements its 20% independent reduction target and all other countries hardly implement any climate policy beyond 2012. Emission allowances are traded freely between the EU Member
6 Norway, Turkey and Switzerland do not belong to the EU and form no part of the EU-bubble at the time of writing, and are
therefore not included in the calculations in this report.
7 The former Yugoslavia states are not included in calculations for this report. However, the omitted emissions are negligible on the
States through the Emissions Trading System (ETS). This case assumes no availability of JI and CDM beyond 2012.
2. ‘EU 20% unilateral with CDM’: This case is similar to that of the ‘EU 20% unilateral without CDM’, but now includes the availability of international flexibility
mechanisms JI and CDM beyond 2012.
3. ‘EU 30% in a multilateral regime’: The negotiations succeed in forming a coalition that adopts emission reduction targets, including not just the Annex I countries, but also all advanced developing countries (ADCs) such as China, Mexico, South Korea and Brazil. The EU adopts a 30% reduction target, and other Annex I countries plus ADCs adopt comparable reduction efforts by 2020.8 Emissions trading is only allowed
within the coalition. There is also the availability of JI and CDM beyond 2012, as an emission reduction option in countries with no restrictions on emissions, such as India.
The following section presents these different burden-sharing approaches, but first we briefly describe the new circumstances for EU burden-sharing.
1.3 New circumstances for EU burden-sharing
Compared to the pre-1997 Kyoto Protocol period, there are a number of factors that have changed and will affect the internal EU burden-sharing discussion, including:
• The extension of the EU from 15 to 25 Member States and recently to 27 Member States (as already mentioned above): The extension not only increases the number of Parties whose concerns and interests need to be met; it has also resulted in a greater diversity in national circumstances.9 The new Eastern European Member States are
generally much less wealthy than the other EU Member States and their economies less energy-efficient. Some Member States also have relatively carbon-intensive economies due to the high percentage of coal used in power generation (e.g. Poland, Czech Republic and Bulgaria). Wagner and Michaelowa (2005) have shown that the enlargement allows the EU bubble to expand and to take on a much more stringent target for the second commitment period of the Kyoto Protocol.
• The introduction of the EU-ETS, which came into effect at the beginning of 2005. This system has introduced national caps on the (CO2) emissions from major emitting sectors (energy production, heavy industry). It implies that emissions from Member States are not only affected by future internal burden-sharing arrangements, but also by the allocations under the ETS. Moreover, in contrast to the internal burden-sharing, the allocation of emissions to sectors under the ETS is subject to the scrutiny of the
8 Chapter 5 analyses the question as to what level of efforts by other Annex I parties and advanced developing countries could be
considered comparable to the EU 30% reduction targets.
9 The EU enlargement also affects the greenhouse gas bubble under the Kyoto Protocol. It could reduce the gap between
business-as-usual and the target during the first commitment period by about 50% (see Michaelowa and Betz, 2001). The enlargement also affects the emission reduction targets for the second commitment period, as first analysed by Wagner and Michaelowa (2005).
EU Commission, rather than just the Member States. Thus the ETS has reduced the flexibility for Member States in distributing emission reductions among sectors. On the other hand, the ETS has enhanced the opportunities for Member States to meet their EU burden-sharing commitments in a more cost-effective way.
Theoretically, the internal EU burden-sharing could be heavily impacted by the ETS, depending on the future development of the ETS. If emission allocation under the ETS is increasingly determined by the EU Commission (either by direct allocation or via strict guidance for the Member States in making allocation plans) and the scope of the ETS continues to be broadened, this will increasingly affected the EU burden-sharing among the Member States. Initially it may result in Member States anticipating the allocations under the ETS and trying to obtain compensation. Eventually, the EU burden-sharing may be stripped down to dealing only with the remaining emission allowances of the sectors not included in the ETS. In the longer term, it can be envisaged that continually extending the scope of the ETS and removing national jurisdiction would result in the EU becoming the only Party to take on new commitments under future international climate agreements, rather than the individual Member States.
Sijm et al. (2007) discusses the links between the EU-ETS and EU burden-sharing in more detail, and consider three major types of options for EU burden-sharing and ETS allocation beyond 2012:
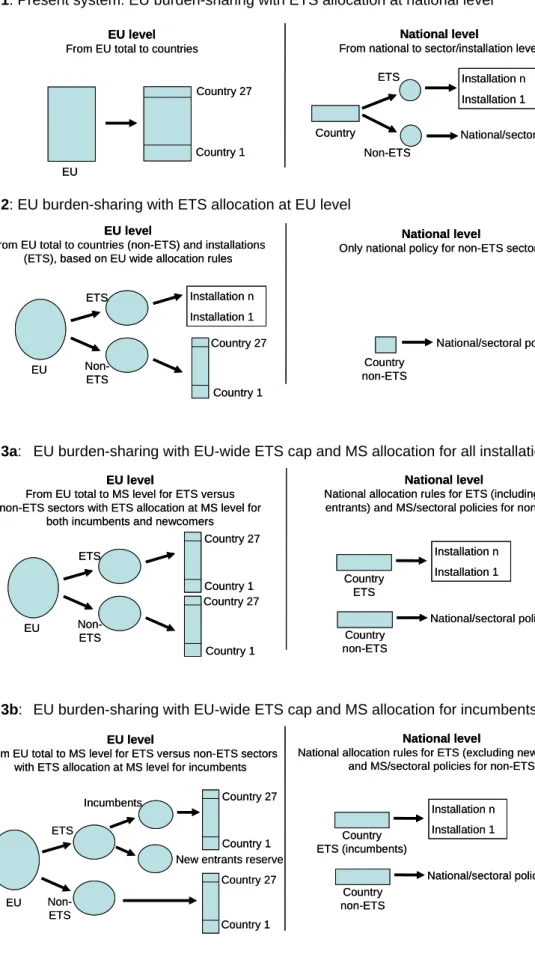
1. Present system, i.e. initially sharing the overall EU emission target among its Member States and, subsequently each Member State (MS) dividing its national target between the ETS and other sectors, while the allocation of the national ETS cap to eligible installations is based on (different) MS rules.
2. EU burden-sharing with ETS allocation at EU level, i.e. both the top-down ETS cap and the bottom-up allocation rules are set at EU level, while the EU target for the non-ETS sectors is shared among the Member States.
3. EU burden-sharing with an EU-wide ETS cap and MS allocation for either (a) both
existing and new installations (Type 3a) or (b) existing installations only (Type 3b), while
the EU target for the non-ETS sectors is shared among the Member States.
These three types of options have different implications in quantitative terms10 (e.g. assigned
amounts of emissions and costs at the EU, national, sector or installation levels), depending on the specific burden-sharing and allocation rules applied. The three options are discussed in more detail in chapter 4 of this report. However, the analysis focuses only on the first two options. Chapter 5 uses option 1 as the starting point: more specifically, starting with an EU reduction target, the emissions are re-allocated (excluding the international aviation and marine sector) among the individual European countries using different burden-sharing approaches (next paragraph), with calculations of the national reduction targets and abatement costs (accounting for the Kyoto Mechanisms). Chapter 6 uses option 2 as its
starting point, and first calculates the EU targets for the ETS and non-ETS sectors, based on an EU reduction target, then calculates for the EU-ETS cap according to bottom-up rules (described in chapters 4 and 6) the allocation in the ETS sector among the different sub-sectors with ETS. Finally, the non-ETS cap per Member State is calculated using different burden-sharing approaches.
Coverage of the EU-ETS scheme ─ The EU-ETS currently covers CO2 emissions from
combustion plants (>20 MW thermal input; including power generators, oil refineries, coke ovens), as well as from activities and sectors such as ferrous metals, cement clinker, pulp from timber, glass and ceramics (> threshold capacity level; including process emissions). About 45% of the EU’s CO2 emissions are covered by the EU-ETS. A greater proportion should be covered from 2013. For the period post-2012, this coverage may be changed, including the following options (Sijm et al., 2007):
• Emissions: It has been suggested that process emissions should be excluded from the EU-ETS in order to make the designs of National Allocation Plans more transparent and simple (also because it is hard to reduce process emissions).
• Gases: Coverage of the EU-ETS could be expanded by including greenhouse gases other than CO2, such as methane or perfluorcarbons (PFCs).
• Sectors/activities: On the one hand, a suggestion has been made to expand the present coverage of the scheme to include other sectors and/or activities (notably aviation) in order to enhance the environmental effectiveness and economic efficiency of the scheme. On the other hand, it has been proposed that small installations should be excluded from the scheme because of the high transaction costs for these installations, which contribute only a small fraction of the total emissions covered.
This report assumes (for the post-2012 EU climate regime) that the ETS sector includes all GHG emissions from the electricity and industry sector, and the non-ETS sector includes the remaining emissions. This assumption only affects the calculations for option 2, i.e. the analysis presented in chapter 6.
1.4 Post-2012 EU burden-sharing approaches
The emission reduction percentages of the European countries for the first commitment period of the Kyoto Protocol were essentially based on the political willingness of European countries themselves. There was little underpinning of the level of global or Annex I action needed. The initial proposal for allocating emission reductions within the EU-15 countries was based on the Triptych approach (section 3.7), but these figures were further renegotiated before and after the Kyoto agreements (see Phylipsen et al., 1998; Ringius, 1999). It is not yet clear how a new internal EU burden-sharing agreement would be reached. The European Council (EC, 8-9 March 2007) has asked the EU Commission ‘to start a technical analysis of criteria, including socioeconomic parameters and other relevant and comparable parameters, to form the basis of a more in-depth discussion’, but is unclear what will be done with this
information. Given the fact that the EU has already proposed a 20% reduction target; this seems the most logical starting point for the negotiations. Again, negotiations could be based on initial proposals based on certain allocation formula, but this is not certain. In principle, two variants for differentiating future emission targets between EU Member States can be envisaged (Höhne et al., 2005):
1. In a next round of negotiations, the EU Member States start the process by indicating what individual reductions they consider feasible/acceptable for their country (pledge-based approach). This approach includes the risk that these reductions do not lead to the low emission level needed to reach the overall agreed EU total reduction (20% or 30% reduction compared to 1990 levels).
2. Alternatively, a common formula could be agreed (see also below) to differentiate between emission targets, starting from the overall reduction target objectives. This rule could lead to reduction percentages for each individual country, which could then be modified by further negotiations.
For the second variant, an allocation rule or formula would have to be selected in order to share emission allowances between the EU countries. This report focuses on this variant and considers six burden-sharing approaches.
The simplest approach would be to choose a reference year and to apply equal percentage reductions to all countries (‘flat rate’ or ‘grandfathering’) (1. Grandfathering). This method is simple but does not take into account structural differences between countries, historic trends and reduction potentials. It is therefore very unlikely that this will happen. Some of the other rules have been proposed by various countries during the negotiations on the Kyoto Protocol, including EU Member States (see for an overview Torvanger and Godal, 2004). Early in the negotiations France, Switzerland and the EU proposed differentiation based on convergence of per capita emissions over time (UNFCCC, 1997a) (2. Per capita convergence), but this was withdrawn on the advent of the agreed common EU target (Depledge, 2000). Norway and Iceland proposed burden-sharing based on multi-criteria rules containing a set of
indicators. Specifically, the Norwegian proposal considers a Party’s reduction of greenhouse gas emissions based on three indicators: GDP per capita, emission intensity and emissions per capita (3. Multi-criteria). There were also proposals from the new EU Member States. Poland supported by other East European states (Bulgaria, Estonia, Latvia and Slovenia) suggested a burden-sharing scheme based on GDP per capita as the main criterion for differentiation (4. Ability to pay). Instead of these rather ‘simple’ allocation rules, more complex allocation approaches could also be used. Here two candidates are considered: the (renewed) Triptych approach (5. Triptych), and an approach based on equal costs or welfare loss for all Member States (6. Equal costs).
From these more complex approaches, the first candidate (the Triptych approach) has proved its use in supporting decision-making to differentiate between the EU’s internal Kyoto target
between its Member States, both before and after Kyoto (COP-3) (Blok et al., 1997). In the political (negotiation) process of the EU and its Member States, the application of the Triptych approach was very successful because it resulted in increased insight among EU negotiators concerning the feasibility and comparability of emission reductions and the differences in national circumstances. On the basis of this improved understanding it was possible to come to an agreement on burden differentiation within the EU. The Triptych approach also fits in well with the sector-based approach of the ETS.
However, as shown in the evaluation of the burden-sharing arrangement for the first
commitment period, it does not necessarily result in equal relative costs for all Member States (Eyckmans et al., 2002; Viguier et al., 2003). More specifically, some countries (Sweden, Belgium, the Netherlands, Spain and Portugal) have a relatively heavy burden, while others (Germany, United Kingdom and France) have a relatively light burden. This risk may be enhanced by the increase in the diversity between EU Member States. This is what the second candidate Equal costs approach intends to secure. This is an outcome instead of an allocation-based equity formula (Rose et al., 1998).11 More specifically, the rule is to distribute the
emission reductions in order to equalise net welfare changes across nations (net gain or loss as proportion of GDP equal for each nation).12 It does require the use of macroeconomic or
energy system modelling tools. This implies that the allocation becomes model dependent and thus would first require agreement on the tools to be used, which may be rather
complicated.13 Here, costs are assumed to mean the abatement costs, i.e. abatement costs plus
emission permit sales revenues minus permit purchase costs, and the objective is to achieve the same abatement costs, as a percentage of GDP, for all countries. The FAIR model is used to calculate abatement costs.
This report is structured as follows. Chapter 2 describes the methodology of the modelling framework FAIR 2.1, at the level of individual European countries. Chapter 3 describes the six EU burden-sharing approaches analysed in this report in more detail. Chapter 4 highlights the three major types of options for EU burden-sharing and ETS allocation beyond 2012. Chapter 5 analyses the emission reductions, abatement costs and reduction measures
(including the Kyoto Mechanisms) for the EU countries for the three scenarios based on the
11 The first five burden-sharing approaches are allocation based, i.e. defining equitable differentiation of commitments in terms of
principles for the distribution of emission allowances or the allocation of emission burden approaches, whereas this approach is outcome based, i.e. defining equitable differentiation of commitments in terms of outcome, in particular the distribution of economic effects. Allocation-based approaches are preferred because they are more straightforward, transparent, and specifiable with perfect certainty. A disadvantage of outcome-based approaches is that they are dependent on complex (economic) models, the outcomes of which are usually not transparent to policy-makers. Outcome-based criteria are also subject to controversy over definition of the criteria themselves and the measure of welfare. On the other hand, the (perceived) costs and economic impacts of options for differentiation of future commitments will have an important impact on the evaluation of policy options (see chapter 4).
12 Net welfare change (gain or loss) is equal to the sum of mitigation benefits (benefits from mitigation of greenhouse gas
mitigation, such as reduced climate damage) – abatement costs + permit sales revenues – permit purchase costs.
13 Obvious candidates would be models already widely used by the EU Commission, such as the GEM–E3 model, but instead of
present system for EU burden-sharing and ETS allocation (option 1). Chapter 6 presents a
similar analysis, but now based on EU burden-sharing with ETS allocation at EU level (option 2). Chapter 7 presents a comparison with other studies, the robustness of the results, including a sensitivity analysis, and the limitations of the study. Finally, the conclusions are listed in chapter 8.
2
The FAIR EU modelling framework
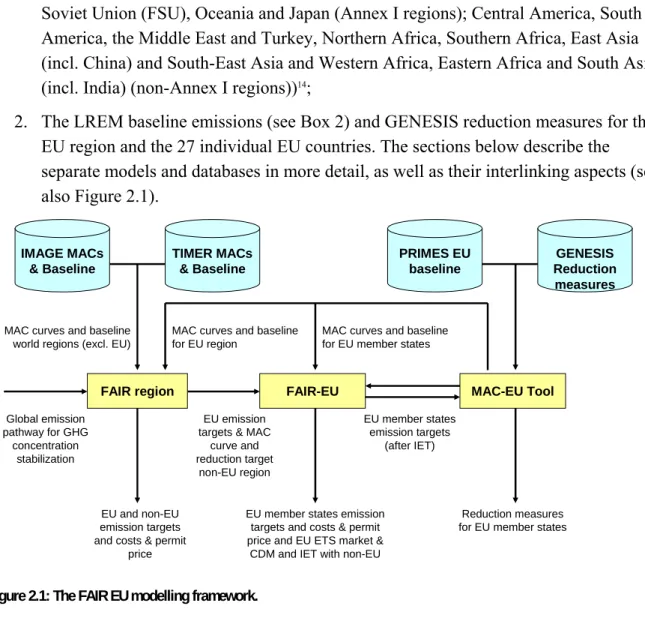
This chapter describes the FAIR EU modelling framework, which consists of three subsequent modelling steps:
1. The FAIR region model (including the EU as a region); 2. The FAIR EU model (including the 27 EU countries); 3. The MAC-EU tool.
The models are fed by two databases:
1. The TIMER-IMAGE baseline emissions (i.e. for the calculations presented in this report, the IMAGE/TIMER B2 baseline scenario, see Box 1) and MAC (marginal abatement cost) curves for 15 non-EU world regions (i.e. Canada, USA, Former Soviet Union (FSU), Oceania and Japan (Annex I regions); Central America, South America, the Middle East and Turkey, Northern Africa, Southern Africa, East Asia (incl. China) and South-East Asia and Western Africa, Eastern Africa and South Asia (incl. India) (non-Annex I regions))14;
2. The LREM baseline emissions (see Box 2) and GENESIS reduction measures for the EU region and the 27 individual EU countries. The sections below describe the separate models and databases in more detail, as well as their interlinking aspects (see also Figure 2.1).
FAIR region FAIR-EU
Global emission pathway for GHG concentration stabilization TIMER MACs & Baseline IMAGE MACs & Baseline EU emission targets & MAC
curve and reduction target non-EU region EU member states emission targets (after IET) GENESIS Reduction measures PRIMES EU baseline
MAC curves and baseline for EU member states
Reduction measures for EU member states
MAC-EU Tool
MAC curves and baseline for EU region
MAC curves and baseline world regions (excl. EU)
EU and non-EU emission targets and costs & permit
price
EU member states emission targets and costs & permit price and EU ETS market &
CDM and IET with non-EU Figure 2.1: The FAIR EU modelling framework.
Box 1: The IMAGE/TIMER B2 baseline scenario used for the 15 non-EU world regions
The baseline scenario used for the default calculations of 15 non-EU world regionsis the updated IMAGE/TIMER implementation of the IPCC-SRES B2 scenario (Van Vuuren et al., 2007a). This scenario is based on medium assumptions for population growth, economic growth and more general trends such as globalisation and technology development. In terms of quantification, the scenario roughly follows the reference scenario of the World Energy Outlook 2004 (IEA, 2004) and, after 2030, economic assumptions converge with the B2 trajectory. The population scenario is based on the UN Long-Term Medium Projection (UN, 2004). For emission and technology trends in land use, the assumptions of the Adapting Mosaic Scenario of the Millennium Ecosystem Assessment were used, as they are a reasonable representation of ‘business-as-usual’ assumptions for land use. GHG
emissions in this scenario increase from about 45 GtCO2-eq. today to more than 80 GtCO2-eq. in 2050
for the set of six GHGs considered in the Kyoto Protocol (CO2, CH4, N2O, HFCs, PFCs and SF6)
using the 100-year Global Warming Potentials from IPCC (2001). This corresponds to a medium- to high-level emission scenario compared to the IPCC SRES (Special Report on Emission Scenarios). As a result, the baseline reaches a GHG concentration of around 850 ppm CO2-eq. by 2100.
2.1
The FAIR region model
The policy decision-support tool, FAIR 2.1 (Framework to Assess International Regimes for the differentiation of commitments) (Den Elzen and Lucas, 2005) was developed to explore and evaluate the environmental and abatement cost implications of various international regimes for differentiation of future commitments when meeting long-term climate targets such as stabilising atmospheric GHG concentrations. The FAIR 2.1 model consists of three linked models:
1. A climate model to calculate the climate impacts of global emission pathways for concentration stabilisation targets and baseline emission scenarios, and to determine the global emission reduction objective – based on the difference between the global emissions scenario (without climate policy) and a global emission pathway.
2. An emission allocation model to calculate the regional emission allowances for more than ten regimes for the differentiation of future commitments within the context of this global reduction objective (from climate model).
3. A costs model to calculate the regional abatement costs and abatements on the basis of the emission allowances (from the emission allocation model), the use of the flexible Kyoto mechanisms such as international emissions trading and substitution of reductions between the different gases and sources following a least-cost approach.
The model calculations are based on 17 world regions. Within the FAIR EU modelling framework, the FAIR region model was slightly adapted for this study. The OECD and Eastern European regions are replaced by the EU region. The model uses the aggregated marginal abatement costs curves and the LREM baseline scenario for this EU region from the MAC-EU tool (see section 2.3 for further details). The MAC curves from the MAC-EU tool
are expressed in euro (2000€), while MAC curves for the other 15 world regions are expressed in dollars ($1995). For the case of simplicity, and as there is only a small
difference between both expressions, we assumed them to be equal and no conversion factors were applied.
The main input of this FAIR region model within the framework is a global emissions
pathway for stabilising greenhouse gas concentrations. The output is the emission allowances for the EU and non-EU region, as well as the aggregated marginal abatement costs curves for the non-EU region, which then forms the input for the FAIR-EU model (see next section). The model also calculates the international permit price for the world emissions trading market.
2.2
The FAIR EU model
The FAIR EU model is a special version of the FAIR region model and was developed for this study to explore and evaluate the environmental and abatement cost implications of different burden-sharing approaches for differentiating future commitments for the 27
individual EUcountries. The model includes bottom-up marginal abatement costs curves for all individual EU countries, plus baseline developments for population, GDP (MER, 2000€) and emissions of the Kyoto GHGs for the period 2000–2030 under the September 2003 EU baseline scenario by DG-TREN, i.e. the LREM scenario (see section 2.3 and Box 2). The historical (1990–2000) GHG emissions are estimated based on 2000 emissions data of the LREM baseline, combined with historical greenhouse gas emission trends from the database of the International Energy Agency (CO2 emissions) (IEA, 2005) and EDGAR (non-CO2 GHG emissions) (Olivier et al., 2005).
The model starts by calculating the emission levels for 2010 (the central year of the Kyoto period). All Annex I European countries implement their Kyoto targets by 2010, including those Annex I countries with baseline emissions in 2010 that are much less than their Kyoto targets, i.e. countries with excess emission allowances (‘hot air’).15 The non-Annex I
countries Cyprus and Malta follow the baseline scenario until 2010. After the 2010 calculations the model determines the emission allowances of the individual countries in 2020, according to the rules set under the various approaches (see chapter 3). It should be noted that it is assumed that all banked excess emission allowances during the first
commitment period (2008 – 2012) are fully used in a second commitment period (with 2015 as the central year) and therefore do not enter our 2020 calculations.
All calculations include emissions of CO2, CH4, N2O, HFCs, PFCs and SF6, excluding international aviation and marine transport. They also exclude CO2 emissions or removals from land-use change and forestry, which is a minor source for the European countries.
The model calculates the emission allowances (before and after emissions trading) and abatement costs for the 27 EU countries, using the inputs from the FAIR region model. The model also calculates the permit price on the European emissions trading market, which corresponds in our model framework with the permit price on the world international
emissions trading market (assuming there are no restrictions in emissions trading). The model also calculates the volume of traded credits both inside and outside the EU.
2.3
The MAC-EU tool
The MAC-EU tool has two functions within the FAIR EU modelling framework:
1. Calculation of the MAC curves for the EU region and its individual EUcountries:
More specifically, the tool converts the emission reduction options and costs data of the GENESIS 2.0 database (Blok et al., 2001) into the Marginal Abatement Costs (MAC) curves. This is implemented relative to the greenhouse gas emissions and activity data of the LREM baseline scenario from the PRIMES model (Mantzos et al., 2003) (Box 2). This is implemented for the EU region and individual 27 EU countries for the years 2020, for both the FAIR region and FAIR EU model, respectively. 2. Calculation of the reduction measures needed to meet reduction targets for the EU
countries. The emission reduction targets per country, after emissions trading, as
calculated using the FAIR EU model, are fed back into the MAC-EU tool to determine which measures the European countries must take to achieve those reduction targets. More specifically, the MAC-EU tool generates a list of measures required to implement reductions in a most cost-effective way, per country, per sector and per category (renewables, energy efficiency, CHP (cogeneration), et cetera).
Appendix A contains a detailed description of the MAC-EU tool, i.e. input, algorithms and output. This section briefly describes the methodology for creating the MAC curves (function 1), and briefly describes the GENESIS 2.0 database.
15 If we assumed that the 2010 emissions of these countries are based on the lower of the Kyoto targets and the baseline emissions,
these countries would have no excess emission allowances, and this would also relax the reduction targets in 2020 for the other European countries, as discussed in section 7.5.
Table 2.1: The main indicators for the year 2020 of the LREM baseline scenario from the PRIMES model (Mantzos et al., 2003)
Population GDP Emissions GDP/cap Emissions/cap Emissions/GDP (1000) (106 €) (MtCO2
-eq)
(€/cap) (tCO2-eq/
cap) (tCO2-eq/ €1000) Austria 8216 309307 87 37,647 10.6 0.281 Belgium 10572 367385 146 34,751 13.8 0.397 Denmark 5565 258802 62 46,505 11.1 0.238 Finland 5314 197769 70 37,217 13.1 0.352 France 64565 2235184 615 34,619 9.5 0.275 Germany 83056 3069240 1001 36,954 12.1 0.326 Greece 11184 249462 134 22,305 12.0 0.537 Ireland 4465 204550 74 45,812 16.5 0.360 Italy 56611 1836416 519 32,439 9.2 0.283 Luxembourg 513 41972 14 81,817 26.9 0.328 Netherlands 17404 630338 233 36,218 13.4 0.370 Portugal 10546 221773 99 21,029 9.4 0.446 Spain 40778 1084532 423 26,596 10.4 0.390 Sweden 9155 384130 85 41,958 9.3 0.221 United Kingdom 62505 2550314 676 40,802 10.8 0.265 EU-15 390449 13641174 4236 34,937 10.8 0.311 Cyprus 849 19202 11 22,617 12.6 0.556 Czech Republic 9878 115920 117 11,735 11.9 1.010 Estonia 1109 11590 16 10,451 14.8 1.412 Hungary 9069 106891 88 11,786 9.7 0.825 Latvia 2115 17761 14 8,398 6.6 0.782 Lithuania 3299 29082 29 8,815 8.9 1.010 Malta 415 8372 4 20,173 9.8 0.485 Poland 37674 429604 402 11,403 10.7 0.936 Slovakia 5370 46652 50 8,688 9.3 1.072 Slovenia 1888 35866 21 18,997 10.9 0.573 EU-10 71666 820940 752 11,455 10.5 0.917 Bulgaria 6650 30424 75 4,575 11.3 2.475 Romania 21008 104387 148 4,969 7.0 1.414 EU-2 new 27658 134811 223 4,874 8.1 1.653 EU 489773 14596925 5212 29,803 10.6 0.357
Box 2: Long-Range Energy Modelling (LREM) baseline used for the EU countries (incl. EU)
In this model, the 2000–2030 population, income and greenhouse gas emission data (see Table 2.1 for the year 2020) are based on the September 2003 EU baseline scenario of DG-TREN16, i.e. the LREM
scenario, which largely builds on the socioeconomic assumptions developed through extensive stakeholder consultation for DG TREN baseline projections ‘European Energy and Transport Trends to 2030’, which was developed for the European Commission (Mantzos et al., 2003). 17These
projections show how the future energy, transport and CO2 emissions may unfold with a continuation
of current trends and policies. The predictions are built on a modelling approach that encompasses both energy demand and supply. Some key assumptions:
− The population in Central and Eastern European countries is projected to decline slightly over the next 30 years, while the population in the Former Soviet Union and OECD Europe is projected to be stable over the projection period.
− World GDP is expected to grow by 2.9% per year on average between 2000 and 2030. In the OECD region as a whole GDP growth will be limited to 1.9% per year up to 2030. GDP grows by 2.9% per year in Central and Eastern European countries and by 2.9% in the Former Soviet Union.
− Between 2000 and 2030 the gross domestic energy consumption is expected to increase by 0.7% per year in OECD Europe, while the Central and Eastern European countries and the Former Soviet Union will increase by 1% and 1.7% respectively.
− CO2 emissions increase more rapidly than primary energy use consumption, due to changes in the
fuel mix of primary energy supply towards more carbon-intensive fuels. This increase in the carbon intensity of the global energy system is partly due to the low expansion of nuclear and renewable energy at the world level. It represents a structural change away from the historic trend towards ‘decarbonisation’.
− CO2 emissions will increase by 0.7% per year on average between 2000 and 2030 in OECD
Europe, while CO2 emissions in the Central and Eastern European countries and Former Soviet
Union will increase by 0.9% and 1.7%, respectively.
GENESIS 2.0 – GENESIS 2.0 is a database information system that is characterised by an
engineering-economic analysis of individual emission reduction measures (approximately 221 included) and cost estimates (in the year 2000 €) for 30 European countries (EU-27 countries, plus Turkey, Switzerland and Norway, which were left out of our calculations). The starting point for this GENESIS 2.0 database has been the GENESIS 1.0 database, which was developed under the framework of the Sectoral Objectives project supported by DG-ENV18 (Blok et al., 2001). For the GENESIS 2.0 database, the time frame of GENESIS 1.0
has been extended from 2010 to 2020 and 2030 and the number of countries also expanded (from EU-15 to 30 European countries).19 Other main characteristics of the database are: 221
16 In 2005 an update of the EU baseline was developed, which took into account higher oil price levels. Due to this, both energy
price scenarios and activity levels have been changed. This updated data was not available at the time of this study and has therefore not been used.
17 The LREM baseline scenario is almost identical to the scenario without climate change policies in the Clean Air for Europe
(CAFE) programme, developed by DG Environment.
18 See http://ec.europa.eu/environment/enveco/climate_change/sectoral_objectives.htm
19 Ecofys is currently working on updating the data set in the project called SERPEC-CC, which is funded by DG-Research and
reduction measures, nine sectors (i.e. households, tertiary, agriculture, waste, transport (passenger and freight), industry (iron and steel, non-ferrous metals, chemicals, building materials, food, drinks and tobacco, paper and pulp), refineries, electricity and steam
production, extraction), and four groups of greenhouse gases (i.e. CO2, N2O, CH4, F-gases).
The 221 reduction measures are described in the Sectoral Objectives reports, which can be found on the DG-ENV website:
http://ec.europa.eu/environment/enveco/climate_change/sectoral_objectives.htm.
Compared to Sectoral Objectives no additional reduction measures have been included. The reduction measures that can make a contribution to emission reductions are characterised according to the following aspects: emission reduction potential; investment costs; operation and maintenance costs; operational benefits (e.g. energy cost savings) and lifetime. The information on the individual reductions can be used to calculate total emission reduction potentials and associated mitigation costs by sector, by country and by gas.
GENESIS calculates costs as being national costs, i.e. the costs as they are experienced by society as a whole. These costs are defined as all the additional costs that need to be made by society as a whole, compared to the reference situation where no reduction policies are in place. These include the same categories of costs as for the end-user, but exclude transfers between the government and the end-user because these transfers are a ‘zero-sum-game’ for society as a whole.
National cost-effectiveness is calculated by:
1. Taking the additional investments of a reduction measure (additional compared to the reference situation) and depreciating these investments over the economic lifetime of the reduction option, using a social discount (4%).
2. (If applicable) reducing the capital costs found under point 1 with the annual cost savings on energy or (raw) materials. Cost savings on energy are calculated using European shadow prices.
3. The sum found at point 2 is divided by the net reductions due to implementation of the emission reduction measures (the reductions compared to a reference situation), i.e. costs are expressed in euro per CO2 emission reduced.
Calculating marginal abatement costs curves – the calculation includes the following steps:
1. Start with the base year (1990).
2. Determine the ‘frozen’ CO2-eq. emission in the target year (2020 or 2030) by using the growth rates in the activity levels of the LREM baseline. Under the frozen
efficiency assumption, no efficiency improvements are assumed in any of the sectors studied.
characteristics of the measures already included in the database and a link to the most recent baseline scenarios of the European Commission (http://ec.europa.eu/dgs/energy_transport/figures/trends_2030_update_2005/index_en.htm).
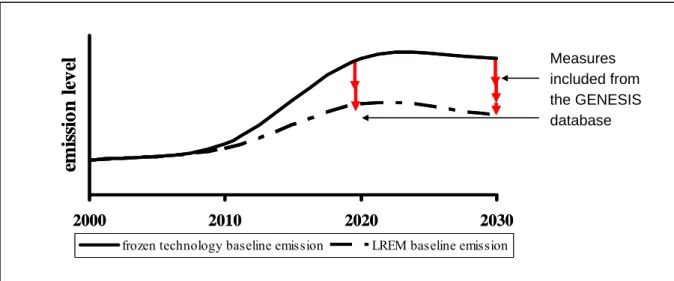
3. Take the CO2-eq. emission under the baseline according to the PRIMES model from the database and determine the implemented reduction potential under these scenarios (i.e. frozen efficiency minus baseline improvements). The LREM baseline emissions already include autonomous efficiency improvements, and are therefore lower than those of the frozen technology scenario, as illustrated in Figure 2.2. Therefore, some of the measures already included in the LREM baseline need to be excluded in further calculations. It would be ideal if the measures coloured in red could be specifically identified. However, this was not possible, as the documentation on the underlying assumptions of the PRIMES model was not specific enough for the reduction measures (such as overall efficiency improvement rates) already assumed in the baseline.
4. Identify those measures with the lowest marginal abatement costs, which cumulative total corresponds with the difference between ‘frozen’ and LREM baseline emissions (‘cut-off method’) and exclude these from further calculations.
Figure 2.2: Schematic overview of the ‘frozen’ level and the PRIMES level.
5. Assume zero marginal costs for the reduction measures in GENESIS with negative marginal costs. More specifically, in Step 4 some of the negative cost measures of the GENESIS database are removed, but some measures remain. Here, we assume that the negative costs of these options are set to zero, based on the following arguments. The GENESIS database is rather optimistic about the ‘no-regret’ measures, i.e. measures with costs equal or less than zero €/tCO2-eq. For the EU around 15% of the baseline emissions (approximately 850 MtCO2-eq.) can be reduced in 2020 through reduction measures with costs that are equal to or less than zero. These fractions differ from country to country (see Box 3). Energy system models such as TIMER (Van Vuuren et al., 2007a) and POLES (Criqui et al., 2003; Russ et al., 2005b) do not include zero or negative cost reduction measures, as these are already implemented in the baseline. Therefore, when developing the MAC curves for this study, these
Measures fr GENESI 0 2 4 6 8 10 12 14 2000 2010 2020 2030 em is si on l eve l
frozen technology baseline emission LREM baseline emission
Measures fr GENESI 0 2 4 6 8 10 12 14 2000 2010 2020 2030 em is si on l eve l
frozen technology baseline emission LREM baseline emission
Measures included from the GENESIS database
negative marginal abatement costs are not included, and zero costs are assumed. Chapter 5 explores the impact of using other marginal abatement cost curves on the outcomes.
6. The next step is to convert the remaining measures to MAC curves. Each measure is therefore linked to the corresponding LREM emission level, according to the
following six sectors included in the FAIR-EU model, i.e.: CO2, CH4 and N2O emissions from energy generation and industrial processes, CH4 and N2O emissions from agricultural processes and total F-gas emissions (HFCs, PFCs and SF6). The relative reduction of each measure is calculated and subsequently sorted into ascending order by abatement costs, and then cumulated.
7. Finally, the MAC-EU tool creates an aggregated MAC curve for the EU region of the FAIR region model, and separate MAC curves for the individual EU countries for the FAIR EU model (see Box 3).
Uncertainties – The MAC curves are surrounded by many uncertainties, as briefly described
below:
Energy prices: Energy prices constitute one of the main uncertainties. Capital-extensive
measures are particularly sensitive to changes in energy prices. This also applies to capital-intensive measures that save a relatively large amount of energy.
Technical and costs characteristics of the measures: The measures described are compared to
a reference technology. The way how we deal with the measures already included in the baseline emissions is source of uncertainty. In additional the assumptions made for the technical reduction potentials as well as the costs are uncertain.
Additional measures: The current set of measures may become outdated, since new
technologies may become available that are not yet included in the data set. For example, the current version does not include biofuel measures and only a limited number of biomass measures. It also does not include nuclear as a reduction measure. The update that is currently taking place of the GENESIS database (see footnote 19) may reveal this information, which could lead to an underestimation of the technical reduction potential.
Implementation degree of the reduction measures: To calculate the remaining reduction
potential of a certain measure, one needs to know its current level of implementation. These implementation levels also need to be updated, along with technical and costs characteristics.
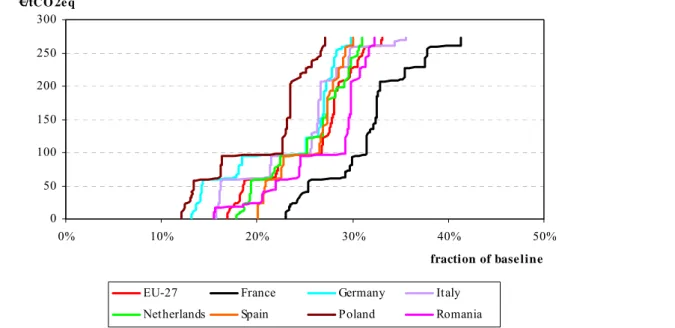
Box 3: MAC curves for the EU countries
Figure 2.3 shows the results for six European countries and Europe as a whole for the sector CO2
industry and energy. See Appendix A for a more detailed explanation. Several conclusions can be drawn from this graph:
A large number of the reductions are ‘no-regret’ measures: These are defined as measures with costs
that are equal to or less than zero €/tCO2-eq. A large potential of the measures for the EU countries
are no-regret measures: 803 MtCO2-eq. of CO2, 37 MtCO2-eq. of CH4 and 29 MtCO2-eq. of N2O can
be reduced from the baseline in 2020 with costs that are equal to zero.
The various curves are similarly shaped: The shapes of the curves of the various countries are very
similar. In theory, each country has the same set of measures (e.g. affected by geography – for example for offshore wind – and industrial structure) and each measure is similarly characterised for each Member State by the following aspects, i.e. emission reduction potential; investment costs; operation and maintenance costs; fuel costs, operational benefits (e.g. energy cost savings), lifetime and discount rates, which are assumed to be the same for each country. The impact of a measure differs slightly for each country, mainly driven by the percentage of emissions to which the measure applies.
Around €60/tCO2-eq. and €98/tCO2-eq. large reductions are defined: The measures that cause the large reductions of around €60/tCO2-eq. are ‘Advanced heating systems: condensing boilers’ and
‘Carbon Capture and Storage (CCS)’. The measure that causes large reductions of around
€98/tCO2-eq. concerns the replacement of capacity by natural gas-fired combined cycles (at PRIMES
price assumptions). However, the mitigation cost is strongly dependent on the relative price differences between coal and natural gas that are assumed in the scenarios.
0 50 100 150 200 250 300 0% 10% 20% 30% 40% 50%
fraction of base line €/tC O 2e q
EU-27 France Germany Italy
Netherlands Spain Poland Romania
Figure 2.3: Marginal Abatement Costs (MAC) curves for six European countries for the industry energy-related CO2 emissions in 2020.
Poland has high marginal abatement costs: As measures are characterised similarly for each Member
State, the specific mitigation costs are similar. The mitigation potential of a measure differs for each Member State as this is driven by the potential application of each measure, and hence economic structure and emission profile of a country. For example, the measure ‘Miscellaneous options (moderate costs tranche)’ counts for 1.5% reduction in Germany, but in Poland for ‘only’ 0.5%. In Poland, the no-regret options cover a relatively small part of the reduction potential, which
automatically makes the abatement costs of this country higher. This is also partially due to the structure of the database, as measures that are solely applicable to Poland are not included, because these were not included in the original database developed for EU-15.