RIVM Letter report 2017-0187 P.E. Boon et al.
Colophon
© RIVM 2018
Parts of this publication may be reproduced, provided acknowledgement is given to: National Institute for Public Health and the Environment, along with the title and year of publication.
DOI 10.21945/RIVM-2017-0187
P.E. Boon (author), RIVM
J.D. te Biesebeek (author), RIVM H. Brants (author), RIVM
M.C. Bouwmeester (author), RIVM E.V.S. Hessel (author), RIVM Contact:
Ellen Hessel
Centre for Health Protection (GZB) ellen.hessel@rivm.nl
This study was commissioned by the Ministry of Health, Welfare and Sport, as part of project V/050112/17 ‘Endocrine disrupters’
This is a publication of:
National Institute for Public Health and the Environment
P.O. Box 1 | 3720 BA Bilthoven The Netherlands
Synopsis
Dietary sources of exposure to Bisphenol A in the Netherlands
Bisphenol A (BPA) is a chemical substance used to produce a transparent plastic (polycarbonate) that is used in food packaging materials. BPA is also used in coatings to protect the quality of canned food and drink (the white layer on the inside of the can). BPA can get into food via migration from this type of packaging. Products such as sales receipts, building materials (paint and coatings), and medical devices can also contain BPA.
Calculations carried out by RIVM indicate that the total intake of BPA via food in the Netherlands is very limited. Even under the most
unfavourable circumstances, the exposure would still be a factor of 30 times less than the tolerable daily intake (TDI). The study also clearly indicates that no single food source contributes largely to the exposure, but that all food sources each make their own ‘small’ contribution. The RIVM study was focused on food sources, because food is the main source of exposure to BPA for the average consumer.
This study is a follow-up of a previous study by RIVM (2016) which drew attention to new information about the TDI of BPA. The European Food Safety Authority (EFSA) is currently re-evaluating this health limit. Pending this study, the Ministry of Health, Welfare and Sport (VWS) asked RIVM to investigate which food sources contributed most to the exposure of BPA in the Netherlands, as well as the quantities involved. Keywords: BPA, Bisphenol A, young children, children, adults,
Publiekssamenvatting
Bronnen van blootstelling aan bisfenol A via voedsel in Nederland
Bisfenol A (BPA) is een chemische stof die wordt gebruikt om een transparant plastic te maken (polycarbonaat), dat onder andere wordt gebruikt in voedselverpakkingsmaterialen. Verder wordt BPA gebruikt in coatings om de kwaliteit van ingeblikt voedsel en dranken te
beschermen (de witte laag aan de binnenkant van het blik). Onder andere via deze verpakkingen kan BPA in voedsel terechtkomen. Producten als kassabonnen, bouwmaterialen (verf en coatings) en medische hulpmiddelen kunnen ook BPA bevatten.
Uit berekeningen van het RIVM blijkt dat de totale hoeveelheid BPA die mensen in Nederland via het voedsel binnenkrijgen zeer beperkt is. Zelfs onder de meest ongunstige omstandigheden ligt de blootstelling nog 30 keer onder de huidige tolereerbare dagelijkse inname (TDI). Het
onderzoek maakt ook duidelijk dat niet één voedselbron een grote bijdrage levert, maar alle voedselbronnen afzonderlijk hun eigen
individuele ‘kleine’ bijdragen hebben. De focus in het RIVM-onderzoek is op voedselbronnen gelegd, omdat voedsel voor de gemiddelde
consument de belangrijkste bron is van blootstelling aan BPA.
Dit onderzoek volgt op eerder onderzoek van het RIVM (2016) waarin aandacht gevraagd werd voor nieuwe informatie over de TDI. De European Food Safety Authority (Europese voedselveiligheidsautoriteit, EFSA) is momenteel bezig met een nieuwe beoordeling van deze
gezondheidsnorm. In afwachting van dit onderzoek vroeg het ministerie van Volksgezondheid, Welzijn en Sport (VWS) het RIVM om te
onderzoeken via welke bronnen mensen in Nederland het meest worden blootgesteld aan BPA en om welke hoeveelheden het daarbij gaat. Kernwoorden: BPA, bisphenol A, jonge kinderen, kinderen, volwassenen, concentratiedata, langetermijninname, statistisch modelleren
Contents
1 Introduction — 9
2 Exposure calculations — 11
2.1 Food consumption data — 11 2.2 Concentration data — 11
2.2.1 BPA concentrations from 2015 BPA opinion of EFSA CEF Panel — 12 2.2.2 BPA concentrations in non-canned foods of animal origin — 12 2.2.3 BPA concentrations in canned tuna in Italy — 13
2.3 Food mapping — 13
2.4 Long-term dietary exposure assessment — 14 2.5 Intake versus health-based guidance value — 15
3 Results — 17
3.1 Exposure to BPA via food — 17
3.2 Exposure versus health-based guidance value — 17
4 Discussion — 21
4.1 Comparison with BPA intake reported by EFSA and ANSES — 21 4.2 Dietary sources of exposure — 22
4.3 Uncertainties in the exposure assessment — 24 4.3.1 Food consumption data — 24
4.3.2 Concentration data — 24 4.3.3 Food mapping — 25
4.3.4 Modelling of exposure — 26 4.3.5 Summary — 27
4.4 Dietary sources of exposure to BPA in very young children — 27 4.5 Other sources of BPA exposure — 27
4.6 Risk analysis — 29 4.7 Conclusion — 30
Acknowledgements — 31 References — 33
Appendix A Description of consumption data used in the exposure assessment to BPA — 37
Appendix B Literature search conducted in MEDLINE database to retrieve recent literature on BPA concentrations in food
sources — 39
Appendix C Overview of the applied in- and exclusion criteria — 40
Appendix D BPA concentrations in food categories (FoodEx1 level 1) obtained from the EFSA CEF Panel (2015) — 41 Appendix E BPA concentrations in non-canned meat and fish products obtained from ANSES (2017) — 42
Appendix F BPA concentrations in canned tuna obtained from Fattore et al. (2015) — 43
Appendix G Description of the bootstrap — 44
Appendix H Contribution of canned foods to the exposure to BPA per food category in scenario I and II — 45
1
Introduction
Bisphenol A (BPA) is an industrial chemical that is widely used to manufacture polycarbonate, a rigid, transparent plastic, which is for example used in food and liquid containers. BPA is also found in epoxy resins, which act as protective linings for canned foods and beverages, and as a surface-coating on drinking water storage tanks. In addition, BPA is also used in non-food-related applications, such as toys,
cosmetics, thermal paper (e.g. for cash receipts) or medical devices (Bakker et al., 2016; EFSA, 2015a; Hormann et al., 2014; SCENIHR, 2015). Due to this broad application of BPA, exposure to this compound can occur continuously via a range of products (Bakker et al., 2016; EFSA, 2015a; Hormann et al., 2014).
BPA is considered to be a liver and kidney toxicant (after prolonged exposure) and is classified in the European Union (EU) as a reproduction toxicant and endocrine disruptor. As an endocrine disruptor, BPA may interfere with the endocrine system and disturb the hormonal balance (Bakker et al., 2016). In 2015, based on data from multi-generation reproductive toxicity studies in mice, a temporary tolerable daily intake (t-TDI) of 4 μg/kg body weight (bw) per day was established by the European Food Safety Authority (EFSA, 2015b). This t-TDI was based on kidney toxicity at a BMDL10 of 8,960 μg/kg bw per day in mice translated to an oral Human Equivalent Dose (HED) of 609 μg/kg bw per day. The t-TDI was derived by the EFSA Panel on Food Contact Materials, Enzymes Flavourings and Processing Aids (CEF). This Panel also assessed the exposure to BPA via different possible sources, including food, dust, cosmetics and thermal paper (EFSA, 2015a). This
assessment showed that food contributed most to the exposure at the mean exposure level in all examined age groups (60-100%). At a high level of exposure (95th percentile), the exposure via thermal paper was
estimated to be higher than via food in persons aged 10 and higher. It should be noted that these high exposures via thermal paper were based on highly conservative assumptions for the frequency and number of fingers handling such paper. The EFSA CEF Panel judged therefore the uncertainty around these exposure estimates to be relatively high
compared to the uncertainty around the estimates of BPA exposure via food. The Panel concluded that there was no health concern regarding the BPA exposure via the different sources, because the overall
exposure levels in Europe were below the t-TDI.
Since the EFSA CEF Panel identified that food contributed between 60-100% to the total BPA exposure at the mean exposure level, the overall aim of this study was to determine the most important dietary sources contributing to BPA exposure in the Netherlands. Additionally, the exposure to BPA via the other sources, including thermal paper, is expected to decrease due to changes in legislation. To identify the relevant dietary sources of BPA exposure in the Netherlands, the exposure to BPA via food was calculated using Dutch food consumption data collected in 2005-2006 (children aged 2 to 6) and 2007-2010 (persons aged 7 to 69), and the most up-to-date BPA concentration data
available from other European countries, in the absence of relevant Dutch data. The exposure was estimated in these two age groups as well as in women of child-bearing age (women aged 18-45) as a proxy for pregnant women. Exposure estimates for pregnant women were calculated separately, since fetuses are considered as a relatively sensitive group regarding BPA effects (Bakker et al., 2016; EFSA, 2015b; Hessel et al., 2016). This also applies to newborn children (0 to one year). However, no exposure to BPA could be calculated for this age group, due to the absence of specific food consumption data for this age group in the Netherlands. BPA exposure for this sensitive group will be addressed in the discussion (section 4.4).
In this report, the terms exposure and intake are used interchangeably, both referring to the ingestion of BPA via food. Furthermore, when referring to the exposure via food, the exposure via the consumption of beverages, as well as drinking water, is included.
2
Exposure calculations
2.1 Food consumption data
Exposure to BPA via food was calculated with food consumption data of the two most recently performed food consumption surveys in the Netherlands covering the general population from age 2 up to 69. These surveys include the Dutch National Food Consumption Survey (DNFCS)-Young Children. This survey covers the dietary habits of young children aged 2 to 6 and was conducted in 2005-2006 (Ocké et al., 2008). The other food consumption survey was the one performed among persons aged 7 to 69; the DNFCS 2007-2010 (van Rossum et al., 2011). For a more detailed description of both surveys, see Appendix A.
2.2 Concentration data
The most important source for concentration data of BPA in food were the data published by the EFSA CEF Panel (EFSA, 2015a). These data include concentrations published in the literature over the period 2006 – 2012 relating to the presence of BPA in a wide range of foods divided in canned and non-canned foods. Canned foods are expected to contain higher BPA levels due to its presence in epoxy resins, which act as protective linings for metal cans. To update these data, a literature search was conducted to retrieve BPA concentration data in food published in studies from 2013 onwards.
This search was performed in April 2017 using the MEDLINE database and focussed on bisphenols in combination with exposure and sources. This resulted in a total of 263 articles (Appendix B). After applying in- and exclusion criteria (Appendix C) to the titles and abstracts, 50 studies focussing on BPA occurrence in food and non-food sources remained. The articles about non-food sources were stored in a separate database and used in the discussion of this report, if relevant
(section 4.5). The main inclusion criterion was that the foods analysed for BPA had been purchased in the European region, as being most relevant for the Dutch situation. The EFSA CEF Panel applied the same criterion (EFSA, 2015a). A study reporting on BPA concentrations in composite food samples was not considered (Bemrah et al., 2014). These concentrations related to mixtures of foods combining among others canned and non-canned foods. These concentrations could therefore not be separated in concentrations of canned and non-canned foods in line with the concentrations of the EFSA CEF Panel. As a result, two studies remained, including 1) an Italian monitoring study of
concentrations of bisphenols, including BPA, in canned tuna (Fattore et al., 2015), and 2) a study of BPA concentrations in Norwegian foods (Sakhi et al., 2014). As BPA concentrations in foods measured in the Norwegian study were based on very few samples, preference was given to the concentration data of the EFSA CEF Panel. These Norwegian BPA concentrations were therefore also not included in the intake
calculations.
In addition, the French Agency for Food, Environmental and
non-canned foodstuffs of animal origin (ANSES, 2017). This study provided more detailed BPA concentrations in non-canned meat and fish products than reported by the EFSA CEF Panel, enabling the
differentiation between different meat and fish products in the intake assessment.
The three sources of concentration data used in the exposure assessment are described in more detail below.
2.2.1 BPA concentrations from 2015 BPA opinion of EFSA CEF Panel
The data used by the EFSA CEF Panel in 2015 to estimate the exposure to BPA via food were retrieved from scientific papers as well as via a call for data (EFSA, 2015a). Data retrieved from scientific papers were only considered if they related to foods purchased in the European region (EU and non-EU).
After data cleaning, the EFSA CEF Panel considered 2,516 concentration data on BPA in food sufficiently robust for use in its exposure
assessment. The majority of these data (77%) were obtained via the call for data and were related to non-canned foods provided by France. The data covered the period of 2004 to 2012, with only 11 data points in 2004 and 2005.
To use the concentrations data in its exposure assessment, the EFSA CEF Panel categorised the concentration data according to the FoodEx1 food classification system (EFSA, 2011). FoodEx1 is a hierarchical system based on 20 main food categories that are further divided into subgroups up to a maximum of four levels. Level 4 is the most refined (e.g. bread) and level 1 is the least refined (e.g. grains and grain-based products). The BPA concentrations were categorised at level 1 of the FoodEx1 food categorisation system. Per FoodEx1 level 1 food category, a canned and non-canned concentration was reported. For more details about the data used by the EFSA CEF Panel, see EFSA, 2015a.
In the current exposure assessment of BPA, the mean medium-bound concentrations, as calculated by the EFSA CEF Panel, were used per canned and non-canned FoodEx1 level 1 food category. These medium bound concentrations were calculated by the Panel assuming that samples with a reported BPA concentration below the limit of detection (LOD) or quantification (LOQ) contain BPA at a concentration equal to half the relevant limit value. Appendix D contains an overview of the canned and non-canned medium-bound concentrations per FoodEx1 Level 1 food category.
2.2.2 BPA concentrations in non-canned foods of animal origin
In 2017, ANSES published concentrations of BPA in non-canned foods of animal origin (ANSES, 2017). In this study, 322 samples of such foods were analysed for BPA belonging to the food groups meat, poultry & game, offal, delicatessen meats, fish and crustaceans & molluscs as classified by ANSES. Appendix E lists the BPA concentrations in non-canned foods of animal origin as reported by ANSES. These
2.2.3 BPA concentrations in canned tuna in Italy
In an Italian monitoring study of bisphenols in canned tuna, different brands of tuna fish samples, canned in either oil (n=24) or aqueous medium (n=9), were purchased on the Italian market and analysed for bisphenols, including BPA (Fattore et al., 2015). Per brand, two products were purchased and mixed before analysis. The mean analysed
concentrations of BPA in these samples ranged from below LOD of 1.3 µg/kg (n=8) to 187.0 µg/kg. Appendix F lists the mean
concentrations per samples as reported by Fattore et al. (2015).
2.3 Food mapping
Mapping is the process of matching analysed foods (foods for which concentration data are available) to the ones recorded in the food consumption databases. The majority of the concentrations of BPA available for this study were those reported by the EFSA CEF Panel (section 2.2.2). To map these concentrations, the foods recorded in the food consumption databases (n=2013) were assigned to the most representative FoodEx1 level 1 food category, selecting either the canned or non-canned variant.
For the majority of the foods recorded in the two food consumption databases (n=1884), sufficient information was available to classify them as either consumed as canned or non-canned at the individual level. For 129 foods, the information in the food consumption databases was however not specific enough to determine if the food was consumed as canned or non-canned. These 129 foods related mainly to the
FoodEx1 level 1 food categories non-alcoholic beverages (n=63), fruit and fruit products (n=20), and vegetables and vegetable products (n=15), including foods such as fruit and vegetable products coded consumed as glass/canned, and various syrups and soft drinks. These foods were mapped according to two scenarios. In scenario I, it was assumed that these foods were all consumed as non-canned, whereas in scenario II it was assumed that they were consumed as canned and canned with an even probability (50% canned and 50% non-canned). For this, the corresponding BPA concentrations of canned and non-canned foods were averaged and mapped to the relevant food. Scenario II was assumed to result in an overestimation of the exposure to BPA, because it was estimated that at population level less than 50% of these foods will be consumed as canned.
Non-canned foods (n=214) classified in the FoodEx1 food categories ‘meat and meat products’ and ‘fish and fish products’ were mapped to the non-canned concentration obtained from ANSES (2017). For this, these non-canned foods were mapped at the most detailed level
possible. For example, food ‘mutton <10 g fat average raw’ was mapped to the concentration analysed in mutton. For consumed meat and fish products that could not be mapped directly to an analysed product in the ANSES concentration database, a weighted mean BPA concentration was calculated combining relevant products. For example, the consumed food ‘bacon’ was mapped to the weighted mean concentration of chop and roast pork, and that of the food ‘ham’ to a weighted mean
concentration of raw and cooked ham. For the food ‘horsemeat raw’, no specific BPA concentration was reported by ANSES (2017). In that case,
a weighted mean concentration in meat was calculated based on the concentrations analysed in the ANSES food groups meat, poultry & game, offal and delicatessen meats.
Consumed canned salmon and canned tuna, coded as three foods in the food consumption databases1, were mapped to an overall mean
concentration of BPA in canned tuna based on the concentrations of Fattori et al. (2015) (Appendix F). The calculated mean concentration was 55.4 µg/kg, assuming that the samples with a BPA concentration below LOD contained BPA at half of this limit value. No distinction was made between consumed tuna in oil or water, given the similarity in BPA concentrations.
2.4 Long-term dietary exposure assessment
The long-term dietary exposure to BPA was assessed, because for consumers repeated exposure to this compound is most relevant (EFSA, 2015b). For this, the Monte Carlo Risk Assessment (MCRA) computation tool, release 8.2 was used (de Boer et al., 2016). This tool contains the observed individual means (OIM) model, which was used to calculate the long-term exposure.
In this model, daily food consumption patterns of individuals were multiplied with the mean BPA concentration per consumed food, and summed over foods per day per individual. All daily estimated exposures to BPA were adjusted for individual body weight. Subsequently, the daily individual exposures were averaged over the two consumption days per individual (Appendix A), resulting in a distribution of two-day-average exposure levels per individual.
Calculated exposures to BPA using this model were expressed in µg/kg bw per day, and weighted for small deviances in socio-demographic factors and season. The exposure distribution of persons aged 7 to 69 was also corrected for day of the week. Weights were those used by Ocké et al. (2008) and van Rossum et al. (2011). No weights for day of the week were available within the DNFCS-Young Children database. The exposure was calculated for three age groups: children aged 2 to 6, persons aged 7 to 69 and women of childbearing age aged 18 to 45. The food consumption data of this last population group were used as a proxy for pregnant women, because no food consumption data were available for pregnant women. The age limits of this population group were those used by the EFSA CEF Panel (EFSA, 2015a). The reported percentiles of the long-term exposure distribution were the 50th
(median, P50) and 95th (P95).
The uncertainty around the exposure percentiles due to the sample size of the food consumption database was quantified using the bootstrap approach (Efron, 1979; Efron & Tibshirani, 1993). As the calculation was performed with one mean concentration value per food, the uncertainty due to the sample size of the concentration database could not be quantified in this way. A description of the bootstrap is given in Appendix G.
2.5 Intake versus health-based guidance value
In 2015, the EFSA CEF Panel derived a temporary tolerable daily intake (t-TDI) of 4 µg/kg bw per day (EFSA, 2015b). To assess if there is a possible health risk related to the calculated exposure to BPA in the Netherlands, the P95 of long-term exposure was compared with this health-based guidance value (HBGV), the same percentile as used for the risk characterisation of the exposure to BPA via food by the EFSA CEF Panel (2015b).
3
Results
3.1 Exposure to BPA via food
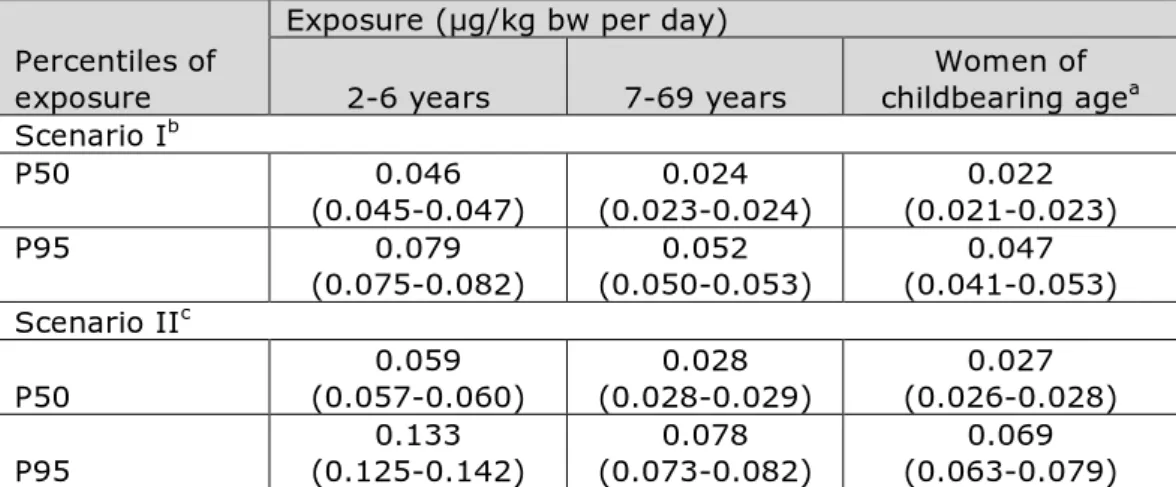
Table 1 lists the calculated median (P50) and high (P95) level of long-term exposure to BPA via food in children aged 2 to 6, in persons aged 7 to 69 and women of childbearing age (18-45 years) in the Netherlands. Scenario I
In to 6-year olds, the median (P50) dietary exposure was around 2-fold higher than in the age group 7-69 and women of childbearing age (Table 1). At the P95 of exposure, the difference was around 1.6-fold. Considering the uncertainty around the exposure estimates due to the sample size of the food consumption database (section 2.4), the high (P95) level of exposure to BPA could be as high as 0.082 µg/kg bw per day in 2- to 6-year olds.
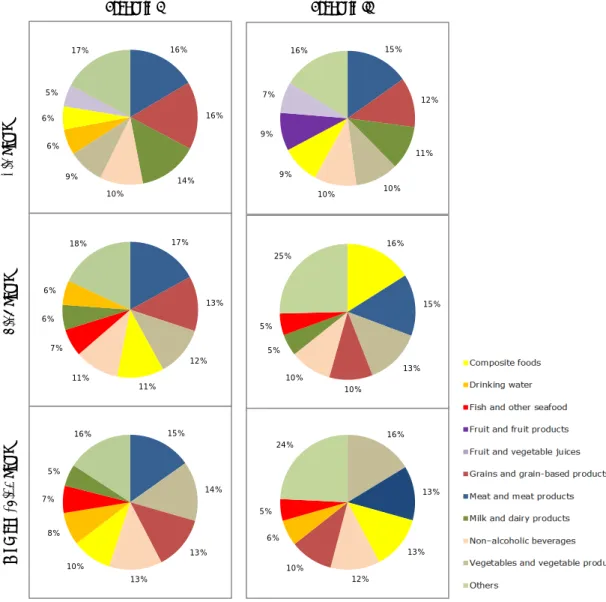
In scenario I, food sources that contributed at least 10% to the total exposure distribution of BPA in all population groups were the food categories ‘meat and meat products’, ‘grains and grain based products’, and ‘non-alcoholic beverages’ (Figure 1). In children aged 2 to 6, this was also true for the food category ‘milk and dairy products’, whereas in the two other populations, also the food categories ‘vegetables and vegetable products’ and ‘composite foods’ contributed at least 10% to the exposure to BPA.
Scenario II
Also in scenario II, exposure to BPA was highest in 2- to 6-year olds: 0.059 and 0.133 µg/kg bw per day for the median and P95 level of exposure, respectively (Table 1). Compared to scenario I, the median and P95 exposure estimates were on average a factor 1.2 and 1.6 higher, respectively. Considering the uncertainty around the exposure estimates due to the sample size of the consumption database
(section 2.4), the high (P95) level of BPA exposure could be as high as 0.142 µg/kg bw per day in 2- to 6-year olds.
In scenario II, food sources that contributed at least 10% to the
exposure to BPA in all population groups were the food categories ‘meat and meat products’, ‘grains and grain-based products’, ‘vegetables and vegetable products’ and ‘non-alcoholic beverages’ (Figure 1). In children aged 2 to 6, this was again also true for the food category ‘milk and dairy products’, whereas in the two other populations also the food category ‘composite foods’ contributed at least 10% to the exposure to BPA.
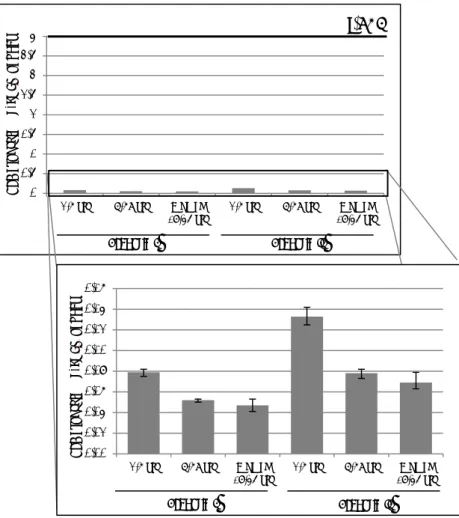
3.2 Exposure versus health-based guidance value
The P95 of exposures to BPA were compared to the t-TDI of 4 µg/kg bw per day to assess if there is a possible health risk related to the
calculated long-term exposure to BPA via food. The P95s were below the t-TDI for all population groups (Table 1; Figure 2). Given the uncertainty due to the sample size of the food consumption database (section 2.4),
Table 1. Long-term dietary exposure to BPA of children aged 2 to 6, persons aged 7 to 69 and women of childbearing age
Percentiles of exposure
Exposure (µg/kg bw per day)
2-6 years 7-69 years childbearing ageWomen of a
Scenario Ib P50 0.046 (0.045-0.047) (0.023-0.024) 0.024 (0.021-0.023) 0.022 P95 0.079 (0.075-0.082) (0.050-0.053) 0.052 (0.041-0.053) 0.047 Scenario IIc P50 (0.057-0.060) 0.059 (0.028-0.029) 0.028 (0.026-0.028) 0.027 P95 (0.125-0.142) 0.133 (0.073-0.082) 0.078 (0.063-0.079) 0.069 Note: 2.5% lower – 97.5% upper confidence limits of the percentiles of exposure are reported considering the uncertainty due to the sample size of the food consumption database.
a Women of childbearing age covered food consumption data of women aged 18 to 45. b In scenario I, 129 foods for which it was not clear if they were consumed as canned or
non-canned were assumed to have been consumed as non-canned.
c In scenario II, 129 foods for which it was not clear if they were consumed as canned or
non-canned were assumed to have been consumed as non-canned or canned with equal probability.
the intake was at least 30-fold lower than the t-TDI in children aged 2 to 6 at the P95 in scenario II.
Figure 1. Contribution (%) of food categories to the total exposure distribution of BPA via food of children aged 2 to 6, persons aged 7 to 69 and women of childbearing age (18-45 years). Food categories with a contribution of at least 5% are shown. For an explanation of the two scenarios, see section 2.3.
16% 16% 14% 10% 9% 6% 6% 5% 17% 17% 13% 12% 11% 11% 7% 6% 6% 18% 15% 14% 13% 13% 10% 8% 7% 5% 16% 16% 13% 13% 12% 10% 6% 5% 24% Scenario I Scenario II 2-6 y ea rs 7-69 y ea rs W ome n ( 18 -45 y ea rs ) 15% 12% 11% 10% 10% 9% 9% 7% 16% 16% 15% 13% 10% 10% 5% 5% 25%
Figure 2. The high (P95) dietary exposure to BPA of children aged 2 to 6, persons aged 7 to 69 and women of childbearing age (18-45 years) for scenarios I and II compared to the t-TDI. Whiskers represent the 2.5% lower and 97.5% upper confidence limits. For an explanation of the two scenarios, see section 2.3. t-TDI: temporary tolerable daily intake; yrs: years.
0 0,5 1 1,5 2 2,5 3 3,5 4
2-6 yrs 7-69 yrs Women
(18-45 yrs) 2-6 yrs 7-69 yrs (18-45 yrs)Women
BP A e xp os ur e (µ g/ kg bw p er d ay)
t-TDI
Scenario I Scenario II 0,00 0,02 0,04 0,06 0,08 0,10 0,12 0,14 0,162-6 yrs 7-69 yrs Women
(18-45 yrs) 2-6 yrs 7-69 yrs (18-45 yrs)Women
BP A e xp os ur e (µ g/ kg bw p er d ay) Scenario I Scenario II
4
Discussion
4.1 Comparison with BPA intake reported by EFSA and ANSES
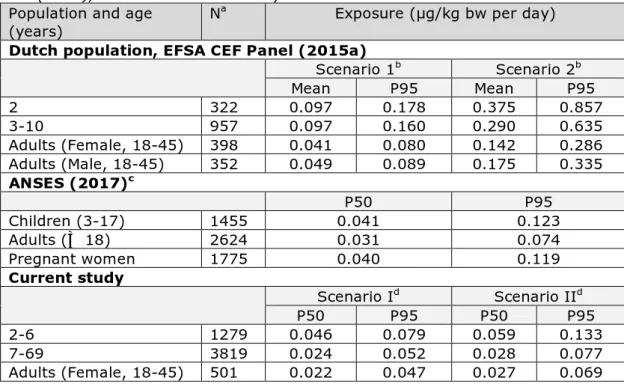
In 2015, the EFSA CEF Panel reported on the exposure to BPA via food in several European countries, including the Netherlands (EFSA, 2015a). Exposure estimates for the Netherlands were based on food
consumption data from the DNFCS 2003 (Ocké et al., 2005) and the DNFCS-Young Children of 2005-2006 (Ocké et al., 2008). The BPA concentrations used were those described in section 2.2.1. The exposure results of the Netherlands as calculated by the Panel are listed in
Table 2, including the estimates of the current study for reasons of comparison.
ANSES (2017) calculated the exposure to BPA based on the BPA concentrations in non-canned meat and fish products as described in section 2.2.2 (ANSES, 2017). For the other potential food sources of exposure, the contamination data of the second Total Diet Study (TDS2) were used. In this TDS, BPA was analysed in food samples collected between June 2007 and January 2009. BPA concentrations in water and different bottled waters (still, sparkling, spring and natural mineral water) were derived from a study carried out by ANSES's Nancy
Hydrology Laboratory. The resulting exposure estimates are also listed in Table 2.
In general, the exposure estimates of the current study were in the same order of magnitude as those reported by ANSES (Table 2). The exposure estimates reported by the EFSA CEF Panel for scenario 12 were however about a factor two higher than those for the comparable
scenario I of our study (EFSA, 2015a). The reasons for these lower exposure estimates were a more precise mapping of foods consumed to those analysed and the lower BPA concentrations in non-canned meat used in our study: 2.8 vs. 9.4 µg/kg. Furthermore, to assess the exposure to BPA in Dutch adults, the EFSA CEF Panel used data from a survey among only adults aged 18 to 30 (DNFCS 2003) (Ocké et al., 2005). The BPA exposure results of the EFSA CEF Panel for the age groups 2 and 3-10 years were based on the same food consumption as used in the present study to assess the exposure in 2- to 6-year olds. Given the above observations, we estimate that the exposure calculated in the present study will be closer to the true intake of BPA in the
Netherlands than those reported by the EFSA CEF Panel. Comparing the exposure estimates of the EFSA CEF Panel’s scenario 2 with those of scenario II showed that the Panel’s exposure was even a factor 2-4 higher. This was due to the more conservative assumptions of this scenario compared to our scenario II.
The exposure estimates were roughly 2-fold higher in young children compared to the older population groups in all studies (Table 2). This difference can be (totally) explained by the fact that children consume more food per kg bodyweight, and not because they consume specific 2 For an explanation of the exposure scenarios 1 and 2 used by the EFSA CEF Panel, see footnote a of Table 2.
Table 2. Mean, median (P50) and high (P95) exposure to BPA via food in children and adults as estimated by EFSA CEF Panel (2015a) and ANSES (2017), and in the current study
Population and age
(years) N
a Exposure (µg/kg bw per day)
Dutch population, EFSA CEF Panel (2015a)
Scenario 1b Scenario 2b Mean P95 Mean P95 2 322 0.097 0.178 0.375 0.857 3-10 957 0.097 0.160 0.290 0.635 Adults (Female, 18-45) 398 0.041 0.080 0.142 0.286 Adults (Male, 18-45) 352 0.049 0.089 0.175 0.335 ANSES (2017)c P50 P95 Children (3-17) 1455 0.041 0.123 Adults (≥ 18) 2624 0.031 0.074 Pregnant women 1775 0.040 0.119 Current study Scenario Id Scenario IId P50 P95 P50 P95 2-6 1279 0.046 0.079 0.059 0.133 7-69 3819 0.024 0.052 0.028 0.077 Adults (Female, 18-45) 501 0.022 0.047 0.027 0.069 a N = number of individuals
b Scenario 1: Only foods specifically coded as canned in the dietary survey were assigned
the corresponding occurrence level for BPA; Scenario 2: Any food which has been coded as canned in at least one survey was always considered to be consumed as canned in all surveys present in the EFSA Comprehensive database.
c Equal to scenario 1 of EFSA and scenario I of the current study (see footnote b and d) d Scenario I: 129 foods for which it was not clear if they were consumed as canned or
non-canned were assumed to have been consumed as non-non-canned, rest of the foods equal to scenario 1 of the EFSA CEF Panel (see footnote b); Scenario II: 129 foods for which it was not clear if they were consumed as canned or non-canned were assumed to be consumed as canned in 50% of cases, rest of the foods equal to scenario 1 of the EFSA CEF Panel (see footnote b).
foods that contain higher levels of BPA.
4.2 Dietary sources of exposure
Important sources of exposure in the current assessment in scenario I were the food categories ‘meat and meat products’ and ‘grains and grain-based products’ in all populations (Figure 1). The contribution of grains and grain-based products was fully due to the presence of BPA in non-canned foods. The contribution of this food category to the BPA exposure was therefore due to high consumption levels, and not
because of high BPA levels (1 µg/kg). This was also largely true for the food category ‘meat and meat products’. In scenario I, more than 95% of the contribution of this food category to the overall exposure
distribution was due to the consumption of non-canned meat products. In children aged 2 to 6, also the food category ‘milk and dairy products’ contributed significantly to the exposure in scenario I: 14% (Figure 1). Also here, the exposure was completely due to the consumption of non-canned milk and dairy products (BPA concentration of 0.3 µg/kg).
In scenario I, the food categories ‘vegetables and vegetable products’ and ‘composite foods’ were additional important contributors to the exposure to BPA in persons aged 7 to 69 and women of child-bearing age (Figure 1). In both these food categories, the contribution of canned foods was higher ranging from 26% for composite foods to 47% for vegetable and vegetable products, both in women of child-bearing age. For the food category ‘vegetables and vegetable products’, this was due to the consumption of canned tomato products and canned corn. For the food category ‘composite foods’, the contribution to the exposure was due to the consumption of canned soup.
For 129 foods, it was not clear if they were either consumed as canned or non-canned. These 129 foods belonged to different food categories, but mainly to non-alcoholic beverages such as syrups and soft drinks and foods coded as glass/canned. This uncertainty was addressed assuming that these foods were either consumed non-canned (scenario I) or as canned or non-canned with an equal probability (scenario II). Examining the contribution of the food categories to the total BPA exposure distribution showed that the contribution of the food category ‘composite foods’ was influenced by this uncertainty (Figure 1). In persons aged 7 to 69, this food category contributed most to the exposure in scenario II. The reason for this was the large difference in BPA concentrations used in the two scenarios for the six foods belonging to this food category that could either be consumed non-canned or canned: 2.4 µg/kg in scenario I and 20 µg/kg in scenario II. Although, the food category ‘non-alcoholic beverages’ contained the highest number of foods for which it was unclear if they were consumed either as canned or non-canned, their contribution to the exposure did not increase significantly in scenario II. This was due to the small difference in BPA concentrations used in scenarios I and II (Appendix D). For a complete overview of the contribution of canned foods to the total BPA exposure distribution for both scenarios and three population groups, see Appendix H.
The majority of the exposure to BPA was due to the consumption of non-canned foods, which typically contain lower levels of BPA than canned foods (Appendix D). Presence of BPA in non-canned foods might be due to the presence of BPA in other food contact materials than epoxy resins, possibly polycarbonate plastics. These materials are used in the manufacture of jars/containers and plastics. Also contamination during the production of the food is a possible source of contamination. The presence of BPA in non-canned meat was suggested by ANSES (2017) to have occurred post-mortem from the surrounding
environment and/or food processing. Due to the lack of precise data (cutting location, materials used for cutting, type of packaging used, etc.), ANSES (2017) was not able to identify the sources of
contamination.
Similar food categories contributing largely to the exposure to BPA via food were identified by the EFSA CEF Panel (EFSA, 2015a) and ANSES (2017). The EFSA CEF Panel reported that non-canned ‘meat and meat products’ contributed most to the mean exposure to BPA, and that ‘vegetables and vegetable products’ was the only canned food category that contributed up to 25-50% in some population groups. ANSES
(2017) reported the highest contribution from vegetables (about 40%), followed by mixed dishes (about 15%) and meat and meat products (about 10%) in adults. No distinction was made in this report between contribution of canned and non-canned foods.
4.3 Uncertainties in the exposure assessment
The exposure estimates of BPA presented in this report are influenced by different sources of uncertainty. The most important sources are discussed in detail below.
4.3.1 Food consumption data
The food consumption data used in the exposure assessment to BPA were the most recent data available for the Netherlands (Appendix A). However, especially the food consumption data of children aged 2 to 6 were collected more than 10 years ago. Presently, a new DNFCS is being conducted among persons aged 1 to 79. Preliminary results of this survey collected in the period of 2012-2014 show that consumption patterns are changing3. However, how these changes will affect the current exposure estimates cannot be ascertained. For that, more detailed information is needed. However, we expect that the use of up-to-date food consumption data will have a negligible effect on the contribution of the dietary sources to the exposure to BPA and will not result in a significant increase in the exposure estimates themselves.
4.3.2 Concentration data
The main limitation of the present study was the absence of
concentration data of BPA in foods present on the Dutch market. For this reason, the concentration data of the EFSA CEF Panel were used (EFSA, 2015a), assuming that due to open trading of foods between EU
Member States, canned and non-canned products available on the Dutch market will very likely have comparable BPA concentrations. Despite this, the use of these data instead of national data may have introduced uncertainty in the reported exposure estimates. Another uncertainty regarding these data was their categorisation in 20 broad food
categories (section 2.3). Due to this, the mapping of the analysed foods to those consumed was very imprecise, especially for heterogeneous food categories (Boon et al., 2014). For example, the mean BPA concentration level for the non-canned variant of the food category ‘animal and vegetable fats and oils’ was mapped to 39 different foods, and the non-canned BPA level of the food category ‘grains and grain-based products’ to about 400 very diverse foods. Due to lack of more precise information on BPA concentrations in food, it is not possible to estimate how this may have affected the exposure as well as the contribution of the food sources to the total long-term exposure distribution. In practice however, the use of broad food categories to assess the exposure results habitually in overestimations of exposure, due to conservative choices during mapping.
For non-canned meat and fish products, more recent and specific information on BPA concentrations was available from ANSES (2017). Comparing these levels with those reported by the EFSA CEF Panel 3 Factsheet ‘Voedselconsumptie in Nederland. Wat, waar en wanneer?
(EFSA, 2015a) showed that the levels used by the Panel for non-canned meat products were higher than those reported per meat product: 9.4 µg/kg versus an average level ranging from 0.09 µg/kg in roast turkey to 5.4 µg/kg in Chipolata sausage (Appendix E). For non-canned fish products, the mean levels ranged from 0.03 µg/kg in cooked shrimps to 3.7 µg/kg in steamed salmon, whereas the mean level reported by the EFSA CEF Panel for this food group was 7.4 µg/kg. This comparison indicates firstly that there is a large variation in BPA
concentrations within a food category, with a potential of imprecise mapping when assigning just one average level to all foods belonging to one food category. Secondly, the average levels as analysed by ANSES (2017) were lower than those reported by the EFSA CEF Panel (2015a). ANSES (2017) also analysed BPA levels in non-canned meat products in samples collected between 2007 and 2009, and noticed a decrease in BPA levels in the 2015 samples. An explanation for this observation is not given. If this is a trend that is also applicable to other food
categories, the exposure may be overestimated using the older EFSA CEF Panel data. The data on canned tuna were too limited for a
comparison with the concentration reported by EFSA CEF Panel (2015a) for canned fish products: these levels only refer to one type of fish. Another important source of uncertainty related to the concentration data was the concentration assigned to the samples with a BPA
concentration below LOD or LOQ; the so called left-censored samples. In the exposure assessment, mean concentrations were used that were based on the assumption that left-censored samples contain BPA at a level equal to ½ LOD or ½ LOQ (medium bound (MB) scenario; section 2.2.2). To quantify the uncertainty regarding this assumption, typically the exposure is also estimated assuming that left-censored samples do not contain the compound (lower bound (LB) scenario) or contain the compound at a level equal to the LOD or LOQ (upper bound (UB) scenario). By performing these scenarios, it can be determined how robust the exposure results are in relation to the concentration assigned to the left-censored samples. The EFSA CEF Panel (2015a) performed such an analysis and showed that the levels assigned to the left-censored samples did not affect the exposure results significantly, due to a low percentage of left-censored samples. Given this
observation and the very low intake estimates in relation to the t-TDI, we did not perform such an assessment. It should however be noted that for the more recent concentrations analysed in canned tuna (Fattore et al., 2015) and non-canned meat and fish products (ANSES, 2017), the percentages of left-censored data were 22% and 25%, respectively. Given the high contribution of non-canned meat
(Appendix H), it cannot be excluded that the exposure may differ more than observed by the EFSA CEF Panel based on the level assigned to the left-censored data in our study. However, we do not expect that this will affect the exposure estimates to such an extent that this will
significantly change the contribution of the food categories to the exposure to BPA.
4.3.3 Food mapping
As described in section 4.3.2, a large uncertainty in the exposure estimates is due to mapping a mean concentration per food category to all foods belonging to this food category. Additionally, these
concentrations were often based on a limited variation of foods. For example, the mean canned BPA concentration of the food category ‘snacks, desserts and other foods’ was based on just one sample of canned starchy pudding, whereas that of the food category ‘alcoholic beverages’ on only canned beer (n=67).
Another source of uncertainty of food mapping was the limited
information about whether relevant foods were consumed as canned or not. For many foods, this could be established based on the name of the food and knowledge about how these foods are packaged. However, the choice could be less straightforward for other foods. The canned BPA concentrations were used for foods that are predominantly available as canned on the Dutch market to obtain a conservative estimate of the exposure. For 129 foods, this was however not clear and they were mapped either as consumed non-canned (scenario I) or as canned or non-canned with an equal probability (scenario II). It was shown that this uncertainty influenced largely the contribution of the food category ‘composite foods’ to the total BPA exposure distribution (section 4.2; Figure 1). The exposure to BPA was however less affected: the exposure was only a factor 1.2 higher at the P50 and 1.6 at the P95 (Table 1). This was mainly due to the low consumption of the food category ‘composite foods’ relative to the other food categories, and the small difference in BPA concentrations between scenario I and II for the food category ‘non-alcoholic beverages’; the food category with the highest number of foods for which it was not clear if they were consumed either canned or non-canned (section 4.2).
4.3.4 Modelling of exposure
In this study, the Observed Individual Means (OIM) model was used to assess the long-term exposure to BPA. This is the same model as used by the EFSA CEF Panel (2015a). In this model, the distribution of individual mean intakes over the person-days present in the food consumption databases is taken as a proxy for the long-term intake distribution. Given the limited number of person-days present in a food consumption database per person, in our case two, and the variation in daily food consumption patterns within an individual, the distribution of mean exposures over individuals obtained with OIM will often be too wide in comparison to distributions of ‘true’ long term exposures across individuals (Goedhart et al., 2012). For example, the mean exposure assessed over just two days is more variable than the mean exposure assessed over more (up to hundreds) days. This results in exposures that are about right in the middle of the exposure distribution, but are too high in the upper tail and too low in the lower tail of the exposure distribution.
If a more realistic exposure estimate is warranted, for example if the exposure is close to the HBGV or results in an insufficiently large margin of exposure, more advanced models are available in MCRA to assess the ‘true’ long-term exposure (Boon & van der Voet, 2015). Given the low exposure of BPA compared to the t-TDI, modelling the exposure via a more advance long-term exposure model was considered not necessary. Additionally, the contribution of the food categories to the exposure to BPA will remain the same when using more advanced models.
Furthermore, the uncertainty of the sample size of the food consumption database was included in the assessment and quantified as a lower and upper limit of a confidence interval of the exposure percentiles. As for this study the individual concentrations of BPA were not available but only mean concentrations per food (category), the uncertainty due to the sample size of the concentration data could not be included in this assessment. Because of this, the width of the confidence interval underestimates the true uncertainty. However, we do not expect that inclusion of this source of uncertainty will result in significant changes in the contribution of the food categories to the exposure to BPA.
4.3.5 Summary
The different issues contributing to the uncertainty in the exposure estimates can either have contributed to an underestimation (concentrations, food consumption data) or an overestimation
(concentrations, food consumption, mapping, exposure model) of the BPA exposure. Overall, we estimate however that the conservative choices made to address the uncertainties have resulted in an overestimation of the exposure. The relative contributions of the different food categories to the exposure to BPA were very likely not affected.
4.4 Dietary sources of exposure to BPA in very young children
In this exposure assessment, the vulnerable age group of 0 to one year was not included, due to the absence of consumption data for this age group in the Netherlands. In this group, the main source of exposure will be either infant formula and/or human breast milk during the first 4 to 6 months. As the children grow older, also other sources will become important including fruit, vegetables, grain products and meat products Studies on BPA in human breast milk have been conducted, but only very limited data from Europe are available. Known levels of BPA in breast milk were recently reviewed and discussed by Healy et al. (2015) and the EFSA CEF Panel (2015a). Mean and high BPA exposure via human breast milk for infants (0-6 months) was estimated to be lower than 0.225 and 0.600 µg/kg bw per day, respectively (EFSA, 2015a). Due to limitations of the included studies, conservative decisions of the EFSA CEF Panel resulted in an overestimation of the ‘true’ intake of BPA via breast milk. Mean and high BPA exposure via infant formula was estimated by this Panel at 0.03 and 0.08 µg/kg bw per day. These conservative estimates of exposure are around 50 to 100 orders of magnitude below the t-TDI.
4.5 Other sources of BPA exposure
In addition to food, exposure to BPA can also occur via non-food sources (Bakker et al., 2016; EFSA, 2015a). Examples of these sources are dust, toys, thermal paper, cosmetics, medical devices, dental materials, epoxy-based floorings, adhesives, paints, and also via plastic materials containing polycarbonate, such as CDs, DVDs, electronic equipment, jars/containers, identity cards and toys (EFSA, 2015a). Some of these sources of exposure are addressed in more detail below.
An example of thermal paper is cash receipts. By handling this type of paper, dermal exposure to BPA can occur (Hormann et al., 2014; Porras et al., 2014). Especially, people that handle many cash receipts on a daily basis, such as cashiers, could be exposed to higher levels of BPA (Bakker et al., 2016; EFSA, 2015a; Hormann et al., 2014; Porras et al., 2014). The EFSA CEF Panel (2015a) calculated a maximum dermal exposure to BPA via handling of thermal paper of 0.094 µg/kg bw per day at the median and 0.863 µg/kg bw per day at the high (P95) level, both in adolescents aged 10 to 17. In December 2016, the European Commission decided therefore to restrict the use of BPA in thermal paper in the EU in order to decrease the exposure via this source (Regulation (EU) 2016/2235). This restriction will become effective in 2020.
Adhesives and paints may contaminate indoor air and dust with BPA. Inhalation concentrations estimated by the EFSA CEF Panel were however low, as well as for dust ingestion (EFSA, 2015a). Mean BPA exposure via these two sources was calculated to range from 0.003 to 0.01 µg/kg bw per day.
Toys are a possible source of exposure to BPA for (very) young children, (EFSA, 2015a). However, legislation with a migration limit of toys was established in 2009 (Directive 2009/48/EC). Recently, the Norwegian Environment Agency performed a survey of bisphenol compounds in toys and other articles intended for children. This agency conducted a screening survey of bisphenols (including BPA) in 26 toys samples. BPA was only detected in a few samples, but far below the threshold limit. The majority of samples did not contain any of the bisphenol compounds tested. Due to the absence of a migration analysis, no exposure
assessment was performed (Sorensen, 2017).
Regarding cosmetics, BPA can migrate from the packaging into cosmetic products or be present as an impurity in cosmetic ingredients (EFSA, 2015a). BPA is not permitted as an ingredient in cosmetics in the EU (Regulation (EC) No 1223/2009). Data on BPA levels in cosmetic products is scarce. In 2013, BPA was detected at low levels in different cosmetic products (shower gel, hair gel, face lotion and make-up remover) available on the Spanish market (Cacho et al., 2013). Within this study, the analysed products contained BPA at concentrations ranging from 30.9 to 88.3 µg/kg. Based on these concentrations, the EFSA CEF Panel calculated an average exposure to BPA via cosmetics ranging from 0.002 (adults) to 0.0048 μg/kg bw per day (infants) (EFSA, 2015a). High exposure estimates ranged from 0.004 (adults) to 0.0094 μg/kg bw per day (infants). No additional studies on cosmetics were found after the 2015 EFSA CEF Panel publication.
BPA can also be present in medical devices. For some specific
subpopulations of the general population, the Scientific Committee on Emerging and Newly Identified Health Risks (SCENIHR) concluded that a risk for adverse effects of BPA may exist, when BPA is directly available for systemic exposure after non-oral exposure routes, especially for neonates in intensive care units and infants undergoing prolonged medical procedures (SCENIHR, 2015). This is also true for dialysis
patients. The SCENIHR recommended therefore that where practicable medical devices that do not leach BPA should be used.
Many different non-food sources contribute to the exposure of BPA, but exposure per source is very low. Furthermore, the exposure to BPA, also via food, is very likely decreasing due to an increased awareness of the possible risks of BPA (Appendix I). This will also very likely result in an increased use of alternatives of BPA. Bakker et al. (2016) listed a number of possible alternatives of BPA, but signalled also that
toxicological characterization is lacking for most of these alternatives. More information is needed about these alternatives before the safety of a replacement of BPA can be judged (Bakker et al., 2016). Based on available information today, BPA alternatives seem to have comparable hazard profiles as BPA (Bakker et al., 2016; Health Council of the Netherlands, 2014).
4.6 Risk analysis
In this report, the t-TDI derived by the EFSA CEF Panel was used to assess if estimated exposures to BPA from dietary sources pose a possible health risk (section 2.5). In 2016, RIVM reviewed two new experimental animal studies of Ménard et al. (2014a; b) that identified effects of BPA on the immune system after developmental exposure (Hessel et al., 2016; Ménard et al., 2014a; b). These studies indicated that developmental immunotoxicity might occur at lower dose levels of BPA than previously observed and on which the current t-TDI is based (Bauer et al., 2012; Ménard et al., 2014a; b). It was concluded that these new experimental studies provided credible evidence for adverse immune effects after developmental exposure to BPA at 5 μg/kg bw per day from gestation day 15 to postnatal day 21 (Hessel et al., 2016). This dose level is lower than the dose used by the EFSA CEF Panel for deriving the t-TDI. After a re-evaluation of the raw data of these two studies by Ménard et al. (2014a; b), not available to RIVM, the EFSA CEF Panel concluded however that the results from these studies were not sufficient to call for a revision of the current t-TDI (EFSA, 2016). The EFSA CEF Panel has however decided to start a review of all the
scientific evidence published after 2012 relevant for BPA hazard assessment (including immunotoxicity) in 2018. This will be done to determine whether the t-TDI needs to be reconsidered. This review was triggered by the need to ensure that the EFSA CEF Panel is prepared for the re-evaluation of the hazard of BPA based on the results of the new two-year US National Toxicology Programme (NTP)/Food and Drug Administration (FDA) rodent toxicity study expected in 2018.
Furthermore, BPA is under discussion about possible low dose effects; effects that could occur at very low dosages, as well as about its possible non-monotonic dose response (NMDR) effects (EFSA, 2015b). NMDRs are defined mathematically by a response where the slope of the curve changes sign from positive to negative, or vice versa (Kohn & Melnick, 2002). Recently, in a project commissioned by EFSA, the evidence for the NMDR hypothesis has been evaluated by critically reviewing the scientific peer-reviewed literature for substances in the area of food safety, including BPA. The evidence for the existence of
NMDR from the available studies evaluated was weak (Varret et al., 2017).
The t-TDI of 4 μg/kg bw per day for BPA based on effects on kidney weight in mice is the best HBGV presently available to assess a possible health risk related to the exposure to BPA via food. This HBGV was derived by the EFSA CEF Panel after an extensive review of all the literature available before 2012 (EFSA, 2015b). Based on this HBGV, the health risk related to the exposure of BPA via food is expected to be negligible (section 3.1; Figure 2; Table 1).
4.7 Conclusion
The exposure estimates indicate that possible health effects of BPA exposure via food are negligible: the exposure in both exposure scenarios and all three population groups were well below the t-TDI of 4 µg/kg bw per day. Under the worst case scenario, the estimated exposure was at least 30-fold below the t-TDI in children aged 2 to 6. Different food categories contributed to the dietary BPA exposure. The current exposure assessment was hampered by a number of uncertainties, of which the limited concentration data was the most important (section 4.2.2). However, the conservative choices made to address the uncertainties have very likely resulted in an overestimation of the exposure (section 4.2). Furthermore, the exposure estimates are in line with those reported by ANSES (2017).
In the current exposure assessment, the exposure estimates were compared to the t-TDI derived by the EFSA CEF Panel (2015b) to assess potential health risks. Due to the on-going discussion about BPA, the EFSA CEF Panel will, in 2018, review all the scientific evidence published after 2012 and relevant for BPA hazard assessment (including
immunotoxicity) to determine whether the t-TDI needs to be revised (section 4.6). As soon as the results of this review are published, it needs to be established if the current exposure levels still result in a negligible health risk. If not, foods belonging to relevant sources as identified in this study and available on the Dutch market need to be analysed for BPA. The resulting BPA concentrations can then be used to refine the exposure assessment.
Acknowledgements
The authors thank Aldert Piersma and Bianca van de Ven of the RIVM for their valuable comments during the preparation of the report and on an early version of the letter report.
References
ANSES (2017). Opinion of the French Agency for Food, Environmental and Occupational Health & Safety on the assessment of the results of bisphenol A contamination of non-canned foodstuffs of animal origin. French Agency for Food, Environmental and Occupational Health & Safety (ANSES), Maisons-Alfort Cedex. Available online: www.anses.fr. Bakker J, Hakkert BC, Hessel EVS, Luit RJ, Piersma AH, Sijm DTM, Rietveld AG, van Broekhuizen FA, van Loveren H, Verhoeven JK (2016). Bisphenol A. Part 2. Recommendations for risk management. RIVM Report 2015-0192. National Institute for Public Health and the Environment (RIVM), Bilthoven. Available online: www.rivm.nl.
Bauer SM. Roy A, Emo J, Chapman TJ, Georas SN, Lawrence BP (2012). The effects of maternal exposure to bisphenol A on allergic lung
inflammation into adulthood. Toxicological Sciences 130:82-93, doi: 10.1093/toxsci/kfs227.
Bemrah N, Jean J, Rivière G, Sanaa M, Leconte S, Bachelot M,
Deceuninck Y, Bizec BL, Dauchy X, Roudot AC, Camel V, Grob K, Feidt C, Picard-Hagen N, Badot PM, Foures F, Leblanc JC (2014). Assessment of dietary exposure to bisphenol A in the French population with a special focus on risk characterisation for pregnant French women. Food and Chemical Toxicology 72:90-7, doi: 10.1016/j.fct.2014.07.005.
Boon PE, van der Voet H, Ruprich J, Turrini A, Sand S, van Klaveren JD (2014) Computational tool for usual intake modelling workable at the European level. Food and Chemical Toxicology 74:279-88, doi: 10.1016/j.fct.2014.10.019.
Boon PE, van der Voet, H (2015). Probabilistic dietary exposure models. RIVM Letter report 2015-0191. National Institute for Public Health and the Environment (RIVM), Bilthoven. Available online: www.rivm.nl. Cacho JI, Campillo N, Viñas P, Hernández-Córdoba M (2013). Stir bar sorptive extraction with EG-Silicone coating for bisphenols determination in personal care products by GC-MS. Journal of Pharmaceutical and Biomedical Analysis 78–79: 255–60, doi: 10.1016/j.jpba.2013.02.023. de Boer WJ, Goedhart PW, Hart A, Kennedy MC, Kruisselbrink J, Owen H, Roelofs W, van der Voet, H (2016). MCRA 8.2 a web-based program for Monte Carlo Risk Assessment. Reference Manual. December, 2016. Biometris, Wageningen UR, Food and Environmmental Research Agency (Fera) and National Institute for Public Health and the Environment (RIVM), Wageningen, Bilthoven, the Netherlands and York, UK. Efron B (1979). Bootstrap methods: another look at the jackknife. Annals of Statistics 7:1-26.
Efron B, Tibshirani R (1993). An introduction to the bootstrap. New York: Chapman & Hall.
EFSA (2011). Evaluation of the FoodEx, the food classification system applied to the development of the EFSA Comprehensive European Food Consumption Database. EFSA Journal 9(3):1970. [27 pp.], doi:
EFSA (2015a). Scientific opinion on the risks to public health related to the presence of bisphenol A (BPA) in foodstuffs: Part I – Exposure assessment. Panel on Food Contact Materials, Enzymes, Flavourings and Processing Aids (CEF). EFSA Journal 13(1):3978. [396 pp.], doi:
10.2903/j.efsa.2015.3978. Available online: www.efsa.europa.eu. EFSA (2015b). Scientific opinion on the risks to public health related to the presence of bisphenol A (BPA) in foodstuffs: Part II –Toxicological assessment and risk characterisation. Panel on Food Contact Materials, Enzymes, Flavourings and Processing Aids (CEF). EFSA Journal
13(1):3978. [621 pp.], doi: 10.2903/j.efsa.2015.3978. Available online:
www.efsa.europa.eu.
EFSA (2016). A statement on the developmental immunotoxicity of bisphenol A (BPA): answer to the question from the Dutch Ministry of Health, Welfare and Sport. Panel on Food Contact Materials, Enzymes, Flavourings and Processing Aids (CEF). EFSA Journal 14(10):4580. [22 pp.], doi: 10.2903/j.efsa.2016.4580. Available online:
www.efsa.europa.eu.
Fattore M, Russo G, Barbato F, Grumetto L, Albrizio S (2015).
Monitoring of bisphenols in canned tuna from Italian markets. Food and Chemical Toxicology 83:68-75, doi: 10.1016/j.fct.2015.05.010.
Goedhart PW, van der Voet H, Knüppel S, Dekkers ALM, Dodd KW, Boeing H, van Klaveren JD (2012). A comparison by simulation of different methods to estimate the usual intake distribution for episodically consumed foods. Supporting Publications 9(6):EN-299. [65 pp.], doi:10.2903/sp.efsa.2012.EN-299. Available online:
www.efsa.europa.eu.
Health Council of the Netherlands (2014). The health risks of bisphenol A analogues (advisory letter). Publication no. 2014/06E. Health Council of the Netherlands, The Hague. Available online: www.gr.nl.
Healy BF, English KR, Jagals P, Sly PD (2015). Bisphenol A exposure pathways in early childhood: reviewing the need for improved risk assessment models. Journal of Exposure Science and Environmental Epidemiology 25:544-56, doi: 10.1038/jes.2015.49.
Heindel JJ, Newbold RR, Bucher JR, Camacho L, Delclos KB, Lewis SM, Vanlandingham M, Churchwell MI, Twaddle NC, McLellen M,
Chidambaram M, Bryant M, Woodling K, Gamboa da Costa G, Ferguson SA, Flaws J, Howard PC, Walker NJ, Zoeller RT, Fostel J, Favaro C, Schug TT (2015). NIEHS/FDA CLARITY-BPA research program update. Reproductive Toxicology 58:33-44, doi: 10.1016/j.reprotox.2015.07. 075.
Hessel EV, Ezendam J, van Broekhuizen FA, Hakkert B, DeWitt J, Granum B, Guzylack L, Lawrence BP, Penninks A, Rooney AA, Piersma AH, van Loveren H (2016). Assessment of recent developmental
immunotoxicity studies with bisphenol A in the context of the 2015 EFSA t-TDI. Reproductive Toxicology 65:448-56, doi: 10.1016/j.reprotox. 2016.06.020.
Hormann AM., vom Saal FS, Nagel SC, Stahlhut RW, Moyer CL, Ellersieck MR, Welshons WV, Toutain PL, Taylor JA (2014). Holding thermal receipt paper and eating food after using hand sanitizer results in high serum bioactive and urine total levels of bisphenol A (BPA). PLoS One 9:e110509, doi: 10.1371/journal.pone.0110509.
Kohn MC, Melnick RL (2002). Biochemical origins of the non-monotonic receptor-mediated dose-response. Journal of Molecular Endocrinology 29:113-23.
Ménard S, Guzylack-Piriou L, Lencina C, Leveque M, Naturel M, Sekkal S, Harkat C, Gaultier E, Olier M, Garcia-Villar R, Theodorou V, Houdeau E (2014a). Perinatal exposure to a low dose of bisphenol A impaired systemic cellular immune response and predisposes young rats to intestinal parasitic infection. PLoS One 9:e112752, doi:
10.1371/journal.pone.0112752.
Ménard S, Guzylack-Piriou L, Leveque M, Braniste V, Lencina C, Naturel M, Moussa L, Sekkal S, Harkat C, Gaultier E, Theodorou V, Houdeau E (2014b). Food intolerance at adulthood after perinatal exposure to the endocrine disruptor bisphenol A. FASEB Journal 28:4893-900, doi: 10.1096/fj.14-255380.
Ocké MC, van Rossum CTM, Fransen HP, Buurma EJM, de Boer EJ, Brants HAM, Niekerk EM, van der Laan JD, Drijvers JJMM, Ghameshlou Z (2008). Dutch National Food Consumption Survey - Young Children 2005/2006. RIVM Report 350070001/2008. National Institute for Public Health and the Environment (RIVM), Bilthoven. Available online:
www.rivm.nl.
Ocké MC, Hulshof KFAM, van Rossum CTM (2005). The Dutch National Food Consumption Survey 2003. Methodological issues. Archives of Public Health 63:227-41.
Porras SP, Heinala M, Santonen T (2014). Bisphenol A exposure via thermal paper receipts. Toxicology Letters 230:413-20, doi:
10.1016/j.toxlet.2014.08.020.
Sakhi AK, Lillegaard IT, Voorspoels S, Carlsen MH, Løken EB, Brantsæter AL, Haugen M, Meltzer HM, Thomsen C (2014). Concentrations of
phthalates and bisphenol A in Norwegian foods and beverages and estimated dietary exposure in adults. Environment International 73:259-69, doi: 10.1016/j.envint.2014.08.005.
SCENIHR (2015). Final opinion on the safety of the use of bisphenol A in medical devices. Adopted 18 Feb. 2015. Scientific Committee on
Emerging and Newly Identified Health Risks, European Commission, DG Health and Food Safety. Available online: ec.europa.eu.
Sorensen P (2017). Survey of bisphenol compounds in toys and other articles intended for children. Report M-689. Norwegian Environment Agency, Trondheim. Available online: www.miljodirektoratet.no.
van Rossum CTM, Fransen HP, Verkaik-Kloosterman J, Buurma-Rethans EJM, Ocké MC (2011). Dutch National Food Consumption Survey 2007-2010. Diet of children and adults aged 7 to 69 years. RIVM Report 350050006/2011. National Institute for Public Health and the Environment (RIVM), Bilthoven. Available online: www.rivm.nl.
Varret C, Beronius A, Bodina, L, Bokkers BGH, Boon PE, Burger M, De Wit-Bos L, Fischer A, Hanberg A, Litens-Karlsson S, Slob W, Wolterink G, Zilliacus J, Beausoleil C, Rousselle C (2017). Evaluating the evidence for non-monotonic dose-response relationships: A systematic literature review and (re-)analysis of in vivo toxicity data in the area of food safety. Toxicology and Applied Pharmacology 339:10-23, doi: 10.1016/j.taap.2017.11.018.
Appendix A Description of consumption data used in the
exposure assessment to BPA
DNFCS-Young Children 2005/2006 (Ocké et al., 2008)
The target population of the DNFCS-Young Children 2005/2006 consisted of boys and girls aged 2 to 6 living in the Netherlands. Respondents were selected from representative consumer panels of Market Research Agency GfK. Panel characteristics, such as socio-demographic characteristics, are known to GfK. Persons in these panels participate in all types of surveys and were not specially selected on nutritional characteristics. Institutionalised persons were excluded, as well as children whose parents/carers did not have sufficient knowledge of the Dutch language. Per family, only one child was included to avoid correlations in dietary consumption patterns between children of the same family. In total, 1,634 children were invited to participate in the study, of which 1,279 consented (net response of 78%). During recruitment, the representativeness of the study population was monitored and, if necessary, the recruitment was adjusted for age and sex, education of the head of the household, level of urbanisation, place of residence and region. The study population was representative
regarding socio-demographic characteristics (including region and education of the head of the household), but densely populated areas were slightly underrepresented.
The food consumption data were collected in the period October 2005 to November 2006 on two non-consecutive days (separated by about 8 to 13 days) via food diary. Parents/carers were visited at home by a trained employee of GfK. During the home visit, survey materials were presented and overall instructions were given.
Portion size of the foods and meals were estimated by using photographs, domestic measures (a small and a large spoon were supplied to standardise estimates), standard units, weight and/or volume. The usual volume of cups and glasses used was measured by the carer. All days of the week were equally represented, but the winter and autumn period were slightly overrepresented compared to the spring and summer period. National and/or religious holidays or holidays of the participants were not included in the survey.
DNFCS 2007-2010 (van Rossum et al., 2011)
The target population of the DNFCS 2007-2010 consisted of people aged 7 to 69 living in the Netherlands. Pregnant and breast-feeding women, as well as institutionalised people were not included. Respondents were selected from representative consumer panels of GfK. A maximum of one person per household was included in the survey to avoid
correlations in dietary consumption patterns between members of the same family. In addition, the panels only included people with sufficient knowledge of the Dutch language. In total, 5,502 individuals were invited to participate in the study, of which 3,819 consented (net response of 69%). Children were overrepresented in the study population and adults underrepresented.
The food consumption data were collected over a 3-year period from March 2007 to April 2010 via two non-consecutive 24-hour dietary recalls (separated by 2 to 6 weeks). Children aged 7 to 15 were interviewed face to face during home visits in the presence of at least one of the child’s parents or carers. Participants aged 16 and over were interviewed by telephone, at dates and times unannounced to the participants.
Portion sizes of foods consumed were quantified in several ways: by means of quantities as shown on photos in a provided picture booklet, or in household measures, standard units, by weight and/or volume. The survey covered all days of the weeks and all four seasons. National and/or religious holidays or holidays of the participants were not included in the survey.