From climate objectives to
emission reduction
Overview of the opportunities for mitigating
climate change
From climate objectives to emissions reduction
© Milieu- en Natuurplanbureau (MNP), Bilthoven, October 2006 MNP publications number 500114003/ 2006
ISBN: 978-90-6960-166-3
You may download this publication from the website www.mnp.nl or request a printed copy via
reports@mnp.nl (please include the MNP publications number).
Parts of this publication may be copied, provided that the source is mentioned: ‘Milieu- en Natuurplanbureau (2006). From climate objectives to emission reduction. Insights into the opportunities for mitigating climate change.
MNP publications number: 500114003/2006 Bilthoven.
Text: Detlef Van Vuuren, Marcel Berk, Jacco Farla (MNP) and Rolf De Vos (Ecofys) Editing of figures: Kees Klein-Goldewijk, Marian Abels (MNP)
Lay out: Publishing RIVM Printing: TDS Schiedam
Contact person: Detlef Van Vuuren. E-mail: detlef.van.vuuren@mnp.nl
Contents
SuMMARY 5From climate objectives to emissions reduction 6 From emissions reduction to a specific set of measures 8 How much will climate change policies cost? 8
Differentiation of efforts between rich and poor 9 Measures in the Netherlands up to 2020 10 1. Introduction 13
Science: from climate change to mitigation measures 13
Eu and Netherlands’ objective: maximum 2°C temperature increase 14 Climate policy in a wider context 16
Purpose of this report 17 2. Concentrations and emissions 19
Concentrations and temperature increase 19 What will happen if there is no climate policy? 21 Clusters of reduction pathways 22
More reductions, and faster 23 In 2050: 25-60% less emissions 24
3. Measures and costs of emissions reduction 27 Individual options 27
Sets of policy measures 33 Costs: Early actions can pay off 35
Additional advantages and disadvantages 36 Necessary conditions 37
Handling uncertainties 38
4. Global differentiation of efforts and costs per region 39
Expanding climate policy is necessary for ambitious objectives 39 Climate policy in a wider context 41
Multi-stage approach as example of international differentiation of efforts 41 Costs: winners and losers 44
Eu measures 45
5. Options for the Netherlands 47 Climate policy up to 2020 47 Measures in the Netherlands 48 Optional measures 49
Options up to 2020 50 Saving energy 52
From options to implementation 52 uncertainties versus certainties 54 Closing remarks 55
Literature 57 Glossary 59
CONTENTS
Summary
The earth’s climate is changing, and the latest assessments by the IPCC conclude that it is likely that humans have influenced this situation over the past 150 years (IPCC, 2001). In this context, in 1992 representatives from over 150 member countries of the united Nations signed an international Climate Change treaty in Rio de Janeiro (uNFCCC: uN Framework Convention on Climate Change). This convention forms the basis for inter-national climate policy. The objective is to avoid dangerous anthropogenic changes to the earth’s climate, in order to protect food production, biodiversity and sustainable development. The European union (including the Netherlands) have translated this into a specific policy aim: to limit global temperature increases to a maximum of 2°C above pre-industrial levels.
- The European climate policy is based on the long-term objective of mitigating climate change to a maximum temperature increase of 2°C (p.14)
It is not easy to translate this climate objective into specific long-term measures (i.e. after the 2008-2012 commitment period of the Kyoto Protocol). This requires scientific insight into the relationships between the causes and the consequences of climate change, which are still considerably uncertain. It requires making difficult and com-plex policy choices. For example, comparing the costs of climate policy and the risks of climate change. Limiting the temperature increase to 2°C requires a number of measu-res – not just by Europe, but also by the measu-rest of the world – for which international agreement is required on the allocation of the efforts involved.
- Climate policy fits into a broader framework of sustainable development (p.16)
The climate problem is not an isolated matter. When looking at this particular prob-lem, many other policy objectives also need to be taken into consideration. Climate policy, both with respect to emissions reduction and with respect to adaptation to climate change, is part of a much broader context of policy objectives, such as interna-tional development, improving air quality and the security of energy supplies. Many of the measures taken in other policy areas also have a direct influence on the feasibil-ity and costs of climate policy. It is therefore necessary to place climate policy within a broader framework of sustainable development. This also makes it possible to look for synergies between the various objectives, and thus also to widen the political and social levels of support for national and international climate policies.
This report aims to provide a useful and up-to-date overview of the latest scientific insights into the importance of, and opportunities for, reducing greenhouse gas emis-sions on both an international and national scale, based on a number of recent publi-cations by the MNP (Netherlands Environmental Assessment Agency).
SuMMARY
6
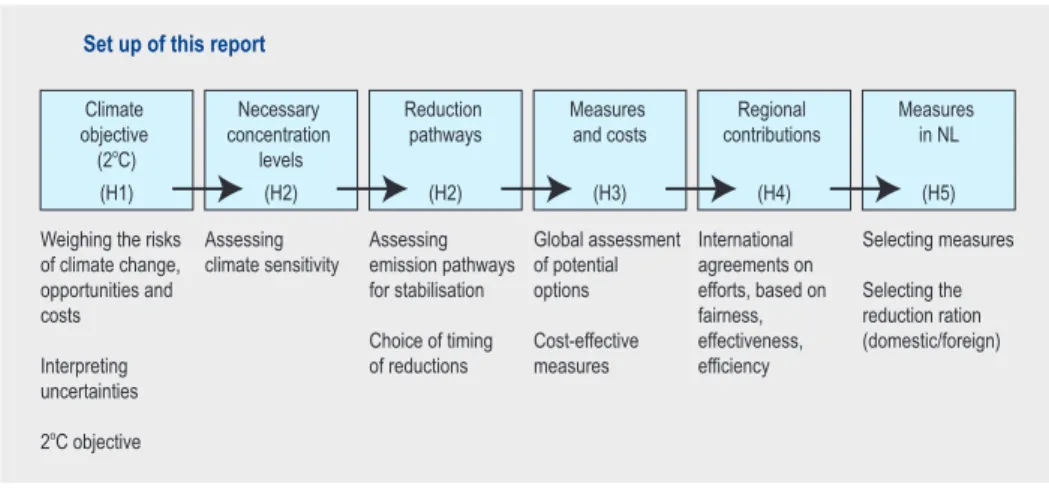
When translating the 2°C climate policy objective into possible measures, this report follows the steps shown in Figure A. It is important to realise that the decisions shown in Figure A concern various time frames. Clearly, the policy process itself is not as se-quential, as indicated in Figure A.
From climate objectives to emissions reduction
- Only by stabilising the concentrations of greenhouse gases at low levels there is a
reasonable chance of achieving the 2°C objective. With stabilisation at the level of 450 ppm CO2-eq.1 this chance is likely to be greater than 50% (p. 19)
- If the world is not able to turn ‘emissions growth’ into ‘emissions reduction’ be-fore 2025, the chances of achieving the 2°C objective will be significantly reduced (p. 24)
- In order to stabilise greenhouse gas concentrations at 450 ppm CO2-eq, emissions will need to be reduced by around 40% in 2050, compared to 1990 level (with a range from 25-60%). For 550 ppm CO2-eq. the reduction rate compared to 1990 is around 10% (p. 24)
- In climate policy, emissions reduction and adapting to climate change are com-plementary actions (p. 16)
The Eu’s long-term objective of not allowing the average temperature on earth to increase by more than 2°C is based on a political assessment of the socioeconomic and ecological risks of climate change. The relationship between global temperature increases and the effects of climate change are discussed in a previous MNP report
1 The box in Chapter 2 explains the CO2-equivalent (CO2-eq.) concentrations.
Weighing the risks of climate change, opportunities and costs Interpreting uncertainties 2oC objective Assessing
climate sensitivity Assessing emission pathways for stabilisation Choice of timing of reductions International agreements on efforts, based on fairness, effectiveness, efficiency Selecting measures Selecting the reduction ration (domestic/foreign) (H1) Climate objective (2oC) (H2) Necessary concentration levels (H2) Reduction pathways (H4) Regional contributions (H5) Measures in NL (H3) Measures and costs Global assessment of potential options Cost-effective measures Set up of this report
Figure A. From climate objectives to policy measures. Diagram showing relevant subjects and themes.
(Limits to warming). Since the pre-industrial age, the average temperature on earth has risen by 0.6-0.7°C, with a much greater increase at the poles. The effects can be seen in various places on earth – including the Netherlands –, particularly in nature. Studies show that the effects of climate change will increase if the temperature con-tinues to rise. Although there are still considerable uncertainties, it is expected that changes will initially concern sensitive ecosystems (such as coral reefs) and local effects (e.g. due to the increase in extreme weather events). Further climate change increases the risks of more radical (and large-scale) effects, such as the melting of Artic ice zones and parts of the Greenland ice sheet with related impacts on sea levels, negative ef-fects on food production, or the collapse of the thermohaline circulation. The greatest effects of climate change are expected to take place in developing countries: they are also the most vulnerable due to their considerable dependence on climate-sensitive economic sectors.
In order to limit the temperature increase, the increasing concentrations of green-house gases in the atmosphere need to be stabilised. Recent studies have resulted in better insight into the relationship between the stabilisation level and the increase in temperature. Only when the concentration level is stabilised at less than 450 ppm (parts per million) of CO2-eq. is there a more than 50% chance that the 2°C objective can be achieved. This level is much more ambitious than international politicians have taken into account previously, and is only slightly higher than the current concentra-tion level. In order to achieve this level of 450 ppm, it is therefore inevitable that the concentration level will first rise above the 450 ppm level, before further emissions-reduction efforts can lead to a lower concentration (peak profile). It is of course also possible to evaluate emission profiles that result in a stabilisation and/or peaking of concentrations at higher levels, but this obviously reduces the chances of meeting a 2°C target.
The concentration levels that provide the best chance of achieving the 2°C objective can only be reached if greenhouse gas emissions are significantly reduced all over the world. In 2050 the total worldwide greenhouse gas emissions would need to be 25-60% below 1990 levels (depending on the timing and level of the peak in global emissions and emission reduction rates ). This can only be achieved if all major countries make the necessary effort to reach this target. Even if the 2°C objective is achieved, it will still be necessary to adapt to changing climate conditions. This means taking measures such as changing agricultural and water-management techniques to take account of changing rainfall patterns, extreme weather events and rising sea levels. On the other hand, the success of adaptation policies will depend on limiting the temperature in-crease, to ensure that this policy is not faced with unmanageable problems. In other words, adaptation and reduction policies are to a large degree complementary approa-ches and, in many cases, not opposing choices.
From emissions reduction to a specific set of measures
- Currently known technologies offer sufficient potential for realising the necessary reductions to achieve low stabilisation levels (p. 33)
- Achieving emissions reduction will require a broad portfolio of policy measures (p. 34)
- In addition to energy savings, CO2 storage can be a very important technology in reducing greenhouse gas emissions (p. 28)
- Reducing non-CO2 greenhouse gases over the next two decades is a sensible way of keeping costs down (p. 32)
- Reduction measures often also contribute to achieving other policy objectives (p. 36)
The potential of currently known technologies is sufficient to achieve a global emis-sions reduction of 60% within five decades. The range of options is very wide: from nu-clear energy to renewable energy sources, from energy saving through to enhancing carbon sinks. Energy saving is certainly an important option that can play a considera-ble role in the total reduction measures over the next few decades. In the longer term, the transition to carbon-neutral systems will play an increasingly greater role. Along-side renewable energy sources or nuclear energy, carbon capture and storage could be, worldwide, a very attractive technology. Limiting emissions of non-CO2 greenhouse gases is also very attractive as the costs involved are often low.
Interestingly, these options are not just beneficial from a climate perspective, they also lead to less dependence on fossil fuels, improved access to modern energy, better air quality (and thus health), innovation, and new market opportunities for industry. The relative attractiveness of the various options will probably also be determined by the extent of these other advantages.
For reaching international agreements on taking measures, it is useful to look further than just the uN Framework Convention on Climate Change: particularly with respect to the synergy with other aspects of sustainable development, alternate frameworks (such as disaster alleviation, development funding, and trade) can also be very effec-tive.
How much will climate change policies cost?
- Stabilising at a level of 450 ppm CO2-eq. is expected to lead to annual costs that average 1-2% of the worldwide GDP (p. 35)
- There is considerable uncertainty about the costs: these could amount to half of, or to double of the estimated levels (p. 38)
In our calculations of the costs involved in achieving various stabilisation levels, we as-sumed a step-by-step expansion in the number of countries participating in emission
SuMMARY
reductions. The outcomes refer to direct costs, expressed as a percentage of the GDP (Gross Domestic Product), i.e. the size of the economy. These calculations show that the annual costs of an ambitious climate policy to stabilise emissions at 450 ppm CO2-eq. in this century, would amount to around 1-2% of the global GDP. This means that, cu-mulated over the century and using a discount rate of 5%, the costs will be around 1% of the (cumulated) GDP. The extent of these costs is comparable to the current costs for the total environmental policy in Western countries.
These estimates are based on assumptions, for example, concerning the free exchange of technological knowledge, decreasing costs for new technologies, and an optimum-cost approach to emissions reduction via a significant growth in the international tra-ding schemes for emissions rights (e.g. via the Clean Development Mechanism (CDM) under the Kyoto Protocol). However, there are considerable uncertainties surrounding these cost estimates. Calculations show that these vary from half the amount estima-ted, to around double this amount.
It should be noted that if the positive co-benefits of climate policies would be taken into account in the cost estimates, then the costs would be reduced. For example, when the positive effect on our health through less air pollution, as a side effect of climate policy, is expressed in terms of money, this can (in some cases) at least partly compen-sate for the aforementioned costs.
Differentiation of efforts between different countries
- Very ambitious reduction objectives can only be achieved if all large countries
participate (p. 38)
- Stabilisation at 450 ppm, under a multi-stage approach (in which the developing countries gradually join in), means emission reduction objectives for the richest countries in the order of 10-25% in 2020 and 60-90% in 2050 compared to 1990 levels (p. 43)
- In order to achieve stabilisation at low levels, it is necessary to involve some de-veloping countries in international emission agreements before the year 2020 (p. 44)
- A system of worldwide emissions trading is a crucial instrument in limiting costs. This would need to take place on a far larger scale than at present (p. 45)
Calculations show that all large countries must participate in this climate policy within a reasonable period, in order to achieve the necessary worldwide emissions reductions. Expanding the current coalition of countries with emissions objectives is therefore one of the most important priorities of international climate policy.
Many countries (both rich and poor) place the achievement of an acceptable diferen-tiation of efforts (burden-sharing) high on the agenda of international negodiferen-tiations on climate policy. Rich countries are expected to take the lead, and to achieve greater
reductions than developing countries. However, not all industrialised nations are cur-rently participating in international policies to reduce emissions. A high degree of certainty of reaching a 2oC target can only be achieved if all industrialised countries, including the uSA, participate. At the same time, the (larger) developing countries will also need to participate in a timely fashion if stabilisation at 450 ppm is to remain a realistic objective. Preferably, these contributions could be coupled to the realisation of sustainable development objectives (such as the access to energy, reducing air pol-lution, and energy security). This would slow the increase of greenhouse gas emissions in developing countries without damaging their economic development. It shows the urgency of developing strategies in which development and climate objectives are coupled, to remove the tension between climate and development wherever possible. The system of emissions trading, including the Clean Development Mechanism (see main text) can play an important role in encouraging measures in developing coun-tries, generating capital for developing councoun-tries, and keeping worldwide efforts at affordable levels.
measures in the Netherlands up to 2020
Policy objectives eventually need to be translated into measures at a national level. The analyses presented below for the Netherlands can be seen as a case study showing this type of translation process.
- A national emissions reduction goal of 15-30% in 2020 is in line with the necessary
international efforts to achieve the 2°C objective in the long term (p. 48)
- The Netherlands has sufficient potential to achieve a domestic emissions reduc-tion of 15% in 2020 (compared to 1990 levels), at a cost of € 1-2 billion per year. Technically, a 25% reduction is possible, but this would mean considerably higher costs (p. 49)
- Using the technical potential for domestic emissions reduction will need to be assessed against the possibilities for reducing emissions (more cheaply) in other countries. Additional advantages of domestic climate policy should also be taken into consideration (p. 53)
The Netherlands has recently made an inventory of options for climate measures up to the year 2020. This showed that, in theory, the Netherlands has sufficient reduction options available to achieve a substantive absolute reduction of greenhouse gas emis-sions in the medium term. A domestic reduction of 15% (compared to 1990 levels) is possible, at a cost € 1-2 billion per year. Technically, the potential is as high as 25%. Ho-wever, the government has not considered policy instruments for implementing many of these options, and their feasibility. The study clearly showed that a 15% reduction would require considerable policy efforts.
In order to remain in line with the necessary global reductions for achieving the 2°C objective, alongside its domestic emissions reduction, the Netherlands is also
conside-SuMMARY
ring realising emissions reductions in other countries, via international mechanisms such as CDM projects. The ratio between domestic and foreign emissions reductions will be an important discussion issue when determining post-2012 climate policy. The higher costs of domestic climate policy measures will therefore need to be weighed against the additional advantages, such as avoiding costs for attaining air pollution targets or advanced long term technological developments.
1. INtroDuCtIoN
The earth’s climate is changing. Climate change, in itself, is a natural process, for example through changes in the sun’s radiation. But since the pre-industrial era the climate has undergone some relatively fast changes. Although knowledge of the cli-mate system is still far from complete, and surrounded by considerable uncertainties, there is less and less doubt that recent changes in our climate are the result of human activities, particularly through the emission of greenhouse gases by combustion of fossil fuels and deforestation. This has led to a strong increase in the concentrations of greenhouse gases in the atmosphere.
It is possible to change the activities that are causing human induced climate change, but it’s not easy, and it requires some difficult policy choices. One important factor here is that, with climate change, there is a spatial separation between cause and ef-fect: local emissions also cause effects elsewhere, while limiting local climate effects also require emissions reductions to take place elsewhere. This means that climate change policy can only succeed through an international approach. The time delay between the (mitigation of the) greenhouse gas emissions and the (reduction in) effects of climate change, particularly rises in sea level, forms an additional complication. This means that today’s measures primarily reduce the risks for future generations. This requires policy makers to take account of the risks for future generations, based on still uncertain scientific knowledge concerning the causes and effects of climate change, and the possible solutions to this problem.
Scientific knowledge is developing fast. This report provides a handy overview of re-cent insights into the opportunities for mitigating climate change, based on a number of publications by the MNP (Netherlands Environmental Assessment Agency)2, which also include an analysis of other new publications. Together these publications provide a renewed picture of the possibilities for climate policy, of the necessity for global measures, and of the contribution that the Netherlands can make to this situation. This information is a current topic, now that a new round of international negotiations has started concerning future climate policy, that focuses on new climate agreements for the period after 2012.
Science: from climate change to mitigation measures
The scientific understanding of the climate problem begins by studying changes to the climate over the course of time. Climatologists see a link between climate variables,
2 The articles on international climate policy are also included in the scientific assessment that is currently being prepared by the IPCC (Intergovernmental Panel on Climate Change). For the Netherlands, this report includes information from the so-called Option Document, written by ECN and MNP.
such as the average temperature on earth, regional rainfall patterns and environmen-tal conditions, such as uV rays and concentrations of greenhouse gases in the atmosp-here, with all their associated uncertainties.
Next, science helps to create an understanding of the risks of climate change. Ecosy-stems and society are expected to have the capacity to adapt to small, slow changes in the climate. But as the pace of climate change increases, adaptations become more difficult and the risk of irreversible processes and sudden changes occurring increases, with implications for the economy, nature and our social life. Examples include losing unique ecosystems such as coral reefs, regional threats to food production through changes in rainfall patterns and/or in glacial meltwater supplies, or the consequence of fast-rising sea levels for low-lying coastal areas and islands.
Finally, science can also contribute to knowledge of measures that can abate the hu-man influence on our climate. Technologies to prevent climate change are usually available, although they sometimes need to be developed further, while the large-scale application of such technologies often requires important social and economic changes.
Eu and Netherlands’ objective: maximum 2°C temperature increase
In 1992 the international climate change treaty (uNFCCC) was signed in Rio de Janeiro (Brazil), . Its main objective is to prevent dangerous anthropogenic interference with the climate system, in order to protect food production, biodiversity and sustainable economic development. Which interferences are labelled as ‘dangerous’ is actually a social choice, where scientific knowledge concerning the risks plays an important role. The IPCC (Intergovernmental Panel on Climate Change), the most important in-ternational scientific platform for assessing the state of climate research, collates this knowledge and publishes periodic reports on its analyses. The third ‘Assessment Re-port’ (published in 2001) estimated that the temperature increase at the end of this century, without climate policy, would be between 1.5°C and 6°C, depending on the socio-economic developments and the uncertainties in the models used. The next IPCC report is due to be published in 2007.According to the IPCC, the temperature on earth has risen by 0.6-0.7°C since the pre-industrial era. The effects thereof are already visible in different places in the world, including the Netherlands. Studies indicate that the consequences of climate change will increase with further temperature increases. An earlier MNP report3 provided an overview of recent specialised knowledge, and Figure 1 provides a summary of that report. Although there are still considerable uncertainties, the expectation is that,
ini-3 B. Heij, B. Strengers, B. Eickhout, J. Van Minnen and M. Berk: ‘Hoeveel warmer mag het worden? / Limits to warming?’, MNP Report2005999.
1 INTRODuCTION
tially, sensitive ecosystems (such as coral reefs) or local systems (food supply) could be negatively affected. Further temperature increase is likely to lead to larger impacts, including the melting of Arctic sea ice and parts of the Greenland ice sheet with asso-ciated a significant rise in sea level, negative influences on worldwide food production, or the collapse of the thermohaline circulation.
Studies show that the greatest negative effects of climate change are to be expected in developing countries., These countries are the most vulnerable to climate change due to their high dependence on climate-sensitive economic sectors such as agriculture, the lack of facilities and structures to anticipate extreme weather situations, and the limited resilience as a result of low income levels.
Based partly on such insights, the Eu has chosen to aim at limiting the average tem-perature increase on earth to a maximum of 2°C, compared to the pre-industrial revo-lution level. This objective should be seen as a political decision based on the risks of climate change and the opportunities for preventing climate change. Since 1996 this objective has formed the cornerstone of the climate policy undertaken by the Eu and its Member States and, in 2005, was reconfirmed by the Eu government leaders. This objective has therefore also been selected as a starting point for the analyses
conduc-Ecosystems Food production (global) Food production (regional) Sea level rise (especially irreversible melting of the Greenland ice sheet) Disappearance of Artic ice
Collapse of the thermohaline circulation
1 2 3 4 5
Average world temperature increase (oC)
Risks of damage due to climate change
Positive effects Limited negative effects Considerable negative effects
Figure 1. The risks of climate change on a global scale, for ecosystems, food production, rising sea levels, Arctic sea zones and the warm Gulf Stream, as a function of the global temperature increase compared to pre-industrial levels (MNP, 2005).
ted for this report, i.e. which opportunities are available to ensure that the 2°C objec-tive is met, both worldwide and at the regional level, and what are the costs/benefits of such a policy?
- The long-term objective of European climate policy is to limit climate change to a
maximum 2°C temperature increase
Climate policy in a wider context
Climate policy, both for reducing emissions and adaptation policy, falls within a much wider context of policy objectives, such as improving air quality, securing energy sup-plies, and international development objectives. Many of the measures that are inclu-ded in other policy areas also have a direct influence on the feasibility and costs of climate policy. It is therefore necessary to set climate policy within a wider context of sustainable development. This makes it possible to search for synergies between the various objectives, and thus for opportunities to expand the political and social sup-port for national and international climate policy.
Because unavoidable effects of climate change will occur, adaptation will need to be part of a strong climate policy. Adaptation policy is also important due to the many uncertainties in the system. In other words, even if greenhouse gas emissions are reduced on a global scale, the climate will still change (see also MNP report Effects of
climate change in the Netherlands). The required
adaptation depends on the global emissions-re-duction efforts: if the worldwide concentrations of greenhouse gases are stabilised in time, there is a better chance that adaptation to climate change will be successful.
Thus, the extent to which the adaptation policy succeeds depends on limiting the temperature increase. Adaptation and reduction policies are complementary approaches. However, in practice, and at national level, choices between adapta-tion and mitigaadapta-tion will still be made, for example building higher dykes along waterways, and the
contribution to the worldwide reduction of emissi-ons. Considering the many scientific uncertainties it is not possible to substantiate an optimum division between mitigation and adaptation efforts. This is partly due to the differences in the sensitivity of countries to the effects (e.g. vulnerability to changes in sea levels and rainfall), and the widely varying contribution to emissions and opportunities for emissions reduction in these same countries. Deciding between adaptation and emissions reduction remains fundamentally difficult due to the uncertainties concerning the risks of climate effects, the effectiveness of the (international) mitigation policy, and uncertainties with regard to the costs (and development thereof) within the time period (WRR, Climate strategy between ambition
and realism, 2006). Another factor is the fact that
costs and effects are not well known and, above all, the long-term effects (scientifically speaking) are still somewhat ambiguous.
Adapt to climate change, or further reductions? 1 INTRODuCTION
Purpose of this report
This report aims to provide an up-to-date sketch of the current scientific knowledge concerning the implications of, and opportunities for, achieving the Eu objective of keeping the global temperature increase to 2°C above pre-industrial levels. The report also provides insight into the choices that society needs to make in order to achieve this objective, and the effects that must also be considered. Crucial elements include the desired certainty of achieving this objective, which measures can be taken, the costs thereof, and the relationship to sustainable development, the necessary interna-tional cooperation and division of efforts, coordinating policies at various levels, and the content of the national climate policy.
Several subjects fall outside the scope of this publication. For example, the question of which policy instruments should be selected in order to implement the reduction options is not discussed. The text box in Chapter 5 mentions several options.
The report follows a step-by-step approach (see Figure 2). The global situation is discus-sed first, followed by possible ways to differentiate future commitments regionally, and finally it zooms in on mitigation options at the national level of the Netherlands . The information for the Netherlands can be seen as a case study that would also apply to other European countries. Chapter 2 shows the concentrations of greenhouse gases at which the temperature increase would probably be limited to 2°C or less, and which reductions of gas emissions would be required. Chapter 3 discusses the measures ne-cessary to realise these (global) reductions. International measures appear to be both necessary and possible, but demand an acceptable division of efforts between the rich and poor countries (Chapter 4). Finally, Chapter 5 explains the opportunities for emis-sions reduction at national levels, e.g. the Netherlands.
(H1) (H2) (H2) (H3) (H4) (H5)
Set up of this report Climate objective (2oC) Necessary concentration levels Reduction
pathways contributions Regional Measures in the Netherlands Measures
and costs
Figure 2. Set up of this report
2.
CoNCENtratIoNS aND EmISSIoNS
When developing long-term climate strategies the first requirement is to define the relationship between the concentration of greenhouse gases in the atmosphere and temperature increase. More specifically for the Eu target: which concentration level will ensure that the 2°C objective can be met? This chapter focuses on this aspect, while also answering the question: how much will greenhouse gas emissions need to be reduced in order to achieve this concentration level?
Scientists agree that the climate is changing. However, the exact relationship between greenhouse gas emissions, their concentrations in the atmosphere, and the resulting temperature is not yet clearly defined. There are a number of uncertain variables, such as the sensitivity of the climate system towards increased concentrations of greenhouse gases in the atmosphere (climate sensitivity), the relationship between greenhouse gas emissions and the resulting concentrations, the contribution of the various sources of greenhouse gases, and the speed with which the emissions can be reduced.
Concentrations and temperature increase
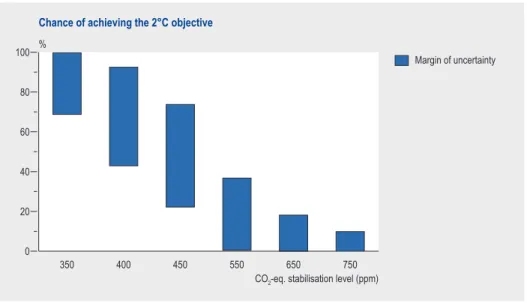
Scientific literature includes various estimates of the relationship between the con-centrations of greenhouse gases in the atmosphere and temperature increase, and thus the chance that the global temperature increase will not rise above 2°C. Figure 3 shows the ranges of estimates given for various stabilisation levels. This not only takes account of carbon dioxide (CO2) levels, but also other greenhouse gases (see also the text box on ‘CO2 and CO2-equivalents’). The chances of keeping the temperature increase under 2°C improve considerably at lower concentration levels. Figure 3 shows that at a stabilisation level of 550 ppm CO2-eq. there is a significant risk (at least 66%) of exceeding the 2°C limit. However, at a concentration level of 450 ppm there is a reasonable chance (over 50%) of achieving the 2°C objective. It is also possible that, by choosing emission profiles carefully, emissions could be reduced even further after the concentration level has been reached (peaking), thus improving the chances, though this would not change the general conclusions.
- There is only a high degree of certainty for achieving the EU 2°C objective if con-centrations of greenhouse gases are stabilised at low concentration levels. Stabi-lisation at 450 ppm CO2-eq.4 or less is likely to lead to a chance of success above
50%
4 See also text box ‘ CO2 and CO2-equivalents’.
This is a considerably lower level than was considered necessary several years ago in order to achieve the 2°C objective. The 1996 Eu Council decision assumed that con-centrations of CO2 would need to be stabilised at a level of less than 550 ppm (or 650 ppm CO2-eq.). The difference is caused by new insights and a better interpretation of the uncertainties.
350 400 450 550 650 750
CO2-eq. stabilisation level (ppm) 0 20 40 60 80 100 % Margin of uncertainty Chance of achieving the 2°C objective
Carbon dioxide (CO2) is an important waste product
of combustion, and is also the most important greenhouse gas in the atmosphere. But it is not the only gas that causes global warming. According to current insights, other greenhouse gases ac-count for around 25% of emissions. These other greenhouse gases include, for example, methane (CH4), laughing gas (N2O), and fluorinated gases
such as HFCs, PFCs, and SF6. The atmospheric
concentrations of some of these gases are low, but their impact per weight unit on increasing the greenhouse effect is sometimes thousands of times greater than that of CO2.
In order to create one indicator for all gases combined, the concept of CO2-equivalents has been
created. This concept aims to convert the effects of other greenhouse gases into the equivalent of CO2.
This report presents all figures as CO2-equivalents
– unless explicitly shown otherwise. Emissions are expressed in tons CO2-eq. (tCO2-eq.), and
concen-trations in parts per million CO2-eq. (ppm, or the
number of molecules of CO2 per million parts of air).
The CO2 concentrations correspond to the CO2-eq.
concentrations shown in Table 1 (p. 23). [end box]
Figure 3. Estimates given in the scientific literature concerning the chances of achieving the European climate objective, at various stabilisation levels for greenhouse gas concentrations in the atmosphere.
CO2 and CO2-equivalents 2 CONCENTRATIONS AND EMISSIONS
What will happen if there is no climate policy?
Emission developments over the coming century are uncertain. How will the world’s population develop? How strongly will the world economy grow? What will happen to energy stocks, prices and energy technologies? How will consumption patterns deve-lop? How much deforestation will there be? Strong economic growth, high population growth and energy-intensive consumption patterns are all factors that can lead to higher emissions. On the other hand, strong technological development can lead to lower emissions.
Scientific studies try to gain insights into potential emission development by develo-ping various reference projections or scenarios. The analyses described in this report are based on a so-called ‘medium scenario’, developed by MNP. This scenario is based on trend estimates, such as those also used in the IEA (International Energy Agency) reference scenario, and the so-called B2 scenario used by the IPCC.
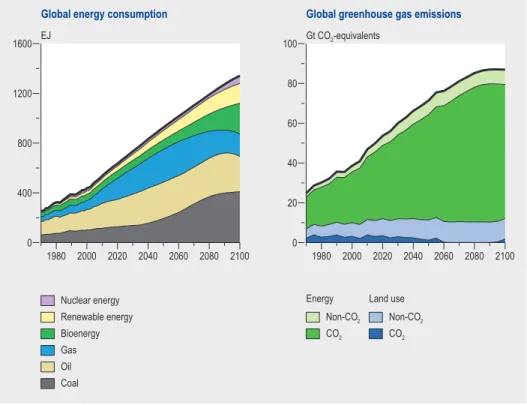
According to the reference scenario, over the next century the world population will expand to 9-10 billion (in the middle of the century) and will fall slightly thereafter. Combined with a worldwide economic growth of around 2% per year, it is expected that the global demand for energy will increase considerably: doubling by 2050, and reaching three times the current use in 2100 (see Figure 4). This growth primarily
1980 2000 2020 2040 2060 2080 2100 0 400 800 1200 1600 EJ Nuclear energy Renewable energy Bioenergy Gas Oil Coal
Global energy consumption
1980 2000 2020 2040 2060 2080 2100 0 20 40 60 80 100 Gt CO2-equivalents Energy Non-CO2 CO2 Land use Non-CO2 CO2
Global greenhouse gas emissions
Figure 4. Development of total energy primary energy supply and greenhouse gas emissions in the baseline scenario.
occurs in the current developing countries, which thus partially make up their huge arrears in energy consumption per person.
Without climate policy the expectation is that the world’s energy demand will primari-ly be met by conventional combustion of fossil fuels, as a result of which CO2 emissions will increase accordingly. In this baseline, the total greenhouse gas emissions increase from around 30 billion tons (=Gt) CO2-eq. in 2000, to 50 billion tons in 2050, and 70 billion tons in 2100. The projections of alternative reference scenarios are sometimes higher, and sometimes lower (often between 40 and 90 billion tons). While most emis-sions have, up to now, been caused by the rich nations (around 80%), as with energy consumption, emissions are now rising fastest in the less developed countries: in the reference scenario it is expected that their contribution increases from around 50% today, to 65% in 2100. At the same time, per capita, emissions from the current OECD (Organisation for Economic Cooperation and Development) countries remain higher than those from developing countries.
under these trends, the greenhouse gas concentrations are in 2100 more than dou-bled, from current levels of around 425 ppm CO2-eq. to over 900 ppm CO2-eq., and the concentrations continue to increase further. With an average estimate of uncertainties the temperature increase in 2100 will be far higher than 2°C.
Clusters of reduction pathways
As previously mentioned, low greenhouse gas concentration levels cannot be achieved without substantial climate policy action. The question is: how much reduction is re-quired to achieve low concentrations? There is of course a certain amount of uncer-tainty involved. This unceruncer-tainty in the outcome has several causes:
- The reductions, measured in CO2-equivalents, can be achieved via various combina-tions of greenhouse gases.
- The reference development influences the speed with which emission increases can be reversed and the extent of the necessary reductions.
- Starting climate policies early leads to different emission routes than those needed if climate policy is started later. Postponing emissions reduction can even lead to some concentration levels no longer being achievable.
- There is no general consensus on future technological development, including the costs of new techniques.
Exploring the possible emissions reduction needed to stabilise greenhouse gas concen-trations in the atmosphere does not result in a single emission pathway, but in ‘clus-ters’ of interrelated sets of emission pathways (see Figure 5). These clusters show the bandwidths within which emissions must remain in this century in order to achieve the various stabilisation levels for greenhouse gases (being high within the band early in the century, allows one to be low in the band in the second part of the century – and vice versa).
2 CONCENTRATIONS AND EMISSIONS
more reductions, and faster
Current scientific insights have important consequences for global climate policy. The ‘emission clusters’ indicate that urgency is required for achieving low stabilisation targets. If the world does not succeed in turning emissions growth into a considera-ble emissions reduction before 2025, then low concentration levels will no longer be achievable, in the timeframe required.
2000 2020 2040 2060 2080 2100 0 40 80 120 160
200 Relative emissions of CO2-eq. (1990=100)
650 ppm CO2-eq.
550 ppm CO2-eq.
450 ppm CO2-eq.
Emission clusters for stabilisation at 450, 550 and 650 CO2-eq.
Figure 5. Clusters of emission-reduction pathways. These clusters originate from various uncer-tainties in baseline developments and various differences in timing climate policy.
The top of the cluster is primarily determined because postponing measures further means that the desired stable concentration levels in the atmosphere can no longer be achieved. The lower edge is primarily limited by the available potential of mitigation measures, which cannot be implemented at indefinite rate. Based on literature survey, we assume that annual global emissions cannot be reduced over 2-3% per year over a long time period, irrespective of the ambitious climate policy used. Emission-reduction pathways that start off along the top of the cluster will later move to the lower side, and vice versa (see also text box ‘Intermezzo: Models’).
Table 1. Summary of reduction pathways.
CO2 Equivalent Concentration
Corresponding CO2 concentration
Emission reductions Equilibrium tempera-ture 2000-2100 reduc-tion (from baseline): Emissions 2020 (% above 1990) Range Best estimate ppm ppm GtCO2-eq. oC oC 650 540 - 575 2600 - 1.7 -5.0 3.2 550 475 - 500 3600 19-41 1.4 - 4.1 2.6 450 400 - 420 4300 7-24 1.0 - 3.0 1.8
- If the world does not succeed in turning the growth in emissions into an emission
reduction before 2025, then the chance of achieving the 2°C objective is considera-bly reduced
The need to turn the current emissions increase into an emissions reduction is natu-rally greatest for the 450 ppm CO2-eq. profile. If this turnaround does not occur in the next 10-20 years then this profile will become almost impossible to reach. It is impor-tant to note that the current profile already allows for a temporary overshoot above the targeted level (to around 500 ppm), given the fact that current concentration levels are already close to the desired 450 ppm CO2-eq. level. This type of overshoot profiles can still lead to high changes of achieving a 2oC (or other) temperature target if the ‘overshoot’ period is very short. Overshoot profiles can also be developed for other concentration levels, but are not discussed further here.
In 2050: 40% (25-60%) less emissions than in 1990
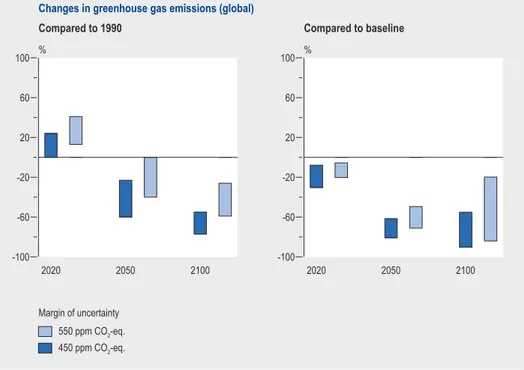
The current commitments under the Kyoto Protocol continue only up to 2012, and basically require around 3% emissions reductions by the richest nations (excluding uSA and Australia). These commitments thus are only a beginning for the reductions re-quired to stabilise greenhouse gas concentrations. Depending on the desired certainty of achieving the 2°C objective, in 2050 worldwide reductions will be necessary in the
Figure 6. Necessary worldwide reductions of greenhouse gases in order to achieve stabilisation of emissions, compared to both 1990 levels and the baseline.
2020 2050 2100 -100 -60 -20 20 60 100 % Margin of uncertainty 550 ppm CO2-eq. 450 ppm CO2-eq. Compared to 1990
Changes in greenhouse gas emissions (global)
2020 2050 2100 -100 -60 -20 20 60 100 % Compared to baseline
2 CONCENTRATIONS AND EMISSIONS
order of 10% for 550 and 40% for 450 ppm compared to 1990 (under the reference sce-nario and central reduction pathways). Taken all uncertainty into account with respect to reference scenarios emissions (in particular deforestation) and timing of emission reductions these numbers van vary over a range of 0-40% for 550 ppm and 25-60% for 450 ppm.
These reductions mentioned so far are relative to emissions in 1990. In practice, the trend since 1990 has been a continued growth in worldwide emissions. Compared to the reference scenario, reductions will need to be even greater: in that case the change to achieve stabilisation at 450 ppm is already an estimated 10-30% in 2020 and 60-80% in 2050, depending on the assumed growth in the baseline.
Models
The calculations in Chapters 2, 3 and 4 of this report are based on various models that calculate global energy and land use, climate change, and the costs of climate policy. All calculations basically consist of two main elements:
- Initially, ‘clusters’ of emissions pathways are defined that match the concentration objectives. - Then a set of measures is sought that, from a
global viewpoint, achieve the emission reduc-tions required to keep emissions within these clusters at the lowest expense.
Both elements run in parallel. The reduction pathways take into account the availability of reduction options. A number of essential assump-tions are made for both elements. The reduction pathways must ensure that the concentration objective is exceeded only for a limited period of time. Above all, the pathways take into account that technical limitations mean that the speed of the re-duction can never be higher than 2-3% per year. At the same time, it is assumed that emissions can be reduced in all sectors, for all greenhouse gases and in all regions. This optimistic assumption (which can be achieved via international emission trading) leads to a possibly rose-coloured outcome with respect to the costs involved. Limiting the measures per sector can lead to significantly higher costs, for
example, by 30% if non-CO2 reduction options are
excluded.
All calculations have been performed for 17 world regions. For calculating regional reductions and costs (see Chapter 4), the global reduction objec-tives are first divided between these regions using a pre-defined differentiation of commitments. The resulting regional reduction objectives can then be realised via measures both inside and outside the region. Emissions trading systems allow these reductions to be ‘traded’ between the various regions.
In general the models used provide insights into the chances of achieving the temperature-increase objectives, the contributions made by the various measures, and the (regional) costs involved (assu-ming that measures are implemented in all regions). The costs always concern the direct costs of climate policy. No macroeconomic impacts of these costs are calculated. For such feedback effects, such as for example the moving of industrial activity or the loss of fossil fuel exports, reference is made to the existing analyses. The co-benefits, such as lower costs for air pollution policy, are not included in the calculations.
Intermezzo
3.
mEaSurES aND CoStS oF EmISSIoNS rEDuCtIoN
The previous chapter showed that the 2°C objective requires considerable reductions in greenhouse gas emissions. An important question, certainly for policy makers, is: are there sufficient opportunities to achieve the reductions mentioned, and which measures will help to achieve this aim? This chapter discusses this question on the ba-sis of data concerning reduction potentials in all sectors, and of models that allow for defining cost-optimal strategies to achieve far-reaching emissions reductions.The model calculations result in portfolios of measures with which the required emis-sion levels can be achieved. In addition to the total reduction costs, cost implications for various sectors – such as the energy sector – are also dealt with. The way in which such a policy is executed, and the societal efforts required, fall outside the scope of this report. The certainties and uncertainties arising from these studies are important in considering risks and costs.
Individual options
The scientific literature provides descriptions of various options that can be used to achieve significant emission reductions. Table 2 contains an overview of typical values for the technical potential of individual option, as given in the literature (the table concentrates on minimum values; note that these cannot be easily summed up). In comparison, the emissions in the baseline scenario in the 2000-2100 period are almost 7000 Gton CO2-eq. (this is within the range of 5000-8000 Gton CO2-eq. used in IPCC scenarios). As previously mentioned, Table 1 shows the necessary emission reductions for stabilisation at 650, 550 and 450 ppm, which are 2600, 3600, and 4300 Gton res-pectively, compared to the baseline scenario.
Table 2. Literature estimates of the cumulative technical potential to reduce greenhouse gas emis-sions during the period 2000-2100 (in billion tons CO2-equivalents).
option Cumulative technical potential
(Gton Co2-eq.)
Energy savings >1000
Carbon capture and storage >2000
Nuclear energy >300
Renewable >3000
Carbon sinks >350
Non-CO2 greenhouse gases >500
The various options that can be used to reduce greenhouse gas emissions are discussed below. The WRR report ‘Climate strategy between ambition and realism’ also provides an overview of reduction options and their contribution. The figures presented here are in the same size range, though slightly lower: these are estimates for an earlier point in time (2050), which give greater consideration to possibilities for applying the measures. The importance of the various options is generally comparable.
Saving energy
Saving energy is an important part of all climate policy strategies. Compared to the current situation, studies show that saving energy over the next century could achieve emission reductions of 50-70%, although the effect decreases after the first decades of this century. Even in the absence of climate policy, equipment becomes more efficient as a result of technological improvements. This implies that the actual additional po-tential is somewhat reduced. The IPCC estimates that, compared to the baseline, saving energy can achieve a 25% emissions reduction over the next 30 years. using this as a basis, a conservative estimate for the entire century results in a reduction potential of around 1000-1500 billion tons CO2-eq.
The costs of saving energy vary enormously, from benefits of around several dozen euro per ton of CO2 avoided, to costs of around € 50 per ton (compared to other options this is relatively low). Saving energy is also an attractive option because it has so many other advantages. Efficient use of energy reduces the dependence on energy imports. Energy cost reductions also reduce the sensitivity to energy price variations, and may improve the competitiveness of companies. However, it is difficult to substantially ac-celerate the energy-saving tempo, due to the wide range of sectors and applications involved, and due to the fact that many parties would need to cooperate. This is parti-cularly valid for options concerning households and the transport sector.
CO2 storage
In addition to saving energy, storing the CO2 that is released by the energy sector and elsewhere in industry could form an important technology in the fight against climate change. The costs of this new technology (CCS: Carbon Capture and Storage) are esti-mated at around € 20-80 per ton CO2-eq., with the possibility of further cost reduction. The global storage potential is estimated as being at least 2000 Gton CO2-eq.
- In addition to saving energy, CO2 storage could become a very important techno-logy for reducing greenhouse gas emissions
This option is particularly attractive for so-called ‘point sources’ with large emissions, such as power plants and several industrial sectors. An important advantage of this technology is that it seems easy to integrate into the current energy infrastructure. Coal-rich countries, in particular, could use this technology to achieve both security of energy supplies and to meet climate objectives. Large-scale application at power plants still needs to be proven, and the costs and risks are not yet entirely known and depend on local circumstances. Worldwide there are currently several large projects
3 MEASuRES AND COSTS OF EMISSIONS REDuCTION
operational in the gas and oil extraction sector, and various demonstration and pilot projects are being carried out. The CCS technology competes for emissions reductions in the electricity sector with both nuclear energy and renewable energy. Future cost estimates for these three options overlap. Over the past 10 years the knowledge of CO2 storage has been disseminated internationally, and demonstration projects have pro-ven that this is a viable option.
Nuclear energy
It is not clear whether there will be a considerable increase in the worldwide use of nuclear energy, partly due to the limited social acceptance in many countries, but also due to the high investment costs involved and the long construction period required. If drastic emissions reduction is required then expanding the use of nuclear energy could be a viable option. This is partly due to the difficulty of integrating a large share of alternative energy sources (such as wind and solar energy) into national electricity grids. However, nuclear energy also has disadvantages such as the risks of accidents and proliferation and long-term storage of radioactive waste. Cost estimates for the direct costs of nuclear energy (excluding the complete storage costs and risks men-tioned) vary over the coming decades from € 15-100 per ton CO2 emissions reduction. The potential until 2100 depends on social factors as well as technical factors. Based on the current technology and proven stocks, this potential is limited to 300-400 billion tons CO2. But new techniques and reserves could increase this potential considerably. Nuclear energy could reduce the dependence on oil and gas imports, but also means that nations are again dependent on a limited number of suppliers.
Sun, wind and other energy sources
The literature provides assessment of the possible role for hydropower, solar and wind energy, with extremely diverse results: from a fairly limited role to the production of many times our current energy consumption. The large variation in results largely depends on whether economic and markets considerations are included and how this is done. However, it is clear that the amount of electricity produced by the sun and wind will increase considerably over the next few decades. Hydropower currently has the greatest share, but the potential for further expansion is relatively small. Impor-tant challenges for further expansion would be cost reductions (particularly for solar energy), spatial impacts and nuisance factors (wind energy), and the integration of these intermittent sources into national electricity grids. Further technological break-throughs, better integration into the electricity grid, and the public’s acceptance of re-newable resources – in competition, for example, with nuclear energy and CO2 storage – are essential, but there is certainly a huge potential.
In general, renewable sources are currently among the relatively more expensive op-tions (from € 50 per ton CO2-eq.), but substantial cost reductions are predicted. Wind energy (both onshore and offshore) is economically the most attractive option, but has less potential than solar energy.
Renewable sources can reduce the dependency on fossil energy imports. They can also play an important role in providing electricity in rural areas, and thus creating extra jobs.
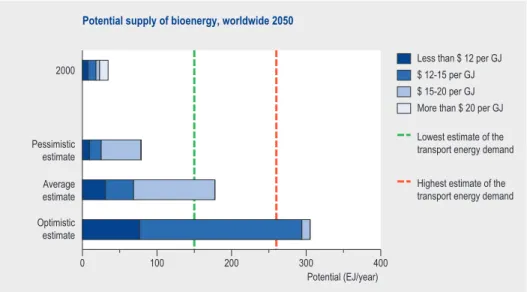
Bioenergy
Among the renewable sources, bioenergy (energy from crops or other biological waste material) deserves special attention. Studies of the potential confirm that the produc-tion of liquid fuels from biomass could meet the total demand in the global transport sector (see Figure 7). Bioenergy can also be used to produce electricity and heat. Part of the bioenergy can be derived from waste products. However, large-scale ap-plication will mean that bioenergy will primarily be derived from specific crops that are cultivated for energy production. The eventual contribution from biomass greatly depends on the expectations for future land use. The large-scale cultivation of biomass for energy applications could mean a considerable change in future land use, and could compete with the use of this land for food production. Other aspects of sustai-nability, such as maintaining biodiversity and clean production methods, also play a role here. Bioenergy is expected to profit considerably from agricultural land that will become available, initially in developed areas, but also in developing countries during the latter part of this century. If there is a rapid shift towards wood and grassy crops (cellulose-based processes), this option offers greater CO2 reduction options and less land use per unit of energy, although technical breakthroughs are still required to achieve this.
Figure 7. Worldwide potential of bioenergy supplies (estimates are based on the elaboration of four IPCC scenarios).
2000 Pessimistic estimate Average estimate Optimistic estimate 0 100 200 300 400 Potential (EJ/year)
Less than $ 12 per GJ $ 12-15 per GJ $ 15-20 per GJ More than $ 20 per GJ Potential supply of bioenergy, worldwide 2050
Lowest estimate of the transport energy demand Highest estimate of the transport energy demand
3 MEASuRES AND COSTS OF EMISSIONS REDuCTION
Carbon sinks and other land use
Reducing deforestation can also contribute to limiting the concentrations of green-house gases in the atmosphere. The reference scenario of this study already assumes less deforestation (without extra climate policy). A further step would be reforestation: planting new trees or other vegetation that absorbs relatively more carbon from the atmosphere. Since such forests absorb more carbon than, for example, agricultural crops or natural vegetation, such applications are known as ‘carbon sinks’ (see Figure 8). Carbon sinks have a limited potential compared to the current annual greenhouse gas emissions, around a maximum of 4-7 billion tons CO2-eq. per year, which would result in a conservative estimate of 350 billion tons over the coming century.
Over the next few decades Southern Africa and the former Soviet union will be the main focus for carbon sinks, although South America and China will also contribute later this century. The costs are estimated as relatively low: € 10-50 per ton CO2-eq.
Fuel substitution
Emissions can also be reduced by using alternative, lower-carbon, fossil fuels in power plants. The CO2 emissions from burning natural gas, for example, are 40% lower than when burning coal. The conversion efficiency in gas-fired plants is also considerably higher than for coal-fired plants, certainly if natural gas is used in combined heat and power plants.
The costs of this option largely depend on developments in the relationship between oil, gas and coal prices. However, this option does have consequences for the security
Figure 8. Sequestration potential for carbon plantations at different cost levels. The potential is based only on abandoned agricultural land. The total available (technical) potential has been reduced to 40% to account for implementation barriers.
0 1000 2000 3000 4000
Sequestration potential (Mton CO2/year)
0 50 100 150 200 250 Costs (1995 US$/ton CO2) 2010 2025 2050 2075 2100 Carbon sequestration potential
of supply, because Europe becomes dependent on imports of natural gas. The potential is relatively limited: ambitious emission-reduction objectives would replace this option with others that can achieve far greater reductions.
Hydrogen
Combustion of hydrogen in end-use sectors does not produce CO2. Whether or not hydrogen can also contribute to reducing greenhouse gas emissions depends on the way it is produced. Hydrogen can be produced from renewable resources or by using nuclear energy, hence without greenhouse gas emissions or it can be produced from fossil fuels. In the latter case, hydrogen is only a climate-neutral source if the carbon from the fuel is stored, rather than being released into the atmosphere.
Based on costs alone, hydrogen is not expected to play an important role in the energy supply system before the middle of the 21st century.This could, however, happen in the second half of this century, with the transport sector playing a key role in large-scale application. Other factors too, like security of supply or air quality, could encourage the use of hydrogen in the short term. Coal and natural gas (even with CO2 capture) are economically the most attractive raw materials, and are currently also used in commercial hydrogen production in the petrochemical industry. Production from re-newable sources is also possible, but at much higher costs. In short, hydrogen use is not likely to contribute to emission reductions without climate policy as it will then be produced from fossil fuels; with climate policy, it allows for greater flexibility for the energy system to respond more effectively.
Non-CO2 greenhouse gases
- Reducing emissions of non-CO2 greenhouse gases is a good way of keeping costs
down
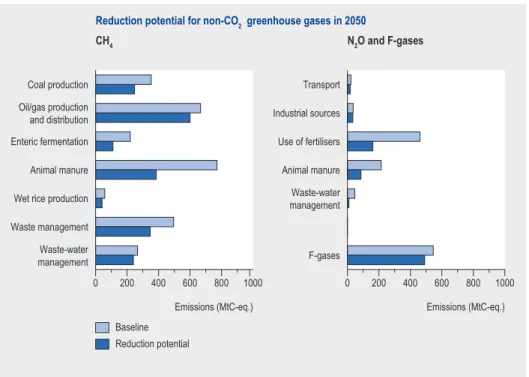
Reducing the emissions of non-CO2 greenhouse gases is a particularly attractive option for the next few decades, since it is less expensive than some CO2-reduction options. Some options are reducing emissions of methane gas from coal mines and gas extrac-tion, landfill waste sites, animal husbandry and rice fields (see Figure 9). Emissions of laughing gas (N2O) could also be significantly reduced.
Besides industrial sources, emissions from non-CO2 greenhouse gases primarily come from the agricultural sector. In total, emissions of non-CO2 greenhouse gases are ex-pected to be around 1000-1500 billion tons CO2-eq. during this century, of which at least 500 billion tons can be prevented. The costs of this option are largely estimated as relatively low (€ 0-50 per ton). using this option would result in the costs (in 2050) being 30-40% lower than without this option.
3 MEASuRES AND COSTS OF EMISSIONS REDuCTION
Sets of policy measures
Chapter 2 shows that a worldwide change of direction is necessary over the next few decades, from an upward emissions trend into a downward trend, in order to achieve low concentrations of greenhouse gasses. The previous section showed that on ba-sis of estimates for individual technologies, there is theoretically sufficient potential available to realise this objective. But how could such technologies be combined in a cost-effective way, how much would this cost, and would there be other advantages or disadvantages? This section discusses these possibilities (without discussing the poli-cies that would be required to implement these measures).
- Currently known technologies have sufficient potential to achieve the reductions
needed for low stabilisation levels
In the past many scientific analyses focused on the opportunities for achieving stabili-sation at 650 and 550 ppm CO2-eq. However, model studies and data from this chapter lead us to conclude that, from an average emissions baseline, stabilisation at 550, 450 ppm and (under certain circumstances) even 400 ppm could be achieved using cur-rently known technologies. Realistic assumptions are made with respect to learning curves of technologies, cost reductions and the implementation of new techniques. New technologies, for example, are not implemented until the old installations have been fully depreciated.
0 200 400 600 800 1000 Emissions (MtC-eq.) Baseline
Reduction potential
CH4
Reduction potential for non-CO2 greenhouse gases in 2050 Coal production
Oil/gas production and distribution Enteric fermentation Animal manure Wet rice production Waste management Waste-water management Transport Industrial sources Use of fertilisers Animal manure Waste-water management F-gases 0 200 400 600 800 1000 Emissions (MtC-eq.) N2O and F-gases
Figure 9. Worldwide potential for reducing non-CO2 greenhouse gases in 2050.
For the the 450 and 400 ppm stabilisation level, it is not possible to develop scena-rios that do not exceed these values temporarily. However, if this period of temporary overshoot is short enough, it results in few extra risks. It is possible to reach the target concentrations shortly after the 21st century.
- A broad portfolio of technologies is required to produce drastic emissions
reducti-ons
The main conclusion from our integrated scenario analyses is that searching for a cost-effective approach to emissions reduction does not lead to any single option, but to broad portfolios of policy options (see Figure 10). This is primarily due to the fact that the potential contribution by each individual option is limited, for technical or other reasons. But there are other causes. Technologies can sometimes only be used in certain areas or sectors. A broad portfolio approach can be detrimental due to the fragmentation of research and development, or through limited scale advantages for individual options. But there are clear advantages too. To ensure resilience in the face
Figure 10. Developing the fuel mix and contribution of reduction options to the energy supply in the 21st century for stabilisation at 450 ppm.
1980 2000 2020 2040 2060 2080 2100 0 200 400 600 800 1000 1200 EJ Nuclear energy Renewables
Bioenergy + capture & storage Gas + capture & storage Oil + capture & storage Coal + capture & storage Bioenergy
Gas Oil Coal
Global energy consumption
Global energy consumption and reduction options for stabilising at 450 ppm
1980 2000 2020 2040 2060 2080 2100 0 20 40 60 80 100 Gt CO2 Carbon sinks Non-CO2 Other Fuel switch Capture & storage Bioenergy
Sun, wind, nuclear energy Energy savings
Emissions ceiling when stabilising at 450 ppm
Contribution by reduction options
3 MEASuRES AND COSTS OF EMISSIONS REDuCTION