BEYOND THE EMISSION GAP
Note
Mark Roelfsema and Detlef van Vuuren (PBL)
Beyond the emission gap
© PBL Netherlands Environmental Assessment Agency The Hague, 2019
PBL publication number: 3744 Corresponding author Mark.roelfsema@pbl.nl Authors
Mark Roelfsema and Detlef van Vuuren Graphics
Allard Warrink
Production coordination PBL Publishers
This document has been prepared by PBL as part of the CD-LINKS project, which has received funding from the European Union’s Horizon 2020 research and innovation programme under grant agreement No. 642147.
This publication can be downloaded from: www.pbl.nl/en. Parts of this publication may be reproduced, providing the source is stated, in the form: Roelfsema, M. et al. (2019), Beyond the emission gap. PBL Netherlands Environmental Assessment Agency, The Hague.
PBL Netherlands Environmental Assessment Agency is the national institute for strategic policy analysis in the fields of the environment, nature and spatial planning. We contribute to improving the quality of political and administrative decision-making by conducting outlook studies, analyses and evaluations in which an integrated approach is considered paramount. Policy relevance is the prime concern in all of our studies. We conduct solicited and
Contents
1
GAP INDICATORS ALLOW FOR COMPARING GLOBAL AMBITION
AND THE IMPACT OF NATIONAL POLICIES
5
2
HOW LARGE ARE THE GLOBAL AND NATIONAL EMISSION GAPS
BETWEEN NATIONALLY DETERMINED CONTRIBUTIONS AND WELL
BELOW 2 °C SCENARIOS?
8
3
DEPLETION OF NATIONAL CARBON BUDGETS
13
4
NEW GAP INDICATORS BEYOND EMISSIONS
16
4.1 Carbon intensity gap 16
4.2 Innovation leading to an increase in zero-carbon technologies 18
4.3 Investments 19
4.4 Climate policy implementation 21
4.5 Synergies with climate policies for deforestation and air pollution 22
Findings
• Information on individual greenhouse gas emissions on national/regional level provides guidance on how to close the gap.
The emission gaps for China, the United States, the European Union and India largely depends on what is considered a fair distribution between countries/regions of the efforts required to stay well below 2 °C global temperature increase. Currently, the main focus of national climate policies is on CO2. Projected non-CO2 emissions that mainly come from
agriculture, are strongly mitigated in the second half of this century.
• With current national policies and nationally determined contributions (NDCs), the carbon budget related to the 2 °C goal will already be depleted around 2035.
Carbon budgets show the cumulative emissions that can still be emitted while staying below 2 °C or 1.5°C temperature increase this century, and are therefore independent of a specific moment in time at which mitigation should be applied. The carbon budget related to the 2 °C goal is 1,000 GtCO2, and is based on the IPCC AR5 report. These budgets can also be applied
at the national level, but this again depends on which effort-sharing approach is used. • Indicators that go beyond greenhouse gas emissions provide insights into how
to close the emission gap.
Such indicators show the necessary steps, in terms of energy use or investments, and provide additional guidance for the transition towards a low-carbon energy system. Also, synergies related to air pollution and deforestation could strengthen climate policies. To close the emission gap, carbon intensity (CO2/GDP) needs to improve much more rapidly than
historical rates, if we are to accomplish the Paris goals, zero-carbon technologies need to develop much faster compared to current policy trends, and low-carbon energy investments need to increase to around 70%, by 2050. Furthermore, air pollution and forest coverage will both benefit significantly if the Paris goals are achieved.
1 Gap indicators allow
for comparing global
ambition and the
impact of national
policies
The UNEP Gap Report shows that current efforts at the national level are insufficient to accomplish the objective of the Paris Agreement. The Paris
Agreement’s objective is to keep global temperature increase to well below 2 °C compared to the pre-industrial period, and if possible, even below 1.5 oC. Obviously, the agreement needs
to be implemented through climate policies at the national scale. Therefore, the Paris
Agreement contains a periodical stock take, which is a process where the combined impact of mitigation at the national level is compared to the global reductions needed to meet the agreed long-term temperature goals. Over the years, the Emissions Gap Reports have shown that reductions in the national policies are not enough to reach the emission levels of the cost-effective pathways towards the Paris temperature goals. The latest publication projected the gap between these levels to be 13 to 29 GtCO2eq by 2030 (UN Environment, 2018). This
shows that successive updates of national policies and the nationally determined
contributions (NDCs) are needed to monitor the progress made towards achieving the target of keeping global temperature increase to well below 2 °C.
More dynamic and comprehensive presentation of the current gap with the Paris objective is needed to support the global stocktake. Therefore, this policy brief presents a collection of gap indicators which are part of the ‘global stocktake’ dynamic web tool. The global stocktaking process in the Paris Agreement forms a key instrument that enables the world to arrange keeping global emissions well below 2 °C by increasing mitigation ambitions in the NDCs. In addition, a technical dialogue will be set up that supports this process through expert consideration of inputs [1]. To this end, scientific input on how current national actions compare to the ambition of the Paris Agreement is required. While the UNEP Gap indicator can contribute to this, it also has some limitations. The indicator is relatively static, both in terms of content as it focuses on emissions instead of the transition process, and in presentation as it is mostly presented at the global level and only for a small selection of scenarios. In this document, we present the global stocktake
dynamic web tool1 that presents different indicators for the world and seven large emitting
economies: China, United States, India, European Union, Russia, Brazil and Japan. This policy brief discusses the main insights from this global stocktaking tool. The aim of this tool is to provide additional guidance for the process of transformational change that is required for achieving the long-term Paris goals. This guidance provides various types of information on both global and country level, about greenhouse gas (GHG) emissions and more elaborate indicators, such as those including energy use, investments, policies, and synergies or co-benefits with other Sustainable Development Goals (SDGs).
Box 1.1: Scenarios in this policy brief
The indicators presented in the stocktaking tool are based on results from the CD-LINKS
project
2, in which policy scenarios are presented that represent different levels of policy
implementation. The scenarios, based on nine integrated assessment models (AIM,
COPPE-COFFEE, DNE21+, IMAGE, GEM-E3, MESSAGE/GLOBIOM, POLES, REMIND/MAgPIE, WITCH)
allow us to explore the consequences of different policy assumptions.
•
The No new policies scenario represents a business-as-usual pathway, and no new
policies are assumed to be implemented after 2010. It represents a
middle-of-the-road scenario, in terms of assumptions on key drivers such as population and
income.
•
The National Policies scenario is based on the ‘No new policies’ scenario, but in
addition it assumes full impact of current implemented policies at the national
level. The list of climate, energy and land-use policies
3for G20 countries in this
scenario is based on a climate policy database
4. Together with national experts, a
large selection was made from this database to include those policies with
expected high impact. The policy cut-off date was 31 December 2016.
•
The NDC scenario assumes full implementation of conditional country emissions,
energy and land-use targets from the Nationally Determined Contributions to the
Paris Agreement.
•
Paris objective scenarios. The global stocktaking tool presents several ‘well below 2
°
C’ scenarios. The
2 °C (high probability) and 2 °C (medium probability) scenarios
represent the objective of keeping global warming below 2 °C with a respective
66% and 50% probability, starting with cost-effective deep reduction measures in
2020. These scenarios are assumed to have a carbon budget of 1,000 and 1,600
1 https://themasites.pbl.nl/global-stocktake-indicators/ 2 http://www.cd-links.org/
3 https://www.cd-links.org/wp-content/uploads/2019/05/input-IAM-protocol_CD_LINKS_July-2017.xlsx 4 http://climatepolicydatabase.org/index.php/CDlinks_policy_inventory
GtCO
2, respectively, for the 2010–2100 period. The
2 °C scenarioin this policy
brief refers to the 2 °C (high probability) scenario. The
2 °C delay scenario assumes
implementation of NDCs up to 2030 and a delayed implementation of cost-effective
deep reduction measures to stay below 2 °C with a probability of 66% (1,000 CO
2budget). Finally, the
1.5 °C scenario assumes cost-effective deep reduction
measures in line with the 1.5 °C temperature limit, which translates into 400 GtCO
2,
over the period from 2010 to 2100. There is no explicit scenario for the
‘well below
2 °C’ goal, but we present ranges for this based on the 2 °C and 1.5 °C scenarios.
•
Historical data is taken from PRIMAP [2] for emissions excluding those from bunker
fuel, EDGAR [3] for bunker-fuel emissions, GDP from OECD [4], and UN World
Population Prospects [5] for population.
In the CD-LINKS scenarios, it is assumed that climate policies are implemented where this is
most cost-effective (after 2020 or 2030), independent of geographical location. But this
might not be in line with the equity principle included in the UNFCCC declaration, and
repeated in the Paris Agreement, saying that countries will respond based on common but
differentiated responsibilities and respective capabilities, in the light of different national
circumstances. Therefore we present a number of scenarios that are based on different
equity principles, which were implemented in the IMAGE model [6].
•
The ‘per capita convergence’ (PCC) approach assumes that, by 2050, emissions per
person will have converged to the same level.
•
Grandfathering (GF) assumes greenhouse gas emission levels in proportion to
current levels.
•
The ‘equal cumulative per capita emissions’ (ECPC) approach takes into account
historical emissions, discount factors and population shares.
•
The ‘ability to pay’ (AP) makes use of the average GDP per capita, between 2011
and 2050. GDP is expressed in terms of Market Exchange Rates (MER).
•
The ‘immediate equal per capita’ (IEPC) approach allocates emission allowances
immediately in proportion to population shares.
2
How large are the global
and national emission gaps
between Nationally
Determined Contributions
and well below 2 °C
scenarios?
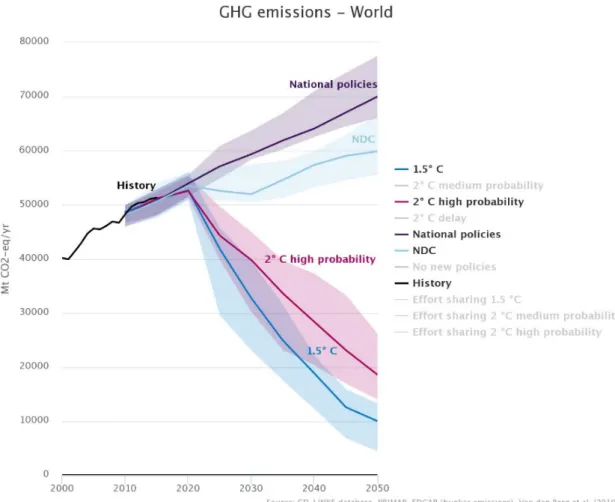
The global emission gap indicator compares the projected emission levels after implementation of cost-optimal measures to achieve the Paris Agreement goals with those after implementation of the NDCs. For a maximum temperature increase of 2 °C, the global gap is 16.5 GtCO2eq, and for 1.5 °C this is 21.1 GtCO2eq for that
of 1.5 °C (Figure 1). The emission gap is defined as the difference between the projected global emission level resulting from implementation of all conditional NDCs, and the level based on a cost-optimal implementation of the well below 2 °C limit this century (with high probability). The results are based on the median of nine model results that were included in our analysis (Box 1), and are comparable with the estimate from the Emissions Gap Report, which is 13 GtCO2eq for the 2 °C scenario, and 29 MtCO2eq for the 1.5 °C scenario [7].
Moreover, the uncertainty represented by the 10–90 percentile model results range, is between 6.4 GtCO2eq and 21.0 GtCO2eq corresponding to the 2 °C scenario, and 12.2 to
31.6 GtCO2eq to the 1.5 °C scenario. But, it is important to note that the gap is larger if we
would look at the estimated impact of current national policies, as there is still an implementation gap with NDCs of 3.5 GtCO2eq by 2030 (Figure 1).
Figure 1 The global emission gap between NDCs and well below 2 °C scenarios
between now and 2050
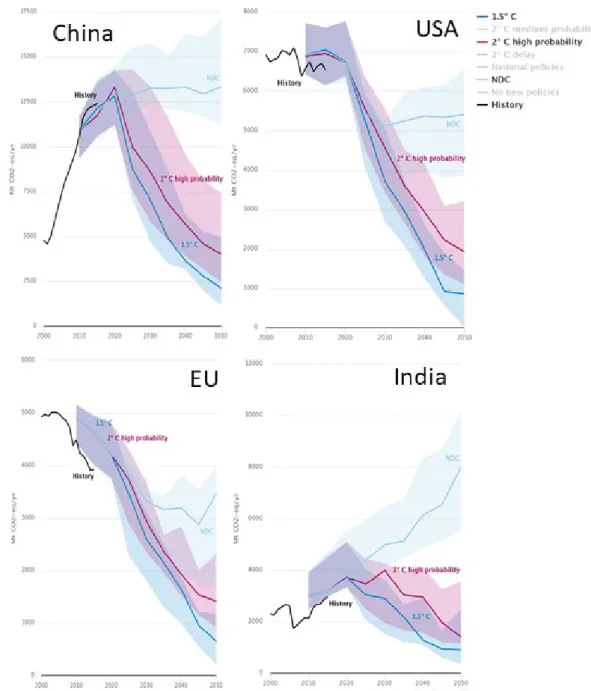
It is also possible to present the emission gap indicators on a national scale. For the four largest emitting economies, the median emission gaps by 2030 between the two well below 2 °C scenarios (assuming cost-optimal implementation of climate policy) is 5.0 to 7.0 GtCO2eq for China, 0.35 to 0.85 GtCO2eq for the United
States, 0.06 to 0.65 GtCO2eq for the European Union and 1.7 to 2.4 GtCO2eq for
India (Figure 2). Although the global stocktake as secured in the Paris Agreement only assesses the collective progress towards achieving the long-term Paris goals [8], insight in the progress per country is essential, as climate policies are implemented at the national level. This is presented in the global stocktaking tool, showing that, with policies
implemented until 2017, there are no large emitting economies for which current policies would be consistent with cost-optimal pathways to achieve the Paris targets. Evaluation of the gaps on a country level is more complex than on the global level, as the cost-optimal approach does not necessarily align with what would be considered a fair effort for each individual country. The Paris Agreement and the Katowice rule book required each country to include a statement on what they would consider a fair contribution in their NDC updates, in the light of their national circumstances [1]. In low-income countries, cost-optimal
approaches typically lead to a higher cost ratio, compared to GDP. However, these costs do not necessarily need to be financed domestically.
Figure 2 The emission gaps between NDCs and well below 2 °C scenarios for China,
United States, European Union and India, between now and 2050
Alternative views of a fair distribution to countries of global emission reductions to reach the Paris goals are illustrated with effort-sharing calculations. Considering the effort-sharing approaches (Box 2) in Van den Bergh et al. [6], the emission gaps with the 2 °C scenario, by 2030, could increase by 1.0 to 3.8 GtCO2eq for China, decrease by 1.7 or
increase by 2.2 GtCO2eq for the United States, decrease by 1.4 or increase by 0.4 GtCO2eq
for the European Union, and decrease by 3.9 or increase by 0.1 GtCO2eq for India. From this
follows that the ‘grandfathering’ effort approach, which allocates future emissions based on current emissions, shares results in high emission allowances for the United States and
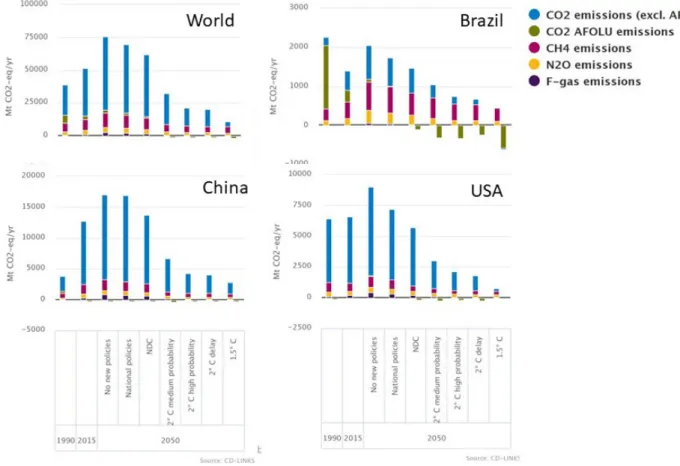
European Union, while this is the ‘ability to pay’ (allocation based on GDP per capita) approach for China, and ‘immediate per capita convergence’ approach for India. Focusing only on CO2, the global emission gap by 2030 will be 12.5 to 16.9
GtCO2eq; 4.1 to 4.8 GtCO2eq for China, and 0.2 to 0.65 GtCO2eqfor the United
States. Furthermore, the global non-CO2 emission gap by 2030 will be 3.2 to 4.5
GtCO2eq; 1.1 to 1.3 GtCO2eq for China and 0.07 to 0.2 GtCO2eq for the United States (Figure 3). Information on the individual gases in total greenhouse gas emissions provides additional guidance for policy design to align with well below 2 °C scenarios. The current focus of climate policy in most countries is mainly on CO2 mitigation, except in countries with
a dominant agricultural sector, such as Brazil (Figure 3). As a result, the median global share of CO2 emissions in 2015 was almost 75%, and this will decrease to 60% by 2050, under the
2 °C scenario, and to almost 25% under the 1.5 °C scenario. The mitigation strategies under these well below 2 °C scenarios often rely on carbon dioxide removal combined with large-scale application of bioenergy leading to negative emissions, but alternatives are also available [9].
Figure 3 Greenhouse gas emissions by 2050, under various scenarios, for the world as
a whole, Brazil, China and the United States, compared with historical levels
(1990–2015)
When considering non-CO2 emissions, the agricultural sector is a particularly large source of
methane (CH4) and nitrous oxide (N2O). A large part of the mitigation under the well below 2
°C scenarios is projected to take place in the second half of this century. This is illustrated by the average share of methane emissions, which increases from 14% in 2015 to almost 25% by 2050, under the 2 °C scenario, and to over 40% under the 1.5 °C scenario. Furthermore, the average global share of N2O emissions is smaller than that of CH4 and increases from
4.5% in 2015 to 11% by 2050, under the 2 °C scenario, and to 21.5% under the 1.5 °C scenario.
3 Depletion of national
carbon budgets
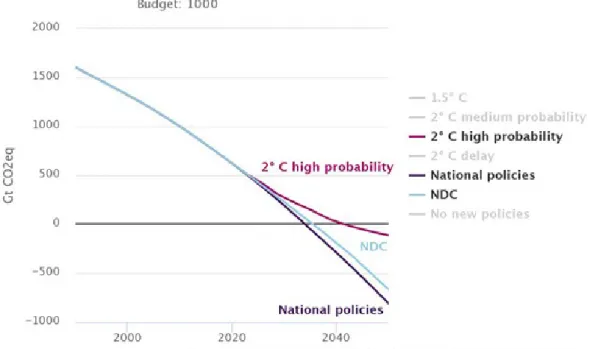
Under the well below 2 °C scenarios, the national policies and NDCs will cause exceedance of the available carbon budget already by around 2035. Carbon budgets represent the total amount of allowed CO2 emissions over time given specific policy goals
such as NDCs or those that represent a global effort to stay below the 2 °C or 1.5 °C temperature targets within this century. The strength of the budget concept is its
independence of a specific moment in time at which CO2 mitigation applies, the emphasis on
short-term mitigation, but also the message that CO2 emissions need to go to zero at some
point in time [10]. The carbon budget linked to the 2 °C temperature limit (with 66% probability of staying below this level) for the 2011–2100 period is assumed to be 1,000 Gt, while this is 400 GtCO2 under the 1.5 °C scenario (IPCC [11] and Luderer, et al. [12]). Even
under the cost-optimal scenarios consistent with achieving the Paris goals, carbon budgets linked to well below 2 °C temperature limits will already become depleted in the first half of the century, as this is compensated by negative emissions in the second half of the century. However, the scope for negative emissions is clearly limited (e.g. by the available land). Above all, the scenarios based on current policies and NDCs do exceed the budgets much earlier, i.e. already by 2035 or 2036. Under the 1.5 °C scenario, depletion would occur already within a few years, based on a carbon budget of 400 Gt between 2011 and 2100.
Figure 4 Depletion of the global carbon budget, under national policies, NDCs, and 2
°C scenarios
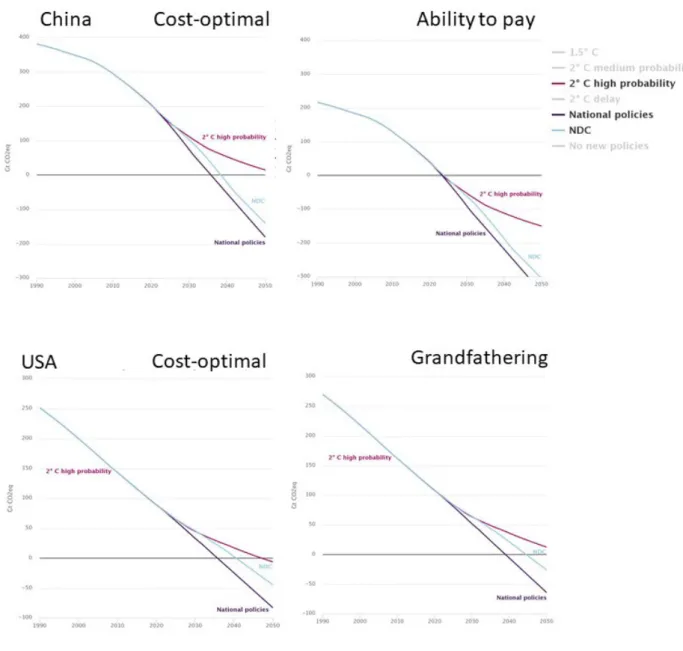
The carbon budget approach can also be applied on a national level. If the four largest emitting economies would only implement NDCs, they are expected to exceed their national carbon budgets that are linked to the 2 °C temperature limit, around 2040. Calculating the carbon budgets per country requires distribution of the global budget over the various countries, for which different approaches are possible. One way of doing so is based on the cost-optimal scenarios. However, there are also alternatives that are based on effort-sharing (Box 1), and the resulting allocations can be very different in size. For the United States, European Union, China and India, the budgets in line with the 2 °C target are expected to be exceeded between 2040 and 2050, under the cost-optimal 2 °C scenario (Figure 5). Interestingly, for every country and region considered in this policy brief, there is an effort-sharing approach that would result in budget depletion not until after 2050, while in many cases, the strictest equity principle would already have led to depletion before today. In the case of allocation based on cost-optimal policy implementation, China will not deplete the carbon budget that is consistent with the 2 °C scenario before 2050 (Figure 5). However, the budget would already be depleted just before 2030 under the ‘ability to pay’ principle (based on median estimates). In contrast, the ‘grandfathering’ equity principle would keep the United States from depleting its carbon budget before 2050, while under the ‘equal cumulative per capita’ principle, the United States would already have depleted the budget before the year 2000.
Figure 5 Depletion of the carbon budget for China and the United States, under the
NDC and 2 °C scenarios (median estimates)
4
New gap indicators beyond
emissions
Although a breakdown of greenhouse gas emissions and gap indicators already improve insights into how to close the emission gap, indicators in terms of carbon intensity, zero-carbon technologies, investments and climate policy coverage give more guidance on how to transition to a low-carbon energy system. Also, showing the co-benefits of climate policy for deforestation and air pollution could help in increasing support to take measures.
4.1 Carbon intensity gap
Comparison of carbon intensity with historical values gives an indication of the effort that is required in the future to stay well below 2 °C. It will have to improve faster than historical rates to accomplish the Paris goals. Carbon intensity is defined as the amount of CO2 (excl. AFOLU) emissions per economic activity (gross domestic product
(GDP)). GDP is measured in terms of purchasing power parity (PPP), USD2010. Carbon
intensity is determined by the energy efficiency of a country’s economic structure
(energy/GDP) and the fuel mix (CO2/energy). It illustrates the feasibility of ambitious climate
policy, independent of certain reference scenarios. However, comparison with historical levels gives an impression of the effort required. Therefore, we consider annual carbon intensity improvement, which is defined as the percentage year by year change in carbon intensity. To stay in line with cost-optimal well below 2 °C scenarios, China will need to double the carbon intensity improvement (Figure 6) by 2030 relative to the 2010–2015 period (median value). This is the same for the United States, while it reaches very high levels by 2050, under the 1.5 °C scenario, due to implementation of negative emission technologies. For the European Union, improvement will need to increase by 20% to 50% by 2030. In India, carbon intensity improvement was low, over the 2005–2015 period, and is projected to increase to between 6% and 8%, annually, by 2030, in well below 2 °C scenarios.
Figure 6 Carbon intensity (CO
2excluding AFOLU per USD
2010GDP (purchasing
power parity)) for China, United States, European Union and India
The carbon intensity improvement of the United States of America and the European Union by 2030 under the NDC scenario, approaches that of the 2° C scenario. But is depends on the continuation of the intended withdrawal by the United States of America and enhancement of current policy implementation, as with policies implemented until 2017, these countries do not achieve the pledged NDC levels yet.
Although countries have already implemented renewable electricity policies and demand side efficiency policies that improve the carbon intensity, additional
policies before 2030 are necessary to stay on track to meet the Paris goals. Between 1990 and 2015, the carbon intensity in China improved by almost 6.5%, annually, especially due to implementation of renewable and energy efficiency policies, and the development of the service sector in the last few years. However, to stay in line with the cost-optimal well below 2 °C scenarios, China will need to increase the improvement by a factor two to three (Figure 6) relative to the 2010–2015 period. For the United States, an annual decrease in carbon intensity of almost 3% between 2005 and 2015 was the result of decreasing CO2
emissions due to switching from coal to gas, installation of wind power, reduced electricity use in the industry sector, and efficiency improvements in the transport sector [13]. In the 2 °C scenario, this will need to increase by a factor 2 by 2030, a factor 3 by 2050, and to very high levels in the 1.5 °C scenario due to the implementation of negative emission
technologies. The EU carbon intensity already started to improve in 1990, due to the decrease in coal consumption in former Eastern European countries, and, in later years, because renewable power was installed in most countries [14]. This was the result of steep renewable cost decreases, and policies such as the EU Renewable Energy directive. Under well below 2 °C scenarios, the historical carbon-intensity improvement levels will need to increase by 20% to 50%, by around 2030, relative to the 2005–2015 period, and by a factor of 3 to 8, under a 1.5 °C scenario. In India, carbon intensity has been improving since the end of the 1990s, which resulted in around 1.5% annual improvement over the past 15 years. India’s NDC includes a pledged carbon intensity reduction of 33% to 35%, over the period from 2005 to 2030, which is supported by the Perform, Achieve, Trade (PAT) scheme that targets power plants and large energy-intensive enterprises. Cost-optimal well below 2 °C scenarios require India to increase its carbon intensity to levels of 6% to 8% by 2030, and 10% to 20% by 2050.
4.2 Innovation leading to an increase in zero-carbon technologies
As full decarbonisation of the energy system is needed, investment in zero-carbon technologies now directly leads to achieving that goal. Therefore, the share of such technologies is used here as indicator of the required level of innovation. Under the NDC and national policies scenario, progress in moving towards zero-carbon
options is insufficient. The zero-carbon indicators are defined as the percentage of implemented zero-carbon technologies (renewable, nuclear and fossil with CCS) for each sector, in terms of final energy, and specify the required implementation level in well below 2 °C scenarios. Many studies show that innovative technologies already exist that could play an important part in the decarbonisation of the energy system. The proof lies in the
implementation, showing whether current small projects can be scaled up. According to IRENA [15], especially in the electricity sector, wind and solar power costs have already decreased significantly, and are now competitive with conventional sources in some countries. But, for example, competitiveness of innovative technologies in the freight transport and aviation sector still need to increase significantly.
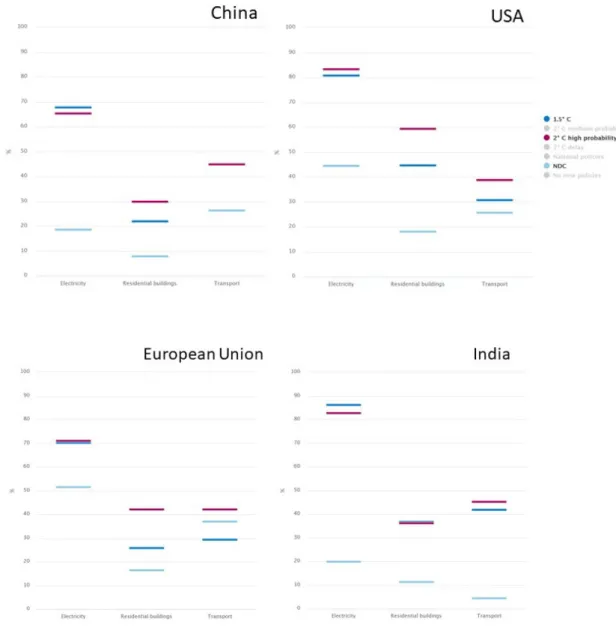
The innovation indicators were calculated with the IMAGE model [16] only. Under the NDC scenario, implementation efforts in the electricity sector up to 2050 are expected to result in 20% for China and 45% for the United States, 50% for the European Union, and 20% for India. The result is a global zero-carbon electricity gap by 2050 between the NDC and the cost-optimal well below 2 °C scenarios of 46.5 to 49 percentage points for China, 36 to 39 percentage points for the United States, 18.5 to 19.5 percentage points for the European Union, and 63 to 66 percentage points for India (Figure 7). On a global level these are 35 to 38.5 percentage points. For 2030, these gaps are much smaller. The sector mitigation
potential varies between regions due to differences in development stage, energy system design and economic structure.
Figure 7 Share of zero-carbon technologies (renewable, nuclear and fossil with carbon
capture and storage) by 2050, for China and the United States
The zero-carbon share in the residential and transport sectors of both China and the United States is larger under the 2 °C scenario than under the 1.5 °C scenario, as modern biomass shifts to the electricity sector to realise negative emissions.
4.3 Investments
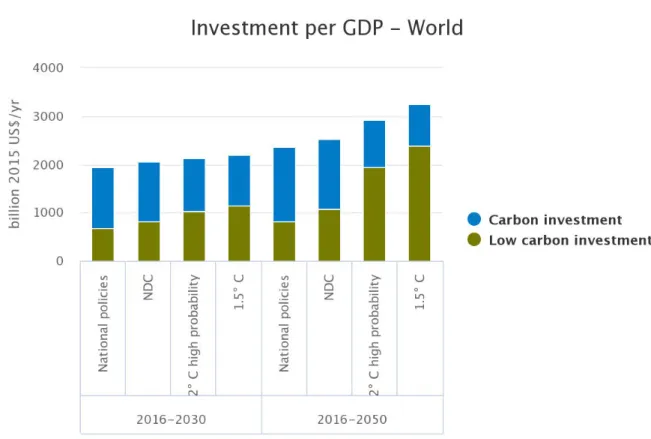
On a global level, the total annual energy investment for cost-optimal
implementation of the Paris Agreement will be about USD2015 60 to 130 billion
2016–2050 period, this will be USD 400 to 700 billion (Figure 8). The investment gap shows by how much the finances would need to be scaled up relative to NDC implementation (for staying well below 2 °C). Low-carbon investments in the energy supply and demand sectors are key to achieving the Paris targets, and therefore insights into the scale and timing is of great importance [17]. These investments include supply-side investments into renewable electricity production and conversion, nuclear, fossil with CCS, and the proportion of electricity transmission and distribution and storage investments that can be attributed to low carbon electricity generation [17]. On a global level, total annual energy investment, under well below 2 °C scenarios (with high probability), will increase by 3% to 4% up to 2030, and by 15% to 30% up to 2050, compared to under the NDC scenario. Not only will the total investment increase, but so will the global average share of low-carbon energy investments — to 45% under the NDC scenario and to around 70% under the well below 2 °C scenarios. Furthermore, investment timing changes under a well below 2 °C, as these are mostly up-front for renewable technologies, and entail relatively lower operational and maintenance costs. In a world that is on track to achieve the well below 2 °C goal, low-carbon energy investments need to overtake those in fossil energy no later than by 2025 [17].
Figure 8 Average annual global energy investments in the national policies, NDC and
well below 2C scenarios for the periods 2016 to 2030 and 2016 to 2050
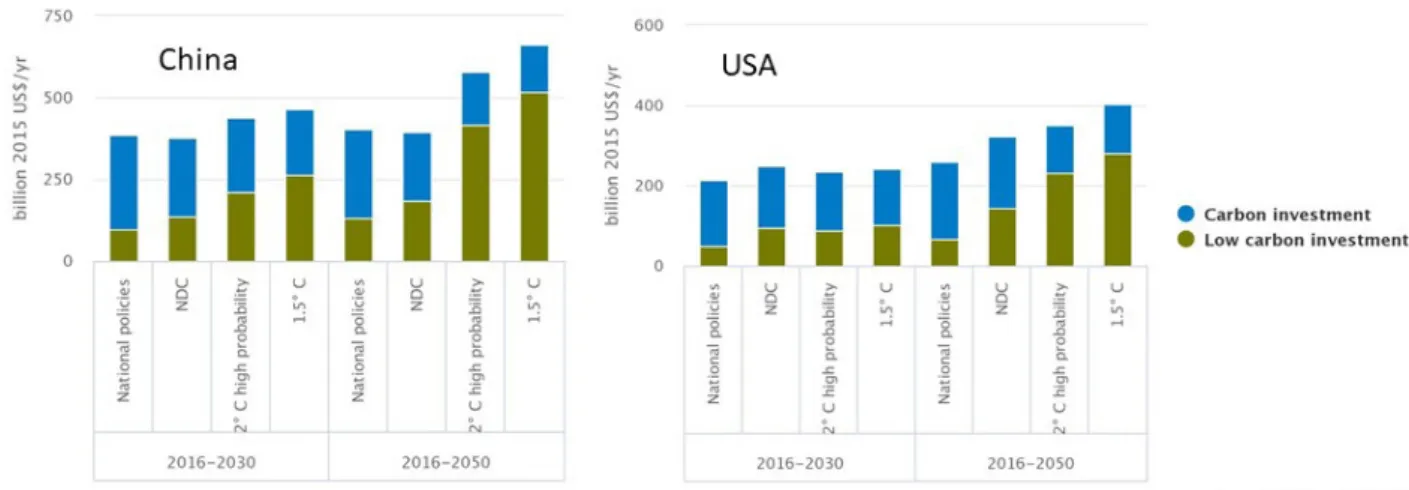
Investments in the period until 2050 increase in all countries in order to meet the Paris Agreement. Total annual investment costs under the NDC scenario are similar to
those under the national policies scenario, but include more low carbon investments. The cost-optimal well below 2 °C scenarios for China show a significant increase in low-carbon investments, compared to the NDC scenario. As a result, the annual low-carbon investment gap is USD 50 to 110 billion, for the period from 2016 to 2030, and USD 170 to 280 billion, for the 2016–2050 period (Figure 9). The investment level over the period from 2016 to 2030 induced by the US NDC is expected to be close to that under the cost-optimal well below 2 °C scenarios, although this does not imply that the energy mix is the same. Over the period from 2016 to 2050, the annual low-carbon investments under the well below 2 °C scenarios are expected to increase by 60% to 100%. As a result, the annual low-carbon investment gap is USD 105 to 170 billion, for the period from 2016 to 2050.
Figure 9 Average annual energy investments in national policies, NDCs and well below
2 °C scenarios, for China and the United States (median estimates), for the 2016–
2030 and 2016–2050 periods.
4.4 Climate policy implementation
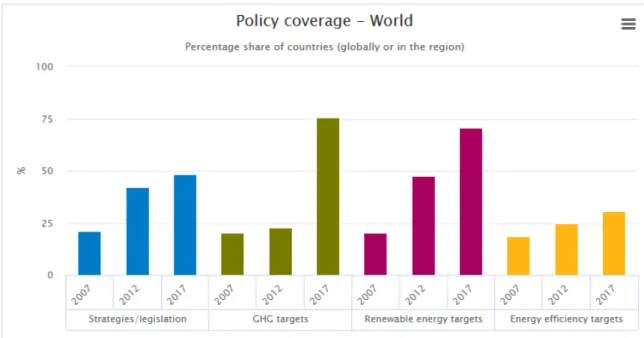
The implementation of climate policies has increased, in terms of number of countries, population and greenhouse gas emissions, in all regions and globally, but is inconsistent with the objectives of the Paris Agreement. Global climate change governance has changed substantially, over the last decade [18]. Countries have
implemented various types of policies, such as national legislation, greenhouse gas emission targets, renewable energy and energy efficiency targets. The fact that climate policies are implemented in more countries and sectors is certainly one of the preconditions for closing the emission gap, but it does not say anything about their stringency.
Figure 10 Implemented climate policies around the world (%), for 2007, 2012 and 2017
Moreover, the international climate negotiations processes play an important role in
incentivizing countries for climate action, which is visible from the strong increase in climate policies around the Copenhagen Climate Conference in 2009, and the Paris Agreement in 2015 (Figure 10). Note that, policy instruments, such as emission trading systems, feed-in tariffs or fuel efficiency standards, need to be implemented to achieve these targets.
4.5 Synergies with climate policies for deforestation and air pollution
Current policies and NDCs do not capture the possible synergies for air pollution and deforestation offered by climate mitigation. Climate change is related to many other sustainability issues, which are reflected in the 17 global Sustainable Development Goals (SDGs). Climate action is one of them, but there are also others that relate to this subject, such as ‘Good health and well-being’ (SDG 3) and ‘Life on land’ (SDG 15). Moreover, implementation of climate policies can have co-benefits for air pollution and deforestation, and these benefits are shown to increase with the stringency level of climate policy.
Figure 11 Global impact of climate policy on air pollution (black carbon, and sulphur
emissions (Mt/yr).
Figure 12 Global impact of climate policy on deforestation (hectares forest land).
Well below 2 °C scenarios illustrate that air pollutions emissions are significantly lower compared to those with NDC implementation. SDG 3 is related to air pollution and is closely linked to climate change, as fossil fuel combustion is a major driver of both. Air pollution is responsible for many deaths each year, caused for a large part by PM2.5
(particulate matter), ozone and NOx emissions [19]. Black carbon (BC) and Organic carbon
(OC) are a major component of PM2.5. In addition, also sulphur dioxide (SO2) has an impact
on human health, especially leading to lung problems. Policies aimed to reduce short-lived climate forcers (SLFC), such as BC and SO2, are complementary rather than substitutes for
policies that reduce greenhouse gas emissions, which shows that carefully looking at the various relationships is important [20]. Under the well below 2 °C scenarios, global black carbon (BC) emissions need to be 7.5% to 13% lower, OC emissions 8.5% to 14% lower and
sulphur emissions 22.5% to 27.5% lower, compared to under the NDC scenario (Figure 11Error! Reference source not found.).
Deforestation also decreases, under well below 2 °C scenarios, compared with the NDC scenario. SDG 15 is about conservation of forests and restoration of degraded land. As forests are large carbon stocks, avoiding deforestation results in CO2 mitigation. The other
way round, climate policy implementation can contribute to reducing deforestation, thus preserving forests as a natural habitat and source of biodiversity. As a results, under these scenarios, forest cover will increase by 4% to 6%, by 2030, relative to the NDC scenario, and by around 15% by 2050 (Figure 12Error! Reference source not found.).