TRACKING CLIMATE POLICY
PROGRESS
Analysing the effect of current climate policies on the
drivers of CO
2emissions of 12 major emitting
economies
Note
Robin van der Bles, Heleen van Soest and Michel den Elzen
Tracking Climate Policy Progress
Analysing the effect of current climate policies on the drivers of CO2 emissions of
12 major emitting economies
© PBL Netherlands Environmental Assessment Agency The Hague, 2020
PBL publication number: 4101
Corresponding author
Heleen.vansoest@pbl.nl
Authors
Robin van der Bles (Rijkstrainee) Heleen van Soest (PBL)
Michel den Elzen (PBL)
Production coordination
PBL Publishers
Remark:
This study is the result of a Government traineeship conducted at PBL in 2019.
This publication can be downloaded from: www.pbl.nl/en. Parts of this publication may be reproduced, providing the source is stated, in the form: van der Bles R. et al. (2020), Tracking Climate Policy Progress: Analysing the effect of current climate policies on the drivers of CO2 emissions of 12 major emitting economies. PBL Netherlands Environmental Assessment Agency, The Hague.
PBL Netherlands Environmental Assessment Agency is the national institute for strategic policy analysis in the fields of the environment, nature and spatial planning. We contribute to improving the quality of political and administrative decision-making by conducting outlook studies, analyses and evaluations in which an integrated approach is considered paramount. Policy relevance is the prime concern in all of our studies. We conduct solicited and
Contents
MAIN FINDINGS
4
1
INTRODUCTION
6
1.1 Background 6 1.2 Objectives 7 1.3 Quantitative analysis 8 1.4 Scope 92
METHODOLOGY
10
2.1 General 10 2.2 Historical data 10 2.3 Projections 13 2.4 Targets 153
COUNTRY PROFILES
19
3.1 Argentina 19 3.2 Australia 22 3.3 Brazil 25 3.4 Canada 29 3.5 China 33 3.6 European Union 37 3.7 India 41 3.8 Indonesia 45 3.9 Japan 49 3.10 Kazakhstan 53 3.11 Russia 56 3.12 United States 604
OVERVIEW
63
REFERENCES
65
APPENDIX A: DATA
73
APPENDIX B: TARGETS
76
APPENDIX C: COUNTRY PROFILES – BACKGROUND INFORMATION 103
C.1 Argentina 103 C.2 Australia 105 C.3 Brazil 107 C.4 Canada 108 C.5 China 110 C.6 European Union 112 C.7 India 114 C.8 Indonesia 116 C.9 Japan 118 C.10 Kazakhstan 120 C.11 Russia 122 C.12 United States 123
Main Findings
This research investigates the progress of current mitigation actions undertaken by major emitting economies worldwide. It provides an in-depth analysis of the projected impact of currently implemented policies and compares this to the targets set by the countries in their Nationally Determined Contributions (NDCs). This research shows the effect of climate policies on indicators beyond emissions, thereby presenting a more elaborate check of progress toward meeting climate targets in twelve major emitting economies: Argentina, Australia, Brazil, Canada, China, the European Union, India, Indonesia, Japan, Kazakhstan, Russia and the United States. It should be noted that this research does not discuss the level of ambition of such actions and targets.
For this research, a methodology was developed that builds further on Kuramochi et al. (2018) and earlier editions. These authors produce yearly country profiles with an analysis of current climate policies and mitigation commitments, focusing on the projected emissions of countries as compared to countries’ emission reduction targets. New about this research methodology is that it considers the drivers of these emissions projections. Inspired by the fundamental ‘Kaya-identity’, four indicators were established, which are products of total CO2-emissions. For these four plus two additional indicators, we show the development for the 12 countries between 1971 and 2015, using historical data, and between 2015 and 2035, using current policy projections of two Integrated Assessment Models (IAMs) (IMAGE & POLES), based on implemented policies until mid-2018.
The report presents the historical development paths and the projections under currently implemented policies for the six indicators, for the twelve individual countries. For each indicator, we also present national targets, if they are available, so that the current policies projections and targets can be compared. However, as countries have formulated their targets on energy and climate change using different definitions, this research ‘universalized’ the targets, meaning targets were recalculated (translated) to the same indicator definition. In the remainder, these translated domestic targets will be referred to as ‘universalized targets’. Thus, this research enables a comparison between countries’ climate policy actions and their domestic targets, and a comparison of developments between different countries, with the aim to provide additional insights into the countries’ current climate policy progress.
Kuramochi et al. (2018) already found that countries have made progress toward their 2020 pledges and 2030 NDC targets to varying degrees. This report finds that countries’ level of progress regarding their targets on the driving factors of these emissions (the six indicators) is also quite diverse. Four out of the twelve analysed countries (China, India, Japan and the Russian Federation) are on track to meet their 2030 pledges with implemented policies and are projected to meet most of the indicator targets, which means that most of the analysed countries are not on track. More specifically:
- For energy intensity (final energy consumption per GDP), four out of six countries or regions for which we were able to find or derive national targets are on track to meet their targets for 2020 or 2030 with current policies (China, Japan, Kazakhstan and Russia). One country is not on track to meet its target for 2030 (Australia), and one region is on track to meet its target for 2020, but progress towards the 2030 target is uncertain (EU).
- For the final energy consumption per capita, two out of three countries or regions are on track to meet their national targets for 2020 or 2030 (China and Japan), and one is not on track (EU).
- For the share of fossil fuels and traditional biomass in final energy consumption, one out of four countries is on track (Indonesia).
- For the share of renewables in total electricity generation, seven out of eight countries are on track to meet their targets for 2020, 2025 or 2030 (Argentina, Australia, Brazil, China, India, Japan, and Russia), and one country is on track for 2020, but not for 2030 (Kazakhstan).
-
For the CO2 intensity of fossil fuels (fossil fuel and traditional biomass CO2 emissions per final energy consumption), two out of twelve countries are on track to meet both their 2020 and 2030 targets (India and Russia), two are on track to meet only their 2020 targets (Brazil and EU), seven are not on track, and for one country, progress is uncertain (China).Regarding the findings of this study, a country being on track to meet its target does not necessarily mean that it is undertaking more stringent action on mitigation than a country that is not on track. We identified one main reason for this. The NDCs differ in their ambition levels. A country that is not on track to meet its target may have set itself a very ambitious target and a country being on track to meet its target may indicate that it set a relatively unambitious target. The Paris Agreement demands participating regions to set their own targets in their submissions, reflecting ‘the highest possible ambition’ (Article 4 of the Paris Agreement). This study does not assess the level of ambition and fairness of the targets; a number of recent studies assessed them in the light of equity principles (such as Höhne et al., 2018; van den Berg et al., 2019).
However, it is useful to keep tracking the individual progress of countries, as compared to their own targets, which is the main focus here. For each of the countries, a country profile was produced, which provides an in-depth interpretation of the developments of the six indicators and the policy environment and attitude toward climate change. This should lead to a broad insight into the progress of countries towards achieving the mitigation
components of the 2025/2030 targets (NDCs and INDCs) presented in the context of the Paris Agreement. The added value of the methodology developed here is that it provides deeper insight into progress of countries on indicators they can directly affect with climate and energy policy, going beyond total greenhouse gas emissions, presented in a way that allows a comparison between countries.
It should be noted that the current policy scenario projections presented in this study were based on Kuramochi et al. (2018), which only account for existing policies through 2018. The 2019 update (Kuramochi et al., 2019) takes into account policy developments since the 2018 report, and shows that some countries and regions, i.e. Argentina, the EU, and Japan are now projected to meet their NDC targets. This also implies that their projections for some energy indicators may now meet their national targets.
1 Introduction
1.1 Background
Climate change is a complex environmental, social and political phenomenon, for which response strategies are difficult to formulate. Nonetheless, at the 21st Conference of the Parties (COP21) of the United Nations Framework Convention on Climate Change (UNFCCC) in December 2015, representatives of 196 Parties to the convention adopted the Paris Agreement to hold the increase in global average temperature to well below 2 °C above pre-industrial levels and pursue efforts to limit the temperature increase to 1.5 °C above pre-industrial levels. In the lead-up to COP21, countries were asked to put forward proposals to reduce their greenhouse gas (GHG) emissions; these are the so-called ‘intended nationally determined contributions (INDCs). Nearly 190 countries submitted their INDCs before the COP21, which turned into NDCs upon ratification of the agreement.
Based on this information, one may expect that nationally determined climate targets and actions would be aligned with the intentions expressed in the Paris Agreement. At least, one would expect that governments that ratified the agreement would plan to do so. However, research shows that both the aggregated impact of the full implementation of targets and current policies is expected to be insufficient to limit global average temperature increase below either 2 °C or 1.5 °C (Rogelj et al., 2016). Further, many countries are expected to not achieve their NDCs, unless they implement additional policies (Kuramochi et al., 2018; den Elzen et al, 2019). The G20 countries collectively are not on track for meeting the unconditional NDCs, with about half of G20 countries’ GHG emissions trajectories individually falling short of achieving their unconditional NDCs, also known as the ‘implementation gap’ (den Elzen et al., 2019). Recently, the urgency for enhanced climate action has become even more evident. This is mostly the effect of the IPCC 1.5 °C special report. The report shows that global CO2 emissions need to reach net zero by around 2050, in order to limit warming to 1.5 °C with no or limited overshoot (IPCC, 2018).
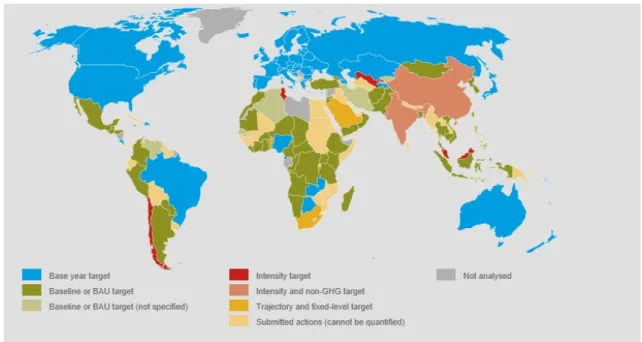
To meet the climate goal, the Parties to the Paris Agreement need to update their NDCs regularly: each five years they have to submit new NDCs with a new or updated pledge. These submissions should reflect ‘the highest possible ambition’ (Article 4 of the Paris Agreement), preferably being more ambitious than the previous submission, as the aim is to “ratchet up” ambitions. Still, there is no obligation to do so. Every country can define its own mitigation target. The effect of this large degree of freedom is that a broad range of mitigation targets types exist: from rather quantitative to relatively qualitative ones1. Some targets aim to reduce emissions relative to base years, but there are also fixed-level targets, baseline scenario targets, intensity targets, and trajectory targets (Fransen et al., 2017; den Elzen et al., 2016)2. The different types of targets per country are shown in Figure 1.
1 Nachmany and Mangan (2018) argue that ‘measurable’ and therefore quantified national targets are
Figure 1. Overview of the several types of mitigation targets of NDCs, www.pbl.nl/indc (obtained from PBL, 2019)
However, countries do not solely express their targets in their NDCs. Countries have also set targets in their national energy and climate policies, which are not always communicated to an international audience, or in other official documents submitted by countries to the UNFCCC (e.g. national communications, biennial reports and biennial update reports). These targets that are expressed solely in the national policies are not always targets on emission reductions but could also be on the drivers of emission reduction. For instance, a target on the share of renewables in the country´s power mix or a cap on the total energy demand in a specific year. These targets could be set for the economy as a whole, but they could also be sector-specific. There are differences in the degree of ‘embeddedness’ of these targets: some targets have been adopted in legislative decisions, executive orders, or their
equivalent, while some targets are publicly announced plans or strategies by a Minister or Secretary of State3.
1.2 Objectives
This research focuses on the progress of current mitigation actions being undertaken by major emitting economies worldwide. Therefore, this research does not discuss the level of ambition of such actions and targets (see for example Höhne et al., 2018), but instead provides an in-depth analysis of the projected impact of currently implemented policies as compared to the targets that have been set by the countries themselves. This research shows the effect of climate policies on indicators beyond emissions, thereby presenting a more elaborate check of progress toward meeting climate targets in twelve major emitting economies, i.e.: Argentina, Australia, Brazil, Canada, China, the European Union, India, Indonesia, Japan, Kazakhstan, Russia and the United States.
Every year, NewClimate Institute, PBL Netherlands Environmental Assessment Agency and IIASA present an up-to-date assessment of progress by 25 countries toward the
achievement of the mitigation components of the 2025/2030 targets of the (I)NDCs (from
now on referred to as Kuramochi et al., 2018). However, they restrict themselves to the projected emission reductions under current policy scenarios4. The report does not provide an in-depth overview of the drivers of these emission reductions and which (sub)targets have been set with respect to these underlying drivers. The aim of this research is to present high-level decarbonisation indicators to enhance understanding of the progress of 12
countries toward their NDCs and national energy and climate policy targets. This is done by examining development in six indicators.
1.3 Quantitative analysis
The indicators selected for the progress tracking5 are representative proxies of GHG emissions: they are the sum of the major drivers of emissions. The basis for the set of indicators is inspired by the so-called “Kaya identity”. This is an identity that is used to decompose the total greenhouse gas emissions as product into four factors: size of human population, GDP per capita, economy’s energy intensity (per unit of GDP) and the economy’s carbon intensity (emissions per unit of energy consumed) (Perman et al., 2003; Peters et al., 2017). The projections of the latter two indicators are influenced by many factors. Per capita GDP and population growth results in an increase in emissions, other things being equal, while energy intensity improvements in the global economy and reductions of carbon intensity in energy use results in a decrease in emissions. Inspired by the recent paper of Le Quéré et al. (2019), in which emission reductions over time were analysed, a ‘renewed’ set of four Kaya-indicators was developed6:
(a) Final energy intensity of GDP.
(b) Fossil-fuel based (and traditional biomass) final energy share in total final energy use. (c) Fossil-fuel based (and traditional biomass) primary energy CO2 intensity.
(d) Fossil Utilization rate7.
There are multiple merits of this set of indicators as used in this research, which will be discussed here. First of all, it is rather easy to identify concrete policy actions associated with these particular indicators. Secondly, the set of indicators takes into account the emissions associated with the use of traditional biomass8. Thirdly, as the indicators are based on the fundaments of the Kaya-identity, we use an approach that is strongly embedded in scientific literature. And finally, and perhaps the most important argument; many countries have expressed (sub)targets in their climate policies in terms of these indicators or in terms which are closely related to the definition of the indictors. The Kaya Identity is discussed in more details in the methodology section.
In addition to the four Kaya indicators we discussed already, two additional “non-Kaya” indicators were used in the research. Many countries have also expressed (sub)targets for these indicators in their climate policies. Although these indicators are no Kaya-indicators, they are still important drivers of emissions, which allow us to enhance our full
understanding of the progress of 12 economies toward their NDCs and national energy and climate policy targets. These additional non-kaya indicators are:
(e) Final energy use per capita.
(f) Renewable share in the electricity mix (either including or excluding hydropower).
4 Similar to this research, they consider existing and, in some cases, planned climate and energy
policies.
5 More information about this methodology is found in the next chapter. 6 Le Quéré et al. (2019) do not explicitly refer to Kaya-related literature. 7 Fossil-fuels based primary energy divided by fossil-fuels based final energy.
For these six main indicators, both historical data and projections of current policies
scenarios from the integrated assessment models IMAGE and POLES were used, in order to analyse the drivers of CO2 emissions in 12 major economies9. Similar to the yearly report of Kuramochi et al. (2018), the current policies scenario assumes that no additional mitigation action is taken beyond currently implemented climate policies as of a cut-off date10. In addition to the projections, also historical data were used for comparison. For each indicator, the historical development is shown from 1971 to 2015. From 2015 onwards, projections are shown for both IMAGE and POLES through 2035.
The historical development paths and the projections under currently implemented policies were used for comparison with targets of the individual countries on the six indicators. However, as countries have formulated their targets on energy and climate change using different definitions, this research ‘universalized’ the targets, meaning targets were
recalculated (translated) to the same indicator definition. In the remainder, these translated domestic targets will be referred to as ‘universalized targets’. Thus, this research enables a comparison between countries’ climate policy actions and their domestic targets, and a comparison of developments between different countries.
1.4 Scope
In this research, the targets and developments of twelve major emitting regions were analysed11. These regions were selected based on their relatively large impact on worldwide emissions. These twelve countries accounted for about 75% of total global GHG emissions in 2015. Another criterion was the geographical location of the region – we intended to have a diverse geographical coverage. Furthermore, this analysis is restricted to energy- and industry related CO2-emissions only, because CO2 emissions from fossil fuels, industry and cement dominate total GHG emissions (Olivier et al., 2018) and these emissions are directly coupled to the selected Kaya-indicators related to energy consumption, whereas non-CO2 greenhouse gas emissions and land-use related CO2 emissions also have agricultural and land-use related sources.
9 In some cases, only either IMAGE or POLES data was available for the projection purposes. In such a
case, solely he results for that integrated assessment models (IAMs) are shown as a ‘flat line’, instead of a range between the two lines for the two separate IAMs. The flat line may suggest that there is no uncertainty involved in the projection data. This is not the case. The uncertainty of the IAMs and the implications of those uncertainty is discussed in Kuramochi et al. (2018).
10Policy developments since the 2017 report have been taken into account in the emissions projections.
The cut-off date of 1 July 2018 is used in this report. Herewith the approach of Kuramochi et al. (2018) is followed. They base they yearly policy-updates on their April policy update document (e.g. Kuramochi
et al., 2019) and the periodical updates under the European CD-LINKS project (CDLINKS, 2018).
Although the April update for 2019 was already available before the publication date of this report, these policies have not been taken in account yet, as those have not been quantified and implemented yet in the current scenarios of the integrated assessment models IMAGE and POLES.
2 Methodology
2.1 General
This research mostly consists of a quantitative desk research: indicators were developed and analysed based on data from a scenario database and from output of integrated assessment models. In this chapter, we explain the sources of the historical data (2.2), the use of integrated assessment models IMAGE and POLES (2.3), and the development of universalized targets (2.4).
This research was supervised by the PBL Netherlands Environmental Assessment Agency and was performed by a Dutch National Governmental trainee in the first half of 2019. No other parties were involved in this research. The methodology of this first check of progress toward climate targets could be evaluated and adapted, for future use by PBL (also for the
preparation of products under contract to the European Commission).
2.2 Historical data
For each of the six indicators, the historical development from 1971 to 2015 is reported. Various sources were used to calculate the indicators. For most of the energy data, an IEA dataset was used (Extended World Energy Balances). Furthermore, for data on GDP (in PPP) and population, another IEA dataset (World Energy Indicators) was used, which contains data of the OECD/IEA World Energy Statistics and Balances (World Energy balances statistics and world development indicators).12 Finally, for fossil fuels and industrial processes CO2 -emissions, EDGAR data was used (V5.0). The latter also includes the emissions of traditional use of primary solid biofuels, if applicable.
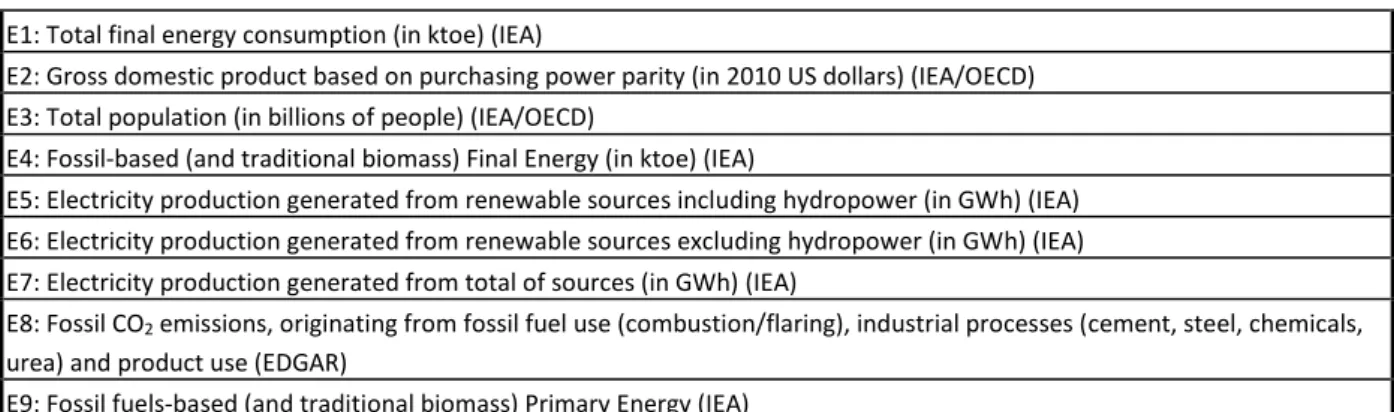
Table 1: Elements obtained or calculated in this research, used for indicators E1: Total final energy consumption (in ktoe) (IEA)
E2: Gross domestic product based on purchasing power parity (in 2010 US dollars) (IEA/OECD) E3: Total population (in billions of people) (IEA/OECD)
E4: Fossil-based (and traditional biomass) Final Energy (in ktoe) (IEA)
E5: Electricity production generated from renewable sources including hydropower (in GWh) (IEA) E6: Electricity production generated from renewable sources excluding hydropower (in GWh) (IEA) E7: Electricity production generated from total of sources (in GWh) (IEA)
E8: Fossil CO2 emissions, originating from fossil fuel use (combustion/flaring), industrial processes (cement, steel, chemicals, urea) and product use (EDGAR)
E9: Fossil fuels-based (and traditional biomass) Primary Energy (IEA)
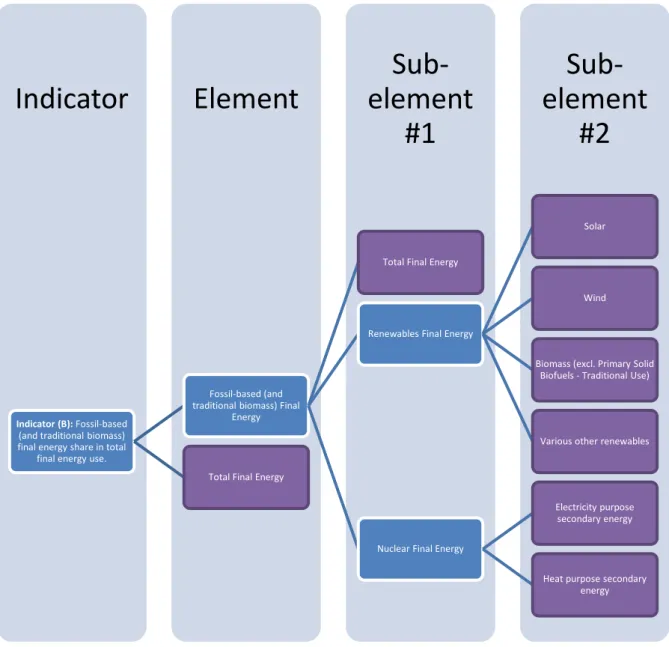
The indicators were created by combining different elements (see Figure 2). For instance, for indicator (b) fossil fuels-based (and traditional biomass) final energy share in total final energy use, the following two elements were used: “Fossil fuels-based (and traditional
biomass) final energy” and “Total final energy consumption”. A graphical overview of the data used for calculating this indicator, is shown in Figure 2. It was possible to derive the second element of the indicator from the IEA ‘raw’ dataset. However, the first element could not be obtained directly from a database, so it was calculated based on various
sub-elements. The element “Fossil fuels-based (and traditional biomass) final energy” was calculated by using data on Total Final Energy (TFE) and subtracting various types of final energy from renewable sources and final energy from nuclear sources. Please note that the renewable sources consist of solar, wind and biomass, which we all subtracted from the TFE. However, we did not subtract traditional used primary solid biofuels, as this is not considered as low-carbon in this research. For Nuclear Final Energy, we subtracted energy used for electricity purposes and energy used for heating purposes (only a minor part).
In table 1 an overview is presented for all the elements that were calculated in order to calculate the six indicators. Appendix A describes which steps were taken to calculate these elements, based on raw data.
Figure 2: Example of how an indicator (B) is calculated, using elements and sub-elements. The figure shows that multiple levels of data are involved. In every step, an adequate unit of data is required before calculation takes place. The data in purple are ‘raw’ data that can be
Sub-element
#2
Sub-element
#1
Element
Indicator
Indicator (B): Fossil-based(and traditional biomass) final energy share in total
final energy use.
Fossil-based (and traditional biomass) Final
Energy
Total Final Energy
Renewables Final Energy
Solar
Wind
Biomass (excl. Primary Solid Biofuels - Traditional Use)
Various other renewables
Nuclear Final Energy
Electricity purpose secondary energy
Heat purpose secondary energy Total Final Energy
Kaya-indicators
The set of indicators was inspired by the so-called “Kaya identity”. This is an identity that is used to decompose the total greenhouse gas emissions as product into four factors: size of human population, GDP per capita, economy’s energy intensity (per unit of GDP) and the economy’s carbon intensity (emissions per unit of energy consumed) (Kaya, 1997). it is a specific application of a frequently used approach to organize discussion of the drivers of emissions through the so-called IPAT identity (see e.g. Perman et al., 2003). The identity is used in several IPCC-publications (e.g. Blanco et al., 2014) in order to describe developments in emissions and is described in the following way13:
𝐶𝐶𝐶𝐶2=𝐶𝐶𝐶𝐶𝐸𝐸 ∗2 𝐺𝐺𝐺𝐺𝐺𝐺 ∗𝐸𝐸 𝐺𝐺𝐺𝐺𝐺𝐺𝐺𝐺 ∗ 𝐺𝐺
where E represents energy consumption, GDP the global domestic product (or global value added) and P population. Changes in CO2 emissions can be described by changes in these four factors. Le Quéré et al. (2019) used a formula that is rather similar to the Kaya-identity:
𝐶𝐶𝐶𝐶2= 𝐹𝐹𝐸𝐸 ∗𝐹𝐹𝐸𝐸𝐹𝐹𝐸𝐸 ∗𝑓𝑓𝑓𝑓 𝐺𝐺𝐸𝐸𝐹𝐹𝐸𝐸𝑓𝑓𝑓𝑓 𝑓𝑓𝑓𝑓∗
𝐶𝐶 𝐺𝐺𝐸𝐸𝑓𝑓𝑓𝑓 And 𝐹𝐹𝐸𝐸 = 𝐺𝐺𝐺𝐺𝐺𝐺 ∗ 𝐺𝐺𝐺𝐺𝐺𝐺𝐹𝐹𝐹𝐹
Such that it can be rewritten as:
𝐶𝐶𝐶𝐶2= 𝐺𝐺𝐺𝐺𝐺𝐺 ∗ 𝐺𝐺𝐺𝐺𝐺𝐺 ∗𝐹𝐹𝐸𝐸 𝐹𝐹𝐸𝐸𝐹𝐹𝐸𝐸 ∗𝑓𝑓𝑓𝑓 𝐺𝐺𝐸𝐸𝐹𝐹𝐸𝐸𝑓𝑓𝑓𝑓 𝑓𝑓𝑓𝑓∗
𝐶𝐶𝐶𝐶2 𝐺𝐺𝐸𝐸𝑓𝑓𝑓𝑓
FE is Final Energy Consumption, FEff is Final Energy from fossil fuels, PE is Primary Energy consumption, PEff is Primary Energy from Fossil fuels. In addition to the paper of Le Quéré et al. (2019), final and primary energy from fossil fuels here includes the energy originating from traditional use of primary solid biofuels, as this use of biomass has associated carbon emissions. Then the equation becomes:
𝐶𝐶𝐶𝐶2= 𝐺𝐺𝐺𝐺𝐺𝐺 ∗ 𝐺𝐺𝐺𝐺𝐺𝐺 ∗𝐹𝐹𝐸𝐸 𝐹𝐹𝐸𝐸𝑓𝑓𝑓𝑓+𝑡𝑡𝑡𝑡𝑡𝑡𝑡𝑡𝐹𝐹𝐸𝐸 ∗𝐺𝐺𝐸𝐸𝐹𝐹𝐸𝐸𝑓𝑓𝑓𝑓+𝑡𝑡𝑡𝑡𝑡𝑡𝑡𝑡 𝑓𝑓𝑓𝑓+𝑡𝑡𝑡𝑡𝑡𝑡𝑡𝑡∗
𝐶𝐶𝐶𝐶2 𝐺𝐺𝐸𝐸𝑓𝑓𝑓𝑓+𝑡𝑡𝑡𝑡𝑡𝑡𝑡𝑡
This equation consists of five driving factors of energy- and industry related CO2 emissions, which can be measured and projected using data. However, GDP as such is not included in the tracking of progress toward climate targets, as this study focuses on the effects of energy- and climate policy. Energy- and climate policy only has an indirect effect on GDP. Furthermore, none of the 12 countries that are discussed in this analysis aims for changes in GDP in order to reduce emissions (which would imply a reduction of the GDP).
Four factors remain, which policy makers can target to bring down emissions: final energy intensity, fossil share of final energy, carbon utilization ratio and fossil-based (and traditional biomass) primary energy CO2 intensity. Le Quéré et al. (2019) present various examples of policy actions that can help to direct the indicators, such that lower GHG emissions will be attained.
2.3 Projections
For this research, data from Integrated Assessment Models (IAMs) was used. The models used here are IMAGE and POLES, which were both developed in the European Union. IAMs are tools to understand the complex interactions between energy, economy, land use, water and climate systems (Gidden et al., 2018). Their output has been reported in scientific literature, usually with the aim to project developments in climate change and energy. For this analysis, the integrated assessment models IMAGE 3.0 (Stehfest et al. 2014) and POLES-JRC (see Keramidas et al., 2018 and Keramidas et al. (2017) were used to assess the impact of current national policies on the development of emissions and energy factors.
The IMAGE and POLES model are well suited for such an assessment, given the relatively high degree of detail with which they represent the activity levels in different sectors and their focus on a physical description of activities (allowing a rather straightforward
interpretation of the implemented policies). The current policy scenarios have been described more extensively in Kuramochi et al. (2018). In this subsection, a small summary is
provided.
IMAGE
IMAGE 3.0 is a comprehensive ecological-environmental model framework that simulates the environmental consequences of human activities worldwide (Stehfest et al., 2014; van Vuuren et al., 2017; van Vuuren et al., 2018). For this research, it is relevant that IMAGE is able to simulate the impact of currently implemented climate policies, which affect various drivers of emissions.
IMAGE divides the world in 26 regions. Therefore, not every country is an IMAGE region. In many cases, individual countries are part of a larger IMAGE region. For countries that are part of a larger IMAGE region (in this research Australia, Kazakhstan and the Russian Federation), elements of the indicators were downscaled using the country’s share in the region for 2015 historical data on that element (e.g. emissions) as a constant scaling factor.
POLES
The POLES-JRC (Prospective Outlook on Long-term Energy Systems) model is a global partial equilibrium simulation model of the energy sector, with complete modelling from upstream production through to final user demand (Keramidas et al., 2017; Vandyck et al., 2016). The POLES-JRC model follows a year-by-year recursive modelling. As it is a global partial equilibrium model, prices are determined endogenously. These prices trigger various technical mechanisms in several sectors. POLES covers 39 regions over the world. With POLES, it is also possible to project the impacts of currently implemented policies (called the “Reference scenario”).
First, all implemented policies in the analysed countries were gathered using the periodical updates from the CD-LINKS project (McCollum et al., 2018 & CD-LINKS, 2018), literature research, and expert knowledge. PBL, NewClimate Institute and IIASA update this list on a yearly basis, as new policies arise. Policies through July 2018 were considered in the
emissions projections. Current policy trajectories reflect all adopted and implemented policies until 2018, which for the purpose of this report are defined as legislative decisions, executive orders, or their equivalent. This implies that publicly announced plans or strategies alone would not qualify as implemented policies, while individual executive orders to implement such plans or strategies would. With respect to current policy trajectories, this research follows the approach used in Kuramochi et al., (2018).
The starting point for the calculations of the impact of these climate policies was the latest SSP2 (no climate policy) baseline as implemented in the IMAGE model (van Vuuren et al., 2017) and the POLES model (Keramidas et al., 2018). The SSP2 scenario describes a middle-of-the-road scenario in terms of economic and population growth and other long-term trends, such as in technology development. The main drivers for the energy and industrial sectors are population, gross domestic product (GDP), lifestyle and technology change.
The following step consisted of introducing the explicit policy measures to the SSP2 baseline. For IMAGE, this process is reported in detail in Roelfsema et al. (2018), Van Soest et al. (2017) and Kuramochi et al. (2017). The so called ‘current policy scenario’ assumes that current policies are implemented up to 2030. For the 2030–2100 period, the scenario assumes no new policies. Policies may have a long-term effect through the induced technology learning effects (e.g. by additionally installed renewable energy technologies compared to the SSP2 baseline). For calculations of the impact of individual policies in different subsectors, modules of IMAGE were used, such as the global climate policy model (FAIR) and the detailed energy-system model (TIMER).
The POLES current policies scenario is based on the GECO2018 Reference scenario (Keramidas et al., 2018). It includes adopted energy and climate policies worldwide, for 2020, and the extension of the EU ETS to 2050 (with a constantly decreasing cap at -1.74%/year); after 2020, CO2 and other greenhouse gas emissions are driven by income growth, energy prices and expected technological development with no supplementary incentives for low-carbon technologies (Keramidas et al., 2018). A full list of the policies considered in the GECO2018 Reference scenario and their implementation is provided in Annex 5 of the GECO2018 report (Keramidas et al., 2018).
The current policy scenarios of both IMAGE and POLES consider a wide range of implemented national climate and energy policies but do not provide a complete assessment of all policies. This has the risk of underestimating or overestimating the total impact of a country’s policies on GHG emissions. Another side note is that many assumptions are needed before one can estimate the impact of a policy: sometimes, there is a lack of information about the policy, sometimes one needs to simplify. Altogether, there are many uncertainties around the current policy projections. More information about the uncertainty and limitations of the scenarios is provided in Kuramochi et al. (2018).
For this research, output-data of IMAGE and POLES was used, for their current policy scenarios. It consists of data for energy- and emissions projections, organized in different categories. An approach similar to the one described for the historical data was taken, such that indicators were calculated using similar defined elements and various sub-elements (Table 1). Appendix A describes the steps in calculating these elements.
The indicators based on the model projections did not immediately match the selected historical time series. Literature on IAMs shows that this phenomenon is not unique: Rogelj et al. (2011) show that usually, historical emission levels from data officially reported to the UNFCCC are lower than independent global emission levels used in models. Gidden et al. (2018) argue that although historical data is used as both starting point for the creation of IAMs and instrument to calibrate the model afterwards, still discrepancies can exist. In order to deal with these discrepancies, model teams use the approach of harmonization. Gidden et al. (2018) write: “Harmonization refers to the process of adjusting model results to match a selected historical time series such that the resulting future trajectories are consistent with the original modelled results and provide a smooth transition from the common historical data. In emissions context, this means that each individual combination of model region, model sector, and emissions species must be harmonized”. Furthermore Gidden et al. (2018)
refer to various authors using this technique, showing that its application is “common practice”.
For this research, harmonization was also done. Different from the example of Gidden et al. (2018) and the application in Kuramochi et al. (2018), we did not only apply the technique on the emissions, but also on the drivers of emissions. More specifically: the elements used for the calculations of the indicators (e.g. “Final Energy” and “GDP (PPP)”, for the energy efficiency indicator) were harmonized. There are different techniques for harmonization. Which technique is favoured depends on various factors (Gidden et al., 2018; Rogelj et al., 2011). As we observe the unharmonized data for the indicators (consisting of one line for the projections and another one for the historical data), we find that the lines have, in general, similar shapes. However, the two separate lines are “shifted from each other” on the vertical axis. It may be that, although we tried to match the definitions of elements for calculating the indictors for both the historical data and the projections, there is still some small
discrepancy in the way (sub)elements of the indicators were formulated. Therefore, based on the logics of Rogelj et al. (2011), we chose to use the offset-method for the energy and emissions indicators. Basically, the offset harmonization methodology offsets the entire emission pathway with the difference in emissions observed in the reference year14. For GDP (PPP), we chose to use the uniform scaling harmonization methodology, which looks at the relative difference between the 2000 GDP levels from a given pathway and the reference values of the IEA (World Bank), and scales the entire pathway for all years to get the harmonized GDP data. In this research, both the harmonized and the unharmonized, original, projections are shown.
2.4 Targets
The historical development paths and the (harmonized) projections under currently implemented policies were used in a comparison with the universalized targets of the
individual countries. The transformation of targets in their original form and definition (i.e. as mentioned by the government in official communication) towards the universalized target’s definition is a rather complex process. Appendix B provides more details on the calculations of all individual targets for each of the 12 regions analysed here. Each of the transformations (from explicit ‘original’ target to implicit ‘universalized’ target) is unique, as every country described their targets using different definitions, units and exceptions15. Still, there are always elements in the transformation process that are somewhat similar.
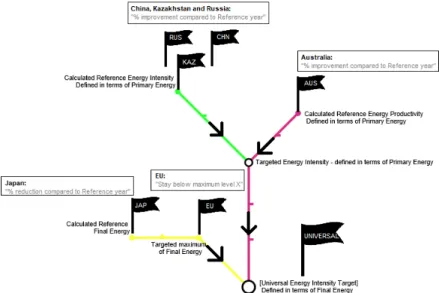
In Appendix B, every individual type of the six indicators has its own section in which the transformation processes for the countries’ targets are discussed. At the start of every section, a graphical impression is provided in which the interconnections between the calculations are shown. a Metro Mapping Design is used in each of these figures. Figure 3 shows an example for the energy efficiency indicator (Final energy per GDP (PPP)). In Appendix B, this figure is discussed more extensively.
14 In the Python script that was created for this analysis, we did not use one reference year, but instead
a combination of three reference years for which we have both projections and historical data: 2005, 2010 and 2015. For each of the three years, we checked where the absolute difference between projections and historical data is the smallest. We refer to this as the ‘structural deviation’ between projections and historical data, and this deviation was used as an offset factor. The deviation (either positive or negative) was structurally added to the projections from 2015 onwards until 2035 (final time period in this analysis). In order to have a smooth transition from the historical data to the adjusted projections, the data between 2015 and 2030 was adjusted, by applying a diminishing factor.
A Metro Mapping Design has a universally understood logic and, therefore, helps us to represent and comprehend process flows and the connections between those. The identical routes followed for multiple countries and the intersections with partly divergent routes for other countries, represent the parallels between the universalized target calculations. For example, it is shown in Figure 3 that Kazakhstan (KAZ), Russia (RUS) and China (CHN) formulated their targets in similar ways (regardless of their level of ambition). Therefore, there are parallels in the approaches of transforming these countries’ explicit original targets into implicit universalized targets. The countries first follow the green line towards the intersection with the magenta-coloured line. Then they follow the vertical trajectory of the magenta-coloured line in the southern direction, ending at the universally defined implicit target. The target of Australia (AUS) is rather unique in its formulation, but also has
similarities to the KAZ, RUS and CHN targets. Therefore, its transformation process towards a universalized target takes a partly different route, as compared to the other three countries we discussed. Its transformation process first follows a unique trajectory. However, as the trajectory hits the intersection with the green line, it follows the joined calculation trajectory on the same magenta-coloured line, together with Kazakhstan, Russia and China. Again, ending at the universally defined implicit target.
Figure 3: Example of the transformation (calculation) process, for the energy efficiency indicator (FE / GDP (PPP)). Starting at a small flag, representing the explicit ‘original’ target of an individual country, several trajectories lead to the larger flag (there is only a one-way road; multiple routes are not possible). This larger flag represents the implicit ‘universalized’ target.
How to interpret the country profile graphs?
In the next chapter, country profiles are provided for the 12 selected countries. Here, we explain how to read those profiles. The profiles first start with an overview of six graphs for the country, one for each of the six indicators. Four Kaya-indicators in the left column (see blue box) and two additional indicators in the right column (see green box). Final energy use per capita is an additional graph to the Energy intensity Kaya-graph. Renewable share in electricity mix is an additional graph to the fossil share in energy use Kaya-graph.
• Projections of IMAGE and POLES are shown as the coloured ranges between 2015 and 2035.
• These coloured ranges represent harmonized projections (see 2.3), while the grey ranges represent the unharmonized, original, projections.
• The bold black lines, usually between 1971 and 2015, represent the historical data. • The world-average of the indicator in 2030 (using harmonized data) is shown as a
black ‘X’ in 2030.
o The estimates for the world are the same across countries, except for the share of renewable energy, which depends on the definition including or excluding hydropower.
• The universalized ‘implicit’ targets are shown as a brown-coloured diamond. • If the target was not transformed (i.e. if the target was already defined in terms of
the universal definition), then the ‘explicit’ target is shown as a gold-coloured diamond.
• The targets for fossil-based (and traditional biomass) primary energy CO2 intensity are an exception; those are shown as arrows: one upward pointing arrow for the minimum estimate of the target and one downward pointing arrow for the maximum estimate of the target.
generally shown including hydropower as renewable source. However, if the specific country has defined its original renewable target excluding hydropower, then the graph is shown without this source of energy. For every country, the graph states whether hydropower is included or not.
• Additional background information on climate policies in the twelve countries and a further explanation of trends observed in the indicators can be found in Appendix C. • An overview of countries’ progress on the six indicators is presented in Table 2.
3 Country profiles
3.1 Argentina
Indicator targets
♦
Renewable share in electricity mix (explicit targets): 16% renewable electricity share by 2021. 18% renewable electricity share by 2023. 20% renewable electricity share by 2025.
Important remark: renewable energy targets are excluding large hydropower and including small hydropower. As no reliable data on small hydropower generation is available, this source is not included in the historical data and projections.
Source: Law 27191 on renewable energy (Reference in Appendix B).
> The 2025 target is projected to be met under the current policy scenario of POLES.
> The 2021 and 2023 targets are projected not to be met under current policy scenario.
♦
Fossil and traditional biomass CO2 intensity (implicit target): 2.49 MtCO2/Mtoe by 2030.Based on explicit target: Limiting GHG emissions to 483 MtCO2e by 2030.
Source: NDC.
> The target is projected not to be met under the current policy scenario.
Overall GHG emissions target
“Argentina is not yet on track to meet its unconditional NDC, and further mitigation actions are needed” (Kuramochi et al., 2018).
> The overall GHG emission target is projected not to be met under the current policy scenarios of
PBL and NewClimate Calculations.
Energy demand and savings
Argentina’s energy use per capita has increased at a similar pace as the G20 average. Still, the absolute levels remain below the G20 average. The current policy scenarios show a continuation of this upward trend, such that in 2030, the energy per capita is higher (1550 ktoe/million persons) than the world average (1300 ktoe/million persons).
Argentina’s energy intensity dropped by 21% (1990–2017), at a slower pace than the G20 average, but remains slightly below the G20 average (Climate Transparency, 2018). It is expected that the energy intensity will decrease more strongly in future, driven by for instance the National Program for Rational and Efficient Use of Energy and the Energy Efficiency Project. If the plans of the National Cabinet for Climate Change on transport are further developed and implemented, energy savings may be larger than in the current policies projections shown here.
Also the new carbon tax (not yet quantified in the projections), which mainly focuses on higher prices of liquid fuels, is expected to have an impact on the amount of energy used, due to its negative income effect
Implemented contributing policies
National Program for Rational and Efficient Use of Energy (PRONUREE) (2007) Energy Efficiency
Project (2009) Program for Rational
and Efficient use of Energy in Public Buildings.
Renewable input and fossil phase-out
Argentina does not have a very carbon-intensive energy mix, when compared to other G20-countries. In 2017, 4.2% of the primary energy consisted of hydropower, 4.2% was from ‘New Renewables’, 1.9% from nuclear sources and 51.9% came from natural gas. The rest of the energy mix (37%) consisted mostly of oil and coal. The carbon intensity of the Argentinian power sector is only slightly below the G20 average (Climate Transparency, 2018).
New renewables (excluding large hydropower and traditional biomass), however, are not that abundant compared to other G20 countries. The Brown to Green report’s country profile for Argentina shows that only 4.23% of the primary energy supply was generated from those renewable energy sources in 2017 (ClimateTransparency, 2018). The authors are more optimistic about the recent policy developments: Argentina’s bio-economy is developing itself quickly, partly because of the impact of the PROBIOMASA Program (2013) (via Ministry of the Environment, 2015). Biomass is the main source and driver of the 20% increase in renewable energy supply between 2012 and 2017 in Argentina. Furthermore, the RenovAr auctions are promising. It is expected that the auctions will reach their goal of increasing the generation capacity of various renewable energy sources (Climate Action Tracker, 2019).
It is projected that Argentina’s explicit renewable energy target for 2025 will be met. However, this is not the case for the earlier targets of 2021 and 2023. Marcelo Álvarez, President of Cámara Argentina de Energías Renovables (CADER), states in an article: “Argentina will achieve its goal of 20 percent renewable energy in its electricity matrix by 2025. It will probably not achieve the first two-year goals because there are many projects being built. The main barriers right now are: financial support (high interest or short-term paybacks), the macroeconomic state of Argentina and the lack of infrastructure to reduce cost and time for building solar and wind plants” (TheDialogue, 2018). Implemented contributing policies Renewable Energy Programme in Rural Markets (2000) Renewable Energy Law 27191. National Development Scheme for the Use of Renewable Energy Sources (RenovAr) (2016) PROBIOMASA: Promotion of biomass energy (2013)
Carbon intensity and utilization
When the forestry sector is excluded from the emissions data, something noteworthy is found: Argentina’s emissions increased by 43% between 1990 and 2014. The forestry sector would have a large compensating effect on the emissions. An important driver of those overall ‘unmasked’ emissions is the agriculture sector. The sector is capital-intensive compared to other countries’ agricultural sectors. The agricultural emission intensity is 1.73 tCO2 per thousand US$2015 in Argentina, compared to 0.95 for the average
over all G20 countries (Climate Transparency, 2018). If we would also take into account the emissions related to forest clearance for agricultural land, the carbon footprint of the agriculture sector would be even larger. Overall, the carbon intensity of Argentina is projected to remain rather stable in the coming 20 years, remaining well below the world average carbon intensity. Still, the aggregate of the Argentinean climate policy actions is not sufficient to make them meet the implicit carbon intensity target. This target is based on Argentina’s own NDC ambitions. It will depend on the new and most recent (unquantified) plans of the Cabinet for Climate Change whether Argentina will be able to decrease its carbon intensity and therefore will be able to attain its NDC emission reduction target.
Implemented contributing policies
Carbon tax on energy (2017) Biofuels law (2016) Sources of implemented contributing policies: • Kuramochi et al., 2018 • Ministry of the Environment, 2015
Indicator targets
♦
Energy Intensity of GDP (implicit target): 53.22 ktoe/billion US$2010 by 2030.Based on explicit target: 40% improvement of energy productivity between 2015 and 2030. Source: The National Energy Productivity Plan (NEPP) (Reference in Appendix B).
> The target is projected to be met under the current policy scenarios of IMAGE and POLES.
♦
Renewable share in electricity mix (implicit target): 23.5% of Australia’s electricity generation by2020.
Based on explicit target: realizing 33,000 GWh capacity of large-scale electricity generation by 2020.
In a government report, this is equated to 23.5% of Australia’s electricity generation in 2020. Source: The Renewable Energy Target (RET) scheme (impacted by amendment act 2015).
> The target is projected to be met under the current policy scenarios.
♦
Fossil and traditional biomass CO2 intensity (implicit target): between 2.36 and 2.63 MtCO2/Mtoe by 2020 and 2.52 to 2.59 MtCO2/Mtoe by 2030Based on explicit targets: unconditional 2020 pledge of 5% GHG emissions reduction from the 2000 level and unconditional target of 26% to 28% GHG emissions reduction by 2030 from 2005 level. Source: NDC.
> The targets are projected not to be met under the current policy scenarios.
Overall GHG emissions target
“Our current policies scenario projections for 2030 (5% to 11% below 2010 levels) are about 10 percentage points lower compared to our projections in the 2017 report due to higher renewable energy targets and enhanced forestry policy, but still show a significant difference with the NDC emission levels in 2030 (20% to 23% below 2010 levels). We therefore conclude that Australia is not on track to meet its NDC.” (Kuramochi et al., 2018).
> The overall GHG emission target is projected not to be met under the current policy scenarios of
PBL and NewClimate Calculations.
Energy demand and savings
Australia’s energy use per capita is with 220 GJ/capita more than twice the G20 average (97 GJ/capita) (ClimateTransparency, 2018). In particular, Australia performs weak with regard to energy efficiency in both the industry and the transport sector, as compared with other developed countries (EEC, 2018). The Energy Efficiency Council (EEC) writes that Australia can rather easily increase their performance, by for instance implementing minimum standards for efficiency for more appliances (EEC, 2019). They point to the many best practices worldwide, from which Australia may learn some lessons if they would like to improve their efficiency rates.
In spite of this status quo, the energy efficiency policies which are implemented over the past years currently turn out to be fruitful: Australia is making a continuous improvement in its energy savings over the years and is projected to do so over the years to come. Based on current policy projections it even seems like Australia is going to attain the target of 40% improvement of energy productivity between 2015 and 2030. Yet, the final energy per capita will remain relatively high compared to the world average.
There is an important reason for Australia to continue their job on improving energy efficiency: The potential to save a lot on the household expenditures throughout the entire country. The EEC has found that in case Australia would adopt the German efficiency standards of today, it could save the average Australian households €500 a year on power bills (EEC, 2019).
Implemented contributing policies Greenhouse and Energy Minimum Standards Act 2012 Energy Productivity Plan
Renewable input and fossil phase-out
Australia has the G20’s second lowest share of zero-carbon fuels in the energy mix (ClimateTransparency, 2018). The graphs in this report show clearly that Australia is slowly but steadily about to escape from their fossil ‘lock-in’. While previous decades the fossil share of Australia was approaching the 100%, Australia has shown a strong increase of 27% of zero-carbon fuels between 2012 and 2017. The current policy projections show that Australia is expected to continue this trend of fossil fuel decline.
This is especially driven by the strong increase of new renewables (e.g. solar and wind) in Australia. “New renewable” sources (excl. large hydro and traditional biomass use) supply 4.5% of energy in Australia (ClimateTransparency, 2018). This is somewhat similar to the G20 average. Supply from new renewables increased by 42% (2012–2017). Australia has one of the highest rooftop solar rates in the world: a fifth of all households has it installed, providing around 4% of Australia’s electricity (Carbon Brief, 2019a). Altogether, Australia is well on track to meet the renewable electricity target of 23.5% in 2020. However, the beyond-2020 ambitions of the government are still unclear, as the national targets for 2030 and 2050 (set by previous coalitions) have been abolished.
Implemented contributing policies
Renewable Energy Target (see previous page)
Carbon intensity and utilization
Australia is currently in a large transition from focusing on primarily coal exports to also focusing on LNG exports. Although LNG is less carbon intensive compared to coal, it is not sure whether exporting the cheap LNG to Asia will actually lead to a lower overall emission level. This is because it is expected that the LNG will not only compete with coal, but especially with the much cheaper renewable and nuclear Asian energy and also with gas from Qatar. Each of those are less emission intensive than the Australian LNG. This is partly due to the fact that there is expected an increase of fugitive methane gases, from increasing the activity level at various Australian mines (Guardian, 2019b). This leads to concerns that actual emissions and therefore intensities might be higher than presently reported (Hare et al., 2018).
In 2017 the Australian carbon intensity was 76 tCO2/TJ compared to a G20
average of 59 tCO2/TJ (ClimateTransparency, 2018). Specifically, Australia’s
energy sector has even the G20’s highest carbon intensity, due to Australia’s high share of fossil fuels in the energy mix. Also the transport sector is relatively ‘high-carbon’ compared to other G20 countries: The Australian transport emissions account for 4.04 tCO2 per capita, compared to a G20 average of 1.13
tCO2 per capita. Now that Australia is working on the implementation and
specification of the National Electric Vehicle Strategy, the government has the opportunity to counteract these high-carbon-statistics.
The graph on the projections of emission intensity show that Australia is expected to retain similar levels of carbon intensity over the years to come. This makes it hard to meet the implicit emission intensity target for 2030, which is critical to pursue their explicit NDC-emission-target.
Implemented contributing policies
Fuel tax for diesel and gasoline is set at AUD 0.3814 per litre CCS Flagships Programme Australia 2009 Fuel Quality Standards Act 2000 Sources of implemented contributing policies: • Kuramochi et al., 2018 • Australian Government, 2015 • Australian Government, 2017
Indicator targets
♦
Renewable share in electricity mix (excluding hydropower) (explicit target):Share of renewables in power supply at least 23% (excluding hydro) by 2030. Source: NDC (References in Appendix B).
> The target is projected to be met under the current policy scenarios of IMAGE and POLES.
♦
Fossil and traditional biomass share in energy supply (implicit target):56% fossil and traditional biomass share in total final energy by 2030.
Based on explicit targets: 45% of renewables in the primary energy mix by 2030. Source: NDC.
> The target is projected not to be met under the current policy scenarios.
♦
Fossil and traditional CO2 intensity (implicit targets): For 2020, the calculated implicit target is 2.90 MtCO2/Mtoe. For 2025 the calculated implicit target is 1.65 MtCO2/Mtoe. For 2030 the calculated implicit target is 1.42 MtCO2/Mtoe. Based on explicit targets:
Unconditional pledge: Between 36.1% and 38.9% reduction from a baseline scenario by 2020. Unconditional NDC: 37% GHG emissions reduction by 2025 from 2005 level and indicative
contribution of 43% GHG emissions reduction by 2030 from 2005 level (equivalent to 4% to 8% below 2010 levels by 2030).
Source: NDC and other pledges (see Kuramochi et al., 2018).
> The targets for 2030 and 2025 are projected not to be met under the current policy scenarios.
> The target for 2020 is projected to be met under the current policy scenarios.
Overall GHG emissions target
“Our latest assessment shows that Brazil is not on track to meet its NDC with existing policies, which contrasts with the finding of the 2017 report that Brazil is likely on track to meet its NDC target. The main reason for our conclusion is due to the increasing deforestation emissions over recent years. The newly elected president of Brazil has indicated he wants to limit environmental constraints on agriculture (Associated Press, 2018)” (Kuramochi et al., 2018).
> The overall GHG emission reduction target is projected not to be met under the current policy
scenarios of PBL and NewClimate Calculations.
Energy demand and savings
The energy efficiency of Brazil shows a stabilization over the past 40 years and is projected to decrease slightly over the coming 25 years. Here we find a large contrast with the other G20 countries, of which the majority shows a clear decreasing trend. Nevertheless, Brazil is still below the G20 average.
When we look at the energy use per capita, we see an increasing trend. Energy use per capita in Brazil has increased by 48% since 1990, but started to decrease in 2014. The projections show that this decrease is only temporarily. Under current policies, energy use per capita is projected to increase again. There are not many policies in Brazil that are specifically aimed at decreasing the country’s energy use. One of the energy efficiency policies is the Inovar-Auto policy from 2012. This policy demands a 30% tax on cars sold between 2013 and 2017 (Kuramochi et al., 2018). However, it should be recognized that many other climate change policies will have lower energy demand as a co-benefit.
Implemented contributing policies
Renewable input and fossil phase-out
From the indictors discussed in this country profile, Brazil scores best on the indicators related to renewable energy generation. Brazil is endowed with many favourable characteristics and natural resources which allow them to make a rapid transition from fossil to low carbon energy. In 2017, already 80% of the power generation came from renewables (incl. hydro), while the G20 average was only 24% in the same year Hydropower and bioenergy were important constituents of the renewable power mix. The sustainability of large-scale hydropower and first-generation biomass is debated. Therefore, these numbers should be interpreted with care. If we exclude hydropower from the power generation statistics for 2017, it turns out that only 25% of power generation is from a renewable source (Climate Transparency, 2018). Brazil generates 29% of its energy supply from new renewable energy sources in 2017 (the G20 average is 5%). ‘New renewable sources’ include solar, wind, geothermal and (non-traditional) biomass. The growth in these sources has been mainly driven by biomass, which represented almost 97% of the new renewable energy supply (Climate Transparency, 2018).
This does not mean that Brazil focusses entirely on biomass; recent electricity auctions have targeted solar energy specifically, signalling a potential increase in solar capacity in the country in the coming years. The UN Emission gap report states that currently, contracts exist for the construction of around 4GW nominal capacity. Climate Transparency (2018) states that the Brazilian government announced plans to increase solar power, by installing 13 GW generation capacity by 2026.
Altogether, Brazil is projected to meet its renewable power target by 2030 under current policy projections (Share of renewables in power supply at least 23% (excluding hydro) by 2030). Yet, there is quite a large uncertainty range around the projections for the Brazilian fossil fuel share. Still, even in the most conservative case, Brazil is projected to meet the target.
However, the implicit target of 56% fossil and traditional biomass share in total final energy by 2030 is not projected to be met under the current policy scenarios (please note that the implicit target is based on the explicit target of 45% of renewables in the primary energy mix by 2030). Under current policy projections Brazil will only perform slightly better than the world average, with regard to their fossil share.
Implemented contributing policies
10-year National Energy Expansion Plan (2011)
National Plan on Climate Change (2008)
Carbon intensity and utilization
The carbon intensity of the Brazilian energy sector is well below the G20 average (Climate Transparency, 2018). This would reflect the relatively high share of renewables in the primary energy mix. In other sectors, the emission intensity would be much higher: for instance, the transport emissions are 1.13 tCO2 per capita in Brazil, while the G20 average is 0.96. COMMIT (2018)
suggests that GHG emissions in Brazil may be reduced even further by a decarbonization and electrification of the transport sector. Here also bioenergy can play a crucial role. They also point to the option of deployment of Bioenergy with Carbon Capture and Sequestration (BECCS) in liquid biofuels production.
Another sector with a particular high carbon intensity is the agricultural sector.
Implemented contributing policies
Carbon tax on energy (2017)
Biofuels law (2016)
Sources of implemented contributing policies:
more carbon-intensive than the G20 countries’ average (0.95 tCO2 per
thousand US$2015 (Climate Transparency, 2018). Agriculture is an important pillar of the Brazilian economy. The agri-food chain is responsible for about 18% of the total economic output (OECD, 2015). Many products with a relatively high carbon footprint are exported: soybeans, sugar, coffee, beef and chicken. There is large mitigation potential in the agricultural sector, which is currently unexploited: half of the 200 million hectares of pasturelands are considered to be degraded. Recuperation of the soils may lead to higher sequestration rates, argues COMMIT (2018). There would be various options to intensify Brazil’s agriculture production in a sustainable way; thereby, the production per square meter of land increases and the emissions decrease. None of the overall implicit intensity targets will be met under current policy projections. • Kuramochi et al., 2018 • Government of Brazil, 2008 • Ministry of Mines and Energy, 2012 • Presidência da República Brasil, 2017
Indicator targets
♦
Fossil and traditional biomass CO2 intensity (implicit targets): For 2020, the calculated implicit target is 2.71 MtCO2/Mtoe. For 2030, the calculated implicit target is 2.51 MtCO2/Mtoe. Based on explicit targets:
Unconditional: 17% GHG reduction by 2020 from 2005 level. Unconditional: 30% GHG reduction by 2030 from 2005 level.
Source: NDC (References in Appendix B), and other pledges (see Kuramochi et al., 2018)
> The targets for 2020 and 2030 are projected to be met under the current policy scenarios of
IMAGE and POLES.
Overall GHG emissions target
“Under current policies, Canada is projected to emit about 635 to 770 MtCO2e/year by 2030 excluding
LULUCF (9% below 2010 levels to 11% above 2010 levels) and therefore, not meet its NDC (17% below 2005 level, or 25% below 2010 levels)” (Kuramochi et al., 2018).
> The overall GHG emission target is projected not to be met under the current policy scenarios of
PBL and NewClimate Calculations.
Important: Please note that only major policies were quantified in this research that have been implemented
before June 2018. However, it is important to mention here that since June 2018, there have been some major policy changes in Canada. Newly introduced policies include the Greenhouse Gas Pollution pricing act, the Phase-out of traditional coal power, regulations for limiting carbon dioxide from natural gas fired generation of electricity and altered clean fuel standards.
Energy demand and savings
Canada has the G20’s highest energy use per capita. In 2017, the Canadians used almost 328 GJ per capita, while the G20 average is approximately 100 GJ per capita (Climate Transparency, 2018). The relatively large energy use in Canada can be explained by a couple of factors: Canada has a relatively small population, which is scattered over a large landmass. The average Canadian is, therefore, using relatively much energy on transport. Another factor is that a large part of the population lives in the northern half of the northern hemisphere, requiring quite some energy for heating purposes. Also the energy intensity of the economy is well above the G20 average. While other G20 countries show a steep decline in energy intensity (-11% between 2012 and 2017), Canada is not showing that much progress: the decline is only 3% in the same period (Climate Transparency, 2018). The projections show a continuation of this decreasing intensity trend. Canada has implemented various efficiency standards for passenger and freight transport, fuel regulations, energy efficiency standards and there are initiatives to advance environmentally sustainable agriculture (Government of Canada, 2017). However, these measures have not been sufficient to be able to stop the increase of the absolute energy demand. One of the pathways in the Mid-Century Scenario aims at the electrification of final energy in combination with non-emitting electricity generation (Minister of the Environment, 2016). This pathway could be one of the possible solutions in order to bring down the Canadian major demand for energy, as electrification of heat engines leads to an overall net improvement in energy efficiency (Le Quéré et al., 2019).
Implemented contributing policies
CO2 standards for new power plants (2012) Efficiency standards heavy-duty trucks (2013) Efficiency standards light commercial vehicles (2004) EcoENERGY efficiency (2011)