DIVERSITY IN PRIVATE EQUITY:
IMPACT ON EXIT
Aantal woorden/ Word count: 16.620
Tazio De Laet
Stamnummer/ student number : 01505902
Promotor/ Supervisor: Prof. Dr. Sophie Manigart
Masterproef voorgedragen tot het bekomen van de graad van: Master’s Dissertation submitted to obtain the degree of:
Master of Science in Business Economics:
Main subject: Corporate Finance
Confidentiality agreement
Permission
I declare that the content of this Master’s Dissertation may be consulted and/or reproduced, provided that the source is referenced.
Student’s name: Tazio De Laet Signature:
Foreword
This master thesis "Diversity in private equity: impact on exit” is the last part of my university career as a student in Master of Science in Business Economics: Corporate Finance at the University of Ghent. At the University of Ghent, I really enjoyed the exceptional speakers, the interesting lessons and the engaging subjects. Think critically, analyse in depth, take nothing for granted and act accordingly. The personal challenge in these exciting and strange times is even greater. The exceptional year 2020 will remain forever in my memory.
After the first contact with Professor Manigart, the choice of this master's thesis was also made quickly. My interest in private equity has only grown and was confirmed by this master's thesis. It's hard to imagine a better step for an interesting career.
First of all, a big thank you to my promotor Prof. Dr. ir. Sophie Manigart. From the start, she was enthusiastic and her thorough knowledge on the subject turned out to be a real incentive. I did learn a lot from her about private equity and the academic research. On top of that, I am thankful for the numerous and swift responses. Her comments were always very welcome and resulted in viable solutions. Many thanks to Jeroen Verbouw for his countless and useful directions. A word of thanks to all the staff of the faculty library and to the secretary for having access to the databases. Last but not least, my mother, my father, my brother and all my friends. I am very grateful for their dedicated support and moral contribution.
June 2020 Tazio De Laet
1 Table of Contents
Confidentiality agreement ... III Foreword ... IV List of Figures ... VII List of Tables ... VII List of Abbreviations ... VIII
1 Introduction ... 1
1.1 Theoretical background ... 1
1.2 Research question ... 3
2 Literature and Hypotheses ... 5
2.1 Private equity investors ... 5
2.1.1 Independent PE ... 5
2.1.2 Bank affiliated PE ... 5
2.1.3 Government funded PE ... 6
2.2 Private equity exits ... 8
2.2.1 Market conditions ... 8
2.2.2 Portfolio company characteristics ... 8
2.2.3 PE fund/firm characteristics ... 9
2.3 Hypotheses ... 10
3 Dataset and Descriptive Statistics ... 14
3.1 Construction ... 14 3.2 Sample verification ... 16 3.3 Descriptive statistics ... 17 3.4 Chi-Square test ... 19 4 Empirical Analysis ... 21 4.1 Variables ... 21 4.1.1 Market characteristics ... 21
4.1.2 Target characteristics ... 21 4.1.3 Deal characteristic ... 22 4.1.4 Sector characteristics ... 22 4.1.5 Missing variables ... 22 4.2 Summary statistics... 24 4.2.1 Exit type ... 24 4.2.2 Market characteristics ... 24 4.2.3 Target characteristics ... 25 4.2.4 Deal characteristics ... 26 4.2.5 Sector characteristics ... 26
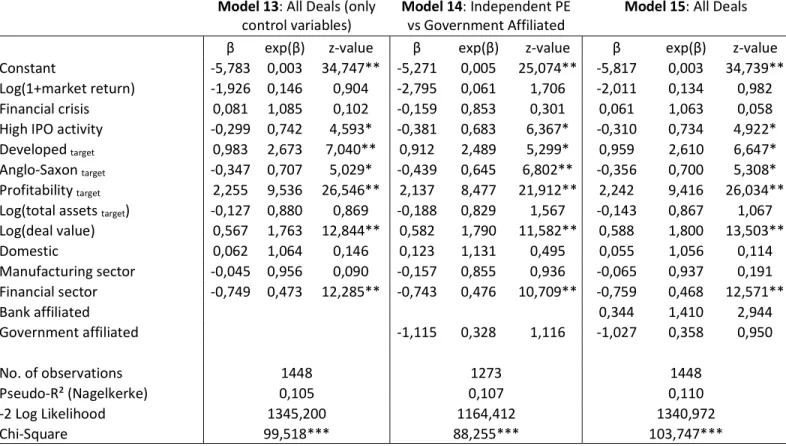
4.3 Binomial logistic regression model ... 30
4.3.1 IPO vs. others ... 31
4.3.2 SBO vs. others ... 34
4.4 Robustness analysis ... 36
5 Discussion ... 40
5.1 Conclusion ... 40
5.2 Limitations and directions for further research ... 42
References ... 44
List of Figures
Figure 1: Exit type by route and year ... 17
Figure 2: Types of exits ... 18
Figure 3: Types of private equity investor ... 18
Figure 4: Types of private equity investor and their proportional exits ... 19
List of Tables
Table 1: Dataset breakdown ... 14Table 2: Descriptives ... 17
Table 3: Chi-Square test ... 20
Table 4: Definitions of the variables ... 23
Table 5: Pearson correlation matrix ... 27
Table 6: Summary statistics ... 28
Table 7: Proportion differences in type of exit for used variables ... 29
Table 8: Binomial logistic analysis of IPO exit ... 33
Table 9: Binomial logistic analysis of SBO exit... 35
Table 10: Robustness analysis of models of IPO exit ... 38
List of Abbreviations
Abbreviation
CLT Central limit theorem
EBITDA Earnings Before Interest, Taxes, Depreciation and Amortisation
GP General partner
i.e. Id est
IPO Initial public offering
LBO Leveraged buyout
LP Limited partner
M&A Mergers & acquisitions
MSCI Morgan Stanley Capital International
NBER National Bureau of Economic Research
PE Private equity
SBO Secondary buyout
SWF Sovereign wealth fund
TA Total assets
VC Venture capital
1 Introduction
With $405 billion in exit value and with $551 billion in deal value from 3.600 buyout deals, private equity (PE) firms represented for 13% of the total M&A market in 20191. Over the past decade, private market assets under management increased by 170% and the number of active PE firms has more than doubled. By comparison, the global public markets assets under management increased with 100%, where the number of US publicly traded companies remained roughly the same2. It is therefore not surprising that the growth of the PE market has led to a surge in the academic research devoted – among others – to the relationship between the PE fund and the company, the heterogeneity among PE investors, legal and institutional frameworks and macroeconomic effects. Recent literature about PE is summarised by Tykvová (2018).
The objective of this thesis is to elaborate on the heterogeneity of the ownership structure of the PE fund and its impact on the exit type chosen. This thesis proceeds as following. This section begins with a description of private equity in general, their operating structure and their divestment alternatives, ending with the heterogeneity of the PE landscape. Next, the research questions as well as the relevance of the thesis are defined. In section 2, the existing academic literature on the PE landscape and the PE exits is described on which the hypotheses are developed. Section 3 contains the dataset and descriptive statistics. Section 4 shows the empirical analysis. Finally, section 5 discusses by giving the conclusion, limitations and future research opportunities.
1.1 Theoretical background
Unlike public equity, private equity is an investment organisation that invests in target companies that are either not listed on a public stock market or that become private as part of the PE investment (Kaplan & Sensoy, 2015). In a typical PE deal – known as a leveraged buyout (LBO) – an existing and mature target company is acquired by a specialized investment firm, using a limited portion of equity provided by the PE fund (30% to 40% of the capital structure), combined with a large portion of external debt financing (Axelson, Jenkinson, Strömberg, & Weisbach, 2013; Ivashina & Kovner, 2011). Some PE deals use less debt and are referred as buyouts. These types of investment are distinct from venture capital (VC) (Kaplan & Strömberg, 2009). VC is associated with the financing of young companies. These investments are focused on early stage companies with high growth potential and high levels of uncertainty (Gompers & Lerner, 2001). For two reasons, the focus of this thesis will only be devoted to (leveraged) buyout investments, which will be called private equity investments. First, it is customary in a VC contract to include intervention rights, which gives the VCs the right to impose
1 Source: Global Private Equity Report 2020 (MacArthur & Dessard, 2020).
an exit from the target company (Cumming, 2008; Kaplan & Strömberg, 2003). Second, venture capitalists plan their exit using stage financing divided into multiple rounds (Bergemann & Hege, 1998; Cornelli & Yosha, 2003; Gompers, 1995). This stage financing also offers exit options for venture capitalists at all financing rounds (Giot & Schwienbacher, 2007).
In a typical PE transaction, we distinguish three types of major players (Fenn et al., 1995). First, the “issuers” are the target companies in which the private equity fund invests. Second, you have the “intermediaries”, representing the private equity firm. And third, the “investors”, who provide capital to the private equity funds3. The capital is attracted by various, mainly, institutional investors such as pension funds, endowments, insurance companies and wealthy individuals (Kaplan & Strömberg, 2009). Most private equity funds are set up as limited partnerships with a typical lifetime of 10 years4, although extensions are possible (Gompers & Lerner, 1999b). In the context of the partnership, the investors are the limited partner (LP) and the private equity managers act as general partner (GP). On behalf of the LP, the GP invests the allocated capital in targets in order to increase their value in a limited period, after which they exit. The investors can hereby monitor the fund’s process without the possibility of involving in the daily management of the fund, if they wish to retain limited liability. Compensation is therefore the most important contractual mechanism for aligning the incentives of the general partner and the limited partner (Gompers & Lerner, 1999a). The general partner is remunerated in three ways. The first part is the annual management fee paid by the limited partner, calculated as a percentage of the committed capital. These percentages differ from one fund to another, with an average of 2% of the capital committed (Kaplan & Sensoy, 2015). Second, the general partners receive carried interest. In most cases, this represents a 20% share of the fund’s profits. Third part of the remuneration structure is made up of transaction and monitoring fees invoiced to the target companies (Kaplan & Strömberg, 2009).
3 It is customary for the intermediaries i.e. the PE firm, to invest their own capital in the fund. Providing at least
1% of the total committed capital (Kaplan & Strömberg, 2009).
1.2 Research question
One of the key elements of the private equity business model is to successfully exit a portfolio company (Gompers & Lerner, 2001; Kaplan & Sensoy, 2015; Neus & Walz, 2005; Schmidt, Steffen, & Szabó, 2010). GPs have a choice of several exit channels when they exit their investments. The literature distinguishes between three successful5 exit routes (Figge, Bauer, Braun, & Achleitner, 2012; Jenkinson & Sousa, 2015; Povaly, 2006; Schmidt et al., 2010): public, private and financial.
(1) The public exit refers to an Initial Public Offering6 (IPO), i.e. a sale of the shares to public investors on the stock market.
(2) A private exit refers to a trade sale, in which the portfolio company is sold to a strategic acquirer, such as an industry peer or competitor of the portfolio company.
(3) A financial exit, i.e. a Secondary Buyout (SBO) refers to the sale of a portfolio company to another financial investor, in particular another PE firm. Technically speaking, some exits should be called tertiary buyouts or quaternary buyouts (and so on), based on previous financial ownership. Regardless of the prior financial ownership, for the remainder of this study we call a financial exit a SBO.
To be complete, bankruptcy has to be seen as a fourth exit option. While it may be considered a necessity, this is a mutually exclusive exit option. On the other hand, write-offs can be considered as a realised return instead of an exit channel. A write-off is not mutually exclusive because it can be exited through another type of exit (Achleitner, Bauer, Figge, & Lutz, 2012). In this thesis, we focus on the three successful exit routes.
Most studies related to PE-backed firms focus mainly on comparing PE-backed target companies to their non-PE-backed counterparts, as if the private equity industry were homogenous, rather than delving into the heterogeneous landscape of PE (Tykvová, 2018). The heterogeneity of the PE landscape can be divided into different categories. Heterogeneity can be based on the PE firm level, such as heterogeneity of experience and reputation (Giot, Hege, & Schwienbacher, 2014). Heterogeneity is also found in the selection of target companies, the way of value-adding and the institutional heterogeneity between VC and PE investors (Tykvová, 2018).
5 The parameters for an exit to be successful is that they are profitable and planned in advance (Gompers, Kovner,
Lerner, & Scharfstein, 2008). While not all trade sales and SBOs can be described as profitable, we assume they are.
6Given the lock-up period of at least 6 months and the difficulty with selling significant stakes at once, an IPO
should be seen as a way to achieve an exit and not as an exit at once. For PE funds, IPOs do not automatically generate quick or certain returns. In practice, a full exit though an IPO can take several months or years (Cao, 2011; Jenkinson & Sousa, 2015).
The heterogeneity of the PE landscape is also found at the level of PE funds. It is this type of heterogeneity that will be studied in this thesis. More precisely this thesis is based on the heterogeneity of the fund's ownership structure. The most common are the independent PE funds, where the fund is financially backed by outside financial sources, mainly institutional investors. Other funds are established by and obtain funding from parent firms such as banks or corporations. Because of the overarching parent, these funds are called captive funds. Other funds are financed by the public market i.e. listed PE funds, by the government or by private individuals (Mayer, Schoors, & Yafeh, 2005; Neckebrouck, 2017; Van Osnabrugge & Robinson, 2001; Wright, Amess, Weir, & Girma, 2009). While the older literature considered the PE market to be homogeneous with a focus on independent PE investors, heterogeneity in the PE landscape is a topic of interest in current research (Tykvová, 2018). The literature has shown the impact of the heterogeneity of PE investor ownership on investment patterns in Germany (Tykvová, 2007) and on the duration of the investment (Verbouw, 2019). In addition, the literature on PE firms/funds, the characteristics of portfolio companies and the market conditions that influence the choice of PE exit is well documented (Figge et al., 2012; Jenkinson & Sousa, 2015; Plagborg-Møller & Holm, 2017; among others). Recent research recognizes that the heterogeneity of differences in PE firms has an impact on behaviour, objectives and time horizons, requiring future research to focus on these differences and behaviour (Wright & Amess, 2017). Although mentioned by Povaly (2006), heterogeneity of buyout funds is often neglected when analysing exit behaviour. This thesis contributes to the existing literature on the choice of exit type by combining it with the literature on the heterogeneity of the ownership structure of the fund, which can lead to different objectives and motives to be interested in PE investments.
To the best of our knowledge, this dissertation is the first to discuss and analyse the potential impact of PE ownership heterogeneity on the exit decision in PE deals. This could be interesting to know for several stakeholders in the divestment process. For the target company, it is useful to understand the reasoning and interests of the different types of PE investors, which can lead to different roles of the investor in the company. Companies could seek for PE investors who focus divestment strategies that are favourable for the company. Companies who expect the need for future follow-up funding could be a good fit to a PE investor who exits though a SBO or IPO, depending if the future funding is with public or private funds. For the GP, the exit decision is one of the most critical choices that they have to make, as the return is made at the time of exit (Cumming & Walz, 2010). Therefore, knowing the impact of the PE investor on the choice of exit should be taken into account when comparing PE funds. Finally, these findings could be interesting for the acquirer of the target company, being a competitor or another PE investor. The understanding of the objectives and priorities as well as divestment patterns of the seller may give the buyer an advantage during negotiations (Povaly, 2006).
2 Literature and Hypotheses
2.1 Private equity investors
Given the heterogeneity of the PE landscape, we distinguish between independent PE, bank affiliated PE and PE funded by governments that, in turn, is divided in government affiliated PE and sovereign wealth funds (SWFs).
2.1.1 Independent PE
Independent private equity will be the main category in this study and for two reasons: First, most of the PE deals to date are backed by independent funds. Based on Thomson Reuters Eikon Private Equity Screener, 67% of all PE investments have been backed by independent PE funds. Second, because most of the research does not subdivide the fund according to their ownership structure and therefore mainly focus on independent PE funds (Tykvová, 2018). This type of fund and its exit choices are therefore the most documented.
In contrast to other PE funds, independent PE funds are financial intermediaries between institutional investors – such as pension funds and insurance companies – and privately held firms (Sahlman, 1990). By playing an active role in the company, the main objective is to maximize the returns for their capital providers and their funds revenues earned via management fees and carried interest (Metrick & Yasuda, 2011; Tykvová, 2007). This makes these funds exit-oriented in order to distribute returns to their investors and develop an attractive exit history for raising future funds (Bruton, Filatotchev, Chahine, & Wright, 2010). To achieve maximum returns, independent PE funds implement high powered incentive structures (Lerner, Hardymon, & Leamon, 2005).
2.1.2 Bank affiliated PE
The bank affiliated PE companies are, in addition to the independent PE companies, the main players in the buyout environment. In literature, there are two types of bank-funded private equity firms (Fang, Ivashina, & Lerner, 2013). The first category is “bank affiliated” private equity deals. Here, the transactions are financed by the private equity division with a bank as the parent company. The bank only invests equity in the target company. A second possibility is that the bank participates in both the equity and the debt of the deal. This type of transactions is called a “parent financed” private equity transaction. Below, we refer to bank affiliated private equity transactions as the combination of the both types.
Besides the financial reasons, the incentives why banks are attracted by private equity activities are legion:
(1) Through loan screening and monitoring, banks obtain private information about the target. Other divisions of the bank may use this information in future transactions. It is also possible that a past or ongoing relationship between the bank and the target has an effect on the investment decision, which leads to positive information synergies between the traditional banking departments and the private equity division (Fang et al., 2013).
(2) Another incentive may be cross-selling, making them the single point of contact for other banking services. PE investments offer cross-selling opportunities to banks to realize future banking revenues, as relationships between banks and it clients increase the likelihood of cross-selling investment banking services (Drucker & Puri, 2005). Banks use relationship building to cross-sell other banking services to firms that receive their VC funding (Hellmann, Lindsey, & Puri, 2008).
(3) Due to the unique position of a parent financed deal, where the bank acts both as a shareholder and as a debtor in the target company, there is a better alignment of the equity and debt investors’ interest. Thereby, agency problems are reduced (Jiang, Li, & Shao, 2010; Meuleman, Wilson, Wright, & Neckebrouck, 2020). In addition, this gives a positive signal to the quality of the transaction to external investors. This certification effect is reinforced in parent-financed deals, where the bank is both an equity investor and a lender (Fang et al., 2013).
2.1.3 Government funded PE
Another type of private equity fund ownership is one that is government funded. This includes government affiliated PE funds and sovereign wealth funds. Due to the different investor dynamics and different policy objectives of the investment, we do not combine government affiliated PE funds with sovereign wealth funds, although both having the same ownership structure.
2.1.3.1 Government affiliated
Government affiliated PE funds are funds created and managed by a firm (entirely) owned by governmental – or public administrative – entities (Cumming, Grilli, & Murtinu, 2017). The rationale for government funded private equity firms is broader than that for independent private equity funds, but they tend to be more passive investors (Neckebrouck, 2017; Tykvová, 2007). The objectives go beyond the financial objectives, which are typically the motivations of private sector investors. During selection, social benefits or localized public benefits such as job creation, innovation and economic
growth in a region will also be considered valuable (Colombo, Cumming, & Vismara, 2016; Faccio & Hsu, 2017; Shleifer, 1998).
2.1.3.2 Sovereign wealth fund
Like government affiliated PE funds, SWFs are state-owned and managed by – or on behalf of – sovereign entities or governments (Dewenter, Han, & Malatesta, 2010; Knill, Lee, & Mauck, 2012). Although the rationale for a SWF is – or can be – different compared to government-affiliated PE funds, since SWFs are set up by governments or states with large reserves to invest. These reserves mainly come from the export of natural resource, but some also have reserves of income from the export of manufactured goods, proceeds of privatisation and foreign exchange reserves (Kotter & Lel, 2011; Makhlouf, 2010).
SWFs often prefer not to disclose their investment objectives (Johan, Knill, & Mauck, 2013). In combination with their association to foreign governments, SWFs are seen as opaque (Kotter & Lel, 2011). Nevertheless, literature has listed different objectives SWFs may pursue:
(1) political and social (Bertoni & Lugo, 2014; Dixon & Monk, 2012; Knill et al., 2012; Kotter & Lel, 2011).
(2) access to strategic resources (Sun, Li, Wang, & Clark, 2014).
(3) maximizing returns (Bahgat, 2008; Gospel, Pendleton, Vitols, & Wilke, 2011).
(4) hedge commodity price volatility to generate stable returns (Bortolotti, Fotak, & Megginson, 2015; Gintschel & Scherer, 2008).
(5) intergenerational savings (Balin, 2010; Bernstein, Lerner, & Schoar, 2013; Jory, Perry, & Hemphill, 2010).
(6) domestic economic development (Bernstein et al., 2013).
For achieving these varied objectives, SWFs invest in a wide range of asset classes, including fixed income vehicles, public equity and private equity, depending on their objective. 60% of SWFs invest in private equity7, which include mostly SWFs with more than $250 billion in assets under management (Wright & Amess, 2017). Of these SWFs investing in PE, 70% invest in buyout stage funds7. It is noteworthy that there are substantial regional differences in the investment of SWFs in PE. With regard of Middle Eastern SWFs, 82% invest in PE, for Asian SWFs it is 76%, for North American SWF 60%, but form European SWFs this is only 29% of SWFs8.
7 Source: Preqin Special Report: Sovereign Wealth Funds 2018 (Preqin, 2018).
SWFs have two ways to invest in PE, either they directly invest in firms or they invest in (independent) PE funds. Here we focus on direct investments, which are done by 7% of the SWFs investing in PE9. Although most SWFs work with recognized intermediaries - rather than direct investments - to invest in PE (Clark & Monk, 2009), direct investments getting more and more important market share in the PE landscape (Wright & Amess, 2017). Indirect investments by SWFs in independent PE funds do not give the SWF direct control over the target company. Generally, this type of investment is made by SWFs seeking an investment strategy with maximum return (Wright & Amess, 2017).
There are two potential benefits for SWFs to invest directly in de target company (Wright & Amess, 2017). First, by investing directly they evade to pay PE firm’s fees, which is, on average, 2% of the total funds committed. Second, SWFs have more control over the management and investment decisions of portfolio firms. This is essential for SWFs aimed at domestic economic development and those buying strategic resources. For this reason, it is mainly development funds that invest directly in PE (Chassany, 2013).
2.2 Private equity exits
Market conditions, factors related to portfolio companies and characteristics of the PE firm/fund are generally accepted as key drivers in deciding the exit type.
2.2.1 Market conditions
Debt and equity market conditions have an impact on the choice between IPO and SBO. The probability of exit via an IPO increases, compared to SBO, when equity markets are rising. On the other hand, when the equity market condition is “cold”, when the liquidity of the debt market increases or there is in increase in the amount of dry powder i.e. undrawn capital commitments, the relative amount of SBOs increases compared to IPOs (Achleitner et al., 2012; Jenkinson & Sousa, 2015; Plagborg-Møller & Holm, 2017; Wang, 2012).
2.2.2 Portfolio company characteristics
There is a lot of evidence on the relation of market characteristics to the choice of exit. However, these are external factors. On the other hand, the characteristics of the portfolio company can be influenced by the PE firm. Its impact on the PE exit route is greater after the global financial crisis of 2007-2009, because this event showed that complexity and uncertainty are higher than previously thought (Plagborg-Møller & Holm, 2017). Leading the attention of PE firms to elements of the business they can influence.
The factors of the portfolio company, such as size, operating performance and debt capacity are found to be predictors of the choice of PE exit. For smaller portfolio companies that experiencing strong growth trade sales are more likely than SBOs (Jenkinson & Sousa, 2015). For an IPO, improving operational performance and profitability is key (Jenkinson & Sousa, 2015; Plagborg-Møller & Holm, 2017). And a portfolio company with greater debt capacity – measured by the level of cash-flow, profitability and capital expenditure requirements – are more likely to exit via a SBO (Achleitner et al., 2012; Jenkinson & Sousa, 2015).
2.2.3 PE fund/firm characteristics
In addition to the characteristics of the market and portfolio companies, a number of articles (Achleitner, Braun, & Engel, 2011; Figge et al., 2012; Wang, 2012) mention that the dynamics at the PE fund and firm level influence the decision-making at the deal-level and performance. Therefore, these fund/firm-level dynamics can also have an impact on the chosen exit route (Figge et al., 2012). 2.2.3.1 Impact of fundraising
New funds are set up by private equity firms about every three to five years. An excellent track record for timely exits and performances of the past is essential for improving a company's reputation and fundraising in the future (Phalippou, 2008). If the GP is in the process of fundraising, the chosen exit route could change. PE firms that are in the process of fundraising for their subsequent fund prefer to exit via an IPO or a SBO, depending on the market and portfolio company characteristics (Figge et al., 2012).
2.2.3.2 Impact of reputation
However, experience and reputation of GPs have an effect on these fund level dynamics, as marginal additional information on the capacity of a GP acquired by LPs from exits decreases (Chung, Sensoy, Stern, & Weisbach, 2012). The dynamics of the funds therefore have more influence on younger GPs i.e. first time funds (Figge et al., 2012). These results of PE investments are in line with the previous results for VCs. Gompers (1996) introduced the term “Grandstanding”. Stating that younger VCs are pursuing an IPO earlier than more established VCs in order to build a reputation, which in turn should improve their prospects for future fundraising.
2.2.3.3 Impact of pressure
The PE exit chosen also depends on the pressure on the seller i.e. the PE fund/firm. If the GP has not been able to leave an investment for a while and therefore distributed relatively little capital to its LPs or the PE fund is approaching the end of its life, an exit via trade sale or SBO is more likely (Figge et al., 2012). These are mainly cash or full exits. On the contrary, IPOs are less likely towards the end of the fund’s lifespan due to the long completion process (Povaly, 2006).
On top, SBOs are likely the quickest way to exit a portfolio company, and thus a preferred exit route when the PE fund/firm is under pressure and encounter high liquidity demands (Arcot, Fluck, Gaspar, & Hege, 2015; Jenkinson & Sousa, 2015; Wang, 2012). Moreover, as a fund nears the end of its lifetime, some portfolio companies may not be ready for an IPO or a trade sale, which can make a SBO attractive (Cumming & MacIntosh, 2003), as it can avoid to ask for an extension of the fund’s life to the LPs (Jenkinson & Sousa, 2015).
2.2.3.4 Impact of specialisation
At last, the level of industry specialisation of the PE firm affects the type of exit chosen. PE firms, specialised in the sector in which the target operates, are more likely to exit through a trade sale (Rigamonti, Cefis, Meoli, & Vismara, 2016). Their expertise and in-depth knowledge of the market allows them to better add value to the target company and to attract potential strategic buyers, whose key objective is generally to integrate the technology or target’s products with their own structure (Camerlynck, Ooghe, & De Langhe, 2005).
2.3 Hypotheses
Based upon the discussion of the literature in the previous section, we derive the following hypotheses. In terms of the financial incentives, bank affiliated private equity deals have poorer financing conditions and ex post results than independent private equity transactions. On the other hand, parent financed private equity deals have better financing conditions than independent private equity transactions. However, do not show better ex post outcomes (Fang et al., 2013). These better financing conditions are mainly at the peaks of the credit market. These better financing conditions reflect the superior timing of the credit market instead of better quality deals or incentive alignment (Fang et al., 2013).
Cyclicality of the PE investments is well documented in literature (Gompers & Lerner, 2000; Kaplan & Stein, 1993; Kaplan & Strömberg, 2009). Still, bank affiliated PE deals may be even more cyclical (Fang et al., 2013). Loan syndication is an extensive process (Ivashina & Sun, 2011), but banks are specialised in this operation. Even independent private equity groups also rely on the banks to align their financing. This confirms the expertise of the banks. In line with the loan screening, monitoring and cross-selling incentive of banks, banks have in-house private equity activities. By exchanging the information between the different banking divisions, banks can fully exploit their superiority in matching credit demand to supply. As mentioned earlier, the choice between exit routes highly depends on market conditions such as debt and equity markets conditions. As the stock markets are “hot”, the use of IPOs increases (Plagborg-Møller & Holm, 2017).
Portfolio companies involved in private equity operations affiliated with banks are larger, more profitable, more liquid, generally have less risks and invest in later stage activities than portfolio companies in independent private equity deals (Mayer et al., 2005; Wang, 2017). In addition, parent financed private equity transactions stand out as having the largest transactions, both in terms of transactions and in terms of firm size (Fang et al., 2013).
These portfolio company characteristics, combined with the fact that they show at best no better ex post results (Fang et al., 2013) and the before mentioned certification effect – giving a positive signal to the quality of the transaction to external investors – is consistent with the results from Tykvová (2007). She finds that private equity operations affiliated with banks often serve as bridge investors, who have a less pronounced role in corporate governance and monitoring of the portfolio companies. As the IPO approaches, they inject money and want to exit soon afterwards, either at the time of the IPO or at the end of the required lock-up period (Bessler & Kurth, 2007).
The high cyclicality, combined with portfolio company characteristics and the bridge investor role of bank-funded private equity investors, leads to our first hypothesis:
Hypothesis 1: The likelihood of a PE-backed company to exit through an IPO is higher when the PE investor is bank affiliated than when the PE investor is independent.
As expected from their broader rationale, government affiliated funds perform worse than their independent counterparts. Literature about VC and government ownership of companies has identified several reasons. Some of them also apply to government affiliated PE. The lower performance can be mainly attributed to the political interference, resulting in a lack of independence in day-to-day decision making, less efficient covenants and worse agency problems. (Cumming, Grilli, et al., 2017; Cumming & MacIntosh, 2007; Dewenter & Malatesta, 2001). Governmental VCs require lower return than independent VCs, indicating that they are prepared to trade in financial objectives for broader public objectives such as employment and development benefits (Manigart et al., 2002). Furthermore, due to a lower level of specialisation, governmental private equity firms have less impact on the value of their portfolio company than independent private equity investors do (Tykvová, 2007). Accordingly, government backed companies have worse exit performance - measured by successful exits - than companies backed by independent funds (Cumming, Grilli, et al., 2017; Kovner & Lerner, 2015; Munari & Toschi, 2015). Notably, mixed VC funds - which are both government affiliated and independent-funded – have better exit performance, but this can be explained by the additional amount invested (Brander, Du, & Hellmann, 2015).
Given the underperformance, worse agency problems and lower financial targets, we argue that companies backed by government affiliated PE are less feasible to go public than those supported by independent PEs.
Hypothesis 2: The likelihood of a PE-backed company to exit through an IPO is lower when the PE investor is government affiliated than when the PE investor is independent.
As noted above PE firms may have incentives for a SBO. However, because of differences in objectives between government funded PE investors and independent PE funds – and bank affiliated funds – some of these motives to exit via SBO do not apply for government affiliated PE funds and sovereign wealth funds.
(1) Exploit favorable debt and equity markets (Jenkinson & Sousa, 2015; Wang, 2012). We argue that, because they are less focused on maximizing financial returns, they are less covetous to exploit favorable debt and equity markets.
(2) Selling to another PE funds contains the lowest risks regarding regulatory issues and has the shortest delay in receiving the proceeds (Jenkinson & Sousa, 2015). Therefore, pressured sellers and sellers with high demand for liquidity are more likely to exit through SBO (Arcot et al., 2015; Wang, 2012). These factors are less in play for government funded PE investors10. Government-funded PE funds have an infinite lifetime, which make them less pressured to leave investments. In addition, because there are no plans to raise funds on the market, establishing a reputation is not considered as a priority (Balboa & Martí, 2007).
The broader objective of government affiliated PE funds may have an impact on their target selection. The main goal of independent PE companies is to maximize returns for their capital providers. Government affiliated PE companies on the other hand also consider the contribution in the development of regions or industries, which are less attractive to independent PE companies (Balboa & Martí, 2007). We argue that these differences in target and market characteristics negatively impact the attractiveness of these investments for other PE investors.
Like government affiliated PE – and in contrast to independent PE – SWFs have more than solely financial objectives. This results in different target selection, resulting in differences in target and market characteristics. Previous literature on institutional investors investing in PE cannot be used for SWFs as their investment patters are dissimilar (Johan et al., 2013). In contrast to other investors, SWFs
10 Cumming, Wood, Filatotchev, & Reinecke (2017) address the potential demand for liquidity for SWFs
dependent on oil revenue when oil prices plummet. They may feel pressure to divest their investments to help fill the states budgetary deficit. Although research needs to be carried out on the effects of SWFs dependent on oil revenue on their divestment behaviour.
are more inclined to invest cross-borders, they don’t seek investors protections by investing in countries with high investor protection and political relations influence the probability of PE investments (Johan et al., 2013). Overall, SWFs prefer large, underperforming companies facing financial difficulties, but which enjoy significant external visibility (Fernandes, 2014; Kotter & Lel, 2011). Moreover, they favour companies in strategic sectors and companies operating in countries with sustainable economic growth and weak legal and institutional environments (Boubakri, Cosset, & Grira, 2017).
Government affiliated PE funds and SWF have fewer incentives to exit through a SBO. Moreover, because of differences in target selection, we believe that the targets are less “fitted” for a SBO. Leading to following hypotheses:
Hypothesis 3a: The likelihood of a PE-backed company to exit through a SBO is lower when the PE investor is government affiliated than when the PE investor is independent.
Hypothesis 3b: The likelihood of a PE-backed company to exit through a SBO is lower when the PE investor is a sovereign wealth fund than when the PE investor is independent.
3 Dataset and Descriptive Statistics
3.1 Construction
The sample used for the empirical analysis is extracted from the Zephyr (Bureau van Dijk) database11. In order to assign the type of each private equity investor, this sample has been linked to the Thomson Reuters Eikon Private Equity Screener.
As the exit route is an essential variable in our analysis, the data are collected according to their exit type. The result is three separate datasets, one for each type of exit. In order to leave aside the announced or assumed deals, only those deals that where completed and confirmed are included in the dataset. This ensures that the extracted deals all have correct and assured exit dates, vendors, targets and acquirers. Since the lead investor has a primary role to play, to influence and to guide decision making, we refer exclusively to the lead investor in syndicated deals. (Barry & Barry, 2010; Gorman & Sahlman, 1989; Meuleman, Wright, Manigart, & Lockett, 2009).
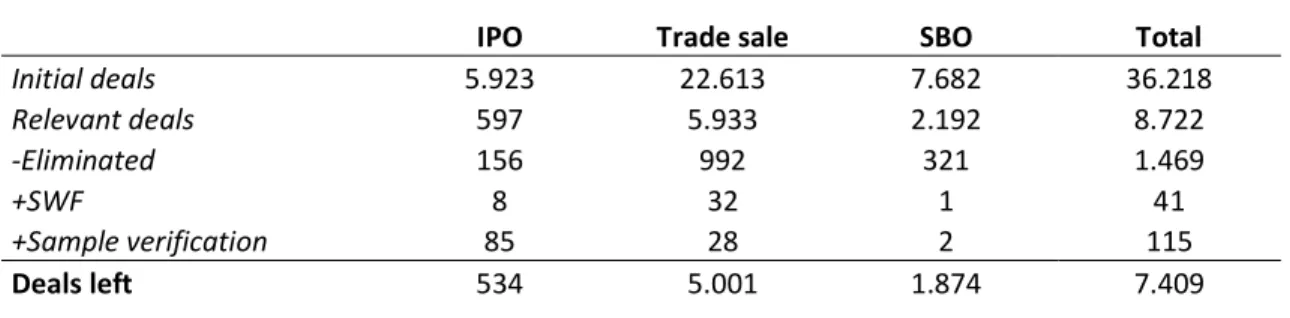
This resulted in three datasets consisting of 5.923 potential IPOs, 22.613 potential trade sales and 7.682 potential SBOs. Table 1 shows a brief overview of the data construction. A more extensive overview per type of exit can be found in the attachments.
Table 1: Dataset breakdown
IPO Trade sale SBO Total
Initial deals 5.923 22.613 7.682 36.218 Relevant deals 597 5.933 2.192 8.722 -Eliminated 156 992 321 1.469 +SWF 8 32 1 41 +Sample verification 85 28 2 115 Deals left 534 5.001 1.874 7.409
To extract the IPOs from Zephyr, only those deals have been selected, which have been exited by an IPO and whose targets are funded by a PE or VC investor. This results in 5.923 potential IPOs. In 411 deals, Zephyr describes the lead investor’s primary business description as private equity, in this case the vendor is assumed to be effectively being a private equity investor. In addition, the dataset is linked to the Thomson Reuters’ Eikon Private Equity Screener to include these deals, where Zephyr describes the vendor as a company, a fund, etc. This is important, considering that Zephyr is not consistent with the “vendor name”. For some deals, the private equity firm is mentioned and in other transactions, it designates the private equity fund as the vendor. For this reason, we link the vendor name in Zephyr to the names of the companies in the Thomson Reuters Private Equity Screener, where we collected
data on the target company, the firm and fund type. The addition of 186 deals to the initial dataset results in a subset of 597 relevant deals with an IPO as the type of exit. Although a link of these deals to the Thomson Reuters Eikon database is required to identify the type of these PE investors.
In order to collect the deals with trade sale as the exit type, a Zephyr dataset is extracted using following restrictions; only – completed and confirmed - exited deals, where the acquirer is a company, where selected. The resulting dataset includes 22.613 potential trade sales. Deals in which the acquirer is a financial institution are by definition no trade sales and are excluded from the dataset i.e. an exclusion of 5.812 deals. To eliminate partial exits, and to know the type of exit, only the deals whose deal type is indicated as “acquisition” are kept in the data, which eliminates 3.797 deals. As mentioned above, if Zephyr describes the lead investor’s primary business description as private equity, the vendor is assumed to be effectively a private equity investor. For the same reason as for IPOs, the dataset is linked to the Thomson Reuters Eikon Private Equity Screener to include deals in which Zephyr describes the vendor as a company, fund, etc. These results in 5.933 deals exited through a trade sale, although a link to Thomson Reuters Eikon is required to identify the type of PE investor.
To select the SBOs from Zephyr, a dataset is extracted, including the competed and confirmed deals, the type of sub-deal is equal to secondary buyout, tertiary buyouts, quaternary buyout and quinary buyout, because we use SBO as an umbrella term for these exit routes. The resulting dataset contains 7.682 deals. Partial exits (668 deals) and exit new stake (206 deals) were omitted. According to the definition, an exit is considered a SBO only if both the vendor and the acquirer are private equity firms. Including deals in which both the vendor and the acquirer are labelled in Zephyr as private equity, as well as deals in which both the vendor and the acquirer are labelled as private equity after linking the data to the whole Eikon dataset. This excludes 4.616 deals from the dataset. Resulting in 2.192 deals exited through a SBO. However, a link to Thomson Reuters Eikon is required to identify the type of PE investor.
For the purpose of assigning the correct type to each PE investor, the Thomson Reuters Eikon Private Equity Screener has been consulted. Even if Zephyr provides some investor type information, it is impossible to properly classify all private equity companies, based on the types that will be used. Zephyr can describe the private equity firm as either an "Investment Services", a "Fund" or as an "Investor". Not all types of PE are available in the Zephyr database; for example, a government-affiliated fund is not available as a type of category.
Out of the 8.722 deals concerned (597 IPOs, 5.933 trade sales and 2.192 SBOs), 386 vendors are labelled differently from private equity investors, 130 are labelled as corporate PE firm/fund and 953 vendors are not found in Eikon.
To take the SWFs into account, a fourth dataset was extracted from Zephyr, as the “sub-deal type” represents both the exit route and the SWF variable. The dataset includes all the deals done by sovereign wealth funds and includes 1.998 deals. This dataset contains all types of deals in which a SWF was involved, including capital increases, partial exit, etc. After subtracting the deals where the SWF completely exited through IPO, trade sale or SBO, 41 sovereign wealth fund deals could be added to the dataset (8 IPOs, 32 trade sales and 1 SBO).
3.2 Sample verification
During the construction of the dataset as described above, the linking of the Zephyr dataset to the Eikon Private Equity Screener was done based on the vendor names. In order to verify this data and to reduce wrongly linked names, a manual cross-check was performed. Where Zephyr qualifies the vendor’s primary business description as private equity, but there was no-to-on one link to the Eikon Private Equity Screener data, a comprehensive manual examination was performed. In the case that Zephyr qualifies a vendor as private equity, but this firm/fund is not found in the Eikon dataset, then it is not possible to verify the type of investor. These deals are not included in our dataset.
A manual investigation of the deals that included a one-to-one link from the Zephyr data to the Eikon data identified 37 deals that were incorrectly labelled as corporate PE. A cross-check on the PE company website stated that they are independent PE firms, and are therefore considered to be independent PEs in our dataset. On the other hand, 12 deals were incorrectly labelled as independent PE. 10 PE firms are considered as bank-affiliated and 2 are government-affiliated.
In addition, the dataset has been cross-checked with the entire IPO database extracted from Zephyr. The first dataset includes only IPOs of deals where Zephyr has identified the vendor as a PE or a VC. As already mentioned, Zephyr describes some PE investors as a fund, investment service, investor, etc. As a result, the dataset has been cross-checked with the entire IPO database extracted from Zephyr. This dataset has been linked by vendor name to the Eikon Private Equity Screener. Another 84 deals were added to the dataset, of which 11 are bank affiliated, 2 are government affiliated and 71 are independent PEs.
As the name used in Zephyr and Eikon is sometimes different in the case of government affiliated PE firms, it is necessary to manually review the Eikon data compared to the Zephyr data. 31 deals are added to the dataset: 1 IPO, 2 SBOs and 28 trade sales.
3.3 Descriptive statistics
Table 2: Descriptives
Panel A: General dataset information
Number of deals 7.409 Number of vendor countries 59
Number of deals by 5% vendors 2.600 Number of target countries 85
Number of vendors 1.953
Number of targets 7.189
Panel B: Overview exit type by type of PE investor
Independent PE Bank affiliated Government affiliated wealth fund Sovereign Total
Trade Sale 4.443 423 103 32 5.001
SBO 1.692 175 6 1 1.874
IPO 454 63 9 8 534
Total 6.589 661 118 41 7.409
The dataset includes 7.409 deals over a 23-year period. The oldest deal in the dataset dates to 1997, the most recent to 2020. Figure 1 shows the different types of exit during the period 1997-202012. The exits were carried out in 7.189 different target companies and 1.953 different PE firms/PE funds participate in these deals. The dataset has global coverage both in terms of target resp. vendor's country. The target companies are in 85 different countries, resp. the vendors are in 59 different countries.
Figure 1: Exit type by route and year
Figure 2shows the distribution of the types of exit in our dataset: 5.001 deals were exited through a trade sale, which represents 67,50% of the total dataset. SBOs are represented by 1.874 deals (25,29%). These can be subdivided into secondary buyouts which represent 1.585 deals, tertiary
12 2020 includes deals until 29th of January. 0
100 200 300 400
buyouts for 237 deals, quaternary buyouts for 47 deals and quinary buyouts for 6 deals13. 534 deals were concluded by an IPO, which represents 7,21% of our data14.
Figure 2: Types of exits
Given the objective of this thesis - to determine whether the diversity in the current PE landscape has an impact on the exit of PE investments - this section of the thesis focuses on this diversity in the sample. This heterogeneity between PE investors, based on the ownership structure, will be described. First, it describes the different types of PE investors and their respective investment exits.
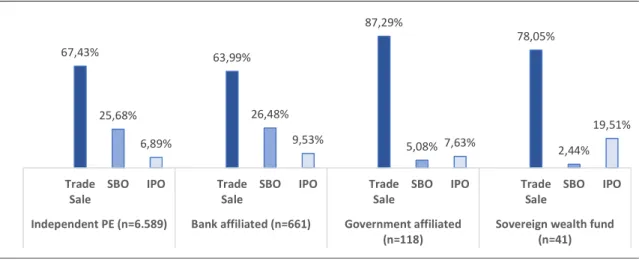
In Figure 3, the different types of PE and their respective allocation in the sample are presented. With 88,93% of all deals, independent private equity investors represent most deals. Bank affiliated private equity investors are represented for 8,92% of the deals in the dataset, followed by government affiliated investors (1,59%) and finally Sovereign Wealth Funds (0,55%).
Figure 3: Types of private equity investor
13 In this thesis SBOs are not subdivided into different exit types according to the number of previous PE
ownership, because all the tertiary, quaternary and quinary buyouts in the dataset were carried out by independent PE firms.
14This distribution in the type of exits from PE investors is in line with the results in the Global Private Equity
report 2020 of Bain & Company (MacArthur & Dessard, 2020). 67,50%
25,29%
7,21%
Trade Sale Secondary Buyout Intitial Public Offering
88,93%
8,92%
1,59% 0,55%
Figure 4 gives a first - albeit premature and incomplete - indication of the impact of the type of PE investor on the chosen exit route. While the exit type for independent and Bank affiliated PE firms has a comparable distribution, the amount of SBOs is lower for government affiliated PE firms and SWFs. In the case of the government affiliated PE firms, the lower amount of SBOs is apparently offset by a higher volume of trade sales. As the number of IPOs does not seem to be in line with independent or bank affiliated PE firms. Note that this figure has no statistical or explanatory value. Although we see a considerable increase in the relative number of IPOs and a relatively small number of SBOs for sovereign wealth funds. We stress that this figure is made up of 41 SWF deals, including 8 IPOs and only 1 SBO.
Figure 4: Types of private equity investor and their proportional exits
3.4 Chi-Square test
After a first look at the distribution of the types of exit in relation with the type of investor, we have signs that not all private equity investors use the types of exit with the same frequency. In order to provide evidence, statistical analysis is required to determine the differences in exit strategy more in depth. We use the non-parametric Pearson Chi-Square test, as both the dependent and the independent variables are nominal. The assumption of less than 20% of the expected count less than 5 is fulfilled (Moore, McCabe, & Yates, 1999), because there is 1 cell (i.e. 8,3%) with an expected count less than 5% in our test. The Chi-Square tests the null hypothesis, according to which the relative proportion of the type of exit, is independent of the type of PE investors. Table 3 presents the key statistics from the Pearson Chi-Square test. A Pearson Chi-Square was calculated by comparing the frequency of the exit type for different types of PE investors. A significant interaction was found (χ2 (6, N = 7049) = 51,514, p <0.01), so we can reject the null hypothesis that the type of exit is independent of the type of investor.
67,43% 25,68% 6,89% 63,99% 26,48% 9,53% 87,29% 5,08% 7,63% 78,05% 2,44% 19,51% Trade Sale
SBO IPO Trade
Sale
SBO IPO Trade
Sale
SBO IPO Trade
Sale
SBO IPO
Independent PE (n=6.589) Bank affiliated (n=661) Government affiliated
Table 3: Chi-Square test
Independent
PE Affiliated Bank Government Affiliated Wealth Fund Sovereign
Trade Sale Count 4.443 423 103 32
Expected Count 4.447,5 446,2 79,6 27,7
Adjusted Residual -0,36 -2,02 4,63 1,45
P-Value 0,7189 0,0434 0,0000 0,1471
Secondary
Buyout Count Expected Count 1.666,6 1.692 167,2 175 29,8 6 10,4 1
Adjusted Residual 2,16 0,73 -5,09 -3,38 P-Value 0,0308 0,4654 0,0000 0,0007 Initial Public Offering Count 454 63 9 8 Expected Count 474,9 47,6 8,5 3 Adjusted Residual -2,99 2,42 0,18 3,06 P-Value 0,0028 0,0155 0,8572 0,0022
However, we have carried out 12 (3x4) separate analyses, so we do not know for which combination(s) of these variables we have significant statistics. We just know that, overall, we have a significant statistical result. We must perform a post-hoc test to find the significant differences in this Chi-Square. Table 3 shows the adjusted residuals for each combination. This adjusted standardized residual is a Z-score. However, these results are before Bonferroni's correction. We are at increased risk of type 1 error, finding a difference when there is no difference (Beasley and Schumacher, 1995). Therefore, we cannot interpret based on these adjusted residuals (Z-scores). First, we must convert them to probability values. According to the Bonferroni correction, the p-value of 0,05 needs to be adjusted by those 12 analyses. This gives us an adjusted p-value of 0,0042. The Z-scores are transformed into their respective p-values. By comparing Bonferroni's adjusted p-value to the individually calculated p-values, we conclude that five combinations are statistically significant:
(1) Independent PE – Initial public offering (2) Sovereign Wealth Fund – Initial public offering (3) Government affiliated – Secondary buyout (4) Sovereign Wealth Fud – Secondary buyout (5) Government affiliated – Trade sale
4 Empirical Analysis
4.1 Variables
A list of the variables used in the bivariate analysis and the regression analysis, along with their descriptions, is presented in Table 4.
4.1.1 Market characteristics
We take into account the characteristics of the market at the time of exit by controlling the performance of the local market, the financial crisis and the IPO activity (Achleitner et al., 2012; Cumming, Grilli, et al., 2017; Giot & Schwienbacher, 2007; Jenkinson & Sousa, 2015; Rigamonti et al., 2016). As the local market yield, we use the Morgan Stanley Capital International yield (MSCI yield) in the last 3 months prior to exit15. MSCI is a free float-adjusted market capitalisation weighted index used to monitor the state of the stock market at the time of exit (Armour & Cumming, 2006; Cressy, Munari, & Malipiero, 2007). We also include a dummy variable for the financial crisis, which reflects the effect of the financial downturn of the previous decade. This is added to control the macroeconomic environment. Referring to the National Bureau of Economic Research (NBER) Business Cycles, this variable covers the period from August 2007 to December 2009. Additionally, we include a reference for the stock market liquidity. More precisely, the number of IPOs executed on the major US stock exchanges (NASDAQ, NYSE and AMEX) in a given year. This variable is considered important in the analysis of the decision on the exit route from the VC (Ball, Chiu, & Smith, 2011). IPO activity data is extracted from Jay Ritter’s web page16.
4.1.2 Target characteristics
To consider the characteristics of the target company, we include the following variables in our analysis: Developed, Anglo-Saxon, Profitability target, Size target and Leverage target. Following the work of Johan & Zhang (2016) on the exit route decision on emerging markets, we include a dummy variable for the market development. Developed regions include Western Europe, North America and Oceania (Manigart, De Prijcker, & Bose, 2009). A dummy Anglo-Saxon is included to take into account the less liquid and less equity oriented capital markets in non-Anglo-Saxon regions (Povaly, 2006; Wood & Demirbag, 2012). The financial figures – profitability, size and leverage – of the portfolio company on exit are included. The profitability of the portfolio company is defined as EBITDA divided by total assets at the exit date. We take into account the size of the target in terms of total assets (TA) at exit. To deal
15 Source: www.msci.com
with outliers, the logarithm of the total assets is used. The leverage of the portfolio company is defined by dividing the difference between the target's total assets and the net assets by its EBITDA.
4.1.3 Deal characteristic
In accordance with the previous literature, we include the characteristics of the following deals as control variables: the deal value and the domestic investments. The larger the company, the more likely they exit through an IPO by virtue of relatively lower direct, administrative and indirect, underpricing costs (Pagano, Panetta, & Zingales, 1998). We include the deal value as recorded by Zephyr, also containing the deals values which cannot be confirmed via the company file or the company press release. In further analysis, the logarithm of deal value is used. To control the distance between the PE investor and the target company, we control domestic investments.
4.1.4 Sector characteristics
Previous studies have examined industry-related factors that influence the choice of the exit method. Therefore, the industrial sector of the target company is considered in the analysis. The industries are classified according to their NACE Rev. 2 code, which gives a statistical classification of economic activities. Only the sectors that have been shown to influence the exit decision are included in the continuation of this thesis. The sectors included are the manufacturing sector and financial sector. Since SBOs are more likely in the manufacturing sector (Wright, Robbie, & Albrighton, 2000) and trade sales are more likely in the financial sector (Brau, Francis, & Kohers, 2003).
4.1.5 Missing variables
This dataset allows for an analysis of the different types of private equity investors on the exit patterns. Unfortunately, it is not possible to consider all the possible explanatory variables. Although relevant, we have chosen not to control the holding period of the investment and of the participation acquired by the PE investor, as this would require linking the exit data to the entry data. This could not be done easily and would mean a loss of deals of which the type of exit and the type of investor could be identified. In addition, due to the absence in the Zephyr and Thomson Reuters Eikon database, the type of fund – closed or open type – and the evergreen characteristics of the fund could not be controlled. Despite their importance in previous literature, we are not able to control the characteristics of PE firm/fund such as the size, age, fundraising and the syndication of PE funds. The inclusion of these variables would lead to biased data, since Zephyr is not consistent in the labelling of PE investors. In some cases, the PE firm is mentioned, as in other cases, the PE fund is indicated as the vendor. The comparison of these various variables (i.e. firm data and fund data) would lead to biased results in the analysis and is therefore excluded.
Table 4: Definitions of the variables
Variable Name Description
Exit type
Trade sale One, if the PE investor exited though a trade sale.
SBO One, if the PE investor exited through a SBO.
IPO One, if the PE investor exited through an IPO.
Investor Type
Bank affiliated PE One, if the PE investor is bank affiliated. Government affiliated PE One, if the PE investor is government affiliated. Sovereign wealth funds One, if the PE investor is a sovereign wealth fund. Market Characteristics
Log(1 + market return) The logarithm of the country-specific Morgan Stanley Capital International Stock Market Index (MSCI) over a period of three months before the moment of exit.
Financial crisis One, if the exit occurs over the period August
2007-December 2009. Financial crisis period defined according to the NBER Business Cycles.
IPO activity The number of IPOs done in a given year on the most important US stock markets (NASDAQ, NYSE and AMEX). Portfolio Company Variables
Developed One, if the portfolio company is situated in a developed region, which includes Western Europe, North America and Oceania.
Anglo-Saxon One if the portfolio company is situated in an Anglo-Saxon country, which includes United Kingdom, United States, Canada, New Zealand, Australia and Ireland.
Profitability target A measure for the profitability of the portfolio company. Defined by dividing the target’s EBITDA by its total assets at the exit date.
Log(TA target) A measure for the size of the portfolio company, defined by the logarithm of the total assets at the PE exit date.
Leverage target A measure for the leverage of the portfolio company, defined by dividing the difference between the target's total assets and net assets by its EBITDA at exit.
Deal Characteristics
Log(deal value) The logarithm of the deal value as registered by Zephyr, also containing the deal values that cannot be confirmed via company filing or company press release.
Domestic One, if the target county equals the country of the PE investor, based on their headquarters location. Sector Characteristics
Manufacturing sector One, if the portfolio company is operative in the manufacturing sector.
Financial sector One, if the portfolio company is operative in the financial sector.
4.2 Summary statistics
Table 5 presents the Pearson correlation matrix, Table 6 the summary statistics and Table 7 the proportional differences in the types of exit for the dummy variables used.
In Table 6, three bivariate analyses for each variable in our data set are included. As with the hypothesis, independent PE investors serve as the base type. We are testing whether the variable means - for the non-dummy variables - or the variable proportions - for the dummy variables - differ between the base type, i.e. independent PE, and the other types of investors. For non-dummy variables, the differences in means were tested using the independent samples t-test. The mean test is the standard test for two samples and based on the t-distribution, if the population distribution is normal. This normal distribution can be assumed using the central limit theorem when N ≥ 30. For one analysis, which shows a significant difference in the means, the CLT cannot be used and is indicated in Table 6. Before the interpretation of the significance, we checked whether both groups have equal population variances using Levene's test on 5% significance level. For dummy variables, the difference in proportions is tested using the Chi-Square test if the assumption of less than 20% of the expected counts is less than 5 is met, otherwise Fisher’s exact test is used. The analyses for which the Fisher’s exact test is used are labelled.
4.2.1 Exit type
As already mentioned above, there is a significant difference in the proportions of exit types between PE investors. Now it is calculated relative to the base type, independent PE investor, instead of comparing it to the entire sample. Bank affiliated investors exit their investments, on average, 3% more often through an IPO than independent investors. However, there are 3% less trade sales. The difference in proportion observed for the IPO is significant at the 5% level, while the difference in trade sale is not significant. For government affiliated investors, the proportional differences in type of divestment are more pronounced. They exit on average 20% more often through a trade sale and 21% less often through a SBO, compared to independent PE investors. Both observations are significant at the 1% level. Although with only 41 sovereign wealth funds deals in our sample, we find that – with a significance level of 1% – they exit on average 23% less often through a SBO and on average 13% more often through an IPO than independent PE investors.
4.2.2 Market characteristics
Looking at the market returns for a period of three months before exit, we observe that all PE investors generally divest from their portfolio companies as the stock markets rise, with no significant differences between the types of investors. What is perhaps more surprising is the uneven proportions of exits during the financial crisis. We can clearly see that bank affiliated investors, as well as sovereign
wealth funds, divested more investments during the financial crisis from August 2007 to December 2009. Bank affiliated investors exited, proportionally, 3% more during the financial crisis than independent PE investors. The financial crisis hit for bank affiliated PE investors is also observed by the lower number of bank affiliated deals compared to all PE deals during the financial crisis (Fang et al., 2013). Although the test does not meet the requirement to use the Chi-Square test, sovereign wealth funds have proportionally 11% more exit during the financial crisis than independent PE investors, which is significant at the 5% level in using the exact Fischer test. As shown in Table 7, the financial crisis - ceteris paribus – has led to a change in the type of exit used. On average, we identify a drop in the proportion of IPOs with 5.61%. On the other hand, the share of trade sales increased by 6.19%. Both results are significant at the 1% level. The financial crisis has no significant statistical impact on the proportion of SBOs. The negative impact of the financial crisis on the likelihood of an IPO is in line consistent with Rigamonti et al. (2016). Although the significant increase in the likelihood of a trade sale is not found in the previous literature. The difference in means for IPO activity is not significantly different from that of bank or government affiliated investors compared to independent PE investors. We observe a difference between SWF and independent PE investor, but we think this could be explained by the higher amount of SWF exit during the financial crisis.
4.2.3 Target characteristics
When examining the characteristics of the target company, we mainly notice differences in the location and the size of the target companies across different types of PE investors.
Not surprisingly, given the different motivations for being interested in PEs, their target investment regions show significant differences compared to independent PE investors. For the latter, 93% of their investments are in developed countries. On average, this is 2% more than bank affiliated investors, 11% more than those affiliated with the government and 64% more than sovereign wealth funds. Given the nature and country of origin of sovereign wealth funds who directly invest in PE – which are mostly from the Middle East or Asia – their target investment regions differ significantly from independent PE investors. Ceteris paribus, the region where the target is located also affects the type of exit used. On average, investments whose target is in less developed regions have 16% more IPOs than developed regions. On the other hand, the share of trade sales fell by 5% and that of SBOs by 11%. These proportional differences in divestment strategies between different markets are partly consistent with previous findings that SBOs are less common in less developed PE markets like in Asia and that a more corrupt environment increases the probability of an IPO for PE investments. (Cumming, Fleming, Johan, & Takeuchi, 2010; Johan & Zhang, 2016). The same conclusions can be drawn by examining the Anglo-Saxon variable.