Report 601450021/2010
J.B.H.J. Linders | A.M.A. van der Linden | Y.J. Stienstra
Surface water intended for the
abstrac-tion of drinking water after use of plant
protection products on hard surfaces
RIVM report 601450021/2010
Surface water intended for the abstraction of drinking
water after use of plant protection products on hard
surfaces
Evaluation of plant protection products
J.B.H.J. Linders, RIVM A.M.A. van der Linden, RIVM Y.J. Stienstra, Ctgb
Contact: Jan Linders
Expertise Centre for Substances
Jan.Linders@rivm.nl
This investigation has been performed by order and for the account of the Ministry of Housing, Spatial Planning and the Environment, within the framework of the project ‘Risicobeoordelingsmethodologie’.
Preferred reference:
Linders, JBHJ, AMA van der Linden, YJ Stienstra, (2010). Surface water intended for the abstraction of drinking water after use of plant protection products on hard surfaces. Evaluation of plant protection products. RIVM Report 601450021, Bilthoven, the Netherlands.
© RIVM 2010
Parts of this publication may be reproduced, provided acknowledgement is given to the 'National Institute for Public Health and the Environ-ment', along with the title and year of publication.
Abstract
Surface water intended for the abstraction of drinking water after use of plant protection products on hard surfaces
Evaluation of plant protection products
The presence of active substances of Plant Protection Products (PPP) in surfaces water has been shown to occur above acceptable drinking water limits. Therefore, the Dutch registration authorities were urged by the judge to take this situation into account in making decisions on the authorisation of PPPs. To protect the production of drinking water, an evaluation instrument has been developed to estimate the concentration of PPPs in surface water after application on hard surfaces. Up to now such a meth-odology was lacking in the evaluation system for the Dutch authorisation process of active substances based on the EU-Directive 91/414/EC.
The proposal described in this report contains a decision making scheme with a tiered approach. The basis is the assumption that a relation exists between the application of PPPs on hard surfaces and the established concentration in receiving surface waters to prevent residues of active substances in drink-ing water. The method may be used to evaluate whether drinkdrink-ing water prepared from surface water contains too high residue concentrations of these active substances.
To, finally, come to a good estimate of the Predicted Environmental Concentration (PEC) of an active substance in surface water several assumptions have to be made, for instance :
• the application method used takes place according to a predefined protocol; • the dose applied on hard surfaces is correct;
• the total area in the Netherlands to which the substance is applied is based on data available in the Netherlands; and
• the catchment areas of the water courses to the intake points of the water works can be based on county data in the Netherlands.
These assumptions have been checked against the results of the case of glyphosate.
Now experience has to be gained with this new methodology in applying the system to new substances that could be used in the Netherlands on hard surfaces. Recommended potential improvements are to take into consideration in the evaluation the use of specific characteristics of the substance, like sorp-tion and degradasorp-tion. It is also recommended to develop an EU-wide equivalent of the method compa-rable with this Dutch proposal.
Key words: risk assessment, authorisation, plant protection products, hard surfaces, surface water, run-off, drinking water, glyphosate
Rapport in het kort
Oppervlaktewater bestemd voor drinkwater na toepassing van gewasbeschermingsmiddelen op verhardingen
Beoordelingsmethode voor gewasbeschermingsmiddelen
In oppervlaktewater is de aanwezigheid van actieve stoffen van gewasbeschermingsmiddelen in con-centraties boven acceptabele drinkwaterniveaus vastgesteld. Daarom zijn de Nederlandse registratie- autoriteiten door de rechter gedwongen deze situatie nadrukkelijk in de toelatingsbeslissing te betrek-ken.
Om de drinkwatervoorziening te beschermen is een instrument ontwikkeld om de concentraties van gewasbeschermingsmiddelen in oppervlaktewater te schatten na de toepassing op verhardingen. Tot nu toe bestond een dergelijke methodiek nog niet in het Nederlandse beoordelingsinstrumentarium voor de toelating van gewasbeschermingsmiddelen op basis van de EU-Richtlijn 91/414/EC.
Het voorstel beschreven in dit rapport behelst een beslisboom met een getrapte benadering. De basis vormt de veronderstelling dat er een relatie bestaat tussen de toepassing van gewasbeschermingsmidde-len op verhardingen en de gevonden concentratie in ontvangende oppervlaktewateren. De methodiek kan worden gebruikt om te beoordelen of drinkwater bereid uit dit oppervlaktewater een te hoge con-centratie residuen van deze middelen bevat. De ervaringen met een bestaande actieve stof, glyfosaat, zijn gebruikt om te anticiperen op evaluaties voor nieuwe stoffen.
Om uiteindelijk te komen tot een goede schatting van de waterconcentratie van een actieve stof zijn verscheidene veronderstellingen gedaan voor onder andere:
• de toepassingstechniek van het middel geschiedt volgens vastgesteld protocol; • de dosering op verhardingen is correct;
• de totale oppervlakte in Nederland waarop de stof wordt toegepast wordt gebaseerd op gege-vens in Nederland;
• het ontvangende stroomgebied voor een bepaald drinkwateronttrekkingspunt voor de drinkwa-tervoorziening wordt gebaseerd op gemeentelijke gegevens in Nederland.
Deze veronderstellingen zijn gecontroleerd aan de hand van de resultaten verkregen met de voorbeeld-stof glyfosaat.
In de komende tijd moet ervaring worden opgebouwd met de nieuwe methodologie door het system toe te passen op nieuwe stoffen die in Nederland gebruikt kunnen worden op verhardingen. Een van de aanbevolen potentiële verbeteringen is om het gebruik van specifieke eigenschappen van een bepaalde stof, zoals adsorptie en afbraakgegevens, in de beoordeling te betrekken. Ook wordt aanbevolen een EU-methodiek te ontwikkelen, vergelijkbaar met dit Nederlandse voorstel.
Trefwoorden: risicobeoordeling, toelatingsprocedure, gewasbeschermingsmiddelen, verhardingen, op-pervlaktewater, afstroming, drinkwater, glyfosaat
Preface
The National Institute for Public Health and the Environment has been requested by the Netherlands Ministry of Housing, Spatial Planning and the Environment to develop an assessment methodology for drinking water production from surface waters in the Netherlands to be used in the authorisation proce-dure of plant protection products (PPP). With the publication of the report ‘Development of an assess-ment methodology to evaluate agricultural use of plant protection products for drinking water produc-tion from surface waters’ (Adriaanse et al., 2008) only one part of the decision process for PPPs in their threat of drinking water production is covered. The second part, related to the protection of drinking water from the contamination by the application of PPPs on hard surfaces, part of the amenity use of PPP, will be dealt with in this report.
In addition the need for the development of an evaluation method within the authorisation process of plant protection products, for surface waters intended for the abstraction of drinking water, is stressed by the court case of glyphosate in the Netherlands.
In many ways this report should be considered as a supplement to Adriaanse et al. (2008) and therefore most of the general issues are not repeated here but may be found in the other report.
Contents
Summary 11
1. Introduction 13
2. Approach 15
3. Proposed decision making scheme 17
4. Proposed evaluation methodology 19
4.1 Introduction 19
4.2 Proposal 20
5. 5. Measured concentrations of glyphosate 27
6. Comparison between measured and calculated concentrations 35
7. Conclusions and recommendations 37
References 39 List of abbreviations 41 Annex 1 Intended uses of glyphosate 43 Annex 2 Physico-chemical properties 44 Annex 3 Fate and behaviour 46
Summary
An evaluation instrument has been developed to estimate the concentration of plant protection products (PPPs) in surface water intended for the production of drinking water after application on hard surfaces. Up to now such a methodology was lacking in the evaluation system for the authorisation process of active substances as described in the EU-Directive 91/414/EC.
Based on actual measurements at the drinking water abstraction points performed by national authori-ties (Ministry of Transport, Public Works and Water Management) and the drinking water companies, the presence of active substances of PPPs in surfaces water has been shown to occur above acceptable limits. There are two routes defined that may cause pollution of surface waters by the application of plant protection products that may end up at the location at which water is abstracted for drinking water production. The first is caused by products applied to agricultural soils and has been further developed by Adriaanse et al. (2008), whilst the second is caused by the application of substances in amenity use and is subject of the current report. The most important of the latter is the use of PPPs by local authori-ties to hard surfaces. After rain events these substances may run-off to the sewer system and enter sur-face water. The problem was already known for many years. Therefore, the Dutch registration authori-ties were urged by the judge to take this situation into account in making decisions on the authorisation of PPPs.
A decision making scheme is proposed as a tiered approach and is based on the assumption that a rela-tion exists between the applicarela-tion of PPPs on hard surfaces and the established concentrarela-tion in re-ceiving surface waters to prevent residues of active substances in drinking water. The aim was to de-velop a realistic worst case situation taking into account estimations of 90th percentile run-off values and 10th percentile flow data. Experiences with an existing substance, like glyphosate, are used to ex-trapolate to evaluations of new active substances. In the report the first and second tier of the tiered approach are described. The first tier consists of a calculation method estimating the amount of sub-stance used and the transport behaviour of the subsub-stance to the drinking water abstraction point. The second tier makes use of the real measurement data of the substances after having granted a conditional registration. The condition is that post-registration measurements are carried out.
To determine the Predicted Environmental Concentration (PEC) of an active substance several assump-tions are needed, e.g. the application method is according to a specified protocol, the dose used on hard surfaces, the total area in the Netherlands to which the substance is applied, the catchment areas of the water courses to the intake points of the water works, etc. Also the market share of the product is taken into account based on estimations of the plant protection product industry in the Netherlands. These assumptions have been checked against the results of the case of glyphosate.
It is proposed that currently some experience has to be built up with this new instrument in the applica-tion to new substances or to substances that have been shown a problem for the water works in the Netherlands. Regularly, national and local authorities carry out measurement programmes to establish the state-of-the-environment. These results will be used to check the results of the predictions based on the methodology developed. Potential improvements have been recommended in the area of substance specific run-off data and taking into account degradation and dissipation of the active substance. It is
1. Introduction
The methodology for carrying out a risk assessment for the application of PPPs on hard surfaces is not yet developed in the European Union. Although the need for such an instrument is mentioned in the Uniform Principles, it has never been made operational. In this report, a tool is developed that may serve as a method to evaluate PPPs on the effects on the drinking water production if the water is ab-stracted from surface water sources. The methodology for hard surfaces is as much as possible based on the methodology for PPPs used in agriculture (Adriaanse et al., 2008). It is clear that the emission of PPPs applied in amenity use is completely different from the application of PPPs in agriculture. Cer-tainly in the Netherlands, the application of PPPs on hard surfaces will lead in most cases to a discharge to surface water through a waste water treatment plant (WWTP). Therefore, the methods described in this report may be used if the application of a PPP is requested for authorisation in amenity use, in this case application on hard surfaces that are subject to run-off.
After application and possibly the run-off event, the substance will be withheld during some time in the WWTP and may be subject to degradation. Although the residence time in the WWTP is generally quite short, circa three days, favourable conditions for biological degradation, (for example due to tur-bulence and elevated oxygen concentrations), occur in the aeration tank and many active substances (a.i.) may (partly) be transformed. In case of a storm overflow the substance may be discharged directly into surface waters (see chapter 2).
The Dutch Ministry of Housing, Spatial Planning and the Environment has charged RIVM with the development of the methodology and installed a working group. The members of the working group are:
• A.J.A. van der Linden (RIVM) • J.B.H.J. Linders (RIVM) • Y.I. Stienstra (Ctgb).
Part of the development process has been the consultation of all stakeholders during a workshop, which took place on 26th May 2009. Stakeholders included the Waterdienst, Alterra, Kiwa, VEWIN, the
re-gional water management, industry (Nefyto), the agricultural organisation (LTO) and several depart-ments of RIVM. Comdepart-ments and suggestions of these parties have been included in the report. The Min-istry of Agriculture, Nature and Food Quality (LNV), the MinMin-istry of Housing, Spatial Planning and the Environment (VROM), the Ministry of Social Affairs and Employment (SZW), and the Ministry of Health, Welfare and Sport (VWS) did not take part in the workshop, as they decided to have a separate political discussion on the report.
The current report, therefore, offers the methodology as proposed and discussed with stakeholders in the Netherlands but not yet the implementation of the methodology as an evaluation instrument in the authorisation process of PPPs (European Commission, 1991). Criteria for xenobiotics have been part of EU legislation ever since the Drinking water Directive (European Commission, 1975), but they were not effectuated. It is the intention of the Ministry of VROM to bring the methodology to the attention of the designated national authorities (DNA) in the European Union and to the Commission in Brussels. In addition, the legislation of the Water Framework Directive (European Commission, 2001) has been taken into account as well.
2. Approach
Considering the differences in discharges - the emissions - of PPPs applied in agriculture and of PPPs applied in amenity use, especially those on hard surfaces, a thorough analysis of the discharges is nec-essary. Application of PPPs on hard surfaces is mainly taking place by the local authorities or private companies for the treatment of the hard surfaces under their responsibility to clean the surface from unwanted weeds, the so-called amenity use. In the Netherlands, the uncontrolled run-off emission from hard surfaces directly into surface waters is still occurring to considerable amounts. Recent figures (Waterdienst, personal communication) indicate that about 27% is directly discharged to surface water, 19% is discharged to soil and the remaining part to the waste water treatment plants. Therefore, most of the run-off water is transported to the waste water treatment plants. In cases of high rainfall events that cause overflows of the sewage systems such a discharge may happen.
Currently, a few methods have been proposed in the Netherlands and in the UK. These will be evalu-ated by the working group and a new methodology will be proposed based on the methodology devel-oped for agricultural products. It is the intention to keep both methods as close together as possible. Earlier proposals are described in chapter 3, together with a final presentation of the proposal of the exposure assessment for the application of substances on hard surfaces with respect to their ability to influence the drinking water abstraction from surface water in the Netherlands.
In addition, the contribution of the application of active substances in amenity use will be abstracted from the total use of the substance in the Netherlands, in this way accounting for a total application in amenity use by local authorities. The proposed calculation methodology is described in chapter 4. In the Netherlands glyphosate is extensively used for weed control on hard surfaces with a market share of over 90 percent for this specific application. Therefore, monitoring data on glyphosate in surface water are used to check this calculation methodology. It should be kept in mind, however, that the methodology developed in this document is not intended to describe the situation on glyphosate and also not to find the sources for the findings of the substance glyphosate in surface water.
Chapter 5 gives an overview of all the monitoring data on glyphosate in the Netherlands from 2000 onwards. Only for two stations, Amsterdam-Rijnkanaal and Heel, the period from 2002 onwards is used as no earlier data are available. Conclusions to be drawn from these monitoring programmes are dealt with also in chapter 5. Chapter 6 gives a comparison between the measured and calculated data based on the methodology proposed. In chapter 7 some conclusions and recommendation based on the proposals developed here are indicated.
3. Proposed decision making scheme
In Figure 3-1 the decision making scheme for plant protection products applied on hard surfaces is pre-sented as proposed in this report. The scheme is intended to be used for new and existing plant protec-tion products and for active substances for which monitoring programmes are already in use or for which (post) authorisation monitoring programmes are considered.
The scheme describes two tiers: the first tier is according to the calculation procedure described in chapter 4, whilst the second tier consists of the monitoring programmes. For existing active substances, like e.g. glyphosate the results of monitoring programmes are taken into account and calculations and measurements are compared to each other to finally decide on the authorisation of the product. This section is not different from the assessment methodology developed for plant protection products in agricultural applications as described in Adriaanse et al. (2008). According to the working group on hard surfaces there is no reason to deviate in any way from the proposal set forward in Adriaanse et al. (2008).
The drinking water standard (DWS) has currently been set to 0.1 µg/L and if needed may be defined more strictly depending on the policy in the Netherlands. In addition, the value of Y should be defined by policy agreement in the Netherlands as well. A value of 10 or 5 may be considered appropriate in agreement with the proposal in Adriaanse et al. (2008). The factor Y represents a ‘safety’ factor and is further discussed in Adriaanse et al. (2008).
Start
1PEC
Tier 1PEC
< DWS
2Legend: 1 = This is as well applicable to new compounds as to compounds already allowed on the market 2 = DWS is the drinking water standard which is at this moment when the report was issued 0.1 µg/L 3 = In case no refined assessment has been applied the PECfinal is PECTier 1
4 = Before making a decision it has to be analysed whether the compound is of Dutch origin or not
Figure 3.1 Proposed risk assessment scheme to evaluate the drinking water standard in the registration procedure of the Ctgb in the Netherlands. N.B. The factor Y represents a ‘safety’ factor and is further discussed in Adriaanse et al. (2008).
Mitigation
Ad-justing GAP
PEC
final3> Y * DWS
Tier 1PEC
final< DWS
Refinement
options
No No Or Or NoAuthorisation with
post-authorisation
monitoring
Monitoring data
from other
sources
PEC
monitoring4< DWS
No authorisation
Stop
Authorisation
Yes Yes Yes No Or Or Or 18 RIVM Report 6014500214. Proposed evaluation methodology
4.1 Introduction
One of the substances breeching the standard for drinking water abstraction in Dutch surface waters appears to be glyphosate. A possible source of these findings is run-off after application in amenity use, mainly applications to paved areas. Currently three methods are available claiming to be suited to evaluate the Predicted Environmental Concentrations (PECs) after the application of a substance in amenity use. These methods will be described shortly below.
USES
In the Dutch Uniform System for the Evaluation of Substances (USES, version 4.0) four scenarios are available to estimate the concentration in different types of surface waters and depending on the paved area of some example towns in the Netherlands. These scenarios are used by Ctgb to estimate the risks for aquatic organisms after application of paved areas with PPP. A detailed description of the scenarios is presented in Linders et al. (2002). The four scenarios are the following:
1. direct run-off to surface water;
2. discharge through rain water overflow of a separated sewer system; 3. discharge through pour over of a mixed sewage system
4. discharge through a WWTP connected to a mixed sewage system.
For each scenario some basic assumptions underlie the calculations required to conclude to a final con-centration in the surface water body, a PEC.
Waterdienst
The Waterdienst (Center for Water Management) of the Netherlands proposed a method, during the discussion on the topic, but considered further publication not appropriate. The method was based on the estimation of the amount of living space and roads in the Netherlands and on the estimation of the treated area. Depending on the period to be considered averaging would result in a concentration over that period. (Waterdienst, personal communication. 2009)
UK
Also in the UK, for quite an extent based on the Dutch approach, a calculation system has been set up called HardSPEC, which consists of an Excel spreadsheet with three scenarios (Hollis et al., 2004). The UK scenarios are defined as follows:
1. Urban catchment within which the hard surface areas drain via gully pots. Surface drainage water is delivered into surface water stream. The urban catchment measures 10 ha, contains asphalt (1.5 ha), concrete (0.75 ha), buildings (4.5 ha) and non-hard surfaces (3.25 ha).
2. As 1, but now surface drainage water is delivered into a pond. This scenario is intended to be similar to the use of collecting ponds within Sustainable Urban Drainage Systems (SUDS). 3. Surface water stream receiving surface drainage from a major road in a rural setting where the
hard surface areas drain via gully pots. The stream also receives water from an adjacent 1 ha agricultural field. The scenario has a 100 m long asphalt road, 7 m wide, plus 12 cm curb stones, plus 1 m wide grass verge, all draining into the stream. The agricultural field drains
di-Although the potential methods presented all have their advantages and disadvantages the working group decided that the main requirement of the method to be followed for the evaluation methods of applications on hard surfaces should be the close connection and relation to the method developed for agricultural applications. Especially the features of taking into account a distribution of the areas con-tributing to a specific concentration at a drinking water abstraction point and some other assumptions are favourable for a close connection of the two methods. This will be further elaborated below.
4.2 Proposal
The preference for development of new scenarios is of course based on the use of the scenarios for the decision tree for agricultural products and their effects on the concentrations at drinking water abstrac-tion points. The quesabstrac-tion to be answered is how to calculate the concentraabstrac-tion at abstracabstrac-tion points due to the application of substances in amenity use. For a preliminary test of the proposal the results of the monitoring programmes of glyphosate at the different abstraction points for drinking water are com-pared to the calculated values (see chapter 5).
A sequence of the events happening in the application of substances on hard surfaces is given in Figure 4.1.
Use Emission Transport
Figure 4.1 Analysis sequence hard surfaces.
Use
The use of a substance, i.c. glyphosate, is determined by the use of the substance in agriculture, on hard surfaces and possible other applications. Currently there are no products, or active substances in prod-ucts, that are used exclusively on hard surfaces. Therefore, it is proposed to combine the evaluation of substances on hard surfaces with the application in agriculture.
For the evaluation of an active substance in agriculture, of course with respect to the evaluation of the drinking water criterion, the methodology described in Adriaanse et al. (2008) is valid and for the ap-plication on hard surfaces the methodology from this report applies.
As the agricultural use of a substance is much better surveyed than the agricultural use, the non-agricultural use is determined from the total use and the non-agricultural use:
e agricultur total
areas
paved
Use
Use
Use
_=
−
(1)where:
Usepaved_areas = amount used on hard surfaces [kg y-1]
Usetotal = total amount used [kg y-1]
Useagriculture = amount used in agriculture [kg y-1].
The total amount used is taken from the sales data as recorded by the Ministry of LNV and the amount used in agriculture is estimated according to the method described by Adriaanse et al. (2008). If for a substance an accurate non-agricultural use is available, for instance because of an adequate survey, then a calculation is not necessary. For authorisation purposes, also a potential use may be taken.
From the use on hard surfaces the treated area (Atreated) with a specific substance may be calculated:
D
Use
A
paved areas treated _=
(2) with:Atreated = the total area [ha] in the Netherlands treated with the substance
D = the dose [kg ha-1].
As the frequency of application may be above 1, the absolute total area receiving one or more applica-tions may be smaller than calculated according to the formula.
The total area ‘hard surfaces’ is around 600.000 ha (Te Molder, personal communication, March 2009). Table 4.1 provides estimates for hard surface areas for the individual catchment areas, as far as located in the Netherlands. The estimates are based on Figure 4.2, CBS-data on the distinction of local admini-strations in the Netherlands in the year 2006 and regiadmini-strations of hard surfaces for each municipality in the database of Emission Registration (Te Molder, personal communication, March 2009). About 60% of the total area on hard surfaces belongs to the catchment area of one or more abstraction points. Table 4.1 Paved areas for the 9 abstraction points.
Name abstraction point Paved area in ha
Scheelhoek 176015 Petrusplaat 128453 Brakel 116465 Heel 30700 De Punt 12691 Nieuwegein 34017 Amsterdam-Rijnkanaal 48879 Inlaat Andijk 147213 Twentekanaal 7614
For first tier calculations we assume that 50 % is a good approximation of the total area that will re-ceive an application. There is no information on the distribution of the applications over the Nether-lands, so we assume that the distribution is even, i.e. each hectare of paved area has the same chance of receiving one or more treatments per year.
It is highly unlikely that all the area to be treated with the substance is treated on one and the same day. As a worst case assumption for first tier calculations, Atreated is taken to be treated in ten days (10% of
the area per day). One neighbourhood may probably be treated in one day, but more neighbourhoods will be contributing to a single sewage treatment system.
Emission
Although in some cases drift to surface water may occur, drift emission to surface water is neglected in the assessment procedure for applications on hard surfaces. Drift emission is small compared to run-off
Van Dijk et al. (2006), and Kempenaar and Kok (2005) reported run-off percentages between 0 and 5.7% (glyphosate and AMPA as percentage of the amount glyphosate) at the neighbourhood scale, after applying glyphosate according to the DOB procedure (for further explanation see chapter 6). The 90th percentile run-off value for glyphosate was 3.5%. It is proposed to use this 90th percentile for emission calculations for first tier assessments. In the (rather few) experiments at the neighbourhood scale, no obvious relation between the emission and the amount of precipitation could be established. It is as-sumed that most of the run-off of the substance takes place with the first few mm of rain regardless of the intensity of the rain event. In reality the emission may be dependent of the rain intensity and the time span between application and the rain event but this is in the current proposal not taken into ac-count. It may be used in a higher tier development. In addition, the direct emission of potential metabo-lites is also not included in this proposal. If metabometabo-lites do have to be evaluated the normal procedure should be followed in estimating the maximum percentage a metabolite has been formed and correcting for molecular weight.
Most of the hard surfaces treated with herbicides are located in areas equipped with a sewer system. The run-off is collected by the sewer system and consecutively discharged to the sewage treatment sys-tem. With respect to the situation in the Netherlands on the municipal sewage treatment systems it has been determined (RIONED, 2005) that 75% of the sewage systems is of a mixed type, 18% of a sepa-rated type and 7% of an improved sepasepa-rated type. In a sepasepa-rated type system, rain water is collected separately and discharged to surface water without passing a treatment system. In an improved sepa-rated system, the first flush of a rain event is directed towards the treatment system, but the rest is dis-charged directly to surface water. Almost all sewage systems are equipped with an additional basin to collect water during high rainfall events in order to prevent overflow of the sewage system. However, in extreme events, still overflow may occur.
The purification efficiency of a sewage treatment plant for a specific substance will be influenced by both substance properties and properties and management of the treatment plant. For glyphosate, puri-fication efficiencies between 5 and 40% have been reported. A (reasonable) worst-case estimation is therefore 0%. This would mean that, in the first tier, the type of sewage system is not important for cal-culating discharge (emission) of the substance to the surface water. Also, the residence time of the sub-stance in the sewage system and the treatment plant is not important with respect to the amount dis-charged as the substance is assumed not to degrade.
Under the assumptions given above, the total emission to surface water may be calculated according to:
(
pur)
use pd off run treated totA
D
f
f
f
f
E
=
−1
−
(3) with:Etot = total emission [kg/d]
frun-off = fraction run-off [-], suggestion to use the 90th percentile (see text)
fpd = fraction of area treated per day [d-1], suggestion to use default 0.05
fpur = purification efficiency of sewage treatment system [-], suggestion to use default 0.
The above equation can be used to calculate the emission for the whole of the area (the Netherlands), but also for sub-regions (defined catchment areas for the abstraction points). In the latter case, it is sug-gested to distribute the Atreated according to the distribution of paved area. The factor fpd is used to take
account of the assumption that the application with the substance is not carried out in one day. A worst-case assumption of a twenty day application period is adopted in this proposal.
The catchment areas are the same as used in Adriaanse et al. (2008) (see Figure 4.2). A specific value is assumed for fuse, which is related to the intensity of the use of the substance. In Adriaanse et al. (2008),
some topics are mentioned that are included in the fuse_intensity, like the area treated with the substance,
the estimated market share factor (0.4) and the drift deposition factor. In the approach here, for hard surfaces, the area is used in the same way as in Adriaanse et al. (2008), by taking the area treated per county divided by the total draining area of the counties in the specific catchment area of the abstrac-tion point under consideraabstrac-tion. For the market share, however, in this approach a value of 1 is proposed based on the current market share for glyphosate in the application on hard surfaces. The drift deposi-tion factor is not relevant here. So:
share market n abstractio dw treated use
f
Area
Area
f
_ _⋅
=
(4) with:fuse = use factor, based on the fraction of the area of use
Areatreated = area treated with the substance in ha
Areadw_abstraction = total area draining to abstraction point
fmarket_share = market share of the substance, default 1.0.
For authorisation of new substances, in the first tier it is assumed further that the area potentially treated is 50% of the whole paved area in a catchment area.
paved
treated
Area
Area
= 5
0
.
⋅
(5)The value of 0.5 is estimated from the amenity use of glyphosate, the whole paved area and label in-structions for use on paved areas (valid until 2006).The value of 0.5 is then a somewhat conservative estimate.
Transport
As for the methodology for Agricultural products it is proposed to use a mean travelling time from dis-charge / emission point (i.e. point where run-off takes place) to the abstraction point of six days. This means that the substance on average will reach the abstraction point after six days. Although this value may differ per catchment area the same value for all catchments is used. In a higher tier assessment this may be refined.
Concentration at abstraction point
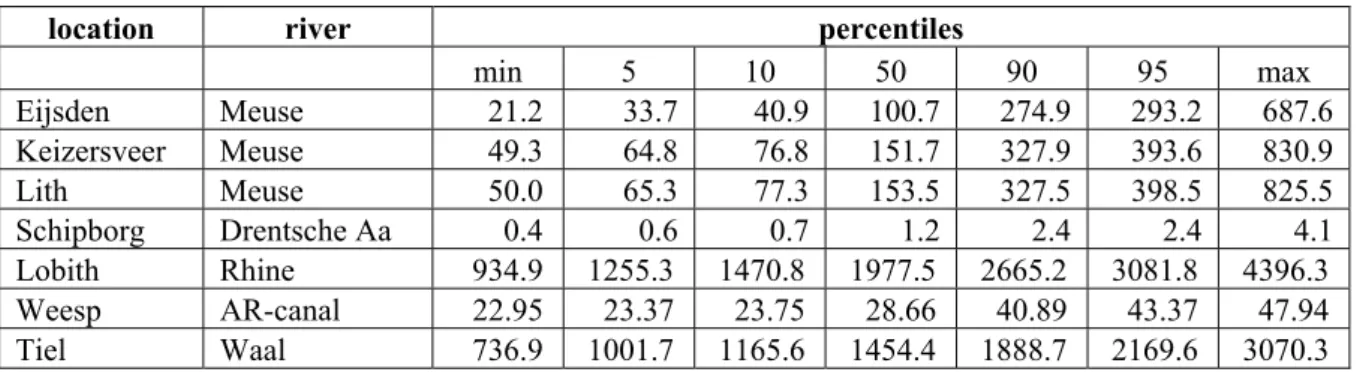
As stated earlier, there seems to be no relation between the amounts emitted via run-off and the inten-sity of rain events. It seems therefore reasonable to base concentration calculations on the flow rate of the surface water at the abstraction points. For first tier calculations usually a realistic worst case situa-tion is taken. In this case the realistic worst case would be the 10th percentile of the flow rate at the ab-straction point, i.e. a relatively low flow rate. Using a relative low flow rate will result is a relatively high realistic worst case concentration. Table 4.2 gives these flow rates for selected points in Meuse, Rhine and Drentsche Aa. The data for Meuse and Drentsche Aa can be used as approximations for the flow rate at the abstraction points. Flow rates are for the period April – September, the period in which
probably will not differ much from the concentration at the abstraction points, so probably it would be better to use a flow rate for the inlet point.
Table 4.2 April – September flow rates (m3/s) in the period 2000 – 2006.
location river percentiles
min 5 10 50 90 95 max Eijsden Meuse 21.2 33.7 40.9 100.7 274.9 293.2 687.6 Keizersveer Meuse 49.3 64.8 76.8 151.7 327.9 393.6 830.9 Lith Meuse 50.0 65.3 77.3 153.5 327.5 398.5 825.5 Schipborg Drentsche Aa 0.4 0.6 0.7 1.2 2.4 2.4 4.1 Lobith Rhine 934.9 1255.3 1470.8 1977.5 2665.2 3081.8 4396.3 Weesp AR-canal 22.95 23.37 23.75 28.66 40.89 43.37 47.94 Tiel Waal 736.9 1001.7 1165.6 1454.4 1888.7 2169.6 3070.3
The predicted concentration at a given abstraction point is then calculated according to:
diss x x tot Tier x
f
rate
flow
E
PEC
, 1 ,=
(6) with:PECx,tier1 = predicted concentration at abstraction point x [ µg/L]
Etot,x = total emission [kg] in catchment area x
flow ratex = flow rate [m3/d] of the surface water at abstraction point x, suggested to use
the long-term average10th percentile of the flow rate over the months April - September
fdiss = factor accounting for dissipation / degradation [-].
In the factor fdiss the dissipation or degradation is included: t k diss
e
dissf
=
− ⋅ (7) with:50
/
)
2
ln(
DT
k
diss=
kdiss = the first order dissipation / degradation coefficient [d-1]
t = the average residence time [d] of the substance in the surface water DT50 = the dissipation / degradation half-live of the substance in water in [d].
For glyphosate it is assumed that the kdiss is equal to the degradation rate in water of glyphosate as
de-termined in the EU List of Endpoints (see Annex 3).
Finally, the PECfinal is determined after the incorporation of risk mitigation measures considered if
re-quired and after making the appropriate adjustments in the parameter values.
5.
Measured concentrations of glyphosate
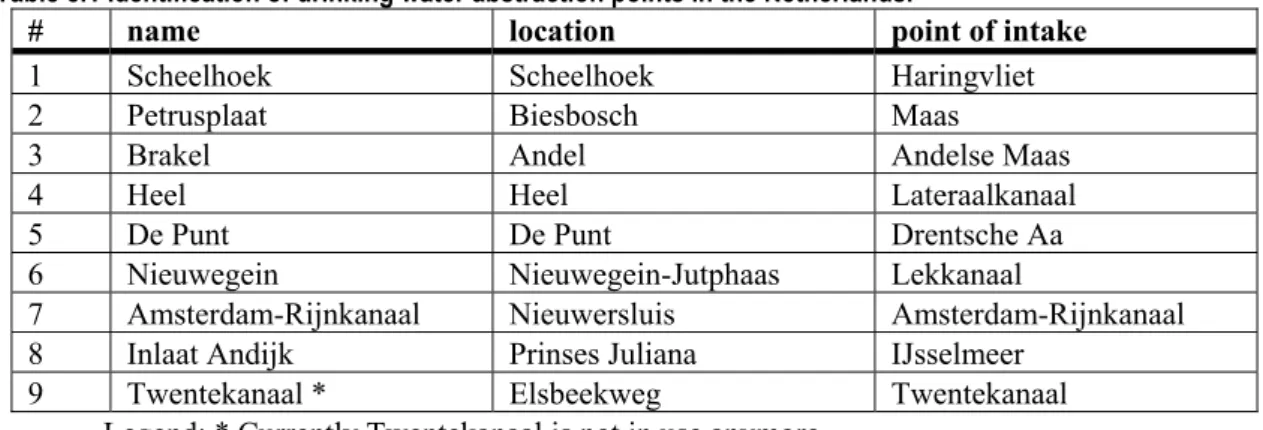
The intake points in the Netherlands for the production of drinking water are the same as in the report on PPPs (Adriaanse et al., 2008). For all information on the drinking water abstraction points, reference is made to this report. Table 5.1 summarizes the identification of the drinking water abstraction points. Table 5.1 Identification of drinking water abstraction points in the Netherlands.
# name location point of intake
1 Scheelhoek Scheelhoek Haringvliet
2 Petrusplaat Biesbosch Maas
3 Brakel Andel Andelse Maas
4 Heel Heel Lateraalkanaal
5 De Punt De Punt Drentsche Aa
6 Nieuwegein Nieuwegein-Jutphaas Lekkanaal
7 Amsterdam-Rijnkanaal Nieuwersluis Amsterdam-Rijnkanaal
8 Inlaat Andijk Prinses Juliana IJsselmeer
9 Twentekanaal * Elsbeekweg Twentekanaal
Legend: * Currently Twentekanaal is not in use anymore.
In this report the emphasis is put only on glyphosate as that substance is currently the most used sub-stance in amenity use and particularly on hard surfaces.
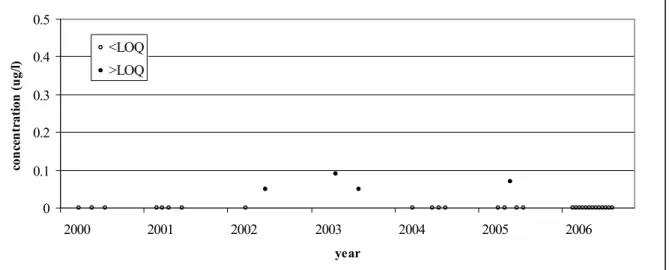
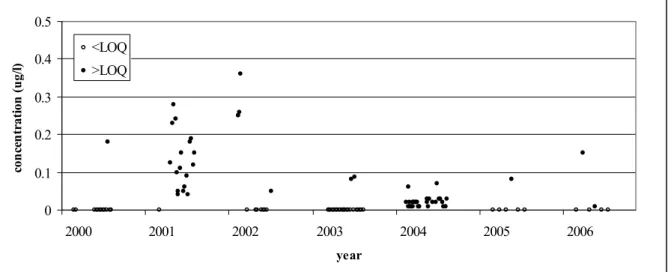
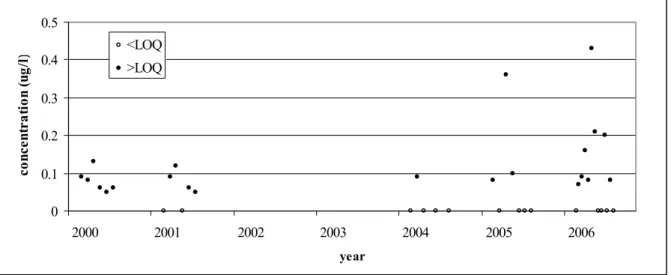
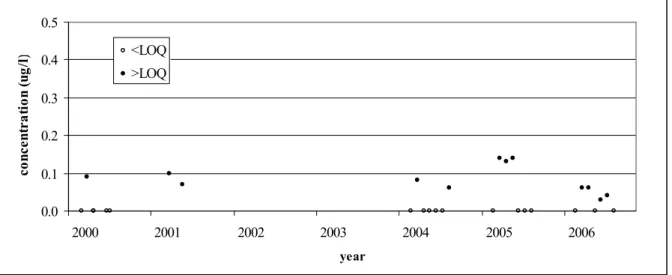
The Figures 5.1 to 5.10 give the results of the measurements programmes on glyphosate of all the drinking water companies in the Netherlands as far as they make use of surface water as the source for the drinking water in April up to and including September of the years 2000 to 2006, except for Am-sterdam-Rijnkanaal and Heel where monitoring has been carried out from 2002 to 2006. The periods October – March have been excluded from the presentation as in these periods glyphosate will usually not be applied on hard surfaces in the Netherlands, so the use of the substance on hard surfaces may have influenced the measurements shown in the figures.
0 0.1 0.2 0.3 0.4 0.5 2002 2003 2004 2005 2006 year co n cen tra tio n ( u g/ l) <LOQ >LOQ
0 0.1 0.2 0.3 0.5 2001 200 2003 2004 2006 n <LOQ >LOQ 0.4 ( u g/ l) at io 2000 2 2005 year co n cen tr
Figure 5.2 Measured glyphosate concentrations at Andijk in the period 2000 – 2006.
0 0.1 2000 2001 2002 2003 2004 2005 2006 year co n 0.2 0.3 0.4 0.5 cen tra tio n ( u g/ l) <LOQ >LOQ 2.4
Figure 5.3 Measured glyphosate concentrations at Brakel in the period 2000 – 2006.
0 0.1 0.2 0.3 0.4 0.5 2000 2001 2002 2003 2004 2005 2006 year co n cen tra tio n ( u g/ l) <LOQ >LOQ
Figure 5.4 Measured glyphosate concentrations at De Punt in the period 2000 – 2006.
0 0.1 0.2 0.3 0.4 0.5 2000 2001 2002 2003 2004 2005 2006 year co ncen tra ti on (u g/ l <LOQ ) >LOQ
0 0.1 0.2 0.3 0.4 0.5 2002 2003 2004 2005 2006 year co nc en tr at io n (ug /l <LOQ ) >LOQ
Figure 5.6 Measured glyphosate concentrations at Heel in the period 2002 – 2006.
0 0.1 0.2 0.3 0.4 0.5 2000 2001 2002 2003 2004 2005 2006 year co ncen tra ti on (u g/ l
Figure 5.7 Measured glyphosate concentrations at Lobith in the period 2000 – 2006.
) <LOQ
>LOQ
0.59
0 0.1 0.2 0.3 0.4 0.5 2000 2001 2002 2003 2004 2005 2006 year co nc en tr at io n (ug /l <LOQ ) >LOQ
Figure 5.8 Measured glyphosate concentrations at Nieuwegein in the period 2000 – 2006.
0 0.1 0.2 0.3 0.4 0.5 2000 2001 2002 2003 2004 2005 2006 year co nc en tr at io n (ug /l <LOQ ) >LOQ
0.0 0.1 0.2 0.3 0.4 0.5 2000 2001 2002 2003 2004 2005 2006 year co nc en tr at io n (ug /l <LOQ ) >LOQ
Figure 5.10 Measured glyphosate concentrations at Scheelhoek in the period 2000 – 2006.
The abstraction point Twentekanaal is not used anymore and therefore it is not included in the figures. Two measurement points have been added, Lobith and Eijsden, as they give the situation at the border with Germany and Belgium. These two points are not drinking water abstraction points but are in-cluded as reference points to explain possible introduction of the substance into surface water of the Netherlands by foreign activities, both agricultural and amenity use. Although each drinking water ab-straction point has its own catchment area, another classification based on catchment area is possible. The following abstraction points Amsterdam-Rijnkanaal, Andijk, Nieuwegein belong to the catchment area of the river Rhine with Lobith as reference point. Most others, Brakel, Heel, Petrusplaat and Scheelhoek belong to the catchment area of the river Meuse. Finally, De Punt belongs to the catchment area of the river Drentsche Aa, which is a river completely situated in the Netherlands. The further analysis of the monitoring data at the abstraction points is carried out taking into account the wider catchment area of the rivers Rhine and Meuse and the, quite uniquely, isolated catchment of the river Drentsche Aa.
As can be seen easily from the Figures 5-1 to 5-10, higher concentrations than 0.1 µg/L occur at all drinking water abstraction points during the application season of glyphosate, except at Andijk. Proba-bly there an additional dilution is taking place due to the large IJsselmeer.
R
ooking at the measurement data at Lobith a slight increasing trend may be seen over the years 2000 – 004, possibly indicating an increase in the amount of glyphosate used in Germany and remaining in the water of the river Rhine at the entrance in the Netherlands. Both other stations in the Rhine catch-ment, Nieuwegein and Amsterdam-Rijnkanaal do not show this trend, although at Nieuwegein in the year 2005 and 2006 a few high concentrations have been detected, around 0.4 µg/L. The highest con-centration was found at Lobith with 0.59 µg/L. This value was not related to the highest value at Nieu-wegein: 0.43 µg/L. The dates were 2nd of August 2006 and 21st of June, respectively. At
Amsterdam-Rijnkanaal even a slight decreasing trend is visible. It is not suggested here that there are significant differences; also a statistical analysis has not been carried out. It is clearly visible from the graphs that
iver Rhine catchment
L 2
the number of measurements below the LOQ is increasing over the years, while during the same period OQ tended to decrease.
River Meuse catchment
At Eijsden nor at the other monitoring stations in the Meuse catchment a positive or negative trend is visible, except maybe at Petrusplaat, where in the years 2000 – early 2004 an increase of the glyphosate concentrations and from mid 2004 – end of 2006 a decrease is observed. Compared to Eijsden the level of the concentration is at Petrusplaat generally a little bit higher with maxima over or close to 0.4 µg/L. It can be concluded here that at Petrusplaat a contribution from the Netherlands is visible. However, it can not be determined whether this is due to agriculture or to the application on hard surfaces. At Scheelhoek definitively the lowest values are determined which could indicate a further dissipation of the substance. At Brakel a few high measurements are found, close to 0.5 µg/L. The highest values at Eijsden lie around 0.3 µg/L, which could indicate that sometimes local discharges have taken place somewhere between Eijsden and Brakel. Also in the Meuse catchment area an increasing number of measurements below the LOQ occur in the years 2005 and 2006. Also in this case an exception has to be made for Petrusplaat as still many concentrations are determined around the concentration of 0.1 µg/L.
D
number of high concentrations of glyphosate in the Drentsche Aa catchment has been found in the eriod 2001 and 2002, even up to 0.4 µg/L. In later years a drastic decrease has been observed without L
rentsche Aa catchment
A p
values above 0.1 µg/L except for one occasion: 0.15 µg/L in 2006. Therefore, a clear improvement has taken place in this catchment.
6. Comparison between measured and calculated
concentrations
In the preceding chapter an overview has been given of the available measurements of glyphosate in Dutch surface water. In this chapter some preliminary calculations will be carried out to estimate the concentration of glyphosate in surface water. Also the results of the methodology proposed and applied to glyphosate will be presented here.
The physico-chemical data and the data on the application of glyphosate on hard surfaces, the amenity use, are taken from the application dossier as available at the Board for the Authorisation of Plant Pro-tection Products and Biocides (Ctgb). It is always assumed that the product that contains in this case glyphosate is applied according to Good Application Practice and that all the prescribed precautions have been taken into account. In Annex 1 an overview is presented of all the registered products con-taining glyphosate. Annex 2 gives an overview of the physico and chemical data and Annex 3 the data on environmental fate and behaviour of glyphosate are given as a result of the evaluation process in the European Union.
Concerning the dose rate of glyphosate it is assumed that application and dose are carried out according to the guideline presented in the DOB-procedure. This has been specifically developed for application on hard surfaces. Therefore, the dose D of glyphosate is taken as 0.36 kg/ha with in exceptional cases may be increased to 0.72 kg/ha. The emission percentage is estimated at 3.5% based on an evaluation of PRI and others (see chapter 4, emission). This percentage showed to be the 90percentile for gly-phosate. Beltman et al. (2006) report a range from 0 to 5.7% for glyphosate residues (=glyphosate + AMPA, personal communication Wim Beltman). In addition, it is assumed that 50% of the potential area of hard surfaces is treated with glyphosate and that all concentrations are caused by the application of glyphosate to hard surfaces.
Table 6-1 gives input values and the calculated concentration for estimated average conditions for the catchment area of De Punt, Amsterdam-Rijnkanaal and Petrusplaat. These three catchments have been chosen based on the following considerations: Twentekanaal is not used any longer as an drinking wa-ter abstraction point, Andijk is a more complicated situation as the buffer capacity of the Lake IJssel-meer is also relevant for the final estimation and Amsterdam-Rijnkanaal is the only branch in that catchment where flow data are available. Petrusplaat is chosen as it is considered the most relevant ab-straction point in the Meuse catchment. The surface paved area is taken from the data of CBS and Emission Registration as mentioned in section 4.2. The resulting estimated concentration PEC is 0.56, 0.09 and 0.04 for the three catchments respectively. The measured concentrations according to chapter 5 are generally in the range of 0.1 – 0.5 µg/L. As can be seen the values estimated at De Punt are about in the range of normally measured concentrations. In both other points the average calculated situation is lower than the measurements. The measured concentrations should be representative of the realistic worst case conditions as they span all conditions over the reported period.
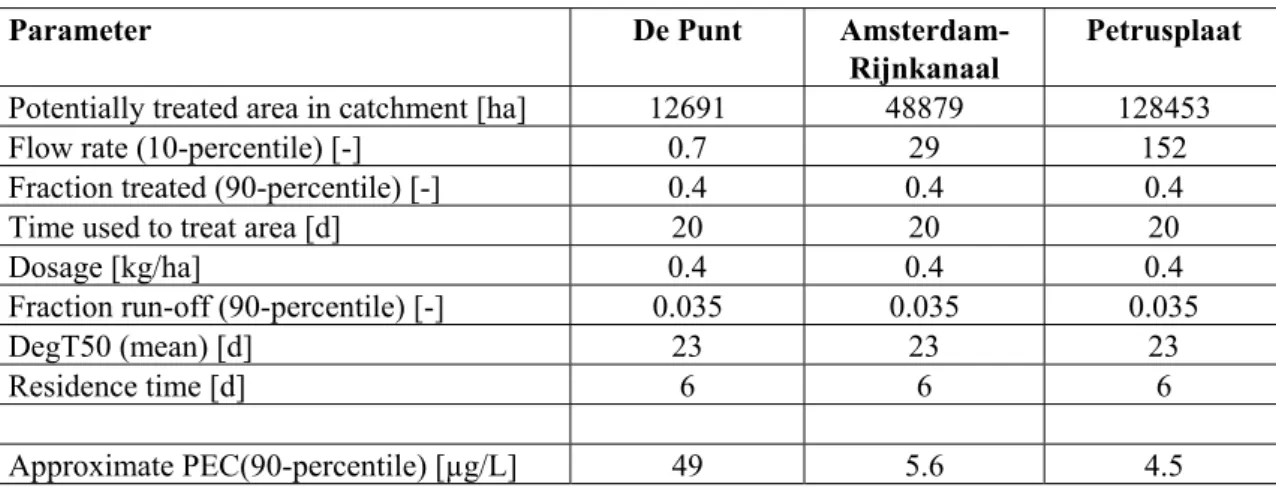
Table 6.2 gives input values and the calculated concentration for estimated (realistic) worst case condi-tions for the catchment area of De Punt, Amsterdam-Rijnkanaal and Petrusplaat. The resulting esti-mated concentration is about 5 µg/L for Amsterdam-Rijnkanaal and Petrusplaat whilst for De Punt
for the catchments De Punt, Amsterdam-Rijnkanaal and Petrusplaat a feeling for the expected
concen-t runs for glyphosaconcen-te concenconcen-traconcen-tion, average case.
Parameter De Punt Amsterdam- Petrusplaat
trations can be reached.
Table 6.1 Parameter values for the tes
Rijnkanaal
Potentially treated area in catchment [ha] 12691 48879 128453
Flow rate (50-percentile) [-] 1.2 24 152
Fraction treated (50-percentile) [-] 0.05 0.05 0.05
Time used to treat area [d] 20 40 40
Dosage [kg/ha] 0.4 0.4 0.4
Fraction run-off (median) [-] 0.011 0.011 0.011
DegT50 (mean) [d] 23 23 23
Residence time [d] 6 6 6
Approximate PEC (50-percentile) [µg/L] 0.56 0.09 0.04
Table 6.2 Parameter values for the test runs for glyphosate concentration, 90-percentile case.
Parameter De Punt
Amsterdam-Rijnkanaal
Petrusplaat Potentially treated area in catchment [ha] 12691 48879 128453
Flow rate (10-percentile) [-] 0.7 29 152
Fraction treated (90-percentile) [-] 0.4 0.4 0.4
Time used to treat area [d] 20 20 20
Dosage [kg/ha] 0.4 0.4 0.4
Fraction run-off (90-percentile) [-] 0.035 0.035 0.035
DegT50 (mean) [d] 23 23 23
Residence time [d] 6 6 6
Approximate PEC(90-percentile) [µg/L] 49 5.6 4.5
In judging these results it should be kept in mind that the peak concentration calculated here may not be measured during monitoring campaigns because the chance to measure just the peak is very small. As the method is currently developed it calculates rather high concentrations which can account for this difference between calculated and measured values. In this way, the high concentrations calculated could serve as a signal that there may be a risk for the drinking water production process. If the method would be set up more stringent, more calculated concentrations would be higher than the measured concentrations indicating a failure of the method. That would not be a reasonable tier I evaluation sys-tem anymore. Therefore, the results of the example calculation for glyphosate are considered to give the right order of magnitude for substances at risk.
Keeping in mind that there is only one substance that can be used for calibration of the method, it is therefore proposed to use the 90-percentile result as the preliminary evaluation target. If in the future more substances become available a further analysis of the situation should take place. At the moment the 90-percentile target seems to be safe for a tier I assessment because the resulting concentrations are higher than the measurements in Dutch surface water.
7. Conclusions and recommendations
The remit of the workgroup was to develop methodology for the risk assessment of the use of plant
pro cts on paved areas, with respect to ng wa f the .
The workgroup recommends using the method as outlined in chapte er assessments. The
met t in a ca t area, 2) th ercentile r lue
as m ccording to the DOB-p col) at the neighbourhood scale, and 3) the
10th traction point. Further assumption rst tier asses are:
1) n dation in surface water a ewage system eatment o e area
in f ys.
The as checked with monitoring da n glyphosate. R rted glyphosat ncen-trati the range <LOQ to approximat µg/L. If m n values for ru ff and dail and the area is treated in twenty orking days, except for De Punt, c ulated con
efinements of the methodology are possible, but will require additional information. A rather simple e run-off at the re advanced
re-ne take degradation and dissipation of e in su d sew t
plan nt. This however would also requir l info dist
var ted and ed separ differen
si-pati
Mo ested as the hig ble tier. rding to the e tions
in t treated area or high do rates would re in exceeding t
resh-old L. If the DOB protocol is followed eeding the sta /L t
ex-pec at the use of t protocol i ed in the la
ruc-tion
With this report a methodology to evaluate the effects of nt protection pr ducts on the quali of the
inta ds has bec available, wh supported by
olders in the Netherlands. The method is transparent, straight-forward and meeting its goals. At the
dence time. In the methodology, these values have
tection produ the drinki ter function o
r 4 in first ti
surface water hod uses 1) the (potential) use of a produc tchmen e 90th p un-off va
easured after applications (a roto
percentile daily flow rate at the abs s for fi sments
o dissipation from or degra nd s , and 2) tr f th
orty (working) da proposed method w ta o e epo e e co ons are reported in
flow rate are used
ly 0.5 dia n-o
y w alc
centration fall within the observed range. R
refinement of the procedure would be the use of substance specific values for percentag eighbourhood scale and the fraction of the paved area treated with the substance. Mo n fi ments could t into accou a substanc e additiona rface water an rmation on the ate en age treatmen ribution of the ious types of sewer systems (mixed, separa
on and transformation will occur.
improv d) as th ces in dis
nitoring at abstraction points is sugg hest possi Acco stima
his report, only a rather high sage sult he th
value of 0.1 µg/ exc ndard of 0.1 µg is no
ted. Therefore, it is recommended th his DOB s outlin bel inst s.
pla o ty
ke water of water works in the Netherlan ome ich is all stake-h
European level in the EU such an instrument is still lacking. Therefore, it is recommended that the Dutch proposal developed here will be forwarded to the EU (DG SANCO and EFSA) to develop an equivalent system for the European Union as well.
Still, the policy makers in the Netherlands have to make some final choices in the methodology as cur-rently developed. The main choice is of course the factor of Y as mentioned in the decision making scheme in chapter 3. The choice here should be the same as suggested in Adriaanse et al. (2008). In addition, some of the parameters listed in Table 6.1 or 6.2 are considered relevant, like e.g. the number of treatment days, the fraction treated and the resi
been determined based on the current knowledge but may be determined differently. Other parameters used are the area treated, that may change in the future and the market share of the product, but these
Finally, it is recommended to develop a computerised tool to be used by the Dutch Registration Author-ity (Ctgb) in the decision making process for plant protection products applied to hard surfaces. This
here it is still missing (Ctgb, ol is not yet foreseen. methodology should therefore be incorporated into the tool box of Ctgb w
2006). In the current research proposals the development of this computer to
References
driaanse, PI, JBHJ Linders, GA van den Berg, JJTI Boesten, MWP van der Bruggen, K Jilderda, R A
Luttik, WSW Merkens, YJ Stienstra, RJM Teunissen. (2008). Development of an assessment method-ology to evaluate the use of plant protection products for drinking water production from surface wa-ters. A proposal for the registration procedure in The Netherlands. Wageningen, Alterra, Alterra-rapport 1635.
Beltman WHJ, Wieggers HJJ, Rooy ML de, Matser AM. (2001). Afspoeling van amitrol, atrazin en glyfosaat vanaf een betonklinkerverharding; veldproeven en modelsimulaties. Wageningen, Alterra, rapport 319. (in Dutch).
Beltman WHJ, Kempenaar C, Horst CLM van der. (2005). Emissie van bestrijdingsmiddelen bij duurzaam onkruidbeheer op verhardingen (DOB). Gevolgen van toepassen van DOB-richtlijnen op afspoeling van bestrijdingsmiddelen. Wageningen, Alterra, rapport 1112. (in Dutch).
Beltman WHJ, Kempenaar C, Horst K van der, Withagen A. (2006). How pesticides used on hard sur-faces end up in drinking water. In: Graugaard S, Jensen K, Melander B, Kempenaar C. (eds) Confer-ence on Policies on Pesticide Use by Local and Regional Authorities, Wageningen, 25th April 2006. ISBN 87-91949-04-1, ISSN 1397-9884. DIAS Report No. 126, 41-46.
Ctgb (2006). Handboek voor de Toelating van Bestrijdingsmiddelen, Gewasbeschermingsmiddelen (HTB 1.0), 14 april 2006, Wageningen. Download: http://www.ctgb.nl/ .
Dijk CJ van, Kempenaar C, Vlaswinkel M, Withagen ACL. (2006). Evaluatie duurzaam onkruidbeheer (DOB) op verhardingen 2005. Wageningen, PRI, nota 389. (in Dutch).
European Commission (1975). Council Directive 75/440/EEC of 16 June 1975 concerning the quality required of surface water intended for the abstraction of drinking water in the Member States. OJ L 194, 25.7.1975, p. 26-31.
European Commission (1991). Council Directive 91/414/EEC of 15 July 1991 concerning the placing of plant protection products on the market. OJ L 230, 19.8.1991, p. 1-32.
European Commission (2001). Decision 2455/2001/EC of 20 November 2001 establishing the list of priority substances in the field of water policy and amending Directive 2000/60/EC. OJ L 331, 15.12.2001, p. 1-5.
Hollis, JM, Ramwell, CT, Holman, IP. (2004). HardSpec, A First-tier Model for Estimating Surface - and Ground-water Exposure resulting from Herbicides applied to Hard Surfaces. Final Report (DEFRA project PL0531), National Soil Resources Institute, Cranfield University Silsoe (UK).
Kempenaar C, Kok H. (2005). Evaluatie van de richtlijnen voor duurzaam onkruidbeheer (DOB) op verhardingen. Wageningen, PRI, nota 350. (in Dutch).
Linders, JBHJ, Rikken, MGJ, Bakker J, Poel, P van der. (2002). Uniform System for the Evaluation of Substances 4.0 (USES 4.0). National Institute for Public Health and the Environment (RIVM), Ministry
RIONED. (2005). Rioo 1571-7070. Available at
l in cijfers 2005 – 2006. Ede, Stichting RIONED, ISBN 90 73645 41 7, ISSN
www.rioned.nl/publicaties. (in Dutch).
ooy ML de, Beltman WHJ. (2003). Afspoeling van bestrijdingsmiddelen vanaf verhardingen. H O 12,
Withagen ACL, Horst CLM van der, Beltman WHJ, Kempenaar C. (2004). Resultaten monitoring
ithagen ACL, Horst CLM van der, Beltman WHJ, Dijk CJ van, Kempenaar C. (2005). Afspoeling
R 2
33-35. (in Dutch).
Withagen ACL, Horst CLM van der, Beltman WHJ, Kempenaar C. (2003). Resultaten monitoring af-spoeling glyfosaat in 2002 in 3 proefgemeenten. Wageningen, PRI, nota 230. (in Dutch).
afspoeling glyfosaat en AMPA en waarnemingen van onkruidbeelden in zeven proefgemeenten (voorjaar en najaar 2003). Wageningen, PRI, nota 297. (in Dutch).
W
van bestrijdingsmiddelen en waarnemingen van onkruidbeelden in twee proefgemeenten (2004). Wageningen, PRI, nota 349. (in Dutch).
List of abbreviations
Abbreviation Meaning
AM A Aminomethylphosphonic P acid
a.s. Active Substance
CBS Centraal Bureau voor de Statistiek (Statistics Netherlands)
Ctgb College toelating Gewasbeschermingsmiddelen en Biociden (Board for the Authorisation of Plant Protection Products and Biocides)
DegT50 Degradation time for 50% of the substance, generally in days
DegT50/DissT50 Degradation/dissipation time for 50% of the substance, generally in days DG SANCO Directorate-General for Sanitation and Consumer products
DOB Duurzaam Onkruid Beheer verhardingen (sustainable use of plan protection products on paved areas)
DWS Drinking water standard EFSA European Food Safety Agency EU/EEC/EEC European Union
FOCUS Forum for the coordination of pesticide fate models and their use
g Gram
GAP Good Application Practice
HTB Handboek Toelating Bestrijdingsmiddelen (Handbook for the Authorisation of Plant Protection Products)
Kiwa Quality Assurance Institute, formerly Keuringsinstituut voor Waterleidin-gartikelen
Kom Soil liquid partition normalised to organic matter (dm3/kg)
L Litre
LBOW Landelijk Beleidsoverleg Water (National Water Policy Committee) LNV Ministerie van Landbouw, Natuur en Voeding (Ministry of Agriculture,
Nature and Food quality)
LOD Level of Determination
LOQ Level of Quantification
PEC Predicted Environmental Concentration (mg/L) PNEC Predicted No Effect Concentration (mg/L) PPP Plant Protection Product
RCA Relative Cropped Area
RIVM Rijksinstituut voor Volksgezondheid en Milieu (National Institute for Pu-blic Health and the Environment)
Riza (former) Institute for Inland Water Management and Waste Water Treat-ment (Netherlands)
SUDS Sustainable Urban Drainage Systems (UK) SWS Surface Water Scenario working group
SZW Ministerie van Sociale Zaken en Werkgelegenheid (Ministry of Social Af-fairs and Employment)
UP Uniform Principles (Annex VI of 91/414/EEC) USES Uniform System for the Evaluation Substances
VEWIN Vereniging van Waterleidingbedrijven in Nederland (Association of Dutch ompanies)
Water C
VROM Ministerie van Volkshuisvestin of Housing, Spatial Plannin
g, Ruimtelijke Ordening en Milieu (Ministry g and the Environment)
VWS Ministerie van Volksgezondheid, Welzijn en Sport (Ministry of Health, Welfare and Sport)
WD Waterdienst (Water Service)
WFD (KRW) Kader Richtlijn Water (Water Framework Directive) WWTP Waste Water Treatment Plant
Annex 1 In
Overview of in
cations
th stage and sea-son)
tended uses of glyphosate
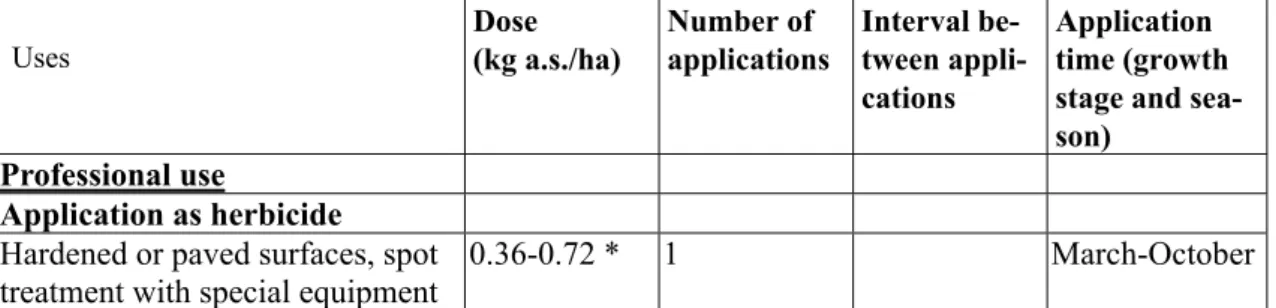
Table A.1 tended uses Roundup Evolution on hard or paved surfaces.
Uses Dose (kg a.s./ha) Number of applications Interval be-tween appli-Application time (grow Profess onal ui se
Application as herbicide Hardened or paved surfaces, spot treatment with special equipment
0.36-0.72 * 1 March-October
*) According to the label until late 2006 a dose of 0.72 – 2.16 was valid. Currently, the dose of 0.72 kg/ha is only possible in exceptional cases.
Annex 2 Physico-chemical properties
Profile physico and chemical properties taken from the List of End Points on which the decision n the listing on Annex I of guideline 91/414/EC was based.
substance glyphosate o
Active Identity
(ISO Common Na e) glyp osate
Active substance m h
Chemical name (IUPAC) N-(phosphonometh l)-glyciney Chemical name (CA) glyc , N-(phosphonomethyl)-in
CIPAC No 284
CAS No 1071-83-6
EEC No (EINECS or ELINCS) 213-997-4 FAO Specification (including year
of publication)
FAO 284 (2001) > 950 g/kg glyphosate; max. 1.3 g/kg formaldehyde; max 1 mg/kg n-nitrosoglyphosate; max 0.2 g/kg insolubles
Minimum purity of the active substance as manufactured (g/kg)
950 g/kg
Identity of relevant impurities (of toxico-logical, environmental and/or other signifi-cance) in the active substance as manufac-tured (g/kg)
Molecular formula C3H8NO5P
Molecular mass (g/mol) 169
Structural formula
5-batch analysis Accountability 99.5-100.0%.
Complies with the FAO specifications.
Physical-chemical properties
Melting point (state purity) Decomposition at about 200 °C; not possible to deter-mine a melting point (99.6%/97.4%)
Boiling point (state purity) NA
Temperature of decomposition Decomposition at about 200 °C (99.6%/97.4%) Appearance (state purity) White odourless solid (99.6%/97.4%)
Relative density (state purity) 1.70 g/cm3 (99.6%)
1.69 g/cm3 (97.4%)
Surface tension 72.7 mN/m (1g/L aqueous solution; 97.4%)
Vapour pressure (in Pa, state temperature) < 1 x 10⁻⁵ Pa at 20 °C (99.6%)
Henry’s law constant (in Pa m3 mol-1) < 2 x 10⁻⁷ Pa m3 mol-1 (99.6%)
Solubility in water (in g/L or mg/L, state, 10 g/L in purified water at 20 °C (99.6%) temperature)
Solubility in organic solvents (in g/L or mg/L, state temperature) Heptane: < 0.6 mg/L Octan-1-ol: < 0.6 mg/L Methanol: 10 mg/L Xylenes: <0.6 mg/L Ethyl acetate: <0.6 mg/L : 0.8 mg/L .6 mg/L Acetonitrile Acetone: <0 1,2-dichloroethane: <0.6 mg/L (20 °C; 97.4%)
Partition co-efficient (log Pow) (state pH and < -1 (pH 2.3; 20 °C; 99.6%)
temperature)
.3
Hydrolytic stability (DT50) (state pH and drolytic conditions at pH 5, 7 and 9 in
d 25 °C temperature)
Stable to hy darkness an
Dissociation constant <2; 2.25; 5.50; 10.34 (20 °C, 99.6%) UV/VIS absorption (max.) (if absor
>290 nm state
ε
ption at wavelength)
< 200 nm (purified water) ε< 10 at wavelengths > 290 nm Photostability (DT ) (aqueous, sunlight,
le (> 200 days)
(natural sunlight, sterile conditions)
50
state pH)
pH 5: 45 days pH 7: stab Quantum yield of direct photo-
transformation in water at λ > 290 nm
Not applicable Photochemical oxidative degradation in air Half-life 1.6 hours
Flammability Not highly flammable (97.4%)
Auto-flammability Does not self-ign
(400 °C) (97
ite below the upper limit of the test .4%)
Oxidative properties No oxidising properties (97.4%)
Explosive properties The chemical structure does not contain any bond groupings known to confer explosive properties.
A
v
F aken Points on which the decision
o /EC
Fate and behaviour in soil
nnex 3 Fate and beha iour
ate and behaviour in the environment t ideline 91/414
from the List of End
n listing on Annex I of gu was based.
Route of degradation
Aerobic Glyphosate trimesium
Mineralization after
dif-n – 4 d) 80. 1 soil: 32.7 (112 d 00 d d), 75 (150 d) soils: 46 (9 d), 74 (150 d) Glyphosate
ferent periods of time (%) 3 soils, 3 differe – 55.3 (28 d); 5.8 t C labels: 46.8 9.3 (112 d); Glyphosate 2 soils: 37 (21 14 34.7 – 41.4 (8 2 soils: 69.7 – 1 (150 d) TMS: 2 ) 1 soil: 79.6 (1 ) Non-extractable residues 3 soils, 3 diffe after different periods of
time (%) – 40.3 (28 d) 16.7 – 33.9 (8 ren ; 4.6 4 d) 2 soils: 5.1 – 8.8 ( il: 13.9 (112 d (100 d) 2 soils: 32 (21 d), 20 (150 d) 0 (150 d) t C labels: 8.5 14 Glyphosate – 13.5 (112 d); 150 d) 2 soils: 26 (9 d), 1 1 so ) 1 soil: 8.4 TMS: Major metabolites a 10 % of applied, nam bove e and/or code, nd Aminomethylpho (AMPA) 26-29%
(only in one study detected), no ation within % of applied (range a
maximum)
sphonic acid Aminomethy after 14 days
lphosphonic acid (AMPA) 15.4% after 21 days further degrad
70 days
Supplemental studies Glyphosate Glyphosate trimesium
Anaerobic degradation Mineralization after different
peri-ods of time (%):
3 soils, 3 different 14C labels: 33.5 – 51.4 (28 d); 1.4 – 5.0 (112 d); 24.2 – 38.6 (84 d)
1 soil, < 1 (120 d)
Non-extractable residues after dif-ferent periods of time (%): 3 soils, 3 different 14C-labels: 12.8 – 29.7 (28d); 0.4 – 12.0 (112 d); 15.1 – 31.6 (84d)
1 soil, 20 (120 d)
Mineralization after different peri-ods of time (%):
Glyphosate: 43 (63 d) TMS: 57 (63d)
Non-extractable residues after dif-ferent periods of time (%): Glyphosate: 24 (63 d) TMS: 16 (63d)