Particulate Matter (BOP II)
activity. European legislation has therefore set standards for particulate matter (PM
10)
and the finer fraction of particulate matter (PM
2.5).
Since the late nineties, levels of PM are continuously monitored in the Netherlands
via the Dutch Air Quality Monitoring Network (DAQMN). Subsequently, annual
calculations are performed in order to produce large scale concentration maps of PM
over the Netherlands (GCN).
Both measurements and calculations had major scientific uncertainties, which
motivated the start of the first Netherlands Research Program on Particulate Matter
(BOP, 2007-2009). BOP provided detailed information about the composition and
origin of PM and resulted in direct policy recommendations in order to further reduce
the PM concentrations in the Netherlands. However, after BOP a number of questions
remained unanswered. This gave rise to the second BOP program (2010-2012). This
report presents the summary of the main results obtained from BOP II.
The Netherlands Research Program on Particulate Matter II (BOP II) is a national
program on PM
2.5and PM
10. It is a framework of cooperation involving the Energy
research Centre of the Netherlands (ECN), the Environment and Safety Division of
the National Institute for Public Health and the Environment (RIVM) and TNO.
Summary of the second Netherlands
Research Program on Particulate Matter
(BOP II)
Colophon
© RIVM 2013
Parts of this publication may be reproduced, provided acknowledgement is given to the 'National Institute for Public Health and the Environment', along with the title and year of publication.
Eric van der Swaluw, Hugo Denier van der Gon (TNO), Carlijn
Hendriks (TNO), Ronald Hoogerbrugge, Jan Matthijsen (PBL), Menno
Keuken (TNO), Martijn Schaap (TNO), Ernie Weijers (ECN), Roy
Wichink Kruit (TNO)
Contact:
Eric van der Swaluw
Centrum Milieukwaliteit
Eric.van.der.Swaluw@rivm.nl
This report is a publication within the framework of the Netherlands Research Program on Particulate Matter II (BOP II) performed by the Energy research Centre of the Netherlands (ECN), the Environment and Safety Division of the National Institute for Public Health and the Environment (RIVM) and TNO. The research of BOP II is supervised by a steering committee which consists of Menno Keuken (TNO), Ronald Hoogerbrugge (RIVM), Ernie Weijers (ECN), Eric van der Swaluw (RIVM), Klaas Krijgsheld (Ministry of Infrastructure and the Environment) and Jan Matthijsen (PBL Netherlands Environmental Assessment Agency).
Abstract
Summary of the second Netherlands Research Program on Particulate Matter (BOP II)
High levels of particulate matter (PM10) in the air are associated with adverse
health effects. In order to take effective policy measures, it is of importance to have a sound knowledge about the origin and composition of particulate matter. The latest findings are now discussed in this summary.
Elevated levels of particulate matter are mainly caused by human activity. From this summary it is concluded that besides carbon, particulate matter mainly consists of nitrogen and sulfur: their contribution to particulate matter appears to be twice as large than previously assumed. About 1/3 of the anthropogenic particulate matter is of Dutch origin and 2/3 originates in foreign countries. For this reason, not only national but also international policy measures are
necessary in order to decrease particulate matter concentrations.
Contribution from traffic to particulate matter is limited
Agriculture and traffic are the main sources of particulate matter emissions in the Netherlands. Focusing on traffic, it is shown that the contribution from local traffic to particulate matter is relatively small with respect to other sources: the concentrations close to busy streets are elevated by approximately 15% with respect to the surrounding. Due to this the options, in order to reduce particulate matter concentrations by local policy measures are limited.
Contribution traffic to soot and heavy metals emissions relevant
Particulate matter includes soot and heavy metals. If one zooms in into these components, traffic is shown to be a major source: the concentrations of soot and heavy metals are locally two to three times higher along busy streets and roads in the Netherlands. Soot comes from the exhaust of cars and heavy metals are released by wear of brake discs and tires. This insight offers the possibility to affect the concentrations of these components by local policy measures. This is especially important because both soot and heavy metal probably have higher negative effects on human health than other components of particulate matter.
The overview in this report, results from the Netherlands Research Program on Particulate Matter II performed by RIVM, TNO and ECN on the initiative of the government (BOP II, 2010-2012). BOP II program is the successor of the first Policy Oriented Research Particulate Matter (BOP), conducted from 2007 till 2009. The BOP programs aim at reducing scientific uncertainties in the measurement and calculation of particulate matter. With these insights, the effects of policy measures on particulate matter concentrations are better estimated.
Rapport in het kort
Samenvatting van het tweede beleidsgerichte onderzoek naar fijn stof in Nederland
Verhoogde fijnstofconcentraties (PM10) in de lucht zijn schadelijk voor de
volksgezondheid. Om effectieve maatregelen te kunnen treffen, is het van belang om inzicht te hebben in de herkomst en de samenstelling van fijn stof. De laatste inzichten zijn nu in een overzicht samengevat.
Verhoogde fijnstofconcentraties worden vooral veroorzaakt door menselijk handelen. Uit het overzicht blijkt dat fijn stof in Nederland naast koolstof, vooral bestaat uit stikstof en zwavel: hun aandeel blijkt de helft groter te zijn dan eerder werd verondersteld. Fijn stof in de lucht afkomstig van menselijk
handelen blijkt voor twee derde afkomstig uit het buitenland, en voor een derde uit Nederland. Om die reden zijn niet alleen nationale maar ook internationale maatregelen nodig om de fijnstofconcentratie te laten afnemen.
Bijdrage verkeer aan fijnstofconcentratie is beperkt
Van de bijdrage aan fijn stof uit Nederland zijn landbouw en verkeer de voornaamste bronnen voor de fijnstofemmissies. Als de bron ‘verkeer’ nader onder de loep wordt genomen, blijkt dat de bijdrage van lokaal verkeer aan fijn stof (PM10) relatief klein is in verhouding tot andere bronnen: de concentraties
zijn rondom drukke straten en wegen ongeveer 15 procent hoger ten opzichte van de omgeving. Hierdoor zijn de mogelijkheden om de fijn stofconcentraties met lokale maatregelen te beïnvloeden beperkt.
Bijdrage verkeer aan uitstoot roet en zware metalen relevanter
Fijn stof bevat ook roet en zware metalen. Als op deze onderdelen wordt
ingezoomd, blijkt verkeer wel een belangrijke bron te zijn: de concentraties roet en zware metalen zijn lokaal langs drukke straten en wegen in Nederland twee tot drie keer hoger. Roet komt uit de uitlaat van auto’s en zware metalen komen vrij door slijtage van remschijven en banden. Dit inzicht biedt de mogelijkheid om de concentraties van deze componenten wel via gemeentelijk beleid te beïnvloeden. Dit is extra van belang omdat zowel het roet als de metalen
waarschijnlijk gevaarlijker zijn voor de gezondheid dan andere componenten van fijn stof.
Het overzicht in deze rapportage , vloeit voort uit onderzoek van het RIVM, TNO en ECN over fijn stof dat op initiatief van de overheid is uitgevoerd (BOP II, 2010-2012). BOP II is het vervolgprogramma van het eerste Beleidsgericht Onderzoeksprogramma Particulate Matter (BOP), uitgevoerd van 2007 tot2009. De BOP-programma’s hebben de wetenschappelijke onzekerheden in het meten en rekenen van fijn stof verkleind. Met deze inzichten kunnen de effecten van fijnstofbeleid beter worden ingeschat.
Contents
Summary—7
1
Introduction—11
2
Secondary inorganic aerosols in the BOP II project—13
2.1
Introduction—13
2.2
Measurements of SIA—15
2.2.1
The old and new LVS system for measuring SIA components—15
2.2.2
Robustness of the new LVS system—16
2.2.3
Conclusions for measurements of SIA—17
2.3
Modelling of SIA—19
2.3.1
Introduction—19
2.3.2
The SIA components: model versus observations—20
2.3.3
The fine and coarse fraction of nitrate—21
2.3.4
Conclusions for modelling of SIA—22
3
Elemental and organic carbon in PM in the BOP II project—23
3.1
Health impact of PM10 and EC in the city of Rotterdam—23
3.1.1
Spatial distribution of EC and PM10 over Rotterdam—23
3.1.2
Health impact of reductions in PM10 and EC in Rotterdam—24
3.1.3
Conclusions—24
3.2
Regional and local contribution to urban background of PM2.5 and PM10—26
3.2.1
Introduction—26
3.2.2
BOP II Measurement campaign in Rotterdam—26
3.2.3
Conclusions—29
3.3
The origin of Carbon using 14C/12C measurements—29
3.3.1
Introduction—29
3.3.2
Results—29
3.3.3
Conclusions—30
4
Source apportionment in the BOP II project—33
4.1
Introduction—33
4.2
Contribution to PM from Dutch and foreign sources—35
4.3
Contributions from individual source sectors to Dutch PM levels—38
4.4
Source apportionment for different PM levels—39
4.5
Conclusions—39
References—41
BOP II publications—41
Summary
Introduction
High levels of particulate matter (PM) in the air are associated with adverse health effects. These elevated levels of particulate matter are mainly caused by human activity. European legislation has therefore set norms for particulate matter (PM10) and the finer fraction of particulate matter (PM2.5).
Since the late nineties, levels of PM are continuously being monitored in the Netherlands via the Dutch Air Quality Monitoring Network (DAQMN).
Subsequently, annual calculations are performed in order to produce large scale concentration maps of PM over the Netherlands (GCN).
Both measurements and calculations had major scientific uncertainties, which motivated the start of the first Netherlands Research Program on Particulate Matter (BOP, 2007-2009). BOP provided detailed information about the composition and origin of PM and resulted in direct policy recommendations in order to further reduce the PM concentrations in the Netherlands.
However, after BOP a number of questions remained unanswered. This gave rise to the second BOP program (2010-2012). This report presents the summary of the main results obtained from BOP II.
Secondary Inorganic Aerosols
0 2 4 6 8 10 12 14 16 18 20 1992 1994 1996 1998 2000 2002 2004 2006 2008 2010 2012 C o n cen tr at io n ( in μ g/ m 3)
The trend of measured secondary inorganic aerosol concentrations over the period 1994-2011. The recent measurements are indicated by a darker shading than the old measurements. Correction factors as derived in BOP II have been applied to the old measurements.
BOP II has shown that measurements and calculations of secondary inorganic aerosols (SIA) as currently performed in the Netherlands are state-of-the-art. As a result this yields realistic values of the actual SIA mass concentrations which are present in the ambient air in the Netherlands. This is important information, because the SIA mass contributes mostly to the total PM concentrations in the Netherlands.
Concentrations of SIA had been underestimated in the past by approximately 50%. In BOP II, correction factors have been derived which allow for long-term trend analysis of this dominant fraction of PM. Therefore, scenario studies of policy measures will yield a much higher accuracy, because the SIA fraction of PM is now better represented.
Elemental and organic carbon in PM
0% 10% 20% 30% 40% 50% 60% 70% 80% 90% 100% EC PM2,5
Regional Urban area Traffic
The measured (relative) contributions of EC and PM2.5 outside the city (regional), within the city (urban area) and at a traffic location. The measurements were performed in Rotterdam and its surroundings.
BOP II has shown that concentrations of PM in the urban background area are dominated by the regional background; urban emissions contribute less than 15%. Contrary, at inner-urban roads with intense road traffic, the
concentrations of elemental carbon (EC), heavy metals from brake and tire wear (copper and zinc), and re-suspended road dust, are a factor of 2-3 elevated against the urban background.
An intensive 1-year measurements campaign was performed in the city of Rotterdam in order to obtain these results. The campaign also included radiocarbon (14C) analysis. From this analysis it was found that biogenic
emissions and combustion of biomass contributes 70% to organic carbon in the Netherlands. The remaining 30% comes from fossil fuel combustion.
Source apportionment
For the effective implementation of national policies on reducing particulate matter concentrations in the Netherlands, it is important to know which part of the particulate matter can be influenced by national policy decisions. In BOP II, calculations were performed to determine which part of the anthropogenic particulate matter in the Netherlands comes from national sources, and which part comes from foreign sources. This source apportionment is a special
calculation tool. These calculations also indicate which economic sector is responsible for the national and international contributions.
The national contribution (15%) and foreign contributions (28%) of particulate matter (PM10) in the Netherlands. The division into types of source sectors is also shown. The non-modeled part (40%) is probably originating more than half from anthropogenic sources. This will evidently contribute to the national and foreign shares.
BOP II has shown, using the above mentioned method, that one-third of the particulate matter concentrations in the Netherlands comes from national sources. Two-third comes from foreign sources. National traffic and agricultural sources contribute most to the particulate matter concentrations in the
Netherlands. The anthropogenic portion of particulate matter in the Netherlands is estimated at 70-80%.
1
Introduction
The second Netherlands Research Programme on Particulate Matter (BOP II) started in the summer of 2010. The BOP programmes in the Netherlands aim at performing policy-oriented research on particulate matter, funded by the Ministry of Infrastructure and the Environment. The BOP II framework was a cooperation between the institutes RIVM, ECN and TNO. This report gives a summary of the main results of BOP II, which can be divided into three parts: 1. Secondary inorganic aerosols (SIA) is a collective term for the nitrate,
ammonium and sulphate aerosols. A good understanding of SIA measurements and modelling is of importance, because the SIA mass contributes significantly (~40%) to the total mass of PM. In the first BOP programme it was found that the measured concentrations of SIA have been underestimated in the past in the Netherlands. Consequently, the modelled SIA concentrations, which used to be in approximate agreement with the (old) measurements, were not representative anymore. BOP II provided an answer on 'how to continue' with both the measurements of SIA and
improved model simulations of the concentrations of SIA. The results on SIA of the BOP II programme is summarized in section 2 of this report.
2. The current EU legislation on ambient air quality and cleaner air for Europe (Directive 2008/50/EC) contains limit values for the concentrations of PM10 and PM2.5, in order to protect human health. However, both PM10 and
PM2.5 are rather generic indicators to monitor the population-based impact
on health. Due to emissions from many natural sources and human activities, there is a large spatial and temporal variability in the chemical composition of PM10 and PM2.5. Consequently, it is difficult to control PM10
and PM2.5 levels by local or national measures. Recent research indicates the
importance of the combustion aerosol as an additional parameter to PM for monitoring the impact of local traffic measures on air quality and health effects. A proxy for the combustion aerosol is Elemental Carbon. BOP II performed research in Elemental Carbon and Organic Carbon (EC/OC) on the local city scale and the more regional scale around Rotterdam. The trend of the PM10 and EC concentrations, and related health impact, have
been assessed in the city of Rotterdam during the period
1985-2008. Furthermore, a new measurement campaign was set up in Rotterdam, in order to provide more insights in the contribution from sources within and outside of cities to the EC/OC concentrations in cities. The results on EC/OC of the BOP II programme are summarized in section 3 of this report.
3. The first BOP programme provided insights into the contribution of several sources to PM in the Netherlands. This was done by means of Source
Apportionment on the large dataset obtained from the BOP measurement
campaign from August 2007 to August 2008. A statistical analysis was performed on this dataset for PM2.5, PM10 and PM10-2.5, which identified seven
source groups. In BOP II a re-analysis is performed with the same statistical analysis; however, this time a more generic analysis is performed by
coupling the PM2.5 and PM10 datasets together. Furthermore, a more detailed
analysis is performed on the mineral dust contribution to PM from the BOP dataset. Using the statistical analysis mentioned above, it is not possible to determine whether the sources are originating from within or outside of the Netherlands. In BOP II this aspect was investigated much more in detail by means of model simulations. The source attribution of PM10 and PM2.5 in the
Netherlands at the source sector level was implemented in the LOTOS-EUROS model, which yields as an output for the distinction between national and foreign sources at a spatial resolution of 7x7 kilometers in the
Netherlands. The results on Source Apportionment of the BOP II programme are summarized in section 4 of this report.
2
Secondary inorganic aerosols in the BOP II project
2.1 Introduction
The ammonium, nitrate and sulphate aerosols are collectively termed as secondary inorganic aerosols (SIA). The precursors for these aerosols are sulphur dioxides, nitrogen oxides and ammonia, which are emitted into the atmosphere by predominantly anthropogenic sources. Chemical reactions in the atmosphere convert these gas components into SIA, which contributes
significantly to the mass of particulate matter (PM) in both PM10 and PM2.5.
During high PM episodes in the Netherlands, when the daily limit for PM10 is
exceeded, the contribution from SIA is in general even further increased (see Figure 1). Hence, there is a keen interest from a policy point of view to have a robust method to correctly measure and model the contribution of SIA to PM.
The Dutch Air Quality Monitoring Network (DAQMN) is measuring SIA
concentrations on a daily basis since 1988. Low volume samplers (LVS) are used to sample filters, which are subsequently collected and analyzed on ammonium, nitrate, sulphate and chloride concentrations. In 2009 this old LVS method (LVS-old) was replaced by the reference low volume sampler SEQ47/50 (Leckel) in the DAQMN.
Main results
Secondary inorganic aerosols are one of the largest fractions in particulate matter. Therefore both measurements and model simulations of these component needs to be well understood. The first BOP programme showed that measurements of secondary inorganic aerosols had underestimated the concentrations in the past. The second BOP programme shows however that current measurements are very robust. Correction factors derived for the old measurements allow for the construction of a continuous time series for the concentrations of secondary inorganic aerosols in the Netherlands from the early nineties up to the present.
Model simulations of the concentrations of secondary inorganic aerosols in the Netherlands used to be roughly in line with the measurements. However, because the measured concentrations of these aerosols were underestimated in the past, the model results needed to be improved as well in order to get model results and measurements in line again. This has successfully been performed in the second BOP programme up to 80% of the sum of the concentration of the secondary inorganic aerosols.
The second BOP programme has shown that the current measurements and model results of the concentrations of secondary inorganic aerosols in the Netherlands are now both robust and state-of-the-art. This means that we now have reliable apparatus in the Netherlands to monitor the contribution of secondary inorganic aerosols to particulate matter. Because the secondary inorganic aerosols is the dominant fraction of particulate matter, results of scenario studies of policy measures on PM concentrations will yield a much higher accuracy.
Figure 1 The composition of PM10 (left panels) and PM2.5 (right panels) during high and low episodes.
In the first BOP programme, it was shown that SIA concentrations have been underestimated during the period when the old LVS samplers were used. In BOP II three issues are addressed in order to strengthen confidence in current SIA measurements with the new LVS method in the Netherlands:
1. Confirmation of the first BOP results, i.e. have the SIA concentrations indeed been systematically underestimated by the old LVS method?
2. Determine correction factors which can be used to convert the old LVS values of SIA concentrations to realistic ambient concentrations of SIA. 3. Check whether the new low volume samplers (Leckel), currently in use, have
any artefacts when measuring SIA concentrations.
The three issues above will be considered more in detail in section 2.2 in this section.
In the first BOP programme, simulation runs were performed for PM and its sub-components with LOTOS-EUROS (LE), a chemical transport model used by TNO,
RIVM, KNMI and PBL. Model simulations are a necessity, since measurements take place at a limited number of locations. In case of good agreement between modelled and measured concentrations at the sites of the monitoring stations in the Netherlands, the maps of modelled SIA concentrations over the Netherlands are considered to correctly represent the SIA concentrations in the ambient air.
Simulations of SIA components with the LE model used to be in rough
agreement with the SIA concentrations as measured at the DAQMN monitoring stations with the old LVS method. Because these measurements underestimated the SIA concentrations, the LE model is not representative anymore with
measurements as performed with the new LVS method. In BOP II the following three issues were addressed:
1. Performance of a comprehensive model evaluation for SIA and its precursors and verify and expand the list of potential model improvements obtained from the first BOP programme.
2. Improve the model description of a selected number of processes in LE. 3. Perform a new assessment of the SIA distribution over the Netherlands.
The three issues above will be considered more in detail in section 2.3 of this section.
2.2 Measurements of SIA
2.2.1 The old and new LVS system for measuring SIA components
Figure 2 Average concentrations during the 2010 measurement campaign.
A new measurement campaign was performed at the DAQMN site Wieringerwerf in 2010 and 2011. A comparison was made between the old and new LVS of DAQMN and the MARGA system. The MARGA system is an instrument measuring the on-line chemical composition of PM10 by ion-chromatography. Figure 2
shows the result of the SIA concentrations as measured during this campaign with the three measurement systems above. One can clearly see the old LVS sampler (LVS) is underestimating the SIA concentrations as compared to the new LVS sampler (Leckel) and the MARGA system. The Leckel and MARGA system give similar values. This confirms the results found in the first BOP programme that the old LVS system has underestimated the SIA concentrations as measured by the DAQMN over the period 1988-2008.
Using the results from the BOP II measurement campaign, correction factors of 1.5-1.6 were derived for the SIA concentrations as measured by the old LVS system. Similar correction factors were also found by an independent study of Hafkenscheid et al. (2009).
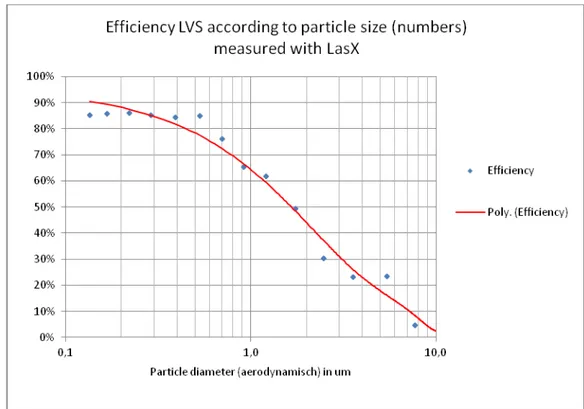
Figure 3 Efficiency of the LVS-system over the range 0.14-11.3μm.
A possible explanation for the underestimation of the old LV system was further explored by determining its efficiency curve as a function of particle diameter. This was done by using the aerosol spectrometer LasX (see Weijers et al., 2012 for details). Figure 3 shows the result of the obtained efficiency curve, from which one can see the cut-off of the old LVS system was not located at PM10 but
closer to PM2. Both the new LVS system and the MARGA system measure at
PM10.
The implication of these results are that SIA measurements from the DAQMN network from before 2009 (with the old LVS system) cannot be used for the calibration of the GCN maps of air quality components (Velders et al., 2012). Therefore, for the GCN2011 maps only data from the new LVS system were used to calibrate the particulate matter GCN maps.
2.2.2 Robustness of the new LVS system
The new monitoring instrument to measure SIA (LVS-Leckel) shows good correspondence with results from measurements as taken by the MARGA instrument (see Figure 2). However, an important question which still needed further investigation was whether or not the LVS-Leckel instrument is affected by artefacts such as chemical reactions taking place on the filter during the sampling period, which in turn might result in loss of PM mass, and hence lower concentrations are measured than actually present in the air.
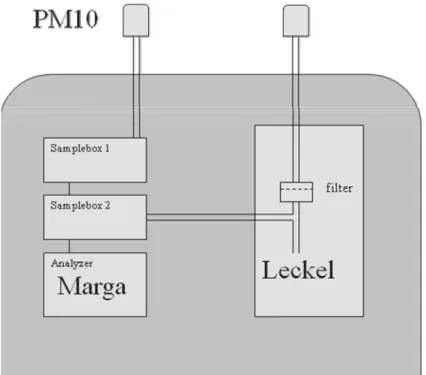
During the BOP II measurement summer campaigns at Wieringerwerf in 2010 and 2011 the above issue was investigated by using the Marga instrument: two
air flows were (hourly) measured, one of them is PM10 outdoor air, the other one
contains the air which went through the LVS-leckel filter (see Figure 4). In such a construction, one can investigate whether mass from the sampled filter is lost by volatilization of nitrate or depletion of chloride. Simultaneously, the
temperature and humidity were measured in order to investigate whether possible mass loss from the filter correlates with certain meteorological circumstances (see Weijers et al., 2012).
Figure 4 Experimental set-up to investigate the robustness of Leckel measurements.
Figure 5 shows an example of the loss of material from the sampled filter for chloride and nitrate. For ammonium and sulfate such losses were not measured. It was found that mass loss for these components occur especially during high temperatures and relatively low humidity. On an annual basis, the loss of nitrate mass is very limited, i.e. below 0.5 μg/m3. However, on a daily basis the nitrate
mass loss can become more substantial, i.e. up to 1.8 μg/m3. This is high
enough that it could in principle influence the number of exceedances of the PM10 daily limit. Whereas the mass loss of nitrate is still relatively small, the loss
of chloride was very substantial: more than 70% mass loss was measured on 6 out of the 21 measurement days. This could have implications for the sea salt contribution to PM10 levels in the Netherlands if based on chloride
concentrations. This observation is used as an additional argument in the decision to base the assessment of sea salt levels on sodium (Hoogerbrugge et al., 2011).
2.2.3 Conclusions for measurements of SIA
robustness correction factor of 1.5-16 for old LVS-system for SIA; cut-off of old LVS system was closer to PM2 than to PM10;
confidence in new Leckel SIA measurements for GCN calibration;
mass loss occurs for chloride and nitrate on sampled filters with a Leckel instrument;
however, the mass loss is low for nitrate when measured over longer periods, which makes the Leckel instrument reliable for the measurements of SIA;
chloride depletion effects are substantial. Therefore these measurements are not suitable for implementing regulation for sea-salt subtraction.
0% 10% 20% 30% 40% 50% 60% 70% 80% 90% 100% 7‐ 7 8‐ 7 9‐ 7 10 ‐7 11 ‐7 12 ‐7 13 ‐7 14 ‐7 15 ‐7 16 ‐7 17 ‐7 18 ‐7 19 ‐7 20 ‐7 21 ‐7 22 ‐7 23 ‐7 24 ‐7 25 ‐7 26 ‐7 27 ‐7 28 ‐7 29 ‐7 30 ‐7 31 ‐7 1‐8 2‐8 3‐8
nitrate
0% 10% 20% 30% 40% 50% 60% 70% 80% 90% 100% 7‐ 7 8‐ 7 9‐ 7 10 ‐7 11 ‐7 12 ‐7 13 ‐7 14 ‐7 15 ‐7 16 ‐7 17 ‐7 18 ‐7 19 ‐7 20 ‐7 21 ‐7 22 ‐7 23 ‐7 24 ‐7 25 ‐7 26 ‐7 27 ‐7 28 ‐7 29 ‐7 30 ‐7 31 ‐7 1‐8 2‐8 3‐8chloride
Figure 5 Mass loss from sampled Leckel filters for nitrate (top panel) and chloride (lower panel) during the BOP II measurement campaign.
2.3 Modelling of SIA
2.3.1 Introduction
The motivation for the model improvements in LOTOS-EUROS were the findings in the first BOP project SIA measurements had been underestimated in the past (see section 2.1 of this report). Although LOTOS-EUROS was comparable with the old LVS measurement system, the comparison with new measurements showed high differences as depicted in Figure 6.
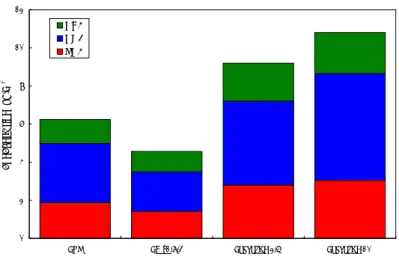
Vredepeel SIA 0 2 4 6 8 10 12 LVS LE v1.7.3 Leckel PM2.5 Leckel PM10 co nc en tr at ion ( µ g /m 3) NH4 NO3 SO4
Figure 6 Comparison of the modelled SIA concentrations (μg/m3) with LOTOS-EUROS against measurements of the old LVS system in the DAQMN as well as the SIA concentration obtained with a Leckel system during BOP in PM2.5 and PM10.
Figure 6 shows the LOTOS-EUROS model needed to be improved in order to get better agreement between current measurements in the DAQMN and the simulation results. Several potential improvements were identified for the SIA components sulphate, nitrate and ammonium as well as their precursors sulphur dioxide, nitrogen dioxide, ammonia and nitric acid. The following improvements were performed in the BOP II project:
1. a better description for the height distribution of the emissions; 2. a new more realistic module for sulphate formation in clouds;
3. implementation of a better dry deposition module both for gases and particles;
4. the inclusion of the compensation point for ammonia;
5. implementation of new thermodynamic equilibrium module ISORROPIA II;
6. a module for the formation of coarse mode of the nitrate aerosol.
The details of the improvements are found in the BOP II report by Wichink Kruit et al. (2012). In the next section the results for all three SIA components are presented separately and compared with observations from the Dutch national Air Quality Monitoring System.
2.3.2 The SIA components: model versus observations
NH
4
0 0.5 1 1.5 2 2.5 ALL LML 131 LML2 35 LML 444 LML5 38 LML6 27 LML9 29 LML9 34 observations LOTOS‐EUROS v1.7.3 LOTOS‐EUROS v1.7.9Figure 7 Yearly average NH4 concentrations for the 7 stations and the average of all stations in the DAQMNN in the Netherlands in 2009.
SO
4
0 0.5 1 1.5 2 2.5 3 3.5 ALL LML1 31 LML2 35 LML 444 LML5 38 LML6 27 LML9 29 LML9 34 observations LOTOS‐EUROS v1.7.3 LOTOS‐EUROS v1.7.9Figure 8 Yearly average SO4 concentrations for the 7 stations and the average of all stations in the NAQMN in the Netherlands in 2009.
NO
3
0 1 2 3 4 5 6 7 ALL LML1 31 LML2 35 LML4 44 LML5 38 LML6 27 LML9 29 LML9 34 observations LOTOS‐EUROS v1.7.3 LOTOS‐EUROS v1.7.9Figure 9 Yearly average NO3 concentrations for the 7 stations and the average of all stations in the DAQMNN in the Netherlands in 2009.
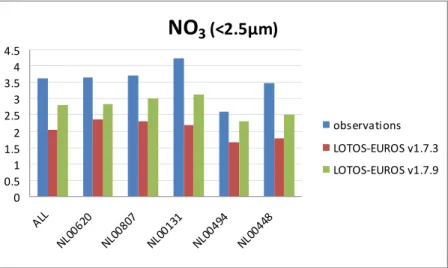
Figures 7-9 show the model results before BOP II (LOTOS-EUROS v1.7.3), and after BOP II (LOTOS-EUROS v1.7.9) for the year 2009 for the components ammonium (Figure 7), sulfate (Figure 8), and nitrate (Figure 9). One can see ammonium and sulfate are very close to the observed values for the
concentration at all DAQMN stations. However, nitrate is still underestimated by 30-40%. The latter is discussed somewhat more in detail in the next subsection.
2.3.3 The fine and coarse fraction of nitrate
In the BOP campaign from 2007-2008 SIA components were measured in both PM2.5 and PM10. In the LE model a distinction can also be made between these
two modes. Because nitrate shows the largest difference between the measured and modelled concentration, it will be illustrative to make a comparison between modelled and measured nitrate concentrations for both PM2.5 and PM10.
Figures 10 and 11 show the result for both fractions. One can see that for both fractions the underestimation is present.
NO
3
(<10μm)
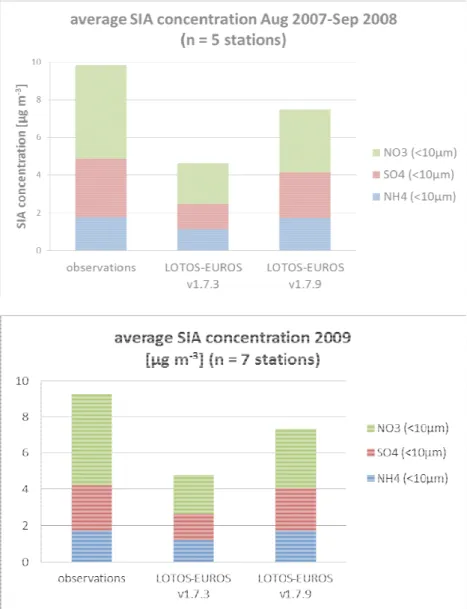
0 1 2 3 4 5 6 ALL NL00 620 NL00 807 NL0 0131 NL00 494 NL0 0448 observations LOTOS‐EUROS v1.7.3 LOTOS‐EUROS v1.7.9Figure 10 Average total NO3 concentration for the 5 stations and the average of all stations (ALL) in the BOP measurement campaign (Aug 2007-Sep 2008) in the Netherlands.
NO
3
(<2.5μm)
0 0.5 1 1.5 2 2.5 3 3.5 4 4.5 ALL NL00 620 NL00 807 NL001 31 NL004 94 NL00 448 observations LOTOS‐EUROS v1.7.3 LOTOS‐EUROS v1.7.9Figure 11 Average fine mode NO3 concentration (<2.5µm) for the 5 stations and the average of all stations (ALL) in the BOP measurement campaign
2.3.4 Conclusions for modelling of SIA
The modelled SIA components in PM10 have a difference of ± 2 µg/m3 or ± 20%
compared to the observations for the year 2009. This difference is mainly due to nitrate. Figure 12 gives a summary of the findings for SIA in PM10 for both the
BOP campaign in 2007-2008 and the DAQMN monitoring for the year 2009.
Figure 12 The results of the BOPII model improvements on the SIA components for the year 2009 (DAQMN stations).
3
Elemental and organic carbon in PM in the BOP II project
3.1 Health impact of PM10 and EC in the city of Rotterdam
Elemental Carbon (EC) contributes only a few micrograms to the total PM10
concentrations. However, it has recently been shown that the health effects of a 1 μg/m3 increase in exposure are greater for EC than for PM
10 (Janssen et al.,
2011). This makes EC a good candidate for an additional indicator for health effects next to PM10 and PM2.5. In this light, BOP II has investigated the health
impact of EC and PM10 in the city of Rotterdam over the period 1985-2008. For
this purpose, the spatial distribution of EC and PM10 concentrations were
calculated over Rotterdam. Subsequently, the exposure and health impact were determined using these calculated EC and PM10 levels.
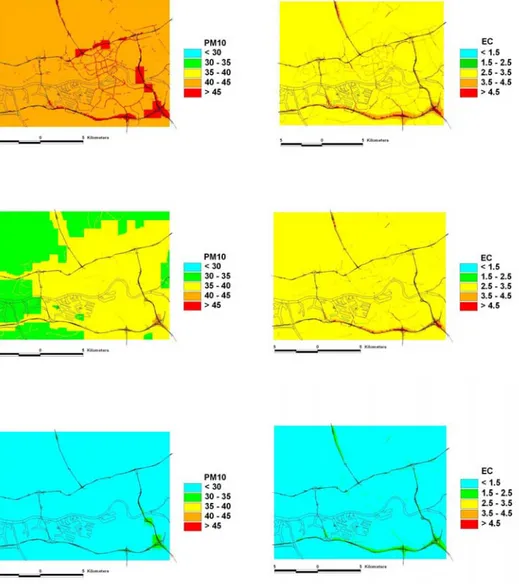
3.1.1 Spatial distribution of EC and PM10 over Rotterdam
Model simulations with the URBIS model were performed for EC and PM10 for the
city of Rotterdam for the years 1985, 1995 and 2008. For details of the set-up of the model simulations see Keuken et al. (2011b).
Figure 13 (left panels) shows the resulting spatial distributions for PM10: the
concentrations in the urban background decreased from 43 μg/m3 in 1985 to
25 μg/m3 in 2008. The elevation at inner-urban roads and motorways is
approximately 20%. The overall decrease over the urban background areas of PM10 is largely attributed to large-scale emission reductions and not to local
exhaust emission of primary PM10.
Main results
The analysis of the health impact due to the decrease in PM10 and EC
concentrations in the city of Rotterdam over the period 1985-2008 show the gain in life is 12-13 months per person. The fact that both PM10 and EC give
similar values for the gain in life confirms that EC is a good candidate for an additional indicator for health effects. In particular, EC is a more adequate indicator to evaluate the health impact of combustion emissions by road traffic.
The contribution of regional, urban and traffic sources to PM2.5 and PM10 in an
urban area was investigated in this study. It was concluded that the urban background of PMis dominated by the regional background and that urban emissions contribute less than 15%. At inner-urban roads with intense road traffic, the concentrations are a factor 2-3 elevated against the urban background for elemental carbon (EC), heavy metals (copper and zinc) from brake and tire wear and re-suspended road dust.
Radiocarbon (14C) analyses confirmed earlier reports that the contribution of
modern or non-fossil carbon sources to OC is around 70% in the Netherlands. The modern or non-fossil carbon contribution to EC is 17%. The latter is somewhat higher than expected and most likely influenced by wildfires in and around the Netherlands during part of the sampling period.
Figure 13 (right panels) show the spatial distributions for EC: the concentrations decreased from 3 μg/m3 in 1985 to 1 μg/m3 in 2008. The elevation at the
inner-urban roads and motorways are up to 100%. Contrary to PM10 the reduction is
especially caused by reduction of exhaust emission by road traffic after 1995.
3.1.2 Health impact of reductions in PM10 and EC in Rotterdam
Using the simulation results of the PM10 and EC concentrations in Rotterdam, a
health impact assessment was performed. This calculation was performed by expressing mortality impacts in life years gained or lost using life table
calculations (Miller & Hurley, 2003). It was shown that the decrease in EC and PM10 concentrations from 1985 to 2008 resulted in a gain in life of on average
respectively 12±8 and 13±6 months per person. The health impacts for PM10
and EC are very similar, while the concentration drops on average were large: 18 µg/m3 for PM10 and 2 μg/m3 for EC.
3.1.3 Conclusions
The analysis of the health impact of the decrease in the concentrations PM10 and
EC in the city of Rotterdam over the period 1985-2008 show that the gain in life is 12-13 months per person. The fact that both PM10 and EC give similar values
for the gain in life confirms that EC is a good candidate for an additional indicator for health effects next to PM10 and PM2.5. More in particular, EC is a
more adequate indicator to evaluate the health impact of traffic measures. It should be stressed however, that EC is likely not causing the health effects but acts as a proxy for the mass of the combustion aerosol, a mixture of elemental carbon particles coated with (toxic) organic components and semi-volatile organic components.
Figure 13 The annual average concentrations of PM10 (in ug/m3) in Rotterdam for 1985 (top left), 1995 (middle left) and 2008 (bottom left). The annual average concentrations of EC (in ug/m3) in Rotterdam for 1985 (top right), 1995 (middle right) and 2008 (bottom right).
3.2 Regional and local contribution to urban background of PM2.5 and PM10
3.2.1 Introduction
The European Air Quality Directive 2008/50/EC prescribes that the future
reduction levels of PM2.5 concentrations will focus on the concentrations in urban
background locations: the target levels for reduction of PM2.5 levels will be based
on the annual averaged concentration levels in cities over the period 2009-2011 (the Average Exposure Indicator (AEI)). The reduction will be 15-20% of the AEI in 2020 with respect to 2010. A review of future PM2.5 legislation will take place
by the EU in 2013.
The BOP II programme has investigated the actual contribution of urban and regional sources to the PM10 and PM2.5 concentrations in urban background
locations. Additionally, elemental and organic carbon (EC/OC) were included in these analysis because of their significant contribution to PM2.5 and their possible
health relevance. Finally, special attention was paid to re-suspension at traffic locations of mineral dust and heavy metals.
3.2.2 BOP II Measurement campaign in Rotterdam
PM samples were collected from November 2010 till November 2011 in
Rotterdam at three monitoring sites in the Netherlands. The street location was in the centre of Rotterdam. The other two locations were north and south of the built-up area of Rotterdam. Depending on the wind direction, these two locations served as either regional or urban background stations. Sampling took place at working days between 7 a.m. and 8 p.m. (for more details of the measurement campaign see Keuken et al., 2012).
3.2.2.1 Results for PM2.5 and PM10
Figure 14 The average annual concentrations of PM2.5 and PM10 and month-to-month variability at regional, urban and street locations in µg.m-3. Also shown are the average deltas for the urban-regional concentrations (∆urban-regional) and for the street-urban concentrations (∆street-urban), including the standard error at 95% confidence level.
Figure 14 and Table 1 show the result of the measurement campaign for PM2.5
increased by respectively 17% for PM2.5 and 19% for PM10, indicating that urban
background levels of PM are dominated by the regional background levels in Rotterdam. At traffic locations, the concentrations are additionally increased by 19% for PM2.5 and 50% for PM10. These values are in good agreement with those
obtained from the national air quality network (DAQMN), except for the relatively large increase at the traffic location. It should be noted, contrary to the 24-hour sampling of DAQMN, sampling in this campaign took place during daytime hours on working days, and consequently, the concentrations are systematically higher compared to DAQMN data
Overall one can see that both PM components are not significantly enhanced by the urban area of Rotterdam. This result will be contrasted with the elements EC and mineral dust discussed below.
Table 1 Overview PM measurements (in units of µg/m3)
PM2.5 PM10
Regional level 18±10 21±9
Urban – region 3±3 4±2
Street – urban 4±6 13±5
3.2.2.2 Results for elemental and organic carbon (EC/OC)
Figure 15 The average annual concentrations of EC and OC and month-to-month variability at regional, urban and street locations in µg.m-3. Also shown are the average deltas for the urban-regional concentrations (∆urban-regional) and for the street-urban concentrations (∆street-urban), including the standard error at 95% confidence level.
Table 2 Overview EC/OC measurements (in units of µg/m3)
EC OC
Regional level 1.5±0.5 4±1
Urban – region 0.3±0.3 0.1±0.4 Street – urban 1.3±0.6 1±0.8
Figure 15 and Table 2 show the result of the measurement campaign for EC and OC. These results show that EC levels are significantly enhanced at street locations by 70% as compared with the urban background. As in the case of PM, the urban background levels for EC and especially OC are dominated by the
regional background levels.
3.2.2.3 Results for mineral dust and re-suspended road dust.
-2.0 -1.0 0.0 1.0 2.0 3.0 4.0 5.0 6.0 7.0 8.0 PM2.5 PM10 PM2.5 PM10 PM2.5 PM10 PM2.5 PM10 PM2.5 PM10
regional urban street ∆ urb-reg ∆ str-urb
an nua l miner al d us t ( g.m -3)
Figure 16 The average annual concentrations of mineral dust in PM2.5 and PM10 and month-to-month variability at regional, urban and street locations in µg.m-3. Also shown are the average deltas for the urban-regional concentrations (∆
urban-regional) and for the street-urban concentrations (∆street-urban), including the
standard error at 95% confidence level.
Figure 16 and Table 3 show the result of the measurement campaign for mineral dust in PM2.5 and PM10. Mineral dust concentrations are estimated using the
concentrations of aluminium and silicon as oxides in the PM samples. The results show that PM10 mineral dust levels are significantly increased at street locations
by ~70% as compared with the urban background. One can also see that the increase of mineral dust in PM is mainly in the coarse fraction (PM2.5-10).
Like for mineral dust, specific trace metals like zinc from tire wear and copper from brake wear were also measured in the same way. It was found that zinc levels were significantly elevated at the traffic location by a factor of two in both PM2.5 and PM10 fraction. Copper was elevated by a factor of three in the coarse
fraction at the traffic location. Values of the measured concentrations are given in Tables 4-6.
Table 3 Overview mineral dust measurements (in units of µg/m3)
PM2.5 PM10
Regional level 0.5±0.4 1.6±1.3
Urban – region 0.2±0.3 0.8±0.7 Street - urban -0.1±0.3 1.7±0.8
Table 4 Overview iron oxide measurements (in units of µg/m3)
PM2.5 PM10
Regional level 0.2±0.1 0.3±0.2
Urban – region 0.1±0.2 0.3±0.1
Street - urban 0±0.3 1.6±0.8
Table 5 Overview zinc measurements (in units of ng/m3)
PM2.5 PM10
Regional level 17±12 23±12
Urban – region 3±3 9±2
Street – urban 14±6 32±22
Table 6 Overview copper measurements (in units of ng/m3)
PM2.5 PM10
Regional level 0.5±0.4 1.6±1.3
Urban – region 0.2±0.4 0.8±1.2
Street - urban 0±0.3 1.7±1.3
3.2.3 Conclusions
The BOP II measurement campaign at Rotterdam has shown that the urban background of PMis dominated by the regional background, and that urban emissions contribute less than 15%. However, at inner-urban roads with intense road traffic, the concentrations are a factor 2-3 elevated against the urban background for elemental carbon (EC), heavy metals (copper and zinc) from brake and tire wear, and re-suspended road dust.
3.3 The origin of Carbon using 14C/12C measurements
3.3.1 Introduction
In May and June 2011 measurements were performed to determine the fraction of ‘modern’ carbon sources (biomass burning and biogenic emissions) and ‘fossil’ carbon sources (fossil fuel combustion) in primary and secondary carbonaceous particles. These measurements were performed over three periods during the BOP II measurement campaign at Rotterdam. The ‘modern’ or non-fossil carbon fraction, f(M), was derived from the radiocarbon signature of the 14C/12C ratios,
which have been measured for OC and EC.
3.3.2 Results
Figure 17 shows the f(M) values for OC and EC at the two sites (Barendrecht (Rotterdam South) and Bergschenhoek (Rotterdam North)), were a distinction has been made between the wind coming from the north or south direction: if the wind direction is north, Barendrecht is influenced by Rotterdam urban emissions (dd=u(N)). If the wind direction is south, Bergschenhoek is influenced by the Rotterdam urban emissions (dd=u(S)).
The fM in Figure 17 is systematically lower for OC influenced by Rotterdam urban
emissions from fossil fuel combustion. Averaged over the two sites, f(M) = 67% for urban OC and 73% for rural OC while for EC these figures are f(M)= 22% for urban EC and 25% for rural EC. These results are in line with expectations: the urban area with fossil fuel combustion emissions introduces a decrease of modern fraction in both OC and EC. However, the influence of urban emissions appears rather limited as the relative change is between -5 and -10% for OC and not more than -5% for EC.
3.3.3 Conclusions
Radiocarbon (14C) analyses confirmed earlier reports that the contribution of
biogenic emissions and combustion of biomass to OC is around 70% in the Netherlands. The remaining 30% is attributed to combustion of fossil fuel.
For EC the contribution from biogenic emissions and biomass burning equals 17%( The value of f(M)=27% results in an effective17% EC contribution from biogenic emissions and biomass burning (see Keuken et al. 2012 for details) ). This value is somewhat higher than expected. The latter is probably caused by a strong draught, which led to several wildfires in and around the Netherlands during the time of the sampling period.
Finally, the distribution of OC concentrations over the Netherlands is reminiscent of the distribution of SIA concentrations over the Netherlands. This is because 70% of the OC is originating from biogenic emissions and biomass burning and hence the emissions are originating mostly from regional background areas. The concentration of OC (~4ug/m3) found at the regional and urban background location is therefore most likely due to the modern part of OC. However, the remaining 30% of the emissions originate from the combustion of fossil fuels. This is in line with the enhancement of 1±0.8 of OC found at the traffic location (Table 2) due to OC emissions from fossil petrol/diesel combustion. It is noted that this enhancement is in the order of the enhancement of EC, which implies that EC and OC emissions by urban road traffic are equivalent
74 64 72 70 0 10 20 30 40 50 60 70 80 90 100 dd=r [S] dd=u [N] dd=r [N] dd=u [S] OC [Barendrecht=S] OC [Bergschenhoek=N] f(M ) r=rural contribution; u=urban contribution
f(M) in OC
27/4 ‐ 4/5 4/5 ‐ 11/5 1/6 ‐ 14/6 average 27 21 22 23 0 5 10 15 20 25 30 35 40 45 50 dd=r [S] dd=u [N] dd=r [N] dd=u [S] EC [Barendrecht=S] EC [Bergschenhoek=N] f(M ) r=rural contribution; u=urban contributionf(M) in EC
27/4 ‐ 4/5 4/5 ‐ 11/5 1/6 ‐ 14/6 averageFigure 17 The f(M) values per site (Barendrecht and Bergschenhoek), period (1 to 3) and wind direction (dd=u(N): north and dd= r(S): south).
4
Source apportionment in the BOP II project
4.1 Introduction
In the first BOP programme an intensive measurement campaign was performed by sampling PM filters at six locations in the Netherlands over the period August 2007 until September 2008. During the campaign filters were collected every second day, on which the mass fractions of sodium, chloride, sulphate, nitrate, ammonium, organic carbon, elemental carbon, silicon and a few heavy metals were determined. At five locations (Vredepeel, Cabauw, Hellendoorn, Schiedam and Rotterdam) this was done for both PM2.5 and PM10, at the other station
(Breda) only for PM10.
The BOP dataset was used to determine the composition of PM in the
Netherlands (Figure 18), and the sources from which PM originates. Whereas the composition of PM was directly measured during the BOP campaign, the source origination was calculated afterwards using a statistical technique known as Positive Matrix Factorization (PMF). In BOP II a re-analysis was performed (Mooibroek et al., 2013), with the same statistical analysis; however this time a more generic analysis has been performed by coupling the datasets of PM2.5 and
PM10 together. The fact that the result is not changed by the different PMF,
means that the analysis is more robust than expected. Figure 19 shows the result for PM2.5.
The PMF analysis yielded six source categories: 1. secondary inorganic aerosols;
2. industrial (metal) activities/incineration; 3. crustal material;
4. traffic and resuspended road dust; 5. sea spray;
6. residual oil combustion.
Main results
To develop adequate policies to attain the PM air quality standards in the Netherlands, it is essential to have information about the origin of the PM mass in the Netherlands. Source apportionment based on measurements of chemical composition is used to gain insight in the contribution from source categories. However, one needs modeling to get information on the
contribution of foreign sources to PM mass in the Netherlands. To this end, a module was implemented in the LOTOS-EUROS model, which calculates the contribution from specific countries to PM concentrations in the Netherlands.
It was found that one-third of the particulate matter concentrations in the Netherlands comes from national sources. Two-third comes from foreign sources. National traffic and agricultural sources contribute most to the particulate matter concentrations in the Netherlands. The anthropogenic portion of particulate matter in the Netherlands is estimated at 70-80%.
These source categories do not distinguish between national and international sources. However, this type of information is important for policy discussions. Therefore, in BOP II a complementary approach was developed for source apportionment, using model simulations instead of measurements. The model simulations were performed with the LOTOS-EUROS model, a chemical transport model, in which a source apportionment module was implemented. This study aimed at providing source apportionment at a level such that one can distinguish
between national and foreign sources. Furthermore, the model allows making a
distinction at the aggregated source sector level.
Model runs with the LE model are performed over the years 2007-2009. For those years, an overview is made of the national and foreign sources and the corresponding distribution over the source categories. A qualitative comparison is made in this summary between results from the BOP II report and the results presented in Buijsman et al. (2005), based on a similar project performed in the late nineties with the OPS model (Visser et al., 2001).
Figure 18 The composition of PM in the Netherlands as determined from the measurement campaign during the first BOP programme.
44 % 15 % 14 % 5 % 9 % 12 %
secondary inorganic aerosol industrial (metal) activities / incineration crustal material
traffic and resuspended road dust sea spray
residual oil combustion
Schiedam 46 % 12 % 8 % 19 % 7 % 8 % Rotterdam 56 % 19 % 11 % 2 % 7 % 5 % Cabauw 56 % 23 % 11 % 2 %7 % 2 % Hellendoorn 65 % 15 % 9 % 3 %6 % 2 % Vredepeel
Figure 19 Source apportionment for PM2.5 at selected locations.
4.2 Contribution to PM from Dutch and foreign sources
The LOTOS-EUROS model has been run for the years 2007-2009 with a source apportionment module which calculates the contribution to PM from Dutch and foreign sources. For both national and foreign sources, the contributions from sectors at source sectors are also calculated. The sources have been condensed to six sectors:
1. industry and energy; 2. road transport; 3. other transport; 4. agriculture;
5. residential and other combustion, and; 6. other sources
These sectors were previously also used by Buisman et al. (2005) as shown in Figure 20. This enables a comparison between the results presented here and the results from Buijsman (2005). It should however be emphasized that the model results as used by Buijsman (2005) are obtained from a different modelling technique than LE. The main result of the LE model simulations are depicted in Figure 21, which shows the source apportionment of PM from LE for the year 2008.
The PM10 mass attributed to Dutch and foreign sources equal respectively 15%
and 28% in this study. Buijsman et al. (2005) obtained similar values from his study with respectively 15% and 30%. Both studies therefore show that 1/3 of
the anthropogenic PM10 is of Dutch origin and the other 2/3 comes from foreign countries.
Figure 21 Origin of PM in the Netherlands for 2008 as calculated with LE.
The modelled PM in LE attributes 70-80% of PM10 and 80-95% of PM2.5 in the
Netherlands to anthropogenic origin. However, the current LE simulations underestimate the measured PM mass by about 40%. For example, the model underestimates nitrate by 1.5 μg/m3 and total carbon by 2.5 μg/m3. If these
contributions are included in the model by further improvements, the source allocation will also change. Furthermore, because a large part of the nitrate and
carbon is manmade, the anthropogenic fractions for PM10 and PM2.5 will also
increase.
4.3 Contributions from individual source sectors to Dutch PM levels
Figure 22 Origin of PM in the Netherlands for 2008 as calculated with LE.
The Dutch and foreign source contribution are calculated in the LE simulations. Simultaneously the source sector contributions are calculated. Figure 22 shows the result for the years 2007-2009 in which the upper panels show the sector contribution from the Dutch sources to PM in the Netherlands, and the lower panels the sector contribution from the foreign sources to PM in the Netherlands. Agriculture and total transport each contribute 42% to the PM fraction in the Netherlands caused by Dutch sources. The other 16% are divided over the other 7 sources (upper left panel). It should be noted that the contribution from agriculture is twice as large as found by Buijsman et al. (2005), which is also the largest difference with this latter study. The other sectors compare relatively good.
As for the sectors from the foreign sources: road transport, other transport, agriculture, power generation and industrial combustion and processes each cause 15-20% of the PM fraction of the foreign contribution. Residential heating is causing another 8% (lower left panel).
4.4 Source apportionment for different PM levels
The new module implemented in LE can also specify the contribution from source sectors and Dutch/foreign contributions for different values of PM
concentrations. In this way one can assess whether the contribution of a source
sector or for example the Dutch contribution to PM levels for different levels of PM concentrations. This application of the new source apportionment module is illustrated in Figure 23.
Figure 23 The contribution from various source sectors (top panel) and Dutch and foreign countries (lower panel) for different PM concentration values
Figure 23 shows changing profiles of the contribution of the different sectors. For example: when the PM concentrations increase, the natural contribution is decreased. Another example is the case of Rotterdam (lower right panel) which show that when the Dutch contribution to PM increases also the PM
concentrations increase.
4.5 Conclusions
The most important conclusions are summarized below:
The results from an earlier assessment (Fijnstof nader bekeken) are confirmed.
For the PM levels in the Netherlands from anthropogenic origin 1/3 is coming from the Netherlands, 2/3 is coming from foreign countries.
The national contribution to PM during high concentration days in the Randstad are relatively higher (40-50%) than the 1/3 mentioned above. Agriculture and traffic are the two most important PM sources in the
Netherlands.
A flexible source apportionment module was implemented in the LE model and applied for policy-oriented research.
References
BOP II publications
Hendriks C., R. Kranenburg, J.J.P. Kuenen, R.N. van Gilswijk, H.A.C. Denier van der Gon and M. Schaap (2012). Establishing the origin of Particulate Matter concentrations in the Netherlands, TNO report. TNO-060-UT-2012-00474
Keuken M.P., A.D. Jedynska, J.S. Henzing and D. de Jonge (2011a). The MAAP as a monitoring instrument for combustion aerosol near road traffic: an explorative study, TNO report. TNO-060-UT-2011-01133
Keuken M.P., P. Zandveld, S. van den Elshout, G. Hoek and N. Janssen (2011b). Health impact assessment of PM10 and EC in the city of Rotterdam (the
Netherlands) in the period 1985-2008, TNO report. TNO-060-UT-2011-01068
Keuken M.P., M. Moerman, M. Voogt, E.P. Weijers, M. Blom, G. Kos, R.Otjes and U. Dusek (2012). Regional and local contribution to PM2.5 and PM10 at the urban
background and a street canyon in Rotterdam, The Netherlands, TNO report. TNO-060-UT-2012-01192
Mooibroek D., E. van der Swaluw and R. Hoogerbrugge (2013). A reanalysis of the BOP dataset: Source apportionment and mineral dust. RIVM Report 680356001
Weijers E.P., G.P.A. Kos, M.J. Blom, R.P. Otjes, M. Schaap and E. van der Swaluw (2012). Measurements of secondary inorganic aerosols in the Netherlands, ECN report. ECN-E—12-003
Wichink Kruit R.J., M. Schaap, F.J. Sauter, E. van der Swaluw and E.Weijers (2012). Improving the understanding of the secondary inorganic aerosol distribution over the Netherlands, TNO report. TNO-060-UT-2012-00334
Other references
Buijsman E. , J.P. Beck, L. van Bree, F.R.Cassee (RIVM), R.B.A. Koelemeijer, J. Matthijsen, R.Thomas and K. Wieringa (2005). Fijnstof nader bekeken. MNP rapport 500037008
Hafkenscheid T.L., R. Hoogerbrugge and G. Stefess (2010). Vergelijkend onderzoek van methoden voor de bepaling van ionen in buitenlucht. Oude methode (LVS) vs. nieuwe methode (PM10) RIVM Report 680708006
Hoogerbrugge, R., P.L Nguyen, J. Wesseling, M. Schaap, R.J. Wichink Kruit, V. Kamphuis, A.M.M. Manders, E.P.Weijers (2011). Assessment of the levels of sea salt in PM10 in the Netherlands. RIVM Report 680704014
Janssen, N.A.H., G. Hoek, M. Lawson-Simic, P. Fischer, L. van Bree, H. van Brink, M.P. Keuken, R. Atkinson, B. Brunekreef, F. Cassee (2011). Black Carbon as an additional indicator of the adverse health effects of combustion particles compared to PM10 and PM2.5 Environ Health Perspect, 119, 1691–1699
Miller B.G. and Hurley J.F. (2003) Life table methods for quantitative impact assessments in chronic mortality. Journal Epidemiology Community Health 57 200-206
Velders G.J.M., J.M.M. Aben, B.A. Jimmink, G.P. Geilenkirchen, E.van der Swaluw, W.J. de Vries, J. Wesseling and M.C. van Zanten (2012). Grootschalige concentratie- en depositiekaarten Nederland Rapportage 2012. RIVM Report 680362002
Visser H., E. Buringh and P.B. van Breugel (2001). Composition and Origin of Airborne Particulate Matter in the Netherlands.RIVM Report 650010029