001946
This is a publication of:
National Institute for Public Health and the Environment
P.O. Box 1 | 3720 BA Bilthoven The Netherlands
www.rivm.nl
March 2011
Greenhouse Gas Emissions in the Netherlands 1990-2009
National Inventory Report 2011
Report 680355004 / 2011
The total greenhouse gas emission from the Netherlands in 2009 decreased by approximately 3% compared to the emission in 2008. This decrease is a result of the economic crisis especially due to the decrease in the industrial production. In 2009, total direct greenhouse gas emissions (excluding emissions from LULUCF – land use, land use change and forestry) in the Netherlands amount to 198.9Tg CO2 eq. This is nearly 7% below the emissions in the base year (213.2 Tg CO2 eq).
This report documents the 2011 Netherlands’ annual submission of its greenhouse gas emission inventory in accordance with the guidelines provided by the United Nations Framework Convention on Climate Change (UNFCCC), the Kyoto Protocol and the European Union’s Greenhouse Gas Monitoring Mechanism.
The report comprises explanations of observed trends in emissi-ons; a description of an assessment of key sources and their uncertainty; documentation of methods, data sources and emission factors applied; and a description of the quality assurance system and the verification activities performed on the data.
C.W.M. van der Maas | P.W.H.G. Coenen | P.J. Zijlema | K. Baas | G. van den Berghe | J.D. te Biesebeek | A.T. Brandt | R.Dröge |G. Geilenkirchen | K.W. van der Hoek | R. te Molder | C.J. Peek | J. Vonk | I. van den Wyngaert
Greenhouse
Gas Emissions
in the
Netherlands
1990 - 2009
National Inventory Report 2011
Greenhouse Gas
Emissions in the
Netherlands 1990-2009
National Inventory Report 2011
C.W.M. van der Maas, P.W.H.G. Coenen1, P.J. Zijlema2, K. Baas3, G. van den Berghe2, J.D. te Biesebeek, A.T. Brandt 4, G. Geilenkirchen5, K.W. van der Hoek, R. te Molder, R.Dröge1, C.J. Peek, J. Vonk, I. van den Wyngaert6.
1 Netherlands Organization for Applied Scientific Research (TNO), P.O. Box 80015, NL-3508 Utrecht 2 NL Agency, PO Box 8242, NL-3503 RE Utrecht
3 Statistics Netherlands (CBS), P.O. Box 24500, NL-2490 HA Den Haag 4 Dutch Emission Authority, P.O.Box 91503, IPC 652, NL-2509 EC Den Haag
5 Netherlands Environmental Assessment Agency, P.O. Box 303 NL -3720 AH Bilthoven 6 Alterra Wageningen UR, P.O. Box 47 NL 6700 AA Wageningen
Greenhouse Gas Emissions in the Netherlands 1990-2009 National Inventory Report 2011
Contacts:
Wim van der Maas (RIVM) (Wim.van.der.Maas@rivm.nl) Peter Zijlema (NIE/NL Agency) (Peter.Zijlema@agentschapnl.nl)
This report has been compilated by order and for the account of the Directorate-General for the Environment, of the Dutch Ministry Infrastructure and the Environment, within the framework of the project Emissieregistratie M/500080/NIR, ‘Netherlands Pollutant Release & Transfer Register’.
Report prepared for submission in accordance with the UN Framework Convention on Climate Change (UNFCCC) and the European Union’s Greenhouse Gas Monitoring Mechanism [Including electronic Excel spreadsheet files containing the Common Reporting Format (CRF) data for 1990 to 2009]
RIVM report 680355004 / 2011
@RIVM 2011
National Institute for Public Health and the Environment (RIVM), PO Box 1, 3720 BA Bilthoven, the Netherlands; Tel: +31-30-274 35 26; Fax: +31-30-278 75 31; www.rivm.nl/en
Acknowledgements
Many colleagues from a number of organisations (CBS, EC-LNV, LEI, Alterra, NL Agency, PBL, RIVM and TNO) have been involved in the annual update of the Netherlands Pollutant Release & Transfer Register (PRTR), also called the Emission Registration (ER) system, which contains emissions data on about 350 pollutants. The emission calculations, including those for greenhouse gas emissi-ons, are performed by members of the ER ‘Task Forces’. This is a major task, since the Netherlands’ inventory contains many detailed emission sources.
Subsequently, the emissions and activity data of the Netherlands’ inventory are converted into the IPCC source categories contained in the CRF files, which form a supplement to this report.
The description of the various sources, the analysis of trends and uncertainty estimates (see Chapters 3 to 8) were made in co-operation with the following emission
experts: Mr Guus van den Berghe (NL Agency) (waste), Mr Klaas van der Hoek (land use), Mr Gerben Geilenkirchen (transport), Mr Romuald te Molder (key sources), Mr Jan Dirk te Biesebeek (solvent and product use), Mrs Rianne Dröge (energy), Mr Kees Peek (fugitive, industrial proces-ses), Mr Kees Baas (CBS) (wastewater handling), Mr Jan Vonk and Mrs Sietske van der Sluis (agriculture). In addition, Mr Bas Guis of CBS has provided pivotal information on CO2 related to energy use. This group has also provided activity data and additional information for the CRF files in cases where these were not included in the data sheets submitted by the ER Task Forces. We are particularly grateful to Mrs Marian Abels, Mr Bert Leekstra, Mr Jack Pesik and Mr Dirk Wever, for their contribution to data processing, chart production and quality control.
We greatly appreciate the contributions of each of these groups and individuals to this National Inventory Report and supplemental CRF files, as well as the external reviewers that provided comments on the draft report.
Rapport in het kort
In 2009 is de totale broeikasgasemissie van Nederland met ongeveer 3 procent gedaald ten opzichte van de emissie in 2008. Deze daling komt vooral door een lagere industriële productie als gevolg van de economische crisis. De totale broeikasgas emissie in 2009 bedraagt 198,9 Teragram (Megaton of miljard kilogram) CO2-equivalenten. Ten opzichte van het basisjaar 1990 (213,2 Tg CO2
-equivalenten) is dit een afname van bijna 7 procent. Beide getallen zijn exclusief de emissies afkomstig uit het soort landgebruik en de verandering daarin, zoals natuurontwik-keling of ontbossing. (land use, land use change and forestry, LULUCF).
Dit blijkt uit een inventarisatie van broeikasgasemissies die het RIVM op verzoek van het ministerie van
Infrastructuur en Milieu (I&M) heeft opgesteld. Met deze inventarisatie voldoet Nederland aan de nationale rapporta geverplichtingen voor 2011 van het
Klimaatverdrag van de Verenigde Naties (UNFCCC), van het Kyoto Protocol en van het Bewakingsmechanisme Broeikasgassen van de Europese Unie.
De inventarisatie bevat verder trendanalyses voor de emissies van broeikasgassen in de periode 1990-2009, een analyse van belangrijkste emissiebronnen (sleutelbron-nen) evenals de onzeker heid in hun emissies. Daarnaast biedt de inventarisatie documentatie van de gebruikte berekeningsmethoden, databronnen en toegepaste emissiefactoren. Ten slotte bevat het een overzicht van het kwaliteitssysteem en de validatie van de emissiecijfers door de Nederlandse Emissieregistratie.
Trefwoorden: broeikasgassen, emissies, trends, methodiek, klimaat
Abstract
The total greenhouse gas emission from the Netherlands in 2009 decreased by approximately 3% compared to the emission in 2008. This decrease is a result of the economic crisis, especially due to the decrease in the industrial production.
In 2009, total direct greenhouse gas emissions (excluding emissions from LULUCF – land use, land use change and forestry) in the Netherlands amount to 198.9Tg CO2 eq. This is nearly 7 % below the emissions in the base year 1990 (213.2 Tg CO2 eq).
This report documents the 2011 Netherlands’ annual submission of its greenhouse gas emission inventory in accordance with the guidelines provided by the United Nations Framework Convention on Climate Change (UNFCCC), the Kyoto Protocol and the European Union’s Greenhouse Gas Monitoring Mechanism.
The report comprises explanations of observed trends in emissions; a description of an assessment of key sources and their uncertainty; documentation of methods, data sources and emission factors applied; and a description of the quality assurance system and the verification activities performed on the data.
Keywords: greenhouse gases, emissions, trends, methodology, climate
Contents
Acknowledgements 3
Rapport in het kort 5
Abstract 5
Samenvatting 11
National Inventory Report (NIR) 11
Ontwikkeling van de broeikasgasemissies 12 Methoden 12
Executive Summary 15
ES1 Background information on greenhouse gas inventories and climate change 15 ES2 Summary of national emission and removal related trends 17
ES3 Overview of source and sink category emission estimates and trends 17 ES4 Other information
Part I: Annual Inventory Report 21
1 Introduction 231.1 Background information on greenhouse gas inventories and climate change 23 1.2 Institutional arrangements for inventory preparation 25
1.3 Inventory preparation 25
1.4 Brief description of methodologies and data sources used 27 1.5 A brief description of the key categories 29
1.6 Information on the QA/QC plan 29 1.7 Evaluating general uncertainty 33
1.8 General assessment of the completeness 36
2 Trends in greenhouse gas emissions 37
2.1 Emission trends for aggregated greenhouse gas emissions 37 2.2 Emission trends by gas 37
2.3 Emission trends specified by source category 40
2.4 Emission trends for indirect greenhouse gases and SO2 41
3 Energy [CRF Sector 1] 43 3.1 Overview of sector 43 3.2 Fuel Combustion [1A] 47
3.3 Fugitive emissions from fuels [1B] 71
4 Industrial processes [CRF Sector 2] 73 4.1 Overview of sector 73
4.2 Mineral products [2A] 76 4.3 Chemical industry [2B] 78 4.4 Metal production [2C] 82
4.5 Food and drink production [2D] 84 4.6 Production of halocarbons and SF6 [2E] 85 4.7 Consumption of halocarbons and SF6 [2F] 86 4.8 Other industrial processes [2G] 88
5 Solvent and other product use [CRF Sector 3] 91 5.1 Overview of sector 91
5.2 Indirect CO2 emissions from Solvents and product use (Paint application [3A], Degreasing and dry cleaning [3B] and Other [3D]) 92
5.3 Miscellaneous N2O emissions from solvents and product use (use of N2O for anaesthesia [3D1] and N2O from aerosol cans [3D3]) 93
6 Agriculture [CRF Sector 4] 95 6.1 Overview of the sector 96 6.2 Enteric fermentation [4A] 98 6.3 Manure management [4B] 101 6.4 Agricultural soils [4D] 105
7 Land use, land use change and forestry [CRF TOR Sec 5] 111 7.1 Overview of sector 111
7.2 Methods 112 7.3 Data 112
7.4 Recalculations 112 7.5 Forest Land [5A] 114 7.6 Cropland [5B] 118 7.7 Grassland [5C] 119 7.8 Wetland [5D] 121 7.9 Settlement [5E] 122 7.10 Other Land [5F] 123 7.11 Other [5G] 124 8 Waste [CRF Sector 6] 125 8.1 Overview of sector 125
8.2 Solid waste disposal on land [6A] 127 8.3 Wastewater handling [6B] 129 8.4 Waste incineration [6C] 131 8.5 Other waste handling [6D] 132
9 Other [CRF Sector 7] 135
10 Recalculations and improvements 137
10.1 Explanation and justification for the recalculations 137 10.2 Implications for emission levels 139
10.3 Implications for emission trends, including time-series consistency 140 10.4 Recalculations, response to the review process and planned improvements 140
Part II: Supplementary Information required under Article 7, Paragraph 1 143
11 KP-LULUCF 145 11.1 General information 145 11.2 Land-related information 146 11.3 Activity-specific information 148 11.4 Article 3.3 154 11.5 Article 3.4 15411.6 Other information 154
11.7 Information relating to Article 6 154
12 Information on accounting of Kyoto units 155 12.1 Background information 155
12.2 Summary of information reported in the SEF tables 155 12.3 Discrepancies and notifications 156
12.4 Publicly accessible information 156
12.5 Calculation of the commitment period reserve (CPR) 157 12.6 KP-LULUCF accounting 157
13 Information on changes in national system 159 14 Information on changes in national registry 161 14.1 Previous Review Recommendations 161
14.2 Changes to national registry 163
15 Information on minimisation of adverse impacts in accordance with Article 3, paragraph 14 165 16 Other information 169
Annexes 171
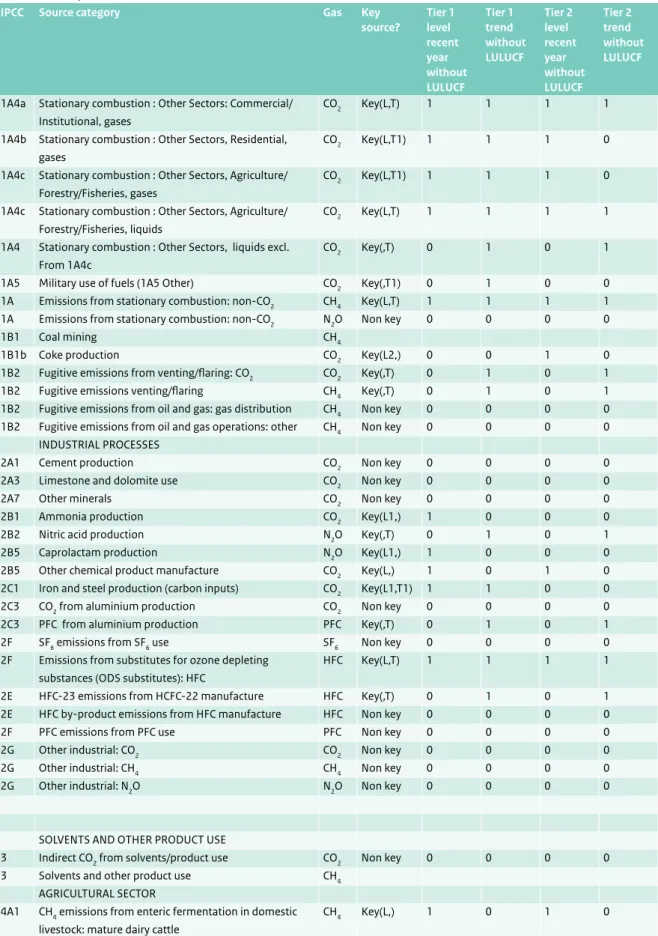
Annex 1 Key sources 173 A1.1 Introduction 173A1.2 Changes in key sources compared to previous submission 179 A1.3 Tier 1 key source and uncertainty assessment 179
A1.4 Tier 2 key source assessment 188
Annex 2 Detailed discussion of methodology and data for estimating CO2 emissions from fossil fuel combustion 201
A2.1 Introduction 201
A2.2 Starting points for the Netherlands list 202 A2.3 The Netherlands list 202
A2.4 Fact sheets 204
A2.5 Using the Netherlands list in national monitoring, European CO2 emissions trade and in the e-MJV National monitoring 204
A2.6 Defining and maintaining the Netherlands list 205
A2.7 Application of the Netherlands standard and source-specific CO2 emission factors in the national emission inventory 206
Annex 3 Other detailed methodological descriptions for individual source or sink categories 207 Annex 4 CO2 Reference Approach and comparison with Sectoral Approach 209
A4.1 Comparison of CO2 emissions 209
A4.2 Causes of differences between the two approaches 209 A4.3 Other country-specific data used in the Reference Approach 211 A4.4 Feedstock component in the CO2 Reference Approach 211
Annex 6 Additional information to be considered as part of the NIR submission 215 A6.1 List of protocols 216
A6.2 Documentation of uncertainties used in IPCC Tier 1 uncertainty assessments and Tier 2 key source identification 217
A6.3 Background documents and uncertainty discussion papers 217
A6.4 Documentation of Quality Assurance and Quality Control for national greenhouse gas inventory compilation and reporting 217
A6.5 Documentation of Changes to the National Registry 217 Registry Information 218
Report R2 222
Annex 7 Tables 6.1 and 6.2 of the IPCC Good Practice guidance 247 Annex 8 Emission Factors and Activity Data Agriculture 251
Annex 9 Chemical compounds, global warming potentials, units and conversion factors 269 A9.1 Chemical compounds 269
A9.2 Global Warming Potentials for selected greenhouse gases 270 A9.3 Units 270
A9.4 Other conversion factors for emissions 270
Annex 10 List of abbreviations 271 Referencs 275
Samenvatting
Het National Inventory Report (NIR) 2011 bevat de rapportage van broeikasgasemissies (CO2, N2O, CH4 en de F-gassen) over de periode 1990 tot en met 2009. De emissiecijfers in de NIR 2011 zijn berekend volgens de protocollen behorend bij het ‘National System’ dat is voorgeschreven in het Kyoto Protocol. In de protocollen zijn de methoden vastgelegd voor zowel het basisjaar (1990 voor CO2, CH4 en N2O en 1995 voor de F-gassen) als voor de emissies in de periode tot en met 2012. De protocollen staan op de website www.broeikasgassen.nl. Alle emissiecijfers en bijbehorende documentatie worden ook, met een vertraging van enkele maanden, gepubli-ceerd op www.emissieregistratie.nl.
National Inventory Report (NIR)
Dit rapport over de Nederlandse inventarisatie van broeikasgasemissies is op verzoek van het ministerie van Infrastructuur en Milieu (IenM) opgesteld om te voldoen aan de nationale rapportageverplichtingen in 2011 van het Klimaatverdrag van de Verenigde Naties (UNFCCC) het Kyoto protocol en het BewakingsmechanismeBroeikasgassen van de Europese Unie. Dit rapport bevat de volgende informatie:
• trendanalyses voor de emissies van broeikasgassen in de periode 1990-2009
• een analyse van zogenaamde sleutelbronnen en de onzekerheid in hun emissies volgens de ‘Tier 1’-metho-diek van de IPCC Good Practice Guidance;
• documentatie van gebruikte berekeningsmethoden, databronnen en toegepaste emissiefactoren;
• een overzicht van het kwaliteitssysteem en de validatie van de emissiecijfers voor de Nederlandse
Emissieregistratie;
• de wijzigingen die in de methoden voor het berekenen van broeikasgasemissies zijn aangebracht na de review van het Nationaal Systeem broeikasgassen vanuit het Klimaatverdrag. Op basis van de methoden die in de NIR en de Nederlandse protocollen broeikasgassen zijn vastgelegd, is de basisjaaremissie bepaald, en de hoeveelheid broeikasgassen die Nederland in de periode 2008 t/m 2012 (volgens het Kyoto Protocol) mag uitstoten.
De NIR bevat ook de informatie die voorgeschreven is volgens artikel 7 van het Kyoto protocol (deel 2 van dit rapport). Hiermee voldoet Nederland aan alle rapportagerichtlijnen van de UNFCCC.
Een losse annex bij dit rapport bevat elektronische data over emissies en activiteitsdata in het zogenaamde Common Reporting Format (CRF), waar door het secretari-aat van het VN-Klimsecretari-aatverdrag om wordt verzocht. In de bijlagen bij dit rapport is ondermeer een overzicht van sleutelbronnen en onzekerheden in de emissie opgenomen.
De NIR gaat niet specifiek in op de invloed van het gevoerde overheidsbeleid met betrekking tot emissies van broeikasgassen; meer informatie hierover is te vinden in de Balans van de Leefomgeving en de vijfde Nationale Communicatie onder het Klimaatverdrag, die eind 2009 is verschenen.
Ontwikkeling van de
broeikasgasemissies
De emissieontwikkeling in Nederland wordt beschreven en toegelicht in dit National Inventory Report (NIR 2011). Figuur ES.1 geeft het emissieverloop over de periode 1990-2009 weer. De totale emissies bedroegen in 2009 circa 198,9 Tg (Mton ofwel miljard kg) CO2 equivalenten en waren daarmee bijna 7 procent lager dan de emissies in het basisjaar (213,2 Tg CO2 eq). De hier gepresenteerde emissies zijn exclusief de emissies van landgebruik en bossen (LULUCF); deze emissies tellen mee vanaf het emissiejaar 2008 onder het Kyoto Protocol. De emissie van CO2 is sinds 1990 met circa 7% toegenomen, terwijl de emissies van de andere broeikasgassen met circa 46% zijn afgenomen ten opzichte van het basisjaar.
In 2009 daalde de CO2- emissie met circa 3 procent ten gevolge van de economische crisis. Ook de emissies van CH4 en N2O daalden in 2009 licht ten opzichte van 2008. De emissies van F- gassen steeg in 2009 met 3 % ten opzichte van 2008 door een relatief hoge toename van de HFC emissies en daling van de PFC en SF6 emissie. De totale emissie van broeikasgassen in 2009 ligt 3% lager dan het 2008 niveau.
Methoden
De methoden die Nederland hanteert voor de berekening van de broeikasgasemissies zijn vastgelegd in protocollen voor de vaststelling van de emissies, te vinden op www. broeikasgassen.nl. De protocollen zijn opgesteld door Agentschap NL, in nauwe samenwerking met deskundigen van de Emissieregistratie (voor wat betreft de beschrijving en documentatie van de berekeningsmethoden). Na vaststelling van deze protocollen in de Stuurgroep EmissieRegistratie (december 2005), zijn de protocollen vastgelegd in een wettelijke regeling door het ministerie van IenM. De methoden maken onderdeel uit van het Nationaal Systeem (artikel 5.1 van het Kyoto Protocol) en zijn bedoeld voor de vaststelling van de emissies in zowel het basisjaar als in de jaren in de budgetperiode. Naar aanleiding van de reviews vanaf het zogenaamde ‘Initial Report’ zijn de methoden en protocollen aangepast. Deze Figuur ES.1 Broeikasgassen: emissieniveaus en emissietrends (excl. LULUCF), 1990-2009.
1990 1994 1998 2002 2006 2010 0 50 100 150 200 250 Tg CO2 eq. F-gases N2O CH4 CO2 (excl. LULUCF)
Box ES.1 Onzekerheden
De emissies van broeikasgassen kunnen niet exact worden gemeten of berekend. Onzekerheden zijn daarom onvermijdelijk. Het PBL schat de onzekerheid in de jaarlijkse totale broeikasgasemissies op circa 3%. Dit is geschat op basis van informatie van emissie-experts in een eenvoudige analyse van de onzekerheid (volgens IPCC Tier 1). De totale uitstoot van broeikasgassen ligt daarmee met 95% betrouw-baarheid tussen de 192 en 204 Tg (Mton). De onzeker-heid in de emissietrend tussen het basisjaar
(1990/1995) en 2009 is geschat op circa 3% ; dat wil zeggen dat de emissietrend in die periode met 95% betrouwbaarheid ligt tussen de -10 tot -4%.
zijn daarmee in overeenstemming met de IPCC Good Practice guidance and Uncertainty Management, dat als belangrijkste voorwaarde is gesteld aan de te hanteren methoden voor de berekening van broeikasgassen. Deze methoden zullen de komende jaren (tot 2014) worden gehanteerd; tenzij er grote veranderingen plaatsvinden in bijvoorbeeld de beschikbaarheid van basisdata of de implementatie van beleidsmaatregelen aanleiding geeft de methoden aan te passen. In deze submissie is een grote methodewijziging doorgevoerd voor de sector landbouw. Het model waarmee de stikstofstromen in de landbouw wordt berekend is verbeterd hetgeen leidde tot een verminderde emissie in 2008 van ammoniak en verhoogde emissies van NOx en lagere emissies van N2O ten opzichte van eerdere submissies.
Executive Summary
ES1 Background information on
greenhouse gas inventories and climate
change
This report documents the 2011 Netherlands’ annual submission of its greenhouse gas emission inventory in accordance with the guidelines provided by the United Nations Framework Convention on Climate Change (UNFCCC), the Kyoto Protocol and the European Union’s Greenhouse Gas Monitoring Mechanism. These guidelines, which also refer to Revised 1996 IPCC Guidelines and IPCC Good Practice guidance and Uncertainty Management reports, provide a format for the definition of source categories and for calculation, documentation and reporting of emissions. The guidelines aim at facilitating verification, technical assessment and expert review of the inventory information by independent Expert Review Teams of the UNFCCC. Therefore, the inventories should be transparent, consistent, comparable, complete and accurate as elaborated in the UNFCCC Guidelines for reporting and be prepared using good practice as described in the IPCC Good Practice Guidance. This National Inventory Report (NIR) 2011, therefore, provides explanations of the trends in greenhouse gas emissions, activity data and (implied) emission factors for the period 1990-2009. It also summarizes descriptions of methods and data sources of Tier 1 assessments of the uncertainty in annual emissions and in emission trends; it presents an
assessment of key sources following the Tier 1 and Tier 2 approaches of the IPCC Good Practice Guidance; and describes Quality Assurance and Quality Control activities. This report provides no specific information on the effectiveness of government policies for reducing greenhouse gas emissions. This information can be found in the annual Environmental Balance (in Dutch: ‘Balans van de leefomgeving’) prepared by the Netherlands Environmental Assessment Agency (PBL) and the 5th National Communication (NC5) prepared by the Government of the Netherlands.
The Common Reporting Format (CRF) spreadsheet files, containing data on emissions, activity data and implied emission factors, accompany this report. The complete set of CRF files as well as the NIR in pdf format can be found at the website www.greenhousegases.nl. From July 2010, the emissions and documentation can also be found on www. prtr.nl.
Climate Convention and Kyoto Protocol
This NIR is prepared as a commitment under the UNFCCC and under the Kyoto Protocol. The NIR also contains a part 2 that focuses on supplementary information under article 7 of the Kyoto protocol. One of the commitments is the development of a National System for greenhouse gas emissions (art. 5.1 of the Protocol). This National System developed in the period 2000-2005 was reviewed by an Expert Review Team of the UNFCCC in April 2007 and
found to be in compliance with the requirements.
Key categories
For identification of the ‘key categories’ according to the IPCC Good Practice approach, national emissions are allocated according to the IPCC potential key category list wherever possible. The IPCC Tier 1 method consists of ranking this list of source category-gas combinations for the contribution to both the national total annual
emissions and the national total trend. The results of these listings are presented in Annex 1: the largest sources, the total of which ads up to 95% of the national total, are 32 sources for annual level assessment and 31 sources for the trend assessment from a total of 72 sources. Both lists can be combined to give an overview of sources, which meet either of these two criteria. Next, the IPCC Tier 2 method for identification of key sources is used, which requires incorporating the uncertainty to each of these sources before ordering the list of shares. The result is a list of 45 source categories from a total of 72 that could be identi-fied as ‘key sources’ according to the definition of the IPCC Good Practice Guidance report. Finally, four key categories are found in the LULUCF sector (Sector 5), after inclusion of 9 LULUCF subcategories in the key category analysis.
Institutional arrangements for inventory preparation The greenhouse gas inventory of the Netherlands is based on the national Pollutant Release & Transfer Register (PRTR). The general process of inventory preparation has existed many years and is organised as a project with an annual cycle. In 2000, an improvement programme was initiated under the lead of SenterNovem (now NL Agency) to transform the general process of the greenhouse gas inventory of the PRTR into a National System, according to the requirements under article 5.1 of the Kyoto Protocol.
The National Institute for Public Health and the
Environment (RIVM) has been contracted by the Ministry of Infrastructure and the Environment (IenM) to compile and maintain the PRTR and to co-ordinate the preparation of the NIR and filling the CRF (see Figure ES.2). NL Agency is designated by law as the National Inventory Entity (NIE) and co-ordinates the overall QA/QC activities and the support/response to the UNFCCC review process.
Monitoring protocols
As part of the improvement programme, the methodolo-gies for calculating greenhouse gas emission in the Netherlands were reassessed and compared with UNFCCC and IPCC requirements. For the key sources and for sinks, the methodologies and processes are elaborated, re-assessed and revised when required. The final revision was done after review of the National System (including the protocols). The present CRF/NIR is based on method-ologies approved during/after the review of the National System and the calculation of the Assigned Amount of the Netherlands. Monitoring protocols describing methodolo-gies, data sources and the rationale for their selection are available at www.greenhousegases.nl.
Organisation of the report
This report is in line with the prescribed NIR format, starting with an introductory Chapter 1, containing background information on the Netherlands’ process of inventory preparation and reporting; key categories and their uncertainties; a description of methods, data sources and emission factors, and a description of the quality assurance system, along with verification activities applied to the data. Chapter 2 provides a summary of trends for aggregated greenhouse gas emissions by gas and by main source. Chapters 3 to 9 present detailed explanations for Figure ES.2 Main elements in the greenhouse gas inventory compilation process.
Data supplier e.g. CBS, companies NL Agency RIVM (and others) Reporting Data supply, basic input data incl. MJV’s IenM, UNFCCC Approval and review ER Data processing CRF NIR Overall co-ordination of QA/QC (improvement)
emissions in different sectors. Chapter 10 presents information on recalculations, improvements and response to issues raised in external reviews on the NIR 2010 and on the draft of the NIR 2011. In addition, the report provides detailed information on key categories, methodologies and other relevant reports in 10 Annexes. In Part II of this report the Supplementary information required under Article 7, Paragraph 1 of the Kyoto Protocol is reported.
ES2 Summary of national emission
and removal related trends
In 2009, total direct greenhouse gas emissions (excluding emissions from LULUCF) in the Netherlands were estimat-ed at 198.9 Tg CO2 equivalents (CO2 eq). This is about 7% below the emissions in the base year (213.2 Tg CO2 eq). In the Netherlands, the base year emissions are 1990 for CO2, CH4 and N2O, and 1995 for fluorinated gases. CO2 emis-sions (excluding LULUCF) increased by about 7% from 1990 to 2009, mainly due to the increase in the emissions in the 1A1a Public Electricity sector and 1A3 Transport sector. CH4 emissions decreased by 34% in 2009 compared to the 1990 level, mainly due to decrease in the waste sector, the Agricultural sector and fugitive emissions in the Energy sector. N2O emissions decreased by 52% in 2009 compared to 1990, mainly due to decrease in emissions from agriculture and from Industrial Processes, which partly compensated emission increases from fossil fuel combustion (mainly from transport). Of the fluorinated greenhouse gases, HFC and PFC emissions decreased in 2009 by about 66% and 91%, respectively, while SF6 emissions decreased by 42%. Total emissions of all
F-gases decreased by about 71% compared to the 1995 level (chosen as the base year).
Between 2008 and 2009, the CO2 emissions decreased (excluding LULUCF) by 5.7 Tg. The other greenhouse gas also showed a decrease in emissions in 2009 except for the HFC’s which showed a small increase (0.2 Tg CO2 eq). Overall the total greenhouse gas emission decreased by about 3 % compared to 2008.
ES3 Overview of source and sink
category emission estimates and trends
Tables ES.1 and ES.2 provide an overview of the emission trends (in CO2 equivalents) per gas and per IPCC source category. The Energy sector (category 1) is by far the largest contributor to national total greenhouse gas emissions. The emissions of this sector increased substantially compared to 1990. In contrast, emissions from the other sectors decreased compared to the base year, the largest being Industrial Processes, Waste and Agriculture. Figure ES.3 An overview of the emission trends for greenhouse gas emissions (excl. LULUCF) 1990-2009.1990 1994 1998 2002 2006 2010 0 50 100 150 200 250 Tg CO2 eq. F-gases N2O CH4 CO2 (excl. LULUCF)
Table ES.1 Summary of emission trend per gas (unit: Tg CO2 equivalents). CO2 incl. LULUCF CO2 excl. LULUCF CH4 N2O HFCs PFCs SF6 Total (incl. LULUCF) Total (excl. LULUCF) Base yr 162.0 159.3 25.5 20.1 6.0 1.9 0.3 215.9 213.2 1990 162.0 159.3 25.5 20.1 4.4 2.3 0.2 214.5 211.9 1991 166.6 164.3 25.9 20.4 3.5 2.2 0.1 218.8 216.4 1992 165.0 162.4 25.5 20.6 4.4 2.0 0.1 217.7 215.1 1993 169.2 166.8 25.2 20.9 5.0 2.1 0.1 222.5 220.1 1994 169.1 166.7 24.4 20.2 6.5 2.0 0.2 222.4 220.0 1995 173.3 170.8 24.1 20.1 6.0 1.9 0.3 225.8 223.2 1996 180.0 177.7 23.5 20.0 7.7 2.2 0.3 233.7 231.3 1997 174.1 171.5 22.4 19.7 8.3 2.3 0.3 227.3 224.7 1998 175.9 173.4 21.7 19.0 9.3 1.8 0.3 228.1 225.5 1999 170.4 167.8 20.7 18.3 4.9 1.5 0.3 216.1 213.5 2000 172.5 170.0 19.7 17.7 3.9 1.6 0.3 215.7 213.2 2001 178.0 175.7 19.3 16.6 1.6 1.5 0.3 217.3 215.0 2002 178.3 176.0 18.4 15.8 1.6 2.2 0.3 216.6 214.3 2003 182.2 179.6 17.8 15.5 1.5 0.6 0.2 218.0 215.4 2004 183.6 181.0 17.6 16.0 1.6 0.3 0.3 219.3 216.8 2005 178.9 176.2 17.2 15.7 1.5 0.3 0.2 213.8 211.1 2006 175.2 172.6 16.8 15.6 1.7 0.3 0.2 209.8 207.1 2007 174.9 172.4 16.8 13.8 1.8 0.3 0.2 207.9 205.4 2008 178.0 175.3 17.0 9.9 1.9 0.3 0.2 207.3 204.6 2009 172.3 169.8 16.9 9.7 2.1 0.2 0.2 201.3 198.9
Table ES.2 Summary of emission trend per source category (unit: Tg CO2 equivalents). 1. Energy 2. Ind. Proc. 3. Solvents 4. Agriculture 5. LULUCF 6. Waste 7. Other Total (incl. LULUCF) Total (excl. LULUCF) Base yr 154.0 23.6 0.5 22.4 2.7 12.8 NA 215.9 213.2 1990 154.0 22.2 0.5 22.4 2.7 12.8 NA 214.5 211.9 1991 159.1 21.2 0.5 22.8 2.3 12.9 NA 218.8 216.4 1992 157.8 21.5 0.4 22.7 2.6 12.7 NA 217.7 215.1 1993 162.5 22.3 0.4 22.4 2.4 12.3 NA 222.5 220.1 1994 161.8 24.3 0.4 21.6 2.4 11.9 NA 222.4 220.0 1995 165.9 23.6 0.4 22.0 2.5 11.3 NA 225.8 223.2 1996 173.6 24.8 0.4 21.6 2.4 10.9 NA 233.7 231.3 1997 166.4 26.1 0.3 21.2 2.6 10.6 NA 227.3 224.7 1998 168.3 26.4 0.4 20.2 2.5 10.2 NA 228.1 225.5 1999 162.6 21.2 0.4 19.9 2.6 9.4 NA 216.1 213.5 2000 164.9 20.3 0.3 18.8 2.6 8.9 NA 215.7 213.2 2001 171.2 16.7 0.3 18.4 2.3 8.4 NA 217.3 215.0 2002 171.6 17.1 0.2 17.4 2.2 8.0 NA 216.6 214.3 2003 175.1 15.5 0.2 17.0 2.6 7.5 NA 218.0 215.4 2004 176.3 16.0 0.2 17.0 2.5 7.2 NA 219.3 216.8 2005 171.2 16.0 0.2 16.9 2.7 6.8 NA 213.8 211.1 2006 167.9 15.8 0.2 16.8 2.7 6.4 NA 209.8 207.1 2007 167.8 14.7 0.2 16.7 2.5 6.1 NA 207.9 205.4 2008 171.8 10.2 0.2 16.7 2.6 5.7 NA 207.3 204.6 2009 166.7 9.9 0.2 16.7 2.5 5.3 NA 201.3 198.9
Sectors showing the largest growth in CO2 equivalent emissions since 1990 are Transport (1A3) and Energy industries (1A1) (+31% and +22%, respectively). Half the marked increase in the public electricity sector of almost 30% between 1990 and 1998 is caused by a shift of cogeneration plants from manufacturing industries to the public electricity and heat production sector due to a change of ownership (joint ventures), simultaneously causing a 15% decrease in industry emissions in the early 1990s (1A2).
ES4 Other information
General uncertainty evaluationThe results of the uncertainty estimation according to the IPCC Tier 1 uncertainty approach are summarised in Annex 1 of this report. The Tier 1 estimation of annual uncertainty in CO2 eq emissions results in an overall uncertainty of 3%, based on calculated uncertainties of 2%, 17%, 44% and 38% for CO2 (excluding LULUCF), CH4, N2O and F-gases, respectively.
However, these figures do not include the correlation between source categories (e.g., cattle numbers for enteric fermentation and animal manure production), or a correction for not-reported sources. Therefore, the actual uncertainty of total annual emissions per compound and of the total will be somewhat higher; it is currently estimated by RIVM at:
CO2 ±3% HFCs ±50%
CH4 ±25% PFCs ±50%
N2O ±50% SF6 ±50%
Total greenhouse gas emissions ±5% Table A1.4 of Annex 1 summarises the estimate of the trend uncertainty 1990-2009 calculated according to the IPCC Tier 1 approach in the IPCC Good Practice Guidance (IPCC, 2001). The result is a trend uncertainty in the total CO2 eq emissions (including LULUCF) for 1990 -2009 (1995 for F-gases) of ±3% points. This means that the decrease in total CO2 eq emissions between 1990 and 2009 (including LULUCF), which is calculated to be 7%, will be between -10% and -4%. Per individual gas, the trend uncertainty in total emissions of CO2, CH4, N2O and the total group of F-gases has been calculated at ±3%, ±9%, ±8% and ±11% points, respectively. More details on the level and trend uncertainty assessment can be found in Annex 7.
Completeness of the national inventory
The Netherlands’ greenhouse gas emission inventory includes all sources identified by the Revised Intergovernmental Panel on Climate Change (IPCC)
Guidelines (IPCC, 1996) – with the exception of the following very minor sources:
• charcoal production (1B2) and use (1A4), due to missing activity data
• CO2 from asphalt roofing (2A5), due to missing activity data
• CO2 from road paving (2A6), due to missing activity data • CH4 from enteric fermentation of poultry (4A9), due to
missing emission factors
• N2O from industrial waste water (6B1), due to negligible amounts
• part of CH4 from industrial waste water (6B1b Sludge), due to negligible amounts
• Precursor emissions ( carbon monoxide (CO), nitrogen oxide (NOx), non-methane volatile organic compounds (NMVOC) and sulphur dioxide (SO2) from Memo item “International bunkers” (international transport) have not been included.
For more information on this issue, see Annex 5.
Methodological changes, recalculations and improvements
This NIR 2011 is based on the envisaged National System of the Netherlands under article 5.1 of the Kyoto Protocol, as developed in the last decade and finalised by December 2005. In past years the results of various improvement actions have been implemented in the methodologies and processes of the preparation of the greenhouse gas inventory of the Netherlands. Compared to the NIR/CRF 2010 and based on the results of the review of the National System by an Expert Review Team of the UNFCCC, some recalculations were undertaken in the last year. The major recalculations are due to the methodical change in the assessment of N2O-emissions from Manure management and agricultural soils (see chapter 6.4). The ratio behind chapter recalculations is documented in the sectoral Chapters 3-8 and chapter 10.
Table ES.3 provides the results of recalculations in the NIR 2011 compared to the NIR 2010.
Improving the QA/QC system
The QA/QC programme (quality assurance / quality control) is up to date and all procedures and processes have been established to meet the National System requirements (as part of the annual activity programme of the Netherlands PRTR). QA/QC activities to be undertaken as part of the National System are described in Chapter 1. Some actions that remained since the NIR 2007 are now being implemented.
Emission trends for indirect greenhouse gases and SO2
Compared to 1990, CO and NMVOC emissions were reduced in 2009 by 58% and 69%, respectively. For SO2 this is 75%, and for NOx, the 2009 emissions are 52% lower
Table ES.3 Differences between NIR 2010 and NIR 2011 due to recalculations (Unit: Tg CO2 eq, F-gases: Gg CO2 eq).
Gas Source 1990 1995 2000 2005 2006 2007 2008
CO2 Incl. LULUCF NIR10 161.9 172.9 172.2 178.2 174.9 174.8 178.1
NIR11 162.0 173.3 172.5 178.9 175.3 174.9 178.0
Diff. 0.0% 0.2% 0.2% 0.4% 0.2% 0.0% -0.1%
CO2 Excl. LULUCF NIR10 159.3 170.6 169.7 175.8 172.5 172.3 175.7
NIR11 159.3 170.8 170.0 176.2 172.6 172.4 175.3 Diff. 0.0% 0.1% 0.1% 0.2% 0.0% 0.1% -0.2% CH4 NIR10 25.5 24.1 19.8 17.2 16.8 16.8 17.1 NIR11 25.5 24.1 19.7 17.2 16.8 16.8 17.0 Diff. 0.0% 0.0% -0.1% -0.2% -0.2% -0.1% -0.3% N2O NIR10 20.2 21.5 19.3 17.3 17.1 15.4 11.8 NIR11 20.1 20.1 17.7 15.7 15.6 13.8 9.9 Diff. -0.7% -6.8% -8.4% -9.3% -9.1% -10.2% -15.4% PFCs Gg NIR10 2264 1938 1582 266 257 323 251 NIR11 2264 1938 1582 266 257 323 251 Diff. 0.0% 0.0% 0.0% 0.0% 0.0% 0.0% 0.0% HFCs Gg NIR10 4432 6018 3891 1514 1728 1845 1923 NIR11 4432 6018 3886 1494 1704 1820 1889 Diff. 0.0% 0.0% -0.1% -1.3% -1.4% -1.4% -1.8% SF6 Gg NIR10 217 301 318 254 217 226 224 NIR11 217 301 315 239 198 192 186 Diff. 0.0% 0.0% -0.8% -6.1% -8.4% -14.9% -17.0%
Total Excl. LULUCF NIR10 212.0 224.5 214.6 212.4 208.7 206.9 206.9
NIR11 211.9 223.2 213.2 211.1 207.1 205.4 204.6
Diff. -0.1% -0.6% -0.7% -0.6% -0.7% -0.7% -1.1%
Total Incl. LULUCF NIR10 214.6 226.9 217.1 214.7 211.1 209.5 209.4
NIR11 214.5 225.8 215.7 213.8 209.8 207.9 207.3
Diff. -0.1% -0.6% -0.6% -0.4% -0.6% -0.7% -1.0%
Note: Base year values as applied for the calculation of the Assigned Amount are indicated in bold.
than the 1990 level. Table ES.4 provides trend data. In contrast to the direct greenhouse gases, emissions of precursors from road transport have not been corrected for fuel sales according to the national energy statistics but are directly related to transport statistics on vehicle-km, which differs to some extent from the IPCC approach. Recalculations (due to changes in methodologies and or allocation) have only been performed for 1990, 1995, 2000 and 2005 to 2009 for all sources.
Table ES.4 Emission trends for indirect greenhouse gases and SO2 (Unit: Gg).
1990 1995 2000 2005 2006 2007 2008 2009
NOx 541 460 387 332 317 296 286 265
CO 1,142 903 749 661 654 636 641 593
NMVOC 460 326 231 174 165 162 162 152
Part I: Annual
1.1 Background information on
greenhouse gas inventories and climate
change
1.1.1 Background information on climate
change
The United Nations Framework Convention on Climate Change (UNFCCC) was ratified by the Netherlands in 1994 and entered into force in March of 1994. One of the commitments made by the ratifying Parties under the Convention is to develop, publish and regularly update national emission inventories of greenhouse gases. This national inventory report, together with the CRF, represent the 2010 national emission inventory of greenhouse gases under the UNFCCC (part 1 of this report) and under its Kyoto Protocol (part 2 of this report).
Geographical coverage
The reported emissions include those that have to be allocated to the legal territory of the Netherlands. This includes a 12-mile zone from the coastline and also inland water bodies. It excludes Aruba and the Netherlands Antilles, which are self-governing dependencies of the Royal Kingdom of the Netherlands. Emissions from offshore oil and gas production on the Dutch part of the continental shelf are included.
1.1.2 Background information on greenhouse
gas inventory
As indicated, this national inventory report documents the 2010 Greenhouse Gas Emission Inventory for the
Netherlands under the UNFCCC and under the Kyoto Protocol. The estimates provided in the report are consistent with the Intergovernmental Panel on Climate Change (IPCC) 1996 Guidelines for National Greenhouse Gas Inventories (IPCC, 1997) and the IPCC Good Practice Guidance and Uncertainty Management in National Greenhouse Gas Inventories (IPCC, 2001) and the IPCC Good Practice Guidance for Land Use, Land Use Change and Forestry (LULUCF). The methodologies applied for the Netherlands’ inventory are also consistent with the guidelines under the Kyoto Protocol and the European Union’s Greenhouse Gas Monitoring Mechanism.
For detailed assessments of the extent to which changes in emissions are due to the implementation of policy measures, see the Environmental Balance (PBL, 2009; in Dutch), the Fourth and the Fifth Netherlands National Communication under the United Nations Framework Convention on Climate Change (VROM, 2005 resp. VROM, 2009) and the Netherlands Report on Demonstrable Progress under Article 3.2 of the Kyoto Protocol (VROM, 2006b).
1
The Netherlands also reports emissions under other international agreements, such as the United Nations Economic Commission for Europe (UNECE), Convention on Long Range Transboundary Air Pollutants (CLRTAP) and the EU National Emission Ceilings (NEC) Directive. All these estimates are provided by the Netherlands Pollutant Release and Transfer Register (PRTR), which is compiled by a special project in which various organisations co-opera-te. The greenhouse gas inventory and the PRTR share the same underlying data, which ensures consistency between the inventories and other internationally reported data. Several institutes are involved in the process of compiling the greenhouse gas inventory (see also Section 1.3).
The National Inventory Report (NIR) covers the six direct greenhouse gases included in the Kyoto Protocol: carbon dioxide (CO2), methane (CH4), nitrous oxide (N2O), hydrofluorocarbons (HFCs), perfluorocarbons (PFCs) and sulphur hexafluoride (SF6) (the F-gases).Emissions of the following indirect greenhouse gases are also reported: nitrogen oxides (NOx), carbon monoxide (CO), and non-methane volatile organic compounds (NMVOC), as well as sulphur oxides (SOx).
This report provides explanations of the trends in greenhouse gas emissions per gas and per sector for the 1990–2009 period and summarises descriptions of methods and data sources for: (a) Tier 1 assessments of the uncertainty in annual emissions and in emission trends; (b) key source assessments following the Tier 1 and Tier 2 approaches of the IPCC Good Practice Guidance (IPCC, 2001); (c) quality assurance and quality control (QA/ QC) activities.
Under the National System under Article 5.1 of the Kyoto Protocol, methodologies were established (and documen-ted) in monitoring protocols. These protocols are annually re-assessed and revised, if needed, for example, based on recommendations of UN reviews. The monitoring protocols and the general description of the National System are available on the website www.greenhousega-ses.nl. The emissions reported in the NIR 2011 are based on these methodologies, which have been incorporated in the National System for greenhouse gases. The emissions and all the documentation are, with a delay of some months, also available on the website www.prtr.nl
In 2007, the UN performed an in-country initial review under the Kyoto Protocol. The review concluded that the Netherlands National System has been established in accordance with the guidelines and that it meets the requirements. This was confirmed also by later reviews such as the centralised review of the NIR 2009. The National System has remained unchanged with the exception of an organisational change per 1 January 2010. At that date, co-ordination of the above mentioned PRTR
project (emissions registration project) shifted from PBL (Netherlands Environmental Assessment Agency) to RIVM (National Institute for Public Health and the Environment). In 2010 arrangements were made to ensure the quality of the products of the PRTR project in the new setting.
The structure of this report complies with the format required by the UNFCCC (FCCC/SBSTA/2004/8 and the latest annotated outline of the National Inventory report including reporting elements under the Kyoto protocol). It also includes supplementary information under Article 7 of the Kyoto Protocol. Part 2 gives an overview of this information.
Greenhouse gas emissions presented in this report are given in gigagrammes (Gg) and teragrammes (Tg). Global warming potential (GWP) weighed emissions of the greenhouse gases are also provided (in CO2 equivalents), using the GWP values in accordance with the Kyoto Protocol and using the IPCC GWP for a time horizon of 100 years. The GWP of each individual greenhouse gas is provided individually in Annex 9.
The Common Reporting Format (CRF) spreadsheet files accompany this report as electronic annexes (the CRF files are included in the zip file for this submission:
NETHERLANDS-2011-v1.1.zip. The CRF files contain detailed information on greenhouse gas emissions, activity data and (implied) emission factors specified by sector, source category and greenhouse gas. The complete set of CRF files as well as this report comprise the National Inventory Report (NIR) and are published on the website www.greenhousegases.nl.
Other information, such as protocols of the methods used to estimate emissions, is also available on this website. Section 10 provides details on the extent to which the CRF data files for 1990–2009 have been completed and on improvements made since the last submission.
1.1.3 Background information on
supplemen-tary information under Article 7 of the Kyoto
Protocol
Part 2 of this report provides the supplementary informa-tion under (Article 7) of the Kyoto Protocol. As the Netherlands have not elected any activities to include under Article 3, paragraph 4 of the Kyoto Protocol, the supplementary information on KP LULUCF deals with activities under Article 3, paragraph 3. Information on the accounting of Kyoto units is also provided in the SEF file SEF_NL_2011_1_11-41-30 10-1-2011.xls and in the SIAR report file SIAR Reports 2010-NL v1.0.xls.
1.2 Institutional arrangements for
inventory preparation
1.2.1 Overview of institutional arrangements
for the inventory preparation
The Ministry of Infrastructure and Environment (IenM) has overall responsibility for climate change policy issues including the preparation of the inventory.
In August 2004, IenM assigned SenterNovem (now NL agency) executive tasks bearing on the National Inventory Entity (NIE), the single national entity required under the Kyoto Protocol. In December 2005, NL Agency was designated by law as the NIE. In addition to coordinating the establishment and maintenance of a National System, the tasks of NL Agency include overall coordination of improved QA/QC activities as part of the National System and coordination of the support/response to the UNFCCC review process. The National System is described in more detail in the (Fourth and Fifth National Communication (VROM 2006b, 2009).
Since 1 January 2010, RIVM has been assigned by IenM to take over the role of PBL as coordinating institute for compiling and maintaining the pollutants emission register/inventory (PRTR system), containing about 350 pollutants including the greenhouse gases. The PRTR project system is used as basis for the NIR and for filling the CRF. After the general elections in the Netherlands in 2010, the responsibilities of the former VROM moved to the restructured Ministry of Infrastructure and
Environment (IenM).
1.2.2 Overview of inventory planning
The Dutch Pollutant Release & Transfer Register (PRTR) has been in operation in the Netherlands since 1974. This system encompasses data collection, data processing and registering and reporting emission data for some 350 policy-relevant compounds and compound groups that are present in air, water and soil. The emission data is produced in an annual (project) cycle (MNP, 2006). This system is also the basis for the national greenhouse gas inventory. The overall coordination of the PRTR was outsourced by (IenM) to the RIVM.
The main objective of the PRTR is to produce an annual set of unequivocal emission data that is up-to-date, com-plete, transparent, comparable, consistent and accurate. In addition to RIVM, various external agencies contribute to the PRTR by performing calculations or submitting activity data. These include: CBS (Statistics Netherlands), PBL, TNO (Netherlands Organisation for Applied Scientific
Research), NL Agency, Centre for Water Management, Deltares and several institutes related to the Wageningen University and Research Centre (WUR).
Responsibility for reporting
The NIR part 1 is prepared by RIVM as part of the PRTR project. Most institutes involved in the PRTR also contrib-ute to the NIR (including CBS and TNO). In addition, NL Agency is involved in its role as NIE. NL Agency also prepares the NIR part 2 and takes care of integration and submission to the UNFCCC in its role as NIE. Submission to the UNFCCC only takes place after approval by IenM.
1.2.3 Overview of the inventory preparation
and management under Article 7 of the Kyoto
Protocol
Following the annotated outline, the supplementary information under Article 2 of the Kyoto Protocol is reported together in the NIR part 2. This information is prepared by NL Agency, using information from various other involved organisations, such as the NEa (Dutch Emissions Authority), the WUR and the Ministry (IenM).
1.3 Inventory preparation
1.3.1 GHG and KP-LULUCF inventory
The primary process of preparing the greenhouse gas inventory in the Netherlands is summarised in Figure 1.1. This process includes three major steps that are described in more detail in the following Sections.
For the KP-LULUCF inventory, the inventory preparation is combined with the work for reporting LULUCF by the unit Wettelijke Onderzoekstaken Natuur & Milieu, part of Wageningen UR. The project team LULUCF oversees data management, the preparation of the reports for land-use, land-use change and forestry and the QA/QC activities and decides on further improvements.
1.3.2 Data collection processing and storage
Various data suppliers provide the basic input data for emission estimates. The most important data sources for greenhouse gas emissions include:
1.3.2.1 Statistical data
Statistical data are provided under various (not specifically greenhouse-gas related) obligations and legal arrange-ments. These include national statistics from Statistics Netherlands (CBS) and a number of other sources of data on sinks, water and waste. The provision of relevant data for greenhouse gases is guaranteed through covenants
and an Order in Decree, the latter of which is under preparation by IenM. For greenhouse gases, relevant agreements with respect to waste management are in place with CBS and NL Agency. An agreement with the Ministry of Agriculture, Nature and Food Quality (LNV, now ELI) and related institutions was established in 2005.
1.3.2.2 Data from individual companies
Data from individual companies are provided in the form of annual environmental reports (MJVs). A large number of companies have a legal obligation to submit an MJV that includes – in addition to other pertinent information – emission data validated by the competent authorities (usually provincial and occasionally local authorities that also issue permits to these companies). A number of companies with large combustion plants are also required to report information under the BEES/A regulation. Some companies provide data voluntarily within the framework of environmental covenants. The data in these MJVs are used for verifying the calculated CO2 emissions from energy statistics for industry, energy sector and refineries. If reports from major industries contain plant-specific information on activity data and emission factors of sufficient quality and transparency, this data is used in the calculation of CO2 emission estimates for specific sectors. The MJVs from individual companies provide essential information for calculating the emissions of substances other than CO2. The calculations of industrial process emissions of non-CO2 greenhouse gases (e.g., N2O, HFC-23 and PFCs released as by-products) are mainly based on information from these MJVs, as are the calculated emissions from precursor gases (CO, NOx, NMVOC) and
SO2. As reported in previous NIRs, only those MJVs with high-quality and transparent data are used as a basis for calculating total source emissions in the Netherlands.
1.3.2.3 Additional greenhouse-gas-related data Additional greenhouse gas related data are provided by other institutes and consultants that are specifically contracted to provide information on sectors not suffi-ciently covered by the above-mentioned data sources. For greenhouse gases, contracts and financial arrangements are made (by PBL/RIVM) with, for example, various agricultural institutes and TNO. In addition, NL Agency contracts out various tasks to consultants (such as collecting information on F-gas emissions from cooling and product use, on improvement actions). During 2004, the Ministry of LNV (now ELI) also issued contracts to a number of agricultural institutes; these consisted of, in particular, contracts for developing a monitoring system and protocols for the LULUCF data set. Based on a written agreement between LNV and PBL/RIVM, these activities are also part of the PRTR.
1.3.2.4 Processing and storage
Data processing and storage are coordinated by PBL/ RIVM; these processes consist most notably of the elaboration of emission estimates and data preparation in the emissions data base and the CRF. The emission data are stored in a central database, thereby satisfying – in an efficient and effective manner – national and international criteria on emission reporting. The past two years, RIVM automated the process to fill the CRF with emissions from the central database.
Figure 1.1 Main elements in the greenhouse gas inventory process.
Data supplier e.g.
CBS, companies
NL AgencyRIVM
(and others)
Reporting Data supply, basic input data incl. MJV’sIenM, UNFCCC
Approval and reviewER
Data processing CRF NIRThe actual emission calculations and estimates that are made using the input data are implemented in five task forces, each dealing with specific sectors:
• energy, industry and waste (combustion, process emissions, waste handling)
• agriculture (agriculture, sinks)
• consumers and services (non-industrial use of products) • transport (including bunker emissions)
• water (less relevant for greenhouse gas emissions).
The task forces consist of experts from several institutes. In 2009, in addition to the PBL, these included TNO, CBS, Centre for Water Management, Deltares, FO-I (the Facilitating Organisation for Industry, which co-ordinates annual environmental reporting by companies), NL Agency (Waste Management division) and two agricultural research institutes: Alterra (sinks) and LEI. The task forces are responsible for assessing emission estimates based on the input data and emission factors provided. RIVM commissioned TNO to assist compiling the CRF.
1.3.3 Reporting, QA/QC, archiving and overall
co-ordination
The NIR is prepared by PBL with input from the experts in the relevant PRTR task forces and from NL Agency. This step includes documentation and archiving. IenM formally approves the NIR before it is submitted; in some cases approval follows consultation with other ministries. NL Agency is responsible for co-ordinating QA/QC and responses to the EU and for providing additional informa-tion requested by the UNFCCC after the NIR and the CRF have been submitted. NL Agency is also responsible (in collaboration with RIVM) for co-ordinating the submission of supporting data to the UNFCCC review process.
For KP-LULUCF, consistency with the values submitted for the Convention was assured by using the same base data and calculation structure. The data, as required in the KP LULUCF CRF, tables are derived from these base data using specific calculations.. The data and calculations were thus subject to the same QA/QC (Van den Wyngaert et al., 2009). The full time series since 1990 was calculated explicitly for re/afforestation and deforestation.
The calculated values were entered in the CRF reporting system at Alterra, and checked by the LULUCF sectoral expert. They were then exported as an XML file and sent to the Dutch inventory, which imported the data in the CRF database for all sectors and again checked. Any strange or incomplete values were reported to the LULUCF sectoral expert, checked and if necessary corrected.
Verification with other international statistics was performed only with FAO. The area of forest is
systemati-cally lower for FAO. This may be due to a different methodology. For discussion on different outcomes of different estimates of forest cover in the Netherlands, see Nabuurs et al., 2005. The net increase in forest area in the FAO statistics is higher that reported for KP-LULUCF, and this may indicate that the 1990 estimate may be low in the FAO statistics. These values indicate a conservative estimate of the net forest increase in the Netherlands.
The mean C stock in Dutch forests (used as emission factor for deforestation under the KP) is slightly higher in the UNFCCC estimates than in the FAO estimates. Considering that different conversion factors were used, the estimates are close, while the difference has the tendency to increase. If this continues for the 2010 FAO estimate, this will be reason for investigation. These values indicate a conservative estimate of C emissions from deforestation.
No values from FAO are available on young forests. FAO statistics also provide no information on fires or distur-bances for the Kyoto period, since at the national level these statistics are no longer kept. The same accounts for EFFIS, the European Forest Fires Information System.
1.4 Brief description of methodologies
and data sources used
1.4.1 GHG inventory
1.4.1.1 Methodologies
Table 1.1 provides an overview of the methods used to estimate greenhouse gas emissions. Monitoring protocols, documenting the methodologies and data sources used in the greenhouse gas inventory of the Netherlands as well as other key documents are listed in Annex 6. The protocols were elaborated, together with relevant experts and institutes, as part of the monitoring improvement program.
Explanation of notation keys used:
• Method applied: D, IPCC default; RA, reference approach; T, IPCC Tier; C, CORINAIR; CS, country-speci-fic; M, model.
• Emission factor used: D, IPCC default; C, CORINAIR; CS, country-specific; PS, plant-specific; M, model.
• Other keys: NA, not applicable, NO, not occurring; NE, not estimated; IE, included elsewhere.
All key documents are electronically available in PDF format at www.greenhousegases.nl. The monitoring protocols describe methodologies, data sources and QA/ QC procedures for estimating greenhouse gas emissions in the Netherlands. The sector-specific chapters provide a
brief description per key source of the methodologies applied for estimating the emissions.
1.4.1.2 Data sources
The monitoring protocols provide detailed information on activity data used for the inventory. In general, the following primary data sources supply the annual activity data used in the emission calculations:
• fossil fuel data: (1) national energy statistics from CBS (National Energy Statistics; Energy Monitor); (2) natural gas and diesel consumption in the agricultural sector (Agricultural Economics Institute, LEI)
• residential bio fuel data: (1) annual survey of residential woodstove and fireplace penetration from the Association for Comfortable Living (Vereniging Comfortabel Wonen); (2) a 1996survey on wood consumption by owners of residential woodstoves and fireplaces from the Stove and Stack Association
(Vereniging van Haard en Rookkanaal, VHR); (3) a 2007 survey on wood consumption by CBS. These data were used to develop a new calculation method for the emissions from woodstoves which is implemented in this submission.
• transport statistics: monthly statistics for traffic and transportation
• industrial production statistics: (1) annual inventory reports from individual companies; (2) national statistics • consumption of HFCs: annual reports from the
accoun-tancy firm PriceWaterhouseCoopers (only HFC data are used due to inconsistencies for PFCs and SF6 with emissions reported elsewhere)
• consumption/emissions of PFCs and SF6: reported by individual firms
• anaesthetic gas: data provided by Linde gas (former HoekLoos), the major supplier of this gas
• spray cans containing N2O: the Dutch Association of Table 1.1 CRF Summary Table 3 with methods and emission factors applied.
GREENHOUSE GAS SOURCE
AND SINK CATEGORIES Method applied Emission CO2 CH4 N2O HFCs PFCs SF6 factor Method applied Emission factor Method applied Emission factor Method applied Emission factor Method applied Emission factor Method applied Emission factor
1. Energy CS,D,T2,T3 CS,D,PS CS,D,T1,T1b,T2,T3 CS,D,PS CS,T1,T2 CS,D A. Fuel Combustion CS,D,T2 CS,D CS,T1,T2,T3 CS,D CS,T1,T2 CS,D 1. Energy Industries T2 CS T2 CS T1,T2 CS,D 2. Manufacturing Industries and Construction T2 CS T2 CS T1,T2 CS,D 3. Transport CS,T2 CS CS,T2,T3 CS,D CS,T2 CS,D 4. Other Sectors T2 CS T1,T2 CS,D T1 D 5. Other D,T2 D CS,T2 CS CS,T2 CS
B. Fugitive Emissions from
Fuels CS,D,T2,T3 CS,D,PS D,T1b,T2,T3 CS,D,PS NA NA
1. Solid Fuels T2 CS T1b D NA NA
2. Oil and Natural Gas CS,D,T2,T3 CS,D,PS D,T1b,T2,T3 CS,D,PS NA NA
2. Industrial Processes CS,T1,T1a,T1b,T2 CS,D,PS CS,T1,T2 CS,D CS,T2 CS,PS T2 PS CS,T2 PS CS,T2 D,PS
A. Mineral Products CS CS,D,PS NA NA NA NA
B. Chemical Industry CS,T1,T1b CS,D,PS T1,T2 D T2 PS NA NA NA NA NA NA
C. Metal Production T1a,T2 CS NA NA NA NA NA NA NA NA
D. Other Production T1b CS E. Production of Halocarbons and SF6 T2 PS NA NA NA NA F. Consumption of Halocarbons and SF6 CS,T2 PS CS,T2 D,PS G. Other CS,T1b CS,D CS CS CS CS NA NA NA NA NA NA
3. Solvent and Other
Product Use CS CS CS CS 4. Agriculture T1,T2 CS,D T1,T1b,T2,T3 CS,D A. Enteric Fermentation T1,T2 CS,D B. Manure Management T2 CS T2 D C. Rice Cultivation NA NA D. Agricultural Soils NA NA T1,T1b,T2,T3 CS,D E. Prescribed Burning of Savannas NA NA NA NA F. Field Burning of Agricultural Residues NA NA NA NA G. Other NA NA NA NA
5. Land Use, Land-Use
Change and Forestry CS,D CS,D NA NA NA NA
A. Forest Land CS CS NA NA NA NA B. Cropland NA NA NA NA C. Grassland NA NA NA NA D. Wetlands NA NA NA NA E. Settlements NA NA NA NA F. Other Land NA NA NA NA G. Other D D NA NA NA NA 6. Waste NA NA T2 CS T2 CS,D
A. Solid Waste Disposal on
Land NA NA T2 CS
B. Waste-water Handling T2 CS T2 D
C. Waste Incineration NA NA NA NA NA NA
D. Other NA NA T2 CS T2 CS
7. Other (as specified in
Aerosol Producers (Nederlandse Aerosol Vereniging, NAV)
• animal numbers: from the CBS/LEI agricultural database, plus data from the annual agricultural census
• manure production and handling: from the CBS/LEI national statistics
• fertiliser statistics: from the LEI agricultural statistics • forest and wood statistics: (1) harvest data: FAO harvest
statistics; (2) stem-volume, annual growth and fellings: Dirkse et al, (2003) (3) carbon balance: National Forestry Inventory data based on two inventories: HOSP (1988-1992) and MFV (2001-2005)
• land use and land use change: based on digitised and digital topographical maps of 1990 and 2004 (Kramer et al, 2009)
• area of organic soils: De Vries (2004) • soil maps: De Groot et al. (2005)
• waste production and handling: Working Group on Waste Registration (WAR), NL Agency and CBS • CH4 recovery from landfills: Association of Waste
Handling Companies (VVAV).
Many recent statistics are available on the internet at CBS’s statistical website Statline and in the CBS/PBL environmen-tal data compendium. However, it should be noted that the units and definitions used for domestic purposes on those websites occasionally differ from those used in this report (for instance: temperature corrected CO2 emissions versus actual emissions in this report; in other cases, emissions are presented with or without the inclusion of organic CO2 and with or without LULUCF sinks and sources).
1.4.2 KP-LULUCF inventory
1.4.2.1 Methodologies
The methods used to estimate data on sinks and sources as well as the units of land subject to Article 3.3 afforesta-tion, reforestation and deforestation are additional to the methods used for LULUCF. The methodology of the Netherlands to assess the emission from LULUCF is based on a wall-to-wall approach for the estimation of area per category of land use. For the wall-to-wall map overlay approach were used harmonised and validated digital topographical maps of 1990 and 2004 (Kramer et al., 2009). The result was a national scale land use and land use change matrix.
To distinguish between mineral soils and peat soils, an overlay was made between two Basic Nature maps and the Dutch Soil Map (de Vries et al., 2004). The result is a map with national coverage that identifies for each pixel whether it was subject to RA or D between 1990 and 2004, and whether it is located on a mineral or on an organic soil.
1.4.2.2 Data sources
The changes in land use are based on comparing detailed maps that best represent land use in 1990 and 2004. Both datasets on land use were especially developed to support the temporal and spatial development in land use and especially designed to support policy in the field of nature conservation. Changes after 2004 have been obtained by linear extrapolation.
1.5 A brief description of the key
categories
1.5.1 GHG inventory
The analysis of key sources is performed in accordance with the IPCC Good Practice Guidance (IPCC, 2001). To facilitate the identification of key sources, the contribution of source categories to emissions per gas are classified based on the IPCC potential key source list as presented in Table 7.1, Chapter 7 of the Good Practice Guidance. A detailed description of the key source analysis is provided in Annex 1 of this report. Per sector, the key sources are also listed in the first Section of each of Chapters 3 to 8.
Compared to the key source analysis for the NIR 2010, eight new key categories are identified:
• 1A3 Mobile combustion: road vehicles (N2O) • 1A5 Military use of fuels (1A5 Other) (CO2) • 1B1b Coke production (CO2)
• 2B5 Caprolactam production (N2O)
• 4A1 CH4 emissions from enteric fermentation in domestic livestock: mature dairy cattle • 4A1 CH4 emissions from enteric fermentation in
domestic livestock: young cattle
• 4A8 CH4 emissions from enteric fermentation in domestic livestock: swine
• 6b Emissions from wastewater handling (N2O)
This is due to
• Use of new emission data (2009) • Subdivision of category 4A1
• In this submission we set the cumulative emission threshold for the key sources at less than 91 % whereas in former submissions a threshold of less or equal to 90 % was used.
1.5.2 KP-LULUCF inventory
Deforestation is larger than the smallest key category in the Tier 1 key source analysis (excluding LULUCF). With -537 Gg CO2 the annual contribution of re/afforestation